1
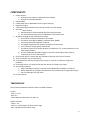
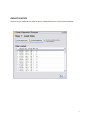
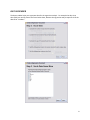
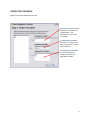
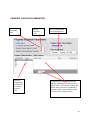
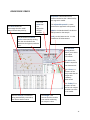
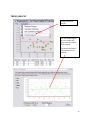
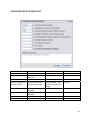
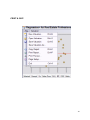
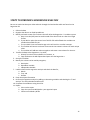
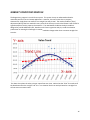
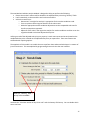
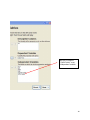
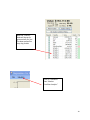
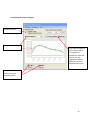
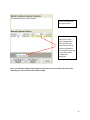
USER MANUAL
1 Automated Valuation Technologies, Inc. Regression +
For Real Estate Professionals© with Market Conditions Module This Regression + software program and this user’s manual have been created by Automated Valuation Technologies, Inc. (AVT). The purpose of AVT is to fill the voids in appraisal practice that result from the rapidly changing appraisal environment. Appraisers often find themselves engaged in new activities which require the use of technology that has not yet been created. This is both unfortunate and unacceptable. It is unfortunate because appraisers are not fully effective in carrying out their duties. It is unacceptable because it compromises the vital role appraisers perform in the safekeeping of their country’s greatest wealth: real property. It is AVT’s mission to provide the technologies real estate appraisers require to fulfill their duties. AVT operates under the belief that there is no substitute for the “Neighborhood Appraiser.” Their knowledge of the local market is unique and cannot be duplicated by remote computer analysis. These local appraisers are hardworking and dependable. Without question, these gritty individuals will carry out their duties as long as they have the knowledge and tools to do so. This manual and the accompanying software program are copyrighted. © 2008 Automated Valuation Technologies, Inc. 215 Ellis Avenue, Maryville, TN 37804 2 TABLE OF CONTENTS Contents PURPOSE ................................................................................................................................................. 4 SYSTEM REQUIREMENTS ........................................................................................................................ 4 LOADING THE PROGRAM AND GETTING STARTED ................................................................................ 4 COMPONENTS ........................................................................................................................................ 6 THRESHHOLDS .................................................................................................................................... 6 IMPORT FEATURE ............................................................................................................................... 7 DATA SCRUBBER ................................................................................................................................. 8 DEFINE THE VARIABLES ...................................................................................................................... 9 PROPERTY VALUATION PARAMETERS .............................................................................................. 10 REGRESSION SCREEN ........................................................................................................................ 11 TREND ANALYSIS .............................................................................................................................. 12 CONFIDENCE RATING CHECK LIST .................................................................................................... 13 PRINT & SAVE ................................................................................................................................... 14 STEPS TO PERFORM A REGRESSION ANALYSIS ..................................................................................... 15 MARKET CONDITIONS MODULE ........................................................................................................... 16 3 PURPOSE The purpose of the Regression + application is to provide all of the power of a regression analysis in a format that is simple and easy for real estate professionals to use. This product is suitable for variety of uses; by most any real estate professional. A partial list of users includes; appraisers, sales agents, review appraisers, mortgage lenders, investors, etc. A partial list of uses includes extracting adjustments, and predicting; sales price, rent rates, capitalization rates, etc. The purpose of this user manual is to provide instructions on using the Regression + application. It is not intended to teach the theory of Regression Analysis or how to best perform such an analysis. I strongly recommend that the user take the regression seminar that is associated with the Regression + application©. E‐mail [email protected] for information on where to find information on this class. The book, A Guide to Appraisal Valuation Modeling by Linne´, Kane, and Dell is a recommended source for information on the various methodologies associated with regression analysis. SYSTEM REQUIREMENTS + Regression has the following system requirements: • Windows XP Service Pack 1 (or newer) or Windows Vista. • Microsoft .NET Framework version 2.0 or 3.0 • 10MB Hard Drive space available. For importing Excel 2007 documents (.xlsx, .xlsm), Microsoft Office 2007 (or Excel 2007) is required to be installed. However, Microsoft Excel 2007 is not required for importing Excel 2003 or earlier documents (.xls). This program will not run across a network; it must be loaded on your “C:\” drive. LOADING THE PROGRAM AND GETTING STARTED You’re CD contains the following important things: 1. The User Manual 2. Regression Loader 3. The Case Studies a. An Excel file with the sample data 4. A three part tutorial video 5. Microsoft .NET Framework version 3.0 Loading the Regression Plus program 4 This program requires that either .NET Framework 2.0 or 3.0 is installed on your computer. To verify that you have one of these versions loaded go to “Control Panel” them “Add/remove programs”. If you do not see Microsoft .NET Framework v 2.0 or 3.0 listed then load from the Regression CD. It is OK to have other versions of .NET Framework loaded in addition to the version 2.0 or 3.0. 1. Insert the CD into your computer. 2. Open the file “Regression+.msi” that is on the CD. 3. Once you are in the “Setup Wizard” click on the “Next” button. 4. When the License Agreement becomes visible read it carefully. If you agree to the terms of this agreement then choose “I Agree” and click on the “Next” button. 5. Select the installation folder. If possible use the default folder which is shown by default. Do not load on a network drive (although multiple users may save their documents to a folder on a network drive). 6. The “Disk Cost” button allows you to compare the size of the program to the installation location chosen. Most users will not need to use this feature. 7. For most users select “Everyone”. 8. When asked to confirm installation click the “Next” button. 9. There will be a new shortcut on your desktop. Click it to open the Regression Plus program. 5 COMPONENTS 1. Import Feature a. Directly from an open or unopened Excel workbook b. Directly from the MS Clipboard 2. Data Scrubber 3. Loader (loads the scrubbed data into the regress analysis) 4. Regression Engine 5. A chart depicting the absolute error of each record in the data sample 6. A remove outlier feature a. Records can be marked excluding them from being removed b. Any removed record can easily be added back in by a simple click. 7. Numerous readings to help complete the analysis a. The number of records considered in the sample b. A measure of the Market Model’s predictive power (MMP) c. The R‐squared and the adjusted R‐squared d. The weight assigned to each property component by the model e. The P‐factor for each property characteristic f. A measure of each of the subject property’s components “fit” to the components in the data sample (SubDev). g. A means of identifying sudden changes in the value relationship of each property component by “Error Trend Analysis”. 8. Perform Step‐wise or reverse step‐wise methods of analysis at the click of a button. 9. Select or deselect any record on the fly. 10. A comprehensive checklist to help the user assign an “Over‐all” confidence rating to the prediction. 11. A comment box for any narrative that the user wishes to include in the report. 12. The Valuation Settings a. Where the subject property’s characteristics (independent variables) are entered. b. Add or deduct for any property characteristics not considered in the regression analysis. c. Set the rounding of the final value. 13. Print the Report. THRESHHOLDS The P‐Values and Subject Deviation values are coded as follows: P‐Value Green <= 0.15 Red > 0.3 Yellow otherwise (between 0.15 and 0.3). Subject Deviation Green < 1.0 Yellow >= 1.0 but within the observation range Red = Outside the observation range 6 IMPORT FEATURE The data may be loaded directly from an open or closed MS Excel File or from the MS Clipboard. 7 DATA SCRUBBER The data scrubber helps you to prepare data for the regression analysis. For example the days since sales (DSS) are used in place of the actual sales dates, because the regression analysis requires all of the data to be “numbers”. 8 DEFINE THE VARIABLES Identify and choose the data to be used. Descriptive Columns contain information like address or listing number. This information is not used in the analysis. The Dependent Variable is what you are trying to find, such as sales price, rent per square foot, etc. The Independent Variables are the things that are analyzed to predict the dependent variable. 9 PROPERTY VALUATION PARAMETERS Set the Rounding here Set the Decimals here Set the effective date of the appraisal here Enter the Independent Variables for the subject property here List Other Factors here that should be added or subtracted from the regression analysis value. This includes anything that effects value, but was not considered in the data sample. Some examples might be view, lot size, closing costs etc. 10 REGRESSION SCREEN This Chart shows the percentage that the model missed actual sales price by. This is the value that the regression analysis predicts.
Use this button to remove outliers automatically starting with the record where the model has the highest predictive error. R‐squared is the amount of the market’s behavior that is described by the regression model. The adjusted R‐squared is a more conservative approach to R‐squared. MMP is the Market Model’s Predictive ability based on the sample. CoD is on the latest version. It is the Coefficient of Disbursement. Check to exempt a record from being automatically removed by the remove outlier button The Weight is the amount that the variable was used in calculating the subject’s value. The Valuation Setting button allows you to enter the subject information. The Value is the model’s output for the characteristic. The P‐factor is a measure of the likely hood that the output was randomly determined. The “SubDev” is a measure of how similar each subject variable is to those in the model. 11 TREND ANALYSIS To begin the trend analysis The user should explore why any straight line varies more than about 5% in accuracy. The polynomial feature may help explore the situation. 12 CONFIDENCE RATING CHECK LIST Parameter Observations Data Sample Quality MMP Similarity of subject to the sales (SubDev) Model’s Outputs Weight Applied Adjusted R‐squared P‐factors Acceptable 20‐29 Determined by appraiser 80‐84% Yellows, reds are OK if they have low weight Determined by appraiser Determined by appraiser 60‐69% Mostly yellow, no Reds Good 30‐49 Excellent 50+ 85‐90% Greens & Yellows, reds are OK if they have low weight. 91%+ All Green 70‐79% Mostly Green, no Reds 80%+ All Greens 13 PRINT & SAVE 14 STEPS TO PERFORM A REGRESSION ANALYSIS Be sure to watch the three part video and work through the Case Studies which are found on the Regression CD. 1. Collect the data 2. Organize the data on an Excel Spreadsheet 3. Identify and make a note of the columns that will utilize the Regression +’s scrubber system. a. Days since sale (DSS) must be used instead of the date of sale as a date is an illegal format. b. If your MLS or other data source has a field for full and half baths the scrubber can combine these fields for you. c. The year built is best converted to age as this will result in a smaller intercept. d. The scrubber will convert a column of text entries into numeric columns for each unique value. e. The scrubber will add two columns together and create a new column for the sum. 4. Transfer the data to the Regression + by either; a. Directly from the Excel workbook via a browser, or b. Copy the data to the MS Clipboard and paste into the Regression +. 5. Set up the scrubber 6. Identify the columns to be used by categories; a. Descriptive b. Dependent Variable c. Independent Variable 7. Load the data into the regression analysis and check the data for; a. Blanks b. Text, and c. Outliers 8. Enter the subject information 9. Perform the regression analysis by adding or subtracting variables and checking the “Trend Analysis” for each individual variable used. 10. Complete the confidence rating check‐list. 11. Report a. Print out the report b. Copy the report into MS Word or your appraisal report c. Convert to an Adobe .pdf file 15 MARKET CONDITIONS MODULE The Regression+ program is a multi‐linear system. This system is easy to understand and works reasonably well for most real estate applications. However, there are times when a property characteristic simply does not conform to a straight line analysis tool. The market condition (Time) adjustment (MCTA) that has resulted in many areas of the Country since the Real Estate Crash of 2007 is a good example of such a property characteristic. The new Market Conditions Analysis module is designed to provide additional tools, based on multi‐linear regression analysis, to aid the valuation professional in meeting the challenges in market condition changes other than a constant straight‐line scenario. The above chart plots the sales price per square foot over time. Notice that the “blue” line tends to fit the data better than the straight “red” line. In a situation like this an analysis based on a straight line will not return accurate results. 16 The new Market Condition Analysis Module is designed to help you perform the following: • Extract the market’s value trend line based on the adjusted sales price using “dummy” fields. • It will create both, a value trend line and a volume trend line. • Utilize the trend line to: o Determine if a straight line analysis is appropriate for the market condition trend. o Form an opinion concerning the direction of the value trend. o Make the appropriate market condition adjustments to the comparable sales used in the direct comparison approach. o Adjust all of the sales in the regression analysis for market conditions and then rerun the regression based on the time adjusted sales prices. Utilizing a trend of the adjusted sales price per property is much more accurate that one based on the unadjusted sales price or based on the adjusted sales price per square foot. These new features are enhanced with reporting options. The emphasis of this module is to enable the user to perform these advanced techniques in a matter of just a few minutes. This accomplished by programming these tools into the user interface. Note the “Dummy” field set up in the scrubber. Use both the “Calculate number of days since sale” and the Dummy field set up. You can decide which one to use later. 17 Be sure to load the “(MCA Fields)” as an independent variable. 18 Note the “Dummy” fields will be set up automatically for you. The data spanned six sixty day periods. Click on “Valuation” then “Market Condition Analysis” 19 The following interface will appear. Choose the Chart Choose the best fit Click here to adjust all of the sales used in the regression analysis for time and then re‐run the regression analysis based on the time adjusted sales price. Print a report or copy directly into your appraisal report. 20 Enter comments for the report here. Enter the date and sales price of the sales comparables here and the time adjustments will be returned (based on the trend line) for use in the direct sales comparison approach. Note: For illustrative purposes the example used here has an extreme fall in the value trend; hopefully your real trend line will not fall so steeply. 21