1
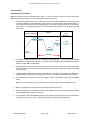
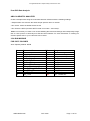
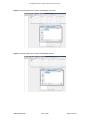
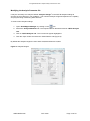
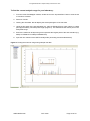
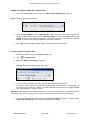
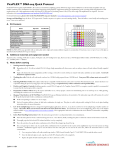
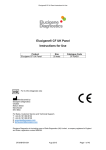
Elucigene® QST*R-21 Euplex Assay Instructions for Use Elucigene® QST*R-21 Euplex Instructions for Use Product Elucigene QST*R-21 Euplex Size 10 tests Catalogue Code ANE21BX For In-Vitro Diagnostic Use Manufactured by: Elucigene Diagnostics Citylabs Nelson Street Manchester M13 9NQ For Sales, Customer Service and Technical Support:T: +44 (0) 161 669 8122 F: +44 (0) 161 669 8129 E: [email protected] E: [email protected] Elucigene Diagnostics is the trading name of Delta Diagnostics (UK) Limited., a company registered in England and Wales, registration number 8696299. ANE21BYEN 002 OCT-2015 Page 1 of 40 Elucigene® QST*R-21 Euplex Assay Instructions for Use Elucigene QST*R-21 Euplex Intended Use QST*R-21 Euplex is a supplemental kit designed to be used in conjunction with QST*R or QST*Rplusv2, for the routine quantitative in vitro diagnosis of trisomies associated with Chromosome 21 (Down syndrome). The assay provides additional chromosome testing where necessary or for confirmation of positive results. The method employed by these kits is the QF-PCR (Quantitative Fluorescence-Polymerase Chain Reaction) technique. The devices are intended to be used on DNA extracted from either amniotic fluid or chorionic villus samples (CVS) taken during amniocentesis. The intended target population is pregnant women that have been assessed as being at ‘high risk’ of carrying an affected foetus by either biochemical or ultrasound diagnostic procedures or assessed to be ‘at risk’ due to either previous family history or maternal age. The device is intended to be used in conjunction with other diagnostic procedures to support or discount the proposed clinical diagnosis. The device is for Professional Use only within a molecular or cytogenetics laboratory environment. Summary and Explanation The risk of giving birth to a Down syndrome child increases significantly with the age of the mother, from approximately 1:1600 at age 20-24, to 1:200 at age 35 and 1:19 at age 45 and older. Pregnant women are routinely offered screening for Down syndrome in the first trimester of pregnancy. A standard test is the so-called ‘OSCAR’ test, One Stop Clinical Assessment of Risk that is carried out at between 10 and 13.5 weeks of pregnancy. This combines two biochemical markers, free beta hCG (human Chorionic Gonadotrophin) and PAPP-A (Pregnancy Associated Plasma Protein-A) with measurement of the thickness of the fetal nuchal fold (nuchal translucency) (1). Combining the results of these three tests gives an overall risk figure. Women identified as being at increased risk of giving birth to a Down syndrome child are then offered an amniocentesis to test directly for the abnormality. Amniocentesis is an invasive test and involves introducing a needle, guided by ultrasound, into the amniotic sac surrounding the fetus. A small sample, typically 10-20ml, of amniotic fluid containing fetal cells is drawn off and tested. Down syndrome was named after Dr John Langdon Down in 1866 although described earlier. It is caused by trisomy for all or part of chromosome 21 (2). As well as a cognitive disability of varying degree, individuals with Down syndrome typically share a number of common features including hypotonia (poor muscle tone), a protruding tongue, almond shape to the eyes caused by an epicanthic fold, upslanting palpebral fissures, single palmar crease and shorter than normal limbs. They are also at increased risk of congenital heart defects and in later life of developing a form of Alzheimer’s. ANE21BYEN 002 OCT-2015 Page 2 of 40 Elucigene® QST*R-21 Euplex Assay Instructions for Use Principles of the procedure The method employed by Elucigene QST*R kits uses the QF-PCR (Quantitative FluorescencePolymerase Chain Reaction) technique (3-7). Using PCR amplification, fluorescent dye labelled primers target highly polymorphic regions of DNA sequence called short tandem repeats (STRs) that are located on the chromosomes of interest. Each targeted STR marker is specific to the chromosome on which it is located, thus the copy number of the STR marker can be diagnostic of the copy number of the chromosome. Informative STR markers have been selected that exhibit a high heterogeneity so that copy number can be easily determined. A normal diploid sample has the normal complement of two of each of the somatic chromosomes, thus two alleles of a chromosome specific STR are determined by the QF-PCR technique as two peaks in a 1:1 ratio. The observation of an extra STR allele as either a three peak pattern in a 1:1:1 ratio or two peak pattern in a 2:1 or 1:2 peak ratio is diagnostic of the presence of an additional sequence which in turn may represent an additional chromosome, as in the case of a trisomy. Amplified products of the QF-PCR technique are analysed quantitatively on a capillary electrophoresis Genetic Analyzer to determine the copy number of the analysed STR markers. Warnings and Precautions 1. The normal DNA Control provided in the kits has been independently tested and found to be negative for Hepatitis B Virus (HBV), Hepatitis C Virus (HCV) and Human Immunodeficiency Virus (HIV) 1 and 2. 2. Care should be taken when handling material of human origin. All samples should be considered potentially infectious. No test method can offer complete assurance that HBV, HCV, HIV or other infectious agents are absent. 3. Handling of samples and test components, their use, storage and disposal should be in accordance with the procedures defined by the appropriate national biohazard safety guideline or regulation. 4. In line with current good laboratory practice, laboratories should process their own internal QC samples of known type in each assay, so that the validity of the procedure can be assessed. 5. If kit box is damaged, there may be damage to the contents, do not use the kit, contact Customer Service. ANE21BYEN 002 OCT-2015 Page 3 of 40 Elucigene® QST*R-21 Euplex Assay Instructions for Use Symbols used on labels The symbols used on all labels and packaging conform to the harmonised standard ISO 15223 Manufacturer Number of tests See Instructions for Use X°C Store below temperature shown Use before date shown Catalogue code Lot or batch number In Vitro Diagnostic Medical Device ANE21BYEN 002 OCT-2015 Page 4 of 40 Elucigene® QST*R-21 Euplex Assay Instructions for Use Materials Provided Store all components below -20°C The Elucigene QST*R-21 Euplex IVD kit contains: 450226 1 x 100µl Reaction Mix (TA) 404485 1 x 50µl Control DNA (DC) 450250 10 x 0.2ml PCR vials (blue) Sufficient for 10 tests. Kit Preparation and Storage Upon opening the kit it is recommended that the reaction mix be dispensed into 0.2ml PCR vials provided in 10µl volumes and frozen at -20°C. Ensure that vial contents are thoroughly thawed and mixed before dispensing. The Control DNA should be frozen at -20°C. Materials required but not provided General Laboratory consumables – gloves; screw-capped microfuge tubes; 0.2ml PCR vials or microtitre plates recommended by the manufacturer of the thermal cycler used; pipette tips. Laboratory equipment – precision pipettes (2 sets: 1 for pre-amplification and 1 for post-amplification handling: preferably positive displacement pipettes); protective clothing; vortex mixer; microfuge; 96well microtitre plate centrifuge. DNA Extraction DNA Preparation – InstaGene Matrix (Bio-Rad Laboratories, Cat No 732-6030), sterile de-ionised water. PCR Amplification Thermal cycler to accommodate 96-well microtitre plates or 0.2ml vials with a temperature accuracy of +/-1°C between 33°C and 100°C and static temperature uniformity of +/-1°C. QST*R-21 Euplex has been validated on and shown to perform to specification on the following Thermal Cycler platforms: Life Technologies GeneAmp 9700 (Running in Standard mode) Life Technologies Veriti Dx (Running in Standard mode) Life Technologies Veriti Dx (Running in 9700-simulation mode) Life Technologies Proflex (Running in Standard mode) ANE21BYEN 002 OCT-2015 Page 5 of 40 Elucigene® QST*R-21 Euplex Assay Instructions for Use Capillary Electrophoresis Capillary Electrophoresis – GeneScan 500 LIZ size standard (ABI Cat No 4322682), POP-7 Polymer (ABI Cat No 4352759), DS-33 (dye set G5) matrix standard (ABI Cat No 4345833), 10x Genetic Analyzer Buffer (ABI Cat No 402824) and Hi-Di Formamide (ABI Cat No 4311320). Applied Biosystems ABI 3130 and 3500 Genetic Analyzers (with current Data collection software), 36cm capillary array (50cm capillary array for 3500 Genetic Analyzer), 96-well optical plates, 96-well septa, 96-well cassettes. Data Analysis One of the following data analysis software packages is required: GeneMapper 3.7 (Applied Biosystems Inc.) or above or GeneMarker 1.65 (SoftGenetics LLC) or above. Additional Elucigene QST*R Documentation These Instructions for Use include a basic section on interpretation of the results obtained in addition to a guide to software analysis with both the GeneMapper and GeneMarker packages. A supplemental Guide to Interpretation with examples and glossary are available from the Elucigene website: http://www.elucigene.com/product-category/rapid-aneuploidy-analysis/. Sample Collection and Storage Chorionic Villus (CV) or Amniotic Fluid (AF) samples should be used. Sample collection devices have on occasion been reported to be detrimental to the integrity of certain analytes and could interfere with some method technologies. It is recommended that each user ensure that the chosen device is used according to the manufacturer’s instructions and both sample collection devices and DNA preparation methods are compatible with this test. ANE21BYEN 002 OCT-2015 Page 6 of 40 Elucigene® QST*R-21 Euplex Assay Instructions for Use DNA Extraction Elucigene QST*R kits are validated on the InstaGene matrix method of DNA extraction and can be performed in a single tube, eliminating the necessity for tube-to-tube transfers. Other extraction methods have been shown to provide equally reliable results e.g. Qiagen QIAamp kits. The InstaGene method of DNA extraction is described below: Instagene Extraction Method Chorionic Villus (CV) CV samples should be carefully cleaned to remove any adhering maternal decidua. It is important that cells from more than one region of the sample are tested and that cells from the mesenchyme core are represented. A small aliquot of the cell suspension, as prepared for conventional cell culture setup, is recommended for QST*R analysis. This ensures that the QST*R result is obtained from the same population of cells used for karyotype analysis. 1. Resuspend the InstaGene matrix on the magnetic stirrer and set at a medium speed for at least 5 minutes. 2. Centrifuge the sample (AF or CV) at 12,000g for 1 minute in order to pellet the cells. 3. Remove the samples from the centrifuge and visually check the pellet for blood-staining. Make a note of the percentage of blood-staining, if any. 4. Carefully remove and discard the supernatant from the pellet, ensuring that the pellet is undisturbed. Leave approximately 10-20µl of supernatant behind to re-suspend the pellet. 5. Thoroughly mix the sample by vortexing. 6. If greater than 50% bloodstaining is observed proceed to Step 7. If less than 50% blood-staining is observed proceed to Step 8. 7. Add 200µl of sterile deionised water to the cell pellet. Thoroughly mix by vortexing. Centrifuge at 12,000g for 1 minute, remove the supernatant leaving 10-20µl of supernatant behind to resuspend the pellet. Note: this additional washing step helps to lyse the red blood cells and remove haem that could inhibit PCR. 8. Add 200µl of InstaGene matrix from step 1 to the samples using a pipette tip with a large bore, such as 1,000µl. Note: to optimise the extraction protocol the added volume of InstaGene matrix (Chelex-100 resin) can be varied using 100µl of InstaGene matrix for small AF cell pellets (barely visible), or 300µl for large pellets (covering the base of the tube), CV and tissue samples. Record the amount of InstaGene matrix added to each sample. 9. Thoroughly mix the samples by vortexing and incubate at 100°C for 8 minutes in a hot block or water bath. 10. Thoroughly mix again by vortexing at high speed for 10 seconds. 11. Centrifuge the samples at 12,000g for 3 minutes. The supernatant contains the extracted DNA. 12. Proceed to PCR set up or store the extracted DNA at -20°C until required. ANE21BYEN 002 OCT-2015 Page 7 of 40 Elucigene® QST*R-21 Euplex Assay Instructions for Use DNA Concentration It is recommended that alternative DNA extraction methods and sample types are thoroughly evaluated with the Elucigene QST*R test prior to the results being used for diagnostic use. Under optimal PCR conditions and using the recommended sample injection settings* stated in the capillary column run module (page 11), acceptable results are consistently obtained with input DNA amounts of 1.25ng to 10ng. *Note: sample injection settings can be modified to suit the amount of amplicon produced during the PCR reaction which can vary due to amount of input genomic DNA added. Less amplicon can be applied to the column for analysis by reducing time of injection. Conversely, more amplicon can be applied to the column for analysis by increasing either time or voltage of injection. Previously amplified samples can be re-injected multiple times for re-analysis. ANE21BYEN 002 OCT-2015 Page 8 of 40 Elucigene® QST*R-21 Euplex Assay Instructions for Use Test Protocol Amplification Procedure Note: to minimise the risk of contamination, steps 3 - 5 must be carried out in an area free from DNA. Steps should also be taken to avoid contamination with PCR product. 1. Program the thermal cycler for a single step cycle to activate the DNA polymerase at 95°C for 15 minutes linked to an amplification cycling program of 30 seconds at 95°C (denaturation), 1 minute and 30 seconds at 59°C (annealing) and 1 minute and 30 seconds at 72°C (extension) for 26 cycles. This should be linked to a 30 minutes time-delay file at 72°C (extension) on the final cycle Cycling Final Enzyme Activation Extension 95 oC 95 oC 15 min. 30 secs. 72 oC 72 oC 1 min 30 secs. 30 min. 59 oC Ambient Temperature 1 min 30 secs. 26 Cycles 2. A negative (water) control must be included in each PCR run. It may also be considered appropriate to include other controls, e.g. positive normal (DNA control supplied) and positive trisomy control (DNA not supplied). 3. Thaw sufficient vials of pre-aliquoted QST*R-21 Euplex reaction mix for the number of samples and controls to be run (see note under Materials Provided) and centrifuge the vials at 12,000g for 10 seconds. 4. Using separate pipette tips, add 2.5µl of test DNA to a sample vial containing 10µl QST*R-21 Euplex reaction mix and mix by pipetting up and down. Do this for all samples to be tested. 5. Do not add DNA to the PCR vial for the negative control; instead add 2.5µl of sterile distilled water. Note: care must be taken not to contaminate the PCR reaction with any InstaGene resin. 6. Briefly centrifuge the vials until all liquid is at the bottom of each vial. 7. Place all vials firmly in the thermal cycler block. Initiate the 95°C activation program followed by the amplification program (see step 1). 8. On completion of the amplification program the samples may be stored at room temperature overnight or at 2-8°C for up to 7 days before analysis by capillary electrophoresis. ANE21BYEN 002 OCT-2015 Page 9 of 40 Elucigene® QST*R-21 Euplex Assay Instructions for Use Capillary Electrophoresis It is recommended that each user ensure that the chosen equipment is used according to the manufacturer’s instructions and is compatible with this test. In this context the key parameters are the polymer and the capillary array. Optimal results can be obtained using the following capillary electrophoresis conditions on an ABI3130 or ABI3500 Genetic Analyzer. 1. Combine 6.85µl of size standard with 250µl Hi-Di Formamide and mix thoroughly (sufficient mix for 16 wells). Dispense 15µl of the mix into the required number of wells of a 96 well optical plate*. 2. Add 3µl of test sample PCR product to the size standard mix (from step 1) already dispensed into the plate and mix using the pipette. Seal the plate. 3. Denature the PCR product dispensed into the optical plate on a thermal cycler using the following parameters: 94°C for 3 minutes linked to 4°C for 30 seconds. 4. Centrifuge the plate at 1,000g for 10 seconds to remove any bubbles in the wells and load onto the Genetic Analyzer. *Note: It is essential that unused wells (i.e. wells in which No DNA sample is loaded) are still loaded with Hi-Di Formamide to ensure that the capillaries do not dry out. ANE21BYEN 002 OCT-2015 Page 10 of 40 Elucigene® QST*R-21 Euplex Assay Instructions for Use Post-PCR Data Analysis ABI3130 GENETIC ANALYZER Create a sample sheet using the 3130 data collection software with the following settings: • Sample Name: this must be the same sample specific name or number. • Run owner: select the default owner for lab. • Run Protocol: QSTR (contains QST*R 3130 run module – see below)*. *Note: It is necessary to create a run module detailing the instrument settings and subsequently assign this to a Run protocol in which Dye set G5 has been selected. For more information on creating run modules please refer to your instrument user manual. 3130 RUN MODULE FOR POP7 POLYMER 36cm Capillary Module: QSTR # 1 2 3 4 5 6 7 8 9 10 11 12 Parameter Name Oven Temperature Poly_fill_Vol. Current Stability PreRun_Voltage Pre_Run_Time Injection_Voltage Injection_Time Voltage_Number_of_Steps Voltage_Step_Interval Data_Delay_Time Run_Voltage Run_Time ANE21BYEN 002 Value 60 6500 5.0 15.0 180 3.0 15 20 15 60 15.0 1200 OCT-2015 Range int 18…65 Deg.C 6500…38000 steps int 0…2000 uAmps 0…15 kvolts 1…1000 sec. 1…15 kvolts 1…600 sec. 1…100 nk 1…60 sec. 1…3600 sec. 0…15 kvolts 300…14000 sec. Page 11 of 40 Elucigene® QST*R-21 Euplex Assay Instructions for Use ABI3500 GENETIC ANALYZER A QST*R Instrument Protocol needs to be created which can then be used for each QST*R run. Create the QST*R Instrument Protocol through the 3500 Instrument Protocols library. Ensure the following are selected: • Run Module: FragmentAnalysis50_POP7 • Enter the settings detailed in the image below: To run the samples create a sample plate by clicking on ‘Create Plate from Template’ in the ‘Dashboard’, ensure the correct Instrument Protocol for QST*R has been assigned (see above). Analysis and Interpretation of Results It is recommended that each laboratory develops its own interpretation and reporting procedures and criteria. Best practice guidelines for QF-PCR have been documented by the UK’s Association for Clinical Genetic Science and are available for reference at: www.acgs.uk.com PCR products are observed as a 5 dye labelled system using filter set G5. Filter set G5 detects the 6FAM (blue), VIC (green), NED (yellow) and PET (red) labelled fragments plus the Size Standard marker labelled with LIZ (orange) on an electrophoretogram and in the GeneMapper or GeneMarker program. A Guide to Interpretation is available from the Elucigene website: http://www.elucigene.com/product-category/rapid-aneuploidy-analysis/ Important Note: different combinations of instrument, polymer and size standard may cause the size calling to vary slightly. During validation of the kit, users should check that the default bin settings result in accurate peak labelling and adjust if necessary. In case of any difficulty, please contact Technical Support ([email protected]) for advice. ANE21BYEN 002 OCT-2015 Page 12 of 40 Elucigene® QST*R-21 Euplex Assay Instructions for Use General analysis guidelines for QST*R-21 Euplex 1. The negative control should show no sharp peaks within the read range of 100 to 510bp. 2. The positive control must show the expected results and all peaks must meet the criteria below. 3. For analysis of DNA samples at least 1 peak should be observed for each marker tested. The acceptable range for marker peaks analysed on the 3130 Genetic Analyzer is between 50 and 6000 relative fluorescent units (rfus) and for the 3500 Genetic Analyzers is between 175 and 32000 rfus. Peak heights falling outside this range must not be analysed. 4. Electrophoretograms of poor quality due to excessive bleed-through between dye colours (also known as ‘pull-up’) or ‘electrophoretic spikes’ (sharp peaks present in more than one dye) should not be interpreted. The PCR products should be re-injected and re-analysed. 5. Analysis is performed by assessment of peak ratios (A1/A2), where A1 is the peak area of the shorter length fragment and A2 is the peak area of the longer length fragment. The resulting ratio is indicative of locus copy number. For disomic chromosomes heterozygous markers should show two peaks with similar heights. A complete analysis of chromosome copy number status is performed by comparison of peak area ratios. 6. Heterozygous di-allelic (i.e. two alleles) markers should fall within a ratio window of 0.8 to 1.4. However, for two alleles separated by more than 24bp in size a ratio of up to 1.5 is acceptable. Any values falling within this region are referred to as having a ratio of 1:1. If the ratio balance falls out of this window then it may be due to a number of factors, such as: Whole chromosome trisomy Partial chromosome trisomy (including sub-microscopic duplications) Mosaicism Contaminating second genotype (e.g. maternal, twin, external) Stutters causing skewing Preferential amplification of one allele causing skewing Primer site polymorphisms Somatic microsatellite mutations The Guide to Interpretation gives examples of typical profiles for many of these. Homozygous markers are uninformative since a ratio cannot be determined. 7. To interpret a result as abnormal (i.e. trisomy present), at least two informative markers consistent with a tri-allelic genotype are required with all other markers being uninformative. It is not recommended to interpret a result as abnormal based on information from only one marker. ANE21BYEN 002 OCT-2015 Page 13 of 40 Elucigene® QST*R-21 Euplex Assay Instructions for Use Trisomy is determined by either:7.1. Two peaks of uneven height due to one of the peaks representing two alleles which are common to one or both parents. In this case the ratio between the two peaks will be classed as 2:1 or 1:2 such that A1/A2 will give a result in the region of 1.8 to 2.4 when the peak representing the shorter length allele is greater in area than the peak representing the longer length allele, or where A1/A2 will give a result in the region of 0.45 to 0.65 when the peak representing the shorter length allele is smaller in area than the peak representing the longer length allele. 7.2. Three peaks of comparable height present. The ratio of the peaks will be classed as 1:1:1 and their values fall within the normal range of 0.8 – 1.4 (although for alleles separated by more than 24bp an allele ratio of up to 1.5 is acceptable). If this does not occur then it may be due to one of the factors mentioned in step 6. 8. To interpret a result as normal, at least two informative markers consistent with a di-allelic genotype are required with all other markers being uninformative. A normal result indicates the normal complement of two for the chromosome tested. 9. Peak area ratios that fall between the normal and abnormal ranges are classed as inconclusive. Inconclusive results may be resolved by using the single chromosome kits. 10. If both normal and abnormal allele patterns are obtained for a single chromosome then it is recommended that follow-up studies are carried out to identify the reason for the discrepant results prior to any conclusions being reached. 11. In rare cases allele size ranges for markers may overlap. If this is suspected, analysis with the single chromosome kits may resolve this. ANE21BYEN 002 OCT-2015 Page 14 of 40 Elucigene® QST*R-21 Euplex Assay Instructions for Use Performance Characteristics INTERNAL VALIDATION Thirty (30) DNA samples extracted from amniotic fluid or chorionic villus and of known chromosome 21 ploidy status, were tested using Elucigene QST*R-21 Euplex. Resultant data was analysed following the recommended methods. All thirty samples amplified satisfactorily on the first attempt, of these, 25 were determined to be normal and 5 indicated the presence of a Trisomy 21. All results showed 100% concordance with results previously obtained by alternative, established methods. ANE21BYEN 002 OCT-2015 Page 15 of 40 Elucigene® QST*R-21 Euplex Assay Instructions for Use GeneMapper Analysis Guide (v3.7 and above) Note: The following GeneMapper screen shots are taken from GeneMapper v5.0 Importing and Analysing QST*R Files 1. Open the GeneMapper Program file 2. Click in order to add data files to a new project. Navigate to where the raw .fsa data files are stored, highlight the appropriate data files and click the ‘Add to List>>’ button. 3. The run folder will now appear in the ‘Samples to Add’ window. Double clicking on the run folder icon in this window will show each .fsa file to be imported. Samples are then added by clicking at the bottom of the screen. The data files now appear within the GeneMapper main screen (figure 2) Figure 2: Samples ready to add to project ANE21BYEN 002 OCT-2015 Page 16 of 40 Elucigene® QST*R-21 Euplex Assay Instructions for Use Importing QST*R GeneMapper Analysis Settings in GeneMapper Manager It is necessary to import the QST*R settings for GeneMapper. This process is controlled through the ‘GeneMapper Manager’ interface. QST*R GeneMapper settings are available from the Elucigene website: http://www.elucigene.com/product-category/rapid-aneuploidy-analysis/ 1. Open ‘GeneMapper Manager’ by clicking on the icon. 2. Select the ‘Analysis Methods’ tab and then click the import button 3. Navigate to and import the required QST*R Analysis Settings file(s) (3130 or 3500) 4. Repeat the process, selecting the appropriate tab and importing the corresponding file for: Table Settings Plot Settings Size Standards Note: Cluster Plot Settings, Matrices, SNP Sets and Report Settings do not require file imports. Importing QST*R-21 Euplex Panel settings in Panel Manager It is necessary to import the QST*R-21 Euplex panel and bin settings for GeneMapper. This process is controlled through the ‘Panel Manager’ interface. QST*R-21 Euplex specific GeneMapper panel and bin settings files are available from the Elucigene website: http://www.elucigene.com/product-category/rapid-aneuploidy-analysis/ 1. Open Panel Manager Program by clicking on the icon. 2. Click ‘Panel Manager’ on the left navigation window. Panel Manager will now appear highlighted in blue. 3. Select ‘File/Import Panels’. Navigate to and import the GeneMapper panel file ‘QSTR-21 Euplex GeneMapper Panel File.txt’ (Figure 3). 4. The panel file will now be displayed on the left navigation window. Click on the panel file ensuring that it is highlighted blue. 5. Select ‘File/Import Bin Set’. Navigate to and import the GeneMapper bin file ‘QSTR-21 Euplex GeneMapper Bin File.txt’ (Figure 4). 6. Click ‘Apply’ then click ‘OK’. ANE21BYEN 002 OCT-2015 Page 17 of 40 Elucigene® QST*R-21 Euplex Assay Instructions for Use Figure 3: Importing QST*R-21 Euplex GeneMapper Panel File Figure 4: Importing QST*R-21 Euplex GeneMapper Bin File ANE21BYEN 002 OCT-2015 Page 18 of 40 Elucigene® QST*R-21 Euplex Assay Instructions for Use Modifying the Analysis Parameter file It may be necessary to modify the default ‘Analysis Ranges’ in the QST*R analysis settings to account for local variance in run conditions. The minimum analysis range will depend on the capillary and polymer being used during data collection. To view current analysis settings: 1. Open ‘GeneMapper Manager’ by clicking on the icon. 2. Select the ‘Analysis Methods’ tab. The Imported QST*R file will be listed as ‘QSTR Analysis v02’. 3. Click on ‘QSTR Analysis v02’. The row will now appear highlighted. 4. Click the ‘Open’ button and select the ‘Peak Detector’ tab (Figure 5) By default the analysis ranges are set to start at 2,000 and finish at 18,000. Figure 5: Analysis Ranges. ANE21BYEN 002 OCT-2015 Page 19 of 40 Elucigene® QST*R-21 Euplex Assay Instructions for Use To find the correct analysis range for your laboratory: 1. From the main GeneMapper window, double click on the imported Run Folder to view the list of .fsa files it contains. 2. Select an .fsa file. 3. Clicking the ‘Raw data’ tab will display the electropherogram of the raw data. 4. Using the first peak of the size standard (e.g. 75bp of GS500LIZ) as a guide, select on a data point approximately 100 data points larger (Figure 6). This determines the lowest point in the analysable range. 5. Ensure the maximum analysis range encompasses the largest peak of the size standard (e.g. 500bp of GS500LIZ or 600bp of GS600LIZv2). 6. Input the new values into the QST*R Analysis file (accessing it as described above). Figure 6: Finding the minimum range using sample raw data ANE21BYEN 002 OCT-2015 Page 20 of 40 Elucigene® QST*R-21 Euplex Assay Instructions for Use Analysis of Imported QST*R-21 Euplex Files 1. In the main GeneMapper window select the ‘QST*R Table Settings v02’ (Figure 7) Figure 7: Setting QST*R table settings 2. Under ‘Analysis Method’ select ‘QSTR Analysis v02’. Fill down each column by pressing ‘Ctrl+D’. Repeat this process selecting ‘QSTR 21 Euplex’ for under the ‘Panel’ heading and ‘QSTR’ under the ‘Size Standard’ heading. Each time remember to fill down by pressing ‘Ctrl+D’ to ensure each setting is applied to the full list of samples. 3. Click to initiate sample analysis. Assign a project name when prompted. Reviewing QST*R-21 Euplex Data 1. Select the sample for analysis (highlight sample row). 2. Click to ‘Display Plots’. 3. Select the ‘QST*R Plot settings’ (Figure 8). Figure 8: QST*R Plot settings, drop down menu. 4. The plot window will display sample profile with the tabulated data (Figure 9). A maximum of two peaks for each marker will be labelled automatically by GeneMapper. If three alleles are present for a marker, the third unlabelled peak should be manually labelled (see: Manual Editing of Profiles, below). Note: Allele size ranges for each marker are based on previously observed data. Rare alleles may fall outside the given marker size range and it may be necessary to adjust the bin set accordingly. 5. It is recommended that the plot window has ‘Single click editing’ activated. To do this select ‘Alleles/set click editing’ and ensure that this option is checked. ANE21BYEN 002 OCT-2015 Page 21 of 40 Elucigene® QST*R-21 Euplex Assay Instructions for Use Figure 9: Sample Plot window displaying labelled trace data and correlating genotype table Manual Editing of Profiles WARNING! GeneMapper will only assign labels for up to 2 peaks per marker. Manual editing of profiles may therefore be required, i.e. when assigning labels to 3rd peaks (if present) or removing labels from stutter peaks. To add a peak label; left click on the unlabelled peak. You will get the option to add allele comment. Click ‘OK’. The peak will now be labelled with its size in base pairs and its peak area. The table will automatically incorporate the newly labelled peak. To remove a peak label; left click on the peak label. You will get the option to delete allele comment. Click ‘OK’. The peak label will now be removed. The table will automatically remove the deleted peak data. Copying Table Data 1. Highlight all rows with the table at the bottom of the plot window. 2. Copy the selected rows by typing ‘Ctrl+C’ keys ANE21BYEN 002 OCT-2015 Page 22 of 40 Elucigene® QST*R-21 Euplex Assay Instructions for Use QST*R-21 Euplex Report Template The associated QST*R-21 Euplex report template can be used to determine the peak ratios for a marker and assist in analysis of data. The QST*R-21 Euplex specific Report Template is available from the website: http://www.elucigene.com/product-category/rapid-aneuploidy-analysis/ 1. Open the QST*R-21 Euplex Report Template file (QSTR-21 Euplex Report Template.xlsm). 2. If the Report Template displays a warning indicating that macros have been disabled, click the ‘Enable Content’ button to enable macros (Figure 10). Figure 10: Enabling macro function in QST*R-21 Euplex Report Template 3. If a security warning is shown (as seen in Figure 11), click ‘Yes’ in order to proceed. Figure 11: Allowing security access 4. Paste the data copied from the GeneMapper data table (see above, ‘Copying Data Table’) using ‘Ctrl+V’ into the top left cell in the outlined area (See Figure 12). ANE21BYEN 002 OCT-2015 Page 23 of 40 Elucigene® QST*R-21 Euplex Assay Instructions for Use Figure 12: Importing raw GeneMapper data into the QST*R-21 Euplex Report Template. 5. The calculated ratios for each marker will now be shown in the data table to the left. The data table can be printed or saved as a new file for each specific sample. 6. In order to process subsequent samples it is important that all data is fully cleared from the report template. In order to do this, click the ‘CLEAR DATA’ button located underneath the raw data table within the QST*R-21 Euplex Report Template. New sample data can now be imported following the procedure outlined above. ANE21BYEN 002 OCT-2015 Page 24 of 40 Elucigene® QST*R-21 Euplex Assay Instructions for Use Scoring the Report 1. Trisomy is determined by either:a Two peaks of uneven height due to one of the peaks representing two alleles which are common to both parents. In this case the ratio between the two peaks will be classed as 2:1 or 1:2. Where A1/A2 will give a result in the region of 1.8 to 2.4 when the peak representing the shorter length allele is greater in area than the peak representing the longer length allele, or where A1/A2 will give a result in the region of 0.45 to 0.65 when the peak representing the shorter length allele is smaller in area than the peak representing the longer length allele. In both cases ‘Ratio’ will appear in the ‘Warning’ column. b Three peaks of comparable height present. The ratio of the peaks will be classed as 1:1:1 and their values fall within the normal range of 0.8 – 1.4 (although for alleles separated by more than 24bp an allele ratio of up to 1.5 is acceptable). In this case ‘3 Alleles’ will appear in the ‘Warning’ column. 2. To interpret a result as abnormal (i.e. trisomy present), at least two informative markers consistent with a tri-allelic genotype are required with all other markers being uninformative. It is not recommended to interpret a result as abnormal based on information from only one marker. 3. To interpret a result as normal, at least two informative markers consistent with a diallelic genotype are required with all other markers being uninformative. A normal result indicates the normal complement of two for the chromosomes tested. 4. Peak area ratios that fall between the normal and abnormal ranges are classed as inconclusive. Inconclusive results may be resolved by using the single chromosome kits. 5. In the absence of any peak data for a marker ‘Absent’ will be displayed in the warning column. This warning will be routinely observed in the absence of Y chromosome markers. ANE21BYEN 002 OCT-2015 Page 25 of 40 Elucigene® QST*R-21 Euplex Assay Instructions for Use GeneMarker Analysis Guide Note: The following screen shots have been taken from GeneMarker v2.6.3. Adding Sample Files to GeneMarker Open the GeneMarker program file and when prompted, select ‘Open Data’. The Open Data Files box will appear. Click the ‘Add’ button. The Open dialog will appear. Navigate to directory containing raw data files; 1. Select all files by CTRL+A or use CTRL and/or SHIFT keys to select individual samples 2. Click ‘Open’ button in the Open dialog The files selected will appear in the Data File List field (Figure 13). Figure 13: Samples added to the Data File list Click ‘OK’ button in the Open Data Files box and the samples will be uploaded to GeneMarker. The software will then automatically open the Raw Data Analysis window (Figure 14). ANE21BYEN 002 OCT-2015 Page 26 of 40 Elucigene® QST*R-21 Euplex Assay Instructions for Use Figure 14: Raw Data Analysis Window Importing QST*R-21 Euplex GeneMarker Panel Settings It is necessary to import the QST*R panel settings for GeneMarker. This process is controlled through the ‘Panel Editor’ interface. QST*R-21 Euplex GeneMarker panel settings are available from the Elucigene Website: http://www.elucigene.com/product-category/rapid-aneuploidy-analysis/ 1. Open ‘Panel Editor’ from the ‘Tools’ drop-down menu (Figure 15). Figure 15: Selecting Panel Editor ANE21BYEN 002 OCT-2015 Page 27 of 40 Elucigene® QST*R-21 Euplex Assay Instructions for Use 2. Select ‘Import Panels’ from the ‘File’ drop-down menu (Figure 16). Figure 16: Importing Panels 3. Navigate to and import the panel QSTR-21 Euplex.xml 4. Repeat the process as required for other relevant panel files. Processing Data After the raw data files have been uploaded to GeneMarker, they are ready to be processed. The processing step includes application of a sizing standard, filtering of noisy peaks, and comparison to a known allelic panel if desired. GeneMarker combines all these steps in one simple tool called the ‘Run Wizard’ (Figure 17). To access the Run Wizard simply click the ‘Run Project’ icon in the main toolbar. Run Wizard – creating a Run Template It is necessary to create a run template the first time this software is used to analyse QST*R-21 Euplex data. This is done through the Run Wizard; 1. To access the Run Wizard simply click on the ‘Run Project’ icon in the main toolbar. 2. Assign a Template Name e.g. QSTR-21 Euplex 3. Select the Panel, Size Standard, Standard Colour and Analysis Type as shown in Figure 17. 4. Click ‘Save’ to store the template for future analyses. 5. Click ‘Next’ to continue. ANE21BYEN 002 OCT-2015 Page 28 of 40 Elucigene® QST*R-21 Euplex Assay Instructions for Use Figure 17: Run Wizard – Template Selection Window Run Wizard – Data Process The Data Process window of Run Wizard allows the user to select the peak filtering parameters. 1. Select the appropriate analysis settings in the Data Process window as shown in Figure 18. 2. Click ‘Next’ to continue. Note: The analysis range setting within the raw data analysis bow will vary depending on the Polymer used during data collection. The operator should select a start data point value that includes the 75bp size standard peak. Figure 18: Run Wizard – Data Process Window Note: For 3500 data, increase the Minimum Intensity to 150 ANE21BYEN 002 OCT-2015 Page 29 of 40 Elucigene® QST*R-21 Euplex Assay Instructions for Use Run Wizard – Additional Settings There are no additional settings required when performing QST*R analysis (Figure 19). 1. Click ‘OK’ to continue. Figure 19: Run Wizard – Additional Settings Data Processing Box After clicking ‘OK’ in the Run Wizard Additional Settings box, the Data Processing box appears (Figure 20). The raw data is processed and sized, then the filtering parameters and the selected QST*R Panel are applied. 1. Click ‘OK’ in the Data Processing box when analysis is complete. Figure 20: Data Processing Box ANE21BYEN 002 OCT-2015 Page 30 of 40 Elucigene® QST*R-21 Euplex Assay Instructions for Use Main Analysis Window The Main Analysis window (Figure 21) of GeneMarker has an easy to use layout. This layout includes: The sample files list - displayed on the left side of the window. The Synthetic Gel Image - displayed at the top of the window. Data Electropherograms - below the gel image. A Report Table - displayed on the right side of the window. In this window it is important to check that all the appropriate peaks in each profile have been called correctly. 1. Double-click on each sample in turn in the sample file tree on the left-hand side of the screen. Right-click on any peaks in question and choose from the options in the dialogue box e.g. edit or delete allele, confirm or unconfirm as appropriate. 2. From the Main Analysis window select the ‘Applications’ drop down menu option from the top of the screen. Select ‘Trisomy Analysis’. The Trisomy Analysis Settings box will then open (Figure 22). Figure 21: Main Analysis Window ANE21BYEN 002 OCT-2015 Page 31 of 40 Elucigene® QST*R-21 Euplex Assay Instructions for Use Figure 22: Trisomy Analysis Settings Box Trisomy Analysis Settings Within the Trisomy Analysis settings box two tabs are available: 1. Analysis tab. 2. Statistics Plot tab. Analysis Tab The Analysis tab provides threshold setting options for Trisomy analysis. Ensure that ‘BPG’ is selected in the analysis box and the following settings displayed. Peak Height 50: Minimum height of 50 for peaks to be called (150 if using 3500 data). Height Ratio 30%: Maximum percentage of the main peak the second peak must reach in order for two alleles to be identified. Quantification by Peak Area. Shorter Length/Longer Length selected. Trisomy Ratio thresholds are 0.80 – 1.40. Apply Linear Correction de-selected. Click ‘OK’. ANE21BYEN 002 OCT-2015 Page 32 of 40 Elucigene® QST*R-21 Euplex Assay Instructions for Use Trisomy Analysis Window The Trisomy Analysis window (Figure 23) allows the operator to review QST*R sample data and display the ratio of peaks for each marker and access the GeneMarker report. There are a number of displays which assist the operator in data analysis, they are: Sample List. Electropherogram. Ratio Plot. Report Table. Figure 23: Trisomy Analysis Window For more detailed information regarding Trisomy analysis features and their use, please refer to the GeneMarker Manual. ANE21BYEN 002 OCT-2015 Page 33 of 40 Elucigene® QST*R-21 Euplex Assay Instructions for Use GeneMarker Report GeneMarker includes a report template that is compatible with Elucigene QST*R kits. To access the report click the ‘Print’ icon located on the toolbar at the top left of the Trisomy Analysis Window. This will open the Trisomy Print Settings window (Figure 24). Trisomy Print Settings Window The Trisomy Print Settings detail the options for including and visualising sample data in the GeneMarker report. Select the options as shown in Figure 24. Ensure that ‘Custom Size Range’ is set to 98bp (Start) and 510bp (End). Figure 24: Trisomy Print Settings Window ANE21BYEN 002 OCT-2015 Page 34 of 40 Elucigene® QST*R-21 Euplex Assay Instructions for Use Previewing the GeneMarker Report Click ‘Preview’ to view the GeneMarker report (Figure 25). From this window the operator can review and print each sample’s peak data from across all markers, providing a simple, one or two page sample report. Figure 25: GeneMarker Report The GeneMarker report includes the following features: Report Header: Contains information about the analysis, project, sample and parameters. Signature Box: Date and initial space for report reviewers. Electropherogram: Similar to the Trisomy analysis window, displays all dye colours of the sample trace. Report Table: Displays selected peak and marker values for the current sample. Trisomy calls are highlighted grey. An additional check column is provided for reviewer initials. Corrected Ratio Plot: Contains the entire dataset’s plot points for all markers in the dye colour. Symbol shapes represent different markers and can be deciphered from the ‘Symbol’ row in the ‘Report Table’. Yellow filled symbols represent the current sample’s data points. Red outlined symbols represent trisomy calls. Note: The Corrected Ratio Plot appears on a second page for each sample only when Ratio Plot is selected in the Trisomy Print Report Settings box ANE21BYEN 002 OCT-2015 Page 35 of 40 Elucigene® QST*R-21 Euplex Assay Instructions for Use APPENDIX 1: Dye Labels The markers are labeled as follows: See Appendix 2 for further details of the STR markers including size ranges. ANE21BYEN 002 OCT-2015 Page 36 of 40 Elucigene® QST*R-21 Euplex Assay Instructions for Use APPENDIX 2: - Table of Maker location, Observed Heterozygosity, allele size range Note: the NED dye used in the kits is identified spectrally as a yellow dye. It is conventionally displayed in black type for clarity. *Observed heterozygosities are based on number of alleles observed with an Elucigene Diagnostics testing panel. These figures may therefore differ from published data and may also vary according to the population being tested ANE21BYEN 002 OCT-2015 Page 37 of 40 Elucigene® QST*R-21 Euplex Assay Instructions for Use APPENDIX 3: GeneMapper Profile GeneMapper normal male profile showing relative positions of the markers detected by QST*R-21 Euplex ANE21BYEN 002 OCT-2015 Page 38 of 40 Elucigene® QST*R-21 Euplex Assay Instructions for Use Limitations to the Procedure This test is designed to detect specific chromosomal trisomies and sex chromosome aneuploidies as detailed in the Instructions for Use. It may not detect structural rearrangements involving the chromosomes tested and will not detect abnormalities in any other chromosomes. Mosaicism for the chromosomes tested may not be detected. A QST*R-21 Euplex result can only be directly applied to the tissue tested and may not represent the fetal karyotype. Maternal cell contamination (MCC) and confined placental mosaicism (CPM) may result in discrepancies between the QST*R-21 Euplex and karyotype results. Note: Heterozygosities of the markers used were derived from a random set of samples submitted for routine analysis from a predominantly Northern European Caucasian population. Any calculations using these heterozygosities strictly only apply to the population from which the samples were taken. A small study using locally derived samples may be carried out as part of a validation study to establish heterozygosities in the population to be tested. It is not expected that population variation will significantly alter the overall informativeness of the assay. Disclaimer Results from this diagnostic assay should be interpreted in conjunction with other laboratory and clinical data available to the clinician. These Elucigene reagents are supplied for In Vitro diagnostic testing. Further details of Elucigene QST*R products are available at: http://www.elucigene.com/product-category/rapid-aneuploidy-analysis/ ANE21BYEN 002 OCT-2015 Page 39 of 40 Elucigene® QST*R-21 Euplex Assay Instructions for Use References 1. CG Antenatal Care: Full Guidelines (Corrected June 2008) UK National Institute for Health and Clinical Excellence. 2. O’Connor, C. (2008) Trisomy 21 Causes Down Syndrome. Nature Education 1(1). 3. Mansfield E S. Diagnosis of Down syndrome and other aneuploidies using quantitative polymerase chain reaction and s.mall tandem repeat polymorphisms. Human Molecular Genetics 1993 2(1): 43-50. 4. Mann K, Fox SP, Abbs SJ, Yau SC, Scriven PN, Docherty Z, Mackie Ogilvie C. Development and implementation of a new rapid aneuploidy diagnostic service within the UK National Health Service and implications for the future of prenatal diagnosis. The Lancet 2001 358 (9287): 1057-1061. 5. Mann K, Donaghue C, Fox SP, Docherty Z, Mackie Ogilvie C. Strategies for the rapid prenatal diagnosis of chromosome aneuploidy. European Journal of Human Genetics 2004 12: 907915. 6. Mackie Ogilvie C, Donaghue C, Fox SP, Docherty Z, Mann K. Rapid prenatal diagnosis of an aneuploidy using Quantitative Fluorescence-PCR (QF-PCR). Journal of Histochemistry and Cytochemistry 2005 53(3): 285-288. 7. Deutsch S, Choudhury U, Merla G, Howald C, Sylvan A, Antonarakis SE. Detection of aneuploidies by paralogous sequence quantification. Journal of Medical Genetics 2004 41: 908-915. ELUCIGENE and QST*R are trademarks of Delta Diagnostics (UK) Ltd. GENEMARKER is a trademark of Softgenetics Corporation. GENEMAPPER, GENESCAN, NED, VIC, PET, POP-7, LIZ and HI-DI are trademarks of Life Technologies Corporation. Note to purchaser: Limited License This product is sold pursuant to an agreement with Life Technologies Corporation. The purchase of this product conveys to the buyer the non-transferable right to use only the purchased amount of the product and its components for human in-vitro diagnostics, solely for the indication described in the accompanying instructions for use. For information on obtaining additional rights to use this product or its components, please contact [email protected]. Copyright 2015 Delta Diagnostics (UK) Ltd. ANE21BYEN 002 OCT-2015 Page 40 of 40