1
Iglesias et al.
column, Distribution of minerals (%), Hydrothermal
alteration log, Texture log, and Homogeneization
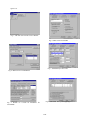
temperature log. These graphs present variables vs. depth.
Users are allowed to select depth ranges for presentation.
In Distribution of minerals (%) users must chose mineral
types among Essentials, Accessories, Primary opaque,
Secondary transparent, and Neoformed. Each type is
presented in a separated graph. Users then have to select
which of the existing minerals in the chosen depth interval
to present in that graph. Logs of the selected existing
minerals are presented side by side for the chosen depth
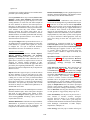
interval (Fig. 5).
offered only the first two options just mentioned. Finally,
when selecting fed by "superheated steam", users are
presented five choices: TD (D'Amore and Panichi, 1980),
TCO2 (Arnorsson, 1985), TH2S (Arnorsson, 1985), TH2
(Arnorsson, 1985) and TFT (Fischer-Tropsch;
Arnorsson,1985). The results may be displayed in the
screen, saved to a file, printed in a report or plotted.
(iii) Provides a comprehensive set of
gas
geothermometers: D'Amore and Panichi's (1980) and five
gas geothermometers from Arnorsson and Gunlaugsson
(1985), TCO2, TH2S, TH2, TCO2/H2 and TH2S/H2.
Results may be displayed in the screen, saved to a file or
printed. They are presented by sample date and
geothermometer.
Within Drilling six types of graphs are offered. These are:
Lost circulation log, Lithology log, Well completion,
Temperature log, Pressure log and Heating rate log. In
Well completion one may select which of the recorded
completions (e.g., the original one, the one after the first
recompletion, etc.) to visualize. Heating rate logs are
automatically computed from sequences of temperature
logs obtained during the heating stage of the well. Users
must select which of the available logs to include in the
computations.
(iv) It is designed to compute a comprehensive set of
liquid phase geothermometers. The silica geothermometer
(Fournier and Potter, 1982); the Cationic Composition
Geothermoemeter (Nieva and Nieva, 1987); and four Na-K
geothermometers: Na/K (Truesdell, 1975), Na/K (Fournier,
1979), Na-K-Ca (Fournier and Truesdell, 1973) and Na-KCa corrected by Mg (Fournier and Potter, 1979). Results
may be presented in the screen, saved to a file, printed or
plotted.
2.2 The GEOQUIM toolbox
2.3 The ANAPPRES toolbox
This toolbox is described in some detail in Iglesias et al
(1998). Due to space limitations here we describe it
briefly.
This is an intelligent system for automatic analysis of
pressure well test. Interference tests with any number of
observation, active and dual wells with variable flowrates
can be analyzed, as well as drawdown tests with variable
flowrates. Previous versions of ANAPPRES
were
presented by Arellano et al. (1990a, 1990b, 1989).
GEOQUIM performs four types of standard geochemical
computations: (i) equilibrium distribution of species in the
reservoir; (ii) Cl- concentration in total discharge and in
reservoir liquid; (iii) gas geothermometers; and (iv) liquid
phase geothemometers.
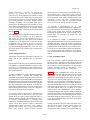
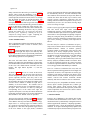
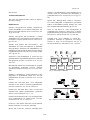
Figure 4 presents ANAPPRES main screen. The active
database is shown in the upper left window (cprieto97.mdb
in this case). All the pressure test logs in the active
database are automatically presented, either in the list of
observation wells (left) or in that of the active wells (right).
These show, from left to right, a column for selecting logs,
the name of the well and the log's identifier. Dual logs,
those with both pressure and flowrate records, are shown
in both lists. The range of dates covered by the selected
logs (those marked with an "X") is shown in two small
windows below that displaying the active database.
Changing the range of dates narrows, widens or displaces
in time the lists of active and observation logs, to facilitate
selection. Under each list is a button that presents detailed
information about the selected well/log . Here users may
review the corresponding data list or plot it (pressing the
button under the list).
(i) These computations are based on EQQYAC (Barragán
and Nieva, 1989), a program that calculates the
equilibrium distribution of inorganic aqueous ion species
in geothermal reservoirs from the chemical composition of
discharged fluids and in situ physical measurements. The
required reservoir temperature is automatically computed
from the composition of the discharge, by means of a
liquid phase geothermometer. For greater flexibility, we
plan to add an option to assign a reservoir temperature,
bypassing the geothermometer calculation.
(ii) One may select to compute the Cl- concentration in
total discharge and/or in the reservoir. Users are asked
whether the well is fed by liquid, liquid and steam or
superheated steam. Then they are presented with choices
of relevant geothermometers to compute deep
temperatures, depending on how the well is fed. Selecting
"liquid" elicits three options: Cationic Composition
Geothermometer (Nieva and Nieva, 1987), Na-K-Ca
(Fournier and Truesdell, 1973) or silica (Fournier and
Potter, 1982). If fed by "liquid and steam" users are
Clicking the button in the lower right of the main screen
runs the expert system. First the system searches for
interference between wells and computes the
corresponding values of transmissivity and storativity, by
4045