1
Menus
121
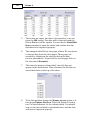
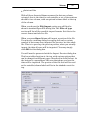
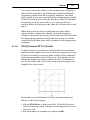
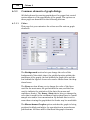
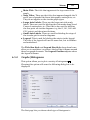
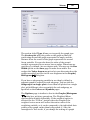
The box marked Variable on the left hand side lists all the
circular variables in the data file. For most analyses and graphs
all of them will initially be ticked, indicating that they will be
used in the analysis or graph. You can remove a variable from
analysis by clearing the checkbox. Oriana will remember the
selection state of the variables during the current analysis
session so that you don’t need to reset them for every analysis
and graph.
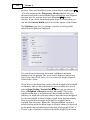
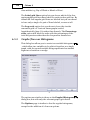
In the above example a file with paired data 20 is being used
and the Raw option at the top is selected. If your data have
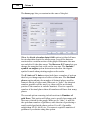
been entered directly in the spreadsheet as frequency data 22
you can select the Frequency option, then select the two
variables with your circular data and the associated frequencies,
like this: