1
WaveGuide - Water Level
User Manual
WaveGuide - Water Level
User Manual
Applicable for product no.
WG-WL67-SS
WG-WL19-SS
Version 3.1
17th of Mar. 2015
Radac B.V.
Elektronicaweg 16b,
2628 XG Delft,
The Netherlands.
tel: +31(0)15 890 3203
e-mail: [email protected]
website: www.radac.nl
Preface
This user manual and technical documentation is intended for engineers and technicians
involved in the software and hardware setup of the WaveGuide Water Level system.
Note
All connections to the instrument must be made with shielded cables with exception of the
mains. The shielding must be grounded in the cable gland or in the terminal compartment
on both ends of the cable. For more information regarding wiring and cable specifications,
please refer to Chapter 2.
Legal aspects
The mechanical and electrical installation shall only be carried out by trained personnel
with knowledge of the local requirements and regulations.
The information in this installation guide is the copyright property of Radac BV.
Radac BV disclaims any responsibility for personal injury or damage to equipment caused
by:
• Deviation from any of the prescribed procedures.
• Execution of activities that are not prescribed.
• Neglect of the general safety precautions for handling tools and use of electricity.
The contents, descriptions and specifications in this installation guide are subject to change
without notice. Radac BV accepts no responsibility for any errors that may appear in this
installation guide.
Additional information
Please do not hesitate to contact Radac or its representative if you require additional
information.
Contents
Preface
Introduction
1
1 Radar positioning and installation
1.1 Safety notes . . . . . . . . . . . . . . . . . . . . . . . . . . . . . . . . . . . .
1.2 Positioning . . . . . . . . . . . . . . . . . . . . . . . . . . . . . . . . . . . .
1.3 Installation . . . . . . . . . . . . . . . . . . . . . . . . . . . . . . . . . . . .
3
3
4
5
2 Wiring
2.1 WaveGuide radar . . . . . . . . . . . . . . . . . . . . . . . . . . . . . . . . .
2.2 WaveGuide server . . . . . . . . . . . . . . . . . . . . . . . . . . . . . . . . .
2.3 Separate radar power supply . . . . . . . . . . . . . . . . . . . . . . . . . .
6
6
7
8
3 WaveGuide system commissioning
Step 1. Connect the WaveGuide server to a computer
Step 2. Become an authorized user . . . . . . . . . . .
Step 3. Enable expert mode . . . . . . . . . . . . . . .
Step 4. Set sensor parameters . . . . . . . . . . . . . .
Step 5: Perform a system check . . . . . . . . . . . . .
Step 6: Set system date and time. . . . . . . . . . . .
Step 7: Configure the distribution of data . . . . . . .
.
.
.
.
.
.
.
9
10
11
11
12
13
15
16
4 Using the system
4.1 Calculated parameters . . . . . . . . . . . . . . . . . . . . . . . . . . . . . .
4.2 Data logging . . . . . . . . . . . . . . . . . . . . . . . . . . . . . . . . . . .
18
18
18
Appendix 1: System parameters
20
Appendix 2: System specifications
21
.
.
.
.
.
.
.
.
.
.
.
.
.
.
.
.
.
.
.
.
.
.
.
.
.
.
.
.
.
.
.
.
.
.
.
.
.
.
.
.
.
.
.
.
.
.
.
.
.
.
.
.
.
.
.
.
.
.
.
.
.
.
.
.
.
.
.
.
.
.
.
.
.
.
.
.
.
.
.
.
.
.
.
.
.
.
.
.
.
.
.
.
.
.
.
.
.
.
Introduction
The WaveGuide Water Level system is a highly accurate water and tide level gauge which
is compact, robust and easy to install.
The WaveGuide Water Level system consists of:
• A WaveGuide radar mounted above water level.
• A WaveGuide server installed in a control room or a terminal box.
The WaveGuide radar is a low power X-band radar that measures the distance between
the water surface and the radar antenna with an accuracy of < 1 [cm]. The resulting
information is passed to the WaveGuide server for processing and analysis.
The WaveGuide server collects the measured data from the WaveGuide radar unit, performs
the necessary data analysis and provides water level and tide information on both a physical
user interface and a web-based interface. The WaveGuide server also facilitates data storage
and data broadcasting.
Warning
Do not use the instrument for anything else than its intended purpose.
This manual consists of 4 chapters. Chapter 1, specifies the radar positioning criteria
for optimal measurement quality. Chapter 2, illustrates the mounting and installation
procedure. Chapter 3, describes the commissioning of the system via the user interface.
Chapter 4, explains data processing, data presentation and data distribution within the
system.
Please refer to Appendix 1, for a list of measured and calculated parameters. And to
Appendix 2, for specifications, information about certification and environmental conditions
applicable to the WaveGuide Water Level system.
1
Chapter 1
Radar positioning and installation
1.1
Safety notes
The personnel installing the WaveGuide system must have basic technical skills to be able
to safely install the equipment. When the WaveGuide system is installed in a hazardous
area, the personnel must work in accordance with the (local) requirements for electrical
equipment in hazardous areas.
Caution
Modification to the instrument may only be carried out by trained personnel that are
authorized by Radac BV. Failure to adhere to this will invalidate the approval certificate.
Warning
In hazardous areas it is compulsory to use personal protection and safety gear such as:
hard hat, fire-resistive overall, safety shoes, safety glasses and working gloves.
Avoid possible generation of static electricity.
Use non-sparking tools and explosion-proof testers.
Make sure no dangerous quantities of combustible gas
mixtures are present in the working area.
Never start working before the work permit has been signed by all parties.
Warning
Make sure that all power to the instrument is switched off before opening the covers of the
WaveGuide radar. Failure to do so may cause danger to persons or damage the equipment.
All covers of the WaveGuide radar must be closed before switching on the power.
3
1.2
Positioning
For obtaining the best results from a WaveGuide Water Level
system a number of radar positioning criteria must be taken
into account:
• It is advised to choose a mounting position such that the
WaveGuide radar beam is free of large reflecting obstacles
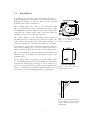
(the beam of the F08 antenna can be approximated to a
conical shape having a 5◦ [deg] half top angle as shown
in Fig. 1.1). The minimum horizontal distance between
a radar and any obstacle in the beam’s path should be
at least 10% of the vertical distance between the radar
and the obstacle. This does not only include horizontal
objects in the beam’s path but also vertical structures.
• Any structure that the WaveGuide radar is mounted to
might have some influence on the water flow around it.
Hence, it is advised to mount the radar at a position facing
the mean flow direction so that the radar can measure the
least disturbed water surface.
• The reference level for the mounting height of the radar
is shown in Fig. 1.2.
Figure 1.1: The 5o [deg] half
top angle of the F08 antenna
• A vertically mounted radar (0◦ [deg] tilt angle) results beam.
in optimal performance. But if necessary the WaveGuide
radar can be mounted with a maximum tilt angle of 15◦
[deg] (tilted to face the direction away from the structure
it is mounted on).
Figure 1.2: The reference level
for mounting height measurement.
4
1.3
Installation
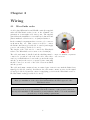
To facilitate the mounting of the WaveGuide radar, an optional mounting plate is available upon request (Part no.
WG-MP-SS). Figure 1.3 shows a sketch of the optional
mounting plate and its dimensions.
The mounting plate can be fixed to two horizontal beams
(Fig. 1.4). The length of the beams must take into account
the minimum horizontal distance between the WaveGuide
radar and any obstacles in the path of the radar signal (as
explained in the radar positioning criteria).
The outside diameter of the WaveGuide radar cylinder is Figure 1.3: Optional mounting
219 [mm] and the total height of the radar is 253 [mm]. The plate for the WaveGuide radar
radar cylinder has a flange (265 [mm] diameter) that con- (Part no. WG-MP-SS).
tains 4 mounting holes each having a diameter of 11 [mm].
It is advised to mount the horizontal beams first. Then to
attach the mounting plate to the horizontal beams and finally to mount the WaveGuide radar to the mounting plate.
The optional mounting plate has 4 threaded mounting holes
(M10 thread) for mounting the WaveGuide radar to the
mounting plate.
Upon request, Radac can supply an optional frame (Part
no. WG-MH-SS) that allows for mounting the WaveGuide
radar and mounting plate at angles 0, 5, 10, 15 and 20 [deg]
away from vertical (see Fig.1.5). The radar mounting plate
(Part no. WG-MP-SS) is included with this frame as well Figure 1.4: Top view of the horizontal mounting beams.
as brackets to allow mounting the frame to a handrail.
Figure 1.5: Optional frame that allows mounting of the WaveGuide
radar at different angles (Part no.
WG-MH-SS).
5
Chapter 2
Wiring
2.1
WaveGuide radar
A cable gland (IP68-10bar and IP69K certified) is supplied
with each WaveGuide radar for use on the terminal compartment as a watertight cable entry point. The supplied
gland allows the installation of non-armoured elastomer and
plastic insulated cables from 8 to 15 [mm] in diameter.
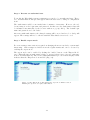
In the terminal compartment there is a five pole connector
as shown in Fig. 2.1. This connector is used to connect
the RS485 data wires (poles labeled 1, 2 and 3) and supply
power to the radar (poles labeled + and -).
The length of the cable used to connect the WaveGuide
radar to the WaveGuide server can not exceed 1200 [m].
The cable used must be shielded and the shielding must be Figure 2.1: Terminal compartment
connected to ground at both ends of the cable. Since there and connections.
can be a potential difference between the ground at the radar
and the ground at the server, a capacitor (10 to 100 [nF])
should be used on one side of the cable between its shield
and the ground.
The cable used must contain at least one twisted pair of wires for use with the RS485 data
signal (poles labeled 1 and 2). In addition, the cable must contain one wire for the signal
ground (pole labeled 3) and two wires for supplying power from the WaveGuide server to
the WaveGuide radar (poles labeled + and -).
Warning
Improper installation of the cable gland will invalidate the IP67 approval of the
WaveGuide radar.
Warning
Safety depends on proper grounding. Check the resistance of the ground connection
directly after installation. The measured ground resistance shall be below the maximum
prescribed by local grounding requirements.
6
2.2
WaveGuide server
For ease of use, the connector poles common between the WaveGuide server and radar are
marked using the same labeling symbols.
Figure 2.2: Connector panel on the WaveGuide server.
In addition to the connectors used for connecting the WaveGuide radar, the connector panel
of the WaveGuide server includes the following connectors,
• COM1: Reserved service port.
• COM2: Serial port for data output via a RS-232 connection.
• COM3: Serial port for data output via a RS-232 connection.
• LAN port: Ethernet access to the server.
Note
Each COM port is connected in parallel to both the DE-9 connector and the terminal
block connector. Hence, only one of the two types of connectors needs to be used per
COM port.
When the radar is powered through the server, then the power supply for the server must
be 24-36 [VDC]. Please do take care of the voltage drop due to wire resistance between the
server and the radar. The power supply to the WaveGuide radar is controlled by the power
switch on the WaveGuide server.
7
2.3
Separate radar power supply
In some cases it is more convenient to use a separate power supply to power the WaveGuide
radar (as shown in Fig. 2.3) rather than supplying it with power from the server side (as
shown in Fig. 2.4). In that case a 24-64 [VDC] power supply can be used on the WaveGuide
radar side to supply it with 6 [Watt] of power.
If a separate power supply is used for the WaveGuide radar, then the cable used to connect
the WaveGuide server to the WaveGuide radar does not need the extra two wires for
power. In that case, three wires in the cable between the WaveGuide server and radar will
be sufficient (one twisted pair and a signal ground wire).
In the case that a separate power supply is used to power the radar, then the server can be
supplied with a power supply of 9-36 [VDC].
Figure 2.3: Diagram showing connection between the WaveGuide
server and radar when radar is powered seperatly from server.
Figure 2.4: Diagram showing connection between the WaveGuide
server and radar when radar is powered by server.
8
Chapter 3
WaveGuide system commissioning
With all the wiring in place as described in the previous chapter, the server can be configured
using the following steps (explained in the current chapter):
1. Connect the WaveGuide server to a computer.
2. Become an authorized user.
3. Enable expert mode.
4. Set radar sensor parameters
5. Perform a system check.
6. Set system date/time.
7. Configure the distribution of data.
The display on the server shows system information and measured parameters and is controlled using,
• Button 1: To switch between groups.
• Button 2: To switch between items within each group.
• Button 5: To confirm mounting and unmounting of USB data storage.
The server display contains the following groups and items:
• Parameters
– Scrolls through selected parameters (Appendix 1, Table 1)
• Network
– Host name
– IP address
• System information
– Date and time
– Uptime
– Software version
• USB storage (only appears when USB device is connected)
– State
– Mount USB disk?/ Unmount USB disk?
9
Step 1. Connect the WaveGuide server to a computer
Once the WaveGuide server is connected to a Local-Area-Network, communication with the
WaveGuide server can be done via the available web-interface (Fig. 3.1). For this purpose
any web browser with JavaScript enabled can be used.
Figure 3.1: The web interface of the WaveGuide server.
Note
A computer can be connected to the WaveGuide server directly using a network cable (a
crossover cable is not required).
By default, during startup the WaveGuide server tries to obtain an IP-address by searching
the Local-Area-Network for a DHCP server. If a DHCP server is not found, the WaveGuide
server will use the default IP-address 192.168.111.71.
When the WaveGuide server completes the startup process, its IP-address can be found via
the LCD display (it can take up to 10 minutes for the IP-address to appear). To view the
IP-address, scroll through the menu using button 1 until network information is displayed
and then use button 2 to switch between displaying the Host-Name and the IP-address.
The default IP-address can be modified via the web interface. To access the web-interface,
type the IP-address indicated on the LCD display (e.g. http://192.168.111.71) in the address line of your Internet browser. Note, that your computer must be on the same IPaddress subnet as the WaveGuide server that you are trying to connect to.
Link
Description
Measurements
Parameters
Spectra
Data logger
Sensor raw data
Configure Sensor
Subscriptions
Configure Network
Set Date/Time
Expert Mode
System Info
Measured data plots.
Calculated parameter plots.
Not applicable for Water Level systems.
Access to optional data logger files.
Preview of raw data required for data processing routines.
For defining the sensor configuration and mounting height.
Settings for data distribution.
Allows the user to change the network settings.
WaveGuide server date and time settings.
Allows for editing more settings.
System state overview.
Table 3.1: Description of server links.
10
Step 2. Become an authorized user
To modify the WaveGuide system configuration you need to be an authorized user. Therefore, an authorization dialogue will appear when the user tries to change a configuration
item.
The authorization will become invalid after 5 minutes of inactivity. However, the web
browser may store the login name and password. In that case, the authorization data will
be submitted automatically by the browser without a pop-up dialog. The default login
name and password are both “radac”.
After successful authorization, the changed settings will be stored and a reboot dialog will
appear. The settings will not be effective until the WaveGuide server is rebooted.
Step 3. Enable expert mode
For some settings extra caution is required as changing them can can lead to system malfunctioning. Such settings are hidden from the regular menus and can be accessed by
enabling the expert mode.
The expert mode can be enabled by clicking the "enable" button on the "Expert Mode"
page. This will cause an authorization dialog to appear (please refer to Step 2 for information about authorization). After a successful authorization process a list is displayed that
indicates that the "Expert mode is enabled" (Fig. 3.2).
Figure 3.2: The "Expert Mode" link displays the expert mode "Enable" button.
Enabling the expert mode requires authorization.
11
Step 4. Set sensor parameters
The "Configure Sensor" link will display a sensor drop-down menu. Choose "radcan" and
click the "edit" button, this will display the configuration page for the radar sensor (Fig.
3.3).
Note
For normal operation, do not change the sensor "Name", "Sample rate",
"Sweep size", "Antenna offset" or "Stilling well pipe diameter".
Figure 3.3: The "configure sensor" page will display a sensor drop-down menu. Choose
"radcan" and click "edit", this will display the configuration page for the radar sensor.
The "Mounting height" is defined as the height of a radar above the reference water level
in [cm]. The reference point for measuring the height of each radar sensor is the lower-side
of the radar case (see Fig. 1.2). By default, the mounting height is set to zero [cm].
The tilt angle of the WaveGuide radar, or the "Angle with vertical", is measured in [deg]
and by default is set to zero [deg].
The "Range Maximum" is the maximum distance in meters, at which the radar will detect
the water level. It is advised (but not necessary) to set this parameter to a value lower
than two times the distance from the radar to the lowest expected water level. This is to
avoid detecting multiple echoes of the same measurement sweep.
The "Range Minimum" is the minimum distance in meters, at which the radar will detect
the water level. This parameter is used to avoid spurious measurements and should be set
depending on the installation location. If there are any nearby surfaces that can reflect the
radar signal, the "Range Minimum" should be set to a value higher than the distance to
those reflecting surfaces. The "Range Minimum" parameter must not be lower than 2.0 [m]
to avoid interference with the internal reflection in the radar antenna.
The "Signal Minimum" is the lower limit for the signal power that will be considered in
water level measurements. This parameter should be set to 20 [dB] in the case of a vertically
mounted radar and set to 5 [dB] in the case of a tilted radar.
Rebooting the system is required after changing the radar sensor parameters for the changes
to take effect. The reflection diagram of the radar should be checked to ensure that the
water level measurement is within the defined limits (More information can be found in
"Step 5.2: Check the raw sensor data").
12
Step 5: Perform a system check
This section explains how to inspect the quality of measurements after configuring and
rebooting the WaveGuide server (the start-up process can take up to 5 minutes):
Step 5.1: Check the system Info page
The bottom most table on the system info page, displays the radar status (as shown in Fig.
3.4). The communication status "INIT" indicates that the WaveGuide server is initiating
the communication data stream from the WaveGuide radar. Once a communication process
is initiated the displayed status becomes "OK".
Figure 3.4: System information.
In the same table, the ratio between the number of performed and invalid measurements
gives an indication of the system performance. When the system is setup in a correct manner, the number of invalid measurements should be below 10% of the number of performed
measurements. However, during the startup and communication initiation processes the
number of invalid measurements can grow to over 1000 (temporarily increasing the ratio between invalid measurements and performed measurements). After the initial invalid
measurements the increase in the number of invalid measurements will be very limited.
13
Step 5.2: Check the raw radar data
The reflection diagram for the radar sensor can be accessed via the "Sensor Raw Data" link
by selecting "Radcan" and clicking on the "Request" button (Fig. 3.5).
A reflection diagram is a graphic representation of a 25 [ms] scan, where the signal strength
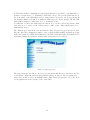
[dB] is plotted against the measured distance [m]. A scan consists of one up-sweep (increasing frequency, red curve) and one down-sweep (decreasing frequency, blue curve).
It is normal to have several peaks in a reflection diagram (as shown in Fig. 3.5). Those
peaks do not affect the performance of the system and are caused by the multiple signal
reflections between the radar, the water surface and any objects within the radar’s footprint.
Figure 3.5: The "Sensor Raw Data" page and the reflection diagram of the radar sensor.
Based on a one minute history of measured water level, the WaveGuide system calculates an
expected minimum and maximum water level for the next measurement. The values for the
expected minimum and maximum levels are shown on the reflection diagram using vertical
green lines. A horizontal green line shows the minimum expected reflection strength (the
value set as the Signal Minimum [dB] parameter).
The three green lines together form a region of acceptable values for the current measurement and any values outside of it are ignored. The highest peak in the region bounded by
the green lines, is considered to represent the distance to the water surface. The region of
acceptable values is automatically updated when persistent reflections occur outside this
region.
Step 5.3: Check measurements
On the "Measurements" page, the data measured during the last 1, 3 or 10 minutes can be
viewed. Please inspect the available graphs to visually confirm measured heave data.
14
Step 6: Set system date and time.
Some customers choose to use their own facilities to log the time at which data points are
collected. However, for the highest level of accuracy the WaveGuide server is capable of
adding time stamps to measured data points.
The current date and time can be set using the "Set Date/Time" page (Fig. 3.6). The date
and time are kept by an on-board clock (with battery back-up). Please be aware that such
on-board clocks are not very accurate and can drift over the years while the system is used.
If the system is connected to a network and has access to the Internet, then it will automatically synchronize the time and date with an Internet time server. It is advised to set the
initial date and time as accurately as possible. Because the automated time adjustment
uses small incremental steps. As a result it can take a considerable amount of time to
correct a large time difference. After changing the system time or date, the WaveGuide
server must be rebooted.
Figure 3.6: Setting the system time and date.
If the WaveGuide system is not connected to the Internet but instead connected to a
local network that includes a time server, then the WaveGuide server can be adjusted to
synchronize time and date with the local time server. For more information regarding such
an adjustment please contact Radac.
15
Step 7: Configure the distribution of data
The WaveGuide server can transmit measured and calculated data via its serial ports
(COM2 and COM3) and via its network link to several network addresses. In the "Subscriptions" page (Fig. 3.7), the existing subscriptions can be removed or modified and new
ones can be added. Simultaneous subscriptions are possible.
Figure 3.7: Example list of defined subscriptions.
The address for a serial port subscription should have the following format: “port", "baudrate", "number of data bits", "number of stop bits", "parity", "handshake”. For example,
COM2,9600,7,1,EVEN,NONE.
If the address string is not complete the default values will be used. For example, COM2,9600
will be interpreted as COM2,9600,8,1,NONE,NONE.
The format for a network port address is: "http://ip address:port". For example,
http://192.168.111.103:8032.
The format of the output string can be chosen from the drop-down menu. Four message
format options are available, Radac (default), KMA, SESAM and FGTI.
After modifying or creating a new subscription, click the "update" button and authorize
the changes. This will change and store the settings and implement the subscription (no
system reboot is required).
Radac message format
The Radac format starts a new line for each parameter in the subscription. The time
used in the Radac format is Unix Epoch time in milliseconds (UTC time in milliseconds
since 00:00:00 on the 1st of January 1970). Each line in the Radac format starts with a
Carriage-Return character (char13) and ends with a Line-Feed character (char10). When a
parameter is disapproved or not available the string "NaN" is inserted instead of the actual
value (NaN stands for Not a Number). An example of the output strings in the Radac
format is,
time=1157359800206;sensor=radcan;H1=-319.9429cm;
time=1157359259847;sensor=radcan;Hm0=1.2517135cm;
time=1157359860268;sensor=radcan;H1=NaNcm;
16
KMA message format
Modifications can be made upon request. For example, the Korean Meteorological Administration (KMA format) preferred a readable time format in the Korean time zone. An
example of the output strings in the KMA format is,
time=2006/09/04 17:58:00;H1=-319.70026cm;
time=2006/09/04 17:48:59;Hm0=1.3314528cm;
time=2006/09/04 17:59:00;H1=NaNcm;
SESAM message format
The SESAM format, used by the Dutch Ministry of Infrastructure and the Environment
(Rijkswaterstaat), is only defined for the heave and the 10 second mean (H parameter). It
consists of 8 character lines (Line-Feed character + status character + sign character +
4 character value in cm + Carriage-Return character). For a regular message the status
character is a space. If an error occurs the status character becomes a letter A. An example
of the output strings in the RWS format is,
+0001
- 0004
A+9999
17
Chapter 4
Using the system
4.1
Calculated parameters
Once the system is commissioned the facilities of raw data presentation, reflection diagram,
system info etc. can be used to monitor the proper operation of the system.
The instantaneous water level information is available in the form of heave. Which, can be
found on both the "Measurements" page of the systems web interface and the physical user
interface.
Average water level is calculated by averaging the radars measurements over periods of 10
[sec], 1, 5 or 10 [min] (parameters H, H1, H5, and H10 consecutively). A representation
of the water level variation is available in the form of the parameter Hm0 which is the
standard deviation of the heave measurements over a 20 minutes period.
All parameters that are calculated over a time period get a time stamp that is in the center
of the time period used to calculate them. The calculated parameters can be viewed on
both the "Parameters" page of the systems web interface and the physical user interface.
The selection of parameters that are displayed on the user interface can be modified by
Radac upon request.
4.2
Data logging
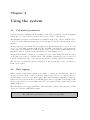
When ordering a WaveGuide system it is possible to request an optional USB connector
on the server side. Such a connector allows a USB storage device to be easily mounted to
the WaveGuide server for easy data logging. But without taking additional precautions,
USB storage is not a safe method for archiving data. Since power failures can damage USB
devices, it is advised to use an Uninterrupted Power Supply (UPS) together with a high
quality USB device.
The WaveGuide server supports FAT32 , Ext2 and Ext3 formats. The majority of USB
devices are delivered with FAT32 format.
Note
The USB device used must not be formatted using NTFS.
18
A USB drive must be manually mounted when first used, and will be automatically remounted on system reboot. Mounting a USB drive can be done via the push buttons on
the front panel of the WaveGuide server. Using button "1" scroll to the storage menu. If
the message" Disk not mounted" is displayed click button "2". If the message "Mount USB
disk? OK" is displayed. Click button "5" to mount the device.
To unmount or remove the disk safely, use button "1" to scroll to the storage menu. Then
click button "2" to arrive at the "Safely remove? OK" option. Then Click button "5" to
unmount the device.
The "Data Logger" page in the web user interface (Fig. 4.1) gives access to the stored data.
Also the data can be transferred easily to other computers using an FTP application. Login
name and password for FTP file transfers are the same as the user-name and password for
modifying settings (by default both user-name and password are "radac").
Figure 4.1: Data logger page.
The folder structure used is one directory per system. In this directory, sub-directories are
created that contain the raw data and parameter files (one file per day per parameter).
If the drive is full, a delete mechanism starts. This allows the system to store the most
recent parameters at the expense of the oldest data.
19
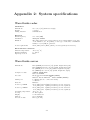
Appendix 1: System parameters
Table 1, describes all the parameters measured and calculated by the WaveGuide Water
Level system.
Name
Description
Unit
heave
Ngd_zP
Instantaneous water level raw data at 2 or 2.56 [Hz]
Percentage of data points that do not contain error code before pre-processing
cm
%
H
H1
H5
H10
Hm0
Average height over last 10 seconds
Average height over last 1 minute
Average height over last 5 minutes
Average height over last 10 minutes
4 x the standard deviation of water level during lats 20 minutes
cm
cm
cm
cm
cm
Table 1: Default parameters
20
Appendix 2: System specifications
WaveGuide radar
Mechanical
Dimensions
Weight
Casing material
Electrical
Radar frequency
Modulation
Emission
Power requirements
26.5 x 25.3 [cm] (diameter, height)
≈ 12 [kg]
Stainless Steel
9.9 – 10.2 [GHz]
Triangular FMCW
The emitted microwave energy is far below acceptable limits for exposure
of the human body. Depending on the type of antenna, a maximum
radiation of 0.1 [mW] is generated.
24-64 [VDC] and 6 [Watt] (when powered separately from server).
Environmental conditions
Ambient temperature
-40 to 60 [o C]
Relative humidity
0 – 100 %
Ingress protection
IP67
WaveGuide server
Dimensions
Computer boards
Processor
COM ports
Network
Power req. GENE
Power req. TITAN
Operating temperature
Cooling
Display
Memory
Protection class
IP67 (GENE) 19 x 19 x 18 [cm] (width, height and depth).
IP67 (TITAN) 19 x 19 x 13 [cm] (width, height and depth).
19" (GENE) 48 x 9 x 28 [cm] (width, height and depth).
19" (TITAN) 48 x 9 x 21 [cm] (width, height and depth).
AAEON, GENE-TC05.
Eurotech, TITAN.
Intelr AtomTM E620T 600MHz (GENE).
Marvellr XScale PXA270TM RISC 520MHz (TITAN).
1 x RS485 (used to connect the radar).
3 x RS232.
Ethernet
24-36 [VDC] and 12 [Watt] if radar is powered via server.
9-36 [VDC] and 6 [Watt] if radar is powered separately.
24-36 [VDC] and 8 [Watt] if radar is powered via server.
9-36 [VDC] and 2 [Watt] if radar is powered separately.
-40 to 85 [o C]
No fan required
2 x 20 characters
On board flash
IP67 (optional)
21
General system specifications
Sampling rate
Measurement range
Water level accuracy
Product number:
WG-HT19-SS
WG-HT67-SS
2.56 [Hz]
2 - 75 [m]
< 1 [cm]
for a 19"-rack server and a stainless steel radar enclosure.
for a IP67 server and a stainless steel radar enclosure.
22