1
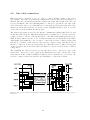
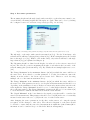
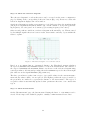
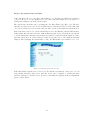
WaveGuide - Direction
Ex. Certified
User Manual
WaveGuide - Direction
User Manual
Applicable for product no.
WG-DR67-EX
WG-DR19-EX
Version 3.2
16th of Mar. 2015
Radac B.V.
Elektronicaweg 16b,
2628 XG Delft,
The Netherlands.
tel: +31(0)15 890 3203
e-mail: [email protected]
website: www.radac.nl
Preface
This user manual and technical documentation is intended for engineers and technicians
involved in the software and hardware setup of the Ex. certified version of the WaveGuide
Direction system.
Note
All connections to the instrument must be made with shielded cables with exception of the
mains. The shielding must be grounded in the cable gland or in the terminal compartment
on both ends of the cable. For more information regarding wiring and cable specifications,
please refer to Chapter 2.
Legal aspects
The mechanical and electrical installation shall only be carried out by trained personnel
with knowledge of the local requirements and regulations for installation of explosion-proof
equipment in hazardous areas.
The information in this installation guide is the copyright property of Radac BV.
Radac BV disclaims any responsibility for personal injury or damage to equipment caused
by:
• Deviation from any of the prescribed procedures.
• Execution of activities that are not prescribed.
• Neglect of the general safety precautions for handling tools and use of electricity.
The contents, descriptions and specifications in this installation guide are subject to change
without notice. Radac BV accepts no responsibility for any errors that may appear in this
installation guide.
Additional information
Please do not hesitate to contact Radac or its representative if you require additional
information.
Contents
Preface
Introduction
1
1 Radar positioning and installation
1.1 Safety notes . . . . . . . . . . . . .
1.2 Positioning . . . . . . . . . . . . .
1.3 The point array . . . . . . . . . . .
1.4 The line array . . . . . . . . . . . .
1.5 The triangle array . . . . . . . . .
.
.
.
.
.
.
.
.
.
.
.
.
.
.
.
.
.
.
.
.
.
.
.
.
.
.
.
.
.
.
.
.
.
.
.
.
.
.
.
.
.
.
.
.
.
.
.
.
.
.
.
.
.
.
.
.
.
.
.
.
.
.
.
.
.
.
.
.
.
.
.
.
.
.
.
.
.
.
.
.
.
.
.
.
.
.
.
.
.
.
.
.
.
.
.
.
.
.
.
.
.
.
.
.
.
.
.
.
.
.
.
.
.
.
.
3
3
4
7
9
10
2 Wiring
2.1 WaveGuide radar . . . . . . .
2.2 WaveGuide server . . . . . . .
2.3 Three cable connection . . . .
2.4 One cable connection . . . . .
2.5 Separate sensor power supply
.
.
.
.
.
.
.
.
.
.
.
.
.
.
.
.
.
.
.
.
.
.
.
.
.
.
.
.
.
.
.
.
.
.
.
.
.
.
.
.
.
.
.
.
.
.
.
.
.
.
.
.
.
.
.
.
.
.
.
.
.
.
.
.
.
.
.
.
.
.
.
.
.
.
.
.
.
.
.
.
.
.
.
.
.
.
.
.
.
.
.
.
.
.
.
.
.
.
.
.
.
.
.
.
.
.
.
.
.
.
.
.
.
.
.
11
11
12
13
14
15
3 WaveGuide system commissioning
Step 1. Connect the WaveGuide server to a computer
Step 2. Become an authorized user . . . . . . . . . . .
Step 3. Configure the sensors . . . . . . . . . . . . . .
Step 4. Set sensor parameters . . . . . . . . . . . . . .
Step 5: Perform a system check . . . . . . . . . . . . .
Step 6: Set system date and time. . . . . . . . . . . .
Step 7: Configure the distribution of data . . . . . . .
.
.
.
.
.
.
.
.
.
.
.
.
.
.
.
.
.
.
.
.
.
.
.
.
.
.
.
.
.
.
.
.
.
.
.
.
.
.
.
.
.
.
.
.
.
.
.
.
.
.
.
.
.
.
.
.
.
.
.
.
.
.
.
.
.
.
.
.
.
.
.
.
.
.
.
.
.
.
.
.
.
.
.
.
.
.
.
.
.
.
.
.
.
.
.
.
.
.
.
.
.
.
.
.
.
16
17
18
18
20
21
23
24
4 Using the system
4.1 Calculated parameters . . . . . . . . . . . . . . . . . . . . . . . . . . . . . .
4.2 Data logging . . . . . . . . . . . . . . . . . . . . . . . . . . . . . . . . . . .
26
26
26
Appendix 1: System parameters
28
Appendix 2: System specifications
32
.
.
.
.
.
.
.
.
.
.
.
.
.
.
.
Introduction
The principle of operation of a WaveGuide Direction system is based on the synchronized
measurements of sea elevation (heave) at three different spots on the surface of the water.
The slopes around two horizontal and perpendicular axes are calculated using the measured
elevations. Then the correlations between the calculated slopes and the measured heave
values are used to calculate the wave directional information.
The three radar sensors are standard WaveGuide Height radar sensors that are connected
to a WaveGuide Direction server. Each WaveGuide radar sensor measures the distance
between the sensor antenna and the water surface. The WaveGuide server takes care of
data handling (synchronized measurements, processing, distribution and presentation). The
WaveGuide server unit also facilitates commissioning and (remote) servicing of the system.
All facilities are accessible via the built in web-server (running on the WaveGuide server).
The WaveGuide radar sensors are available in two versions:
• A standard Ex. certified version.
• A non Ex. certified stainless steel version, where the antenna and electronics are built
into one stainless steel compact unit. The antenna and electronics are the same in
both versions but the stainless steel version is easier to handle due to its compact
size.
This manual describes the Ex. version of the WaveGuide Direction system.
Warning
Do not use the instrument for anything else than its intended purpose.
This manual consists of 4 chapters. Chapter 1, specifies the criteria of radar sensor positioning for optimal quality of measurements. Chapter 2, illustrates the mounting and
installation procedure. Chapter 3, describes the commissioning of the system via the user
interface. Chapter 4, explains data processing, data presentation and data distribution
within the system.
Please refer to Appendix 1, for a list of measured and calculated parameters. And to
Appendix 2, for specifications, information about certification and environmental conditions
applicable to the WaveGuide Direction system.
1
Chapter 1
Radar positioning and installation
1.1
Safety notes
The personnel installing the WaveGuide system must have basic technical skills to be able
to safely install the equipment. When the WaveGuide system is installed in a hazardous
area, the personnel must work in accordance with the (local) requirements for electrical
equipment in hazardous areas.
Caution
Modification to the instrument may only be carried out by trained personnel that are
authorized by Radac BV. Failure to adhere to this will invalidate the approval certificate.
Warning
In hazardous areas it is compulsory to use personal protection and safety gear such as:
hard hat, fire-resistive overall, safety shoes, safety glasses and working gloves.
Avoid possible generation of static electricity.
Use non-sparking tools and explosion-proof testers.
Make sure no dangerous quantities of combustible gas
mixtures are present in the working area.
Never start working before the work permit has been signed by all parties.
Warning
Make sure that all power to the instrument is switched off before opening the covers of the
WaveGuide radar. Failure to do so may cause danger to persons or damage the equipment.
All covers of the WaveGuide radar must be closed before switching on the power.
Caution
Before opening the cover of the Waveguide Radar,
make sure that the blocking device is removed.
Use a 3 [mm] Allen key.
Caution
Do not damage the thread of covers and WaveGuide radar housing and keep the thread
free of dirt. After opening, grease it lightly with anti seize grease.
When closing, never tighten the covers before the threads are properly engaged. The
covers should be turned counter-clockwise until the thread clicks in place, then turn
clockwise until the covers are fully closed.
After closing the covers, do not forget to place the blocking devices.
3
1.2
Positioning
For obtaining the best results from each WaveGuide radar sensor a number of positioning criteria must be taken into account:
• It is advised to choose a mounting position such that the
WaveGuide radar beam is free of large reflecting obstacles
(the beam of the F08 antenna can be approximated to a
conical shape having a 5◦ [deg] half top angle as shown
in Fig. 1.1). The minimum horizontal distance between
a radar and any obstacle in the beam’s path should be
at least 10% of the vertical distance between the radar
and the obstacle. This does not only include horizontal
objects in the beam’s path but also vertical structures.
• Any structure that the WaveGuide radar sensors are
mounted to might have some influence on the wave flow
around it. Hence, it is advised to mount the radars at a
position facing the mean wave direction so that the radars
can measure the least disturbed water surface.
• The reference level for the mounting height of the radars
is shown in Fig. 1.1.
• Figure 1.2, shows the polarization plane of the signal emitted from a radar antenna. If the WaveGuide radar is
mounted close to a large vertical wall, then the radar
should be mounted such that the polarization plane is
parallel to the wall. That is to minimize the effect of the
wall on the propagation of the signal. Nevertheless, the
horizontal distance between the radar and the wall should
comply with the previous criteria.
Figure 1.1: The 5o [deg] half
top angle of the F08 antenna
beam and the reference level for
mounting height measurement.
• A vertically mounted radar (0◦ [deg] tilt angle) results
in optimal performance. But if necessary the WaveGuide
radar can be mounted with a maximum tilt angle of 15◦
[deg] (tilted to face the direction away from the structure
it is mounted on).
Figure 1.2: Top view of radar antenna and its polarization plane.
4
The working-principle of the WaveGuide Direction system is the measurement of surface
elevation at three different positions using an array consisting of three radars. The array
design criteria are:
• The footprints (measurement points) of the three radars on the sea surface must form
a triangle.
• To obtain directional information of the same quality for all wave directions an equilateral triangle is preferable but not critical.
• The measurement of wave directional parameters is optimal for wave lengths that are
3 to 30 times the array size (distance between the center of two radar footprints). For
example, if the dominant wave periods are between 3 and 10 [sec] long (wave lengths
from 15 to 150 [m] long). Then for such waves, a radar array size of 5 [m] is optimal.
To allow the WaveGuide Direction system to be installed in various locations it was designed
to be mounted in one of three array configurations. All three configurations allow for the
radar array footprint to form an equilateral triangle on the sea surface at mean water level.
• The point array, where the three radars are mounted on a single frame. One radar is
looking vertically downwards. The two other radars are tilted with an angle between
10 and 15 [deg] from vertical in the direction away from the downward looking radar.
In this case the size and position of the array footprints depends on the choice of tilt
angle and the vertical position of the radars (height above actual water level).
• The line array, where the mounting positions of the three radars form a straight line.
The two outside radars are mounted at zero inclination angles and the middle radar
is tilted with an angle between 10 and 15 [deg] in a direction perpendicular to the line
the radars are mounted on. In this case the size and position of the array footprints
depends on the mounting position, the tilt angle and the vertical position of the radars
(height above actual water level).
• The triangle array, where the mounting positions of the three radars form a triangle
and all three radars are mounted at a zero inclination angle (resulting in optimal performance). In this case the size and orientation of the array footprints are determined
only by the horizontal positions of the radars.
5
Figure 1.3: Definitions for WaveGuide Direction systems.
The proper installation of a WaveGuide Direction array of radars requires understanding
the following naming conventions and standards:
• The labeling of a physical radar (A, B or C) is defined by the connector the radar
is connected to on the server. Upon delivery the functional definition of each radar
is the same as the physical radar. In certain cases (e.g. when the radars are not
installed in counter-clockwise orientation) the function of a radar can be assigned to
a different physical radar.
• The positions of the radars A, B and C (functional) must always be in a counterclockwise orientation
• In a line or a point array radar A (functional) must be the middle radar.
• In a line array radar A (functional) must be radar B physical and vice versa.
• The positions of the radars A and C (functional) define the array orientation with
respect to the reference North.
• On the "configure sensor" page of the web-interface the following parameters can be
found (more information about accessing and using the web-interface is available in
Chapter 3):
– Distances between radar sensors (functional).
– Angle between line formed by radars AC (functional) and the reference North.
– Relation between the radar sensor (functional) and the physical radar sensor (the
configuration parameters and reflection diagram of the selected physical radar
sensor).
6
1.3
The point array
The point array has proven to be an easy to install configuration
that requires the smallest amount of space on the supporting
structure. The correct installation requires the radar sensors to
be installed in a counter clockwise manner with radar sensor A
installed as the center and vertical radar sensor.
Upon request, Radac can provide a standard mounting frame
(product no. WG-MD-EX) that allows for easy and accurate
mounting of the system (fig. 1.6). The mounting frame can
be used to mount the three radars together while allowing the
vertical mounting of one radar and the tilted mounting of two
radars (tilted to 15 [deg] from vertical). This results in an array footprint size that is approximately 25% of the mounting
height. Using the array design criteria it can be concluded
that this configuration is optimized for measuring directional
wave parameters for wave lengths that are 0.75 to 7.5 times the
mounting height. For example, a mounting height of 10 [m] is
optimal for wave lengths in the range from 7.5 to 75 [m] (wave
periods from 2.2 to 7 [sec]). While a mounting height of 25 [m]
is optimal for a wave length range from 18.75 to 187.5 [m] (wave
periods from 3.5 to 11 [sec]).
Figure 1.4: Top view of the
three radar positions labeled A,B
and C in an anticlockwise sequence. In this case the labels
apply to the physical radars and
their functional definitions.
Installation
The optional mounting frame (product no. WG-MD-EX) consists of two parts connected to each other by hinges. The mounting frame should be installed on two horizontal beams (the horizontal beams are not included in the mounting frame package).
Figure 1.5 shows the required positions of the mounting holes
along the horizontal beams. Note: when designing and producing the horizontal mounting beams, enough horizontal distance
should be left between the radars and the structure they are
mounted to. That is, to prevent reflections (as explained in the
beginning of this chapter).
If the customer chooses to design and manufacture a frame,
the center of the mounted antennas must form an equilateral
triangle with sides that are at least 45[cm] long to avoid the
collision of the sensor housings (an example sketch is given in
Fig. 1.6).
Figure 1.5: Top view of horizontal beams (distances in [mm]).
7
The images in Fig. 1.7 show the radar array installation sequence. First, the inner part
of the standard mounting frame is fixed to the horizontal beams. Then the three antennas
are mounted. Next, the two outermost radars are mounted to the antennas (a wrench is
provided as part of the optional mounting frame package). Then the outer part of the
frame can be lowered and fixed to the horizontal beams. Finally, the innermost radar can
be fixed (using the provided wrench).
Figure 1.6: The Point Array mounting frame for the WaveGuide Direction radars and their positions (in [mm]).
Figure 1.7: Installation sequence of the standard Point Array mounting frame for the WaveGuide Direction radars.
8
1.4
The line array
As with other array configurations the labeling of a physical radar sensor (A, B or C) is
defined by the connector the radar is connected to on the server. But the Line Array
requires that the physical radar sensor A is set using the web-interface as the functional
radar B and vice versa. This allows tilting the functional radar A (physical radar B) away
from vertical and by doing so forming a triangle with the radar foot prints on the water
surface. The conventions for the radar physical definitions, functional definitions and tilt
angles are shown in Fig. 1.8.
A mounting plate can be used to fix each radar to two horizontal beams at the desired
location (an example sketch of such a plate is given in Fig. 1.9). Upon request, Radac can
supply such a mounting plate (product no. WG-MP-EX). During installation it is advised
to install the mounting plate first, then install the radar antenna and then install the radar.
Upon request, Radac can supply an optional frame (product no. WG-MH-EX) that allows
for mounting a radar at angles 0, 5, 10, 15 and 20 [deg] with the horizontal plane shown in
Fig. 1.10). Each frame includes a mounting plate.
Figure 1.9: Optional mounting plate for an Ex.
certified WaveGuide Radar (product no. WGMP-EX).
Figure 1.8: Top view of the three physical
radars labeled A, B and C. With the functional
definitions labeled A, B and C.
Figure 1.10: Optional frame that allows mounting of the radar at different
angles (product no. WG-MH-EX).
9
1.5
The triangle array
As with other array configurations the labeling of a physical radar sensor (A, B or C) is
defined by the connector the radar is connected to on the server. The mounting positions of
radars A, B and C must be anticlockwise when looking from above (as shown in Fig.1.11).
A mounting plate can be used to fix each radar to two horizontal beams at the desired
location (an example sketch of such a plate is given in Fig. 1.12). Upon request, Radac can
supply such a mounting plate (product no. WG-MP-EX). During installation it is advised
to install the mounting plate first, then install the radar antenna and then install the radar.
Figure 1.12: Optional mounting plate for an
Ex. certified WaveGuide Radar (product no.
WG-MP-EX).
Figure 1.11: The three radar positions are numbered A,B and C in an anticlockwise sequence.
10
Chapter 2
Wiring
2.1
WaveGuide radar
The terminal compartment in a radar has three cable entries as shown in Fig. 2.1. Each entry has a 3/4” NPT
thread. This type of thread forms a fluid-tight seal but it
has the disadvantage that it makes unscrewing of the glands
impossible without causing damage to the thread.
Each radar sensor comes with two M20 cable glands, two
converters to convert from NPT to M20 and two NPT stop
glands. The provided cable glands are explosion proof increased safety (Ex-e) that allow for the installation of nonarmoured elastomer and plastic insulated cables from 7.5 to
11.9 [mm] in diameter.
In the terminal compartment of each WaveGuide radar,
there is a gray connector block as shown in Fig. 2.1. This
connector block is used to connect the RS485 data wires
(poles labeled 1, 2 and 3) and supply power to the radar
(poles labeled + and -).
The housing of each WaveGuide radar has two interconnected ground connections. One in the terminal compartment and one on the outside of the housing.
Figure 2.1: Terminal compartment
and connections.
Warning
Improper installation of cable glands or stopping plugs will invalidate the Ex. approval of
the WaveGuide radar.
Warning
Safety depends on proper grounding. Check the resistance of the ground connection
directly after installation. The measured ground resistance shall be below the maximum
prescribed by local grounding requirements.
11
2.2
WaveGuide server
For ease of use, the connector poles common between the WaveGuide server and radars are
marked using the same labeling symbols.
Warning
It is of utmost importance to keep in mind the positions of the installed WaveGuide
radars with respect to the chosen array type when connecting the radars to the server.
Figure 2.2: Connector panel on the WaveGuide server.
In addition to the connectors used for connecting the WaveGuide radar, the connector panel
of the WaveGuide server includes the following connectors,
• COM1: Reserved service port.
• COM2: Serial port for RS-232 data output.
• COM3: Serial port for RS-232 data output.
• LAN port: Ethernet access to the server.
Note
Each COM port is connected in parallel to both the DE-9 connector and the terminal
block connector. Hence, only one of the two types of connectors needs to be used per
COM port.
When the radar is powered through the server, then the power supply for the server must
be 24-36 [VDC]. Please do take care of the voltage drop due to wire resistance between the
server and the radar. The power supply to the WaveGuide radar is controlled by the power
switch on the WaveGuide server.
12
2.3
Three cable connection
Each cable between the server and a radar sensor, must be a shielded five wire cable with
at least one twisted-wire-pair. The length of each cable can not exceed 1200 [m]. The
cable shielding must be connected to ground at both ends of the cable. Since there can be
a potential difference between the ground at the radar sensor side and the ground at the
server side, a capacitor (10 to 100 [nF]) should be used on one side of the cable between its
shield and the ground.
The twisted-wire-pair is used for the RS-485 communication link (pins labeled 1 and 2). RS485 transceivers use differential signals and need a third wire to provide a reference common
voltage to allow for the interpretation of the differential signal (pin labeled 3). Without this
common reference, a set of transceivers may incorrectly interpret the differential signal.
The remaining two wires out of the five wires in a cable are used for supplying power to
the radar sensor (pins labeled + and -).
Figure 2.3: The three cable connection diagram between the WaveGuide server and radars when the radars are
powered from server.
13
2.4
One cable connection
When it is more convenient to use one cable to connect all three radars to the server
(for example, when the one-point array configuration is used). The cable used must be a
shielded, nine wire cable with at least three twisted-wire-pairs. The length of the cable can
not exceed 1200 [m]. The cable shielding must be connected to ground at both ends of the
cable. Since there can be a potential difference between the ground at the radar sensor side
and the ground at the server side. A capacitor (10 to 100 [nF]) should be used on one side
of the cable between its shield and the ground.
The twisted-wire-pairs are used for the RS-485 communication links (pins labeled 1 and
2). RS-485 transceivers use differential signals and need a third wire to provide a reference
common voltage to allow for the interpretation of the differential signal (pin labeled 3).
Without this common reference, a set of transceivers may incorrectly interpret the differential signal. It is sufficient to use one wire to connect the reference common voltage pins
(labeled 3) of all three radar sensors to the reference common voltage pins (labeled 3) of
the three connectors on the server side (please note that all reference common voltage pins
on the server side and on the radar sensor side must be connected to the reference common
voltage wire).
The remaining two wires are used for power and those can be connected to any of the
radar sensor connectors ( + and - pins) on the WaveGuide server side. On the Side of the
radar sensors an Ex. certified terminal box must be used to split the two power wires, the
reference common voltage wire and the cable shielding to connect the 3 radars.
Figure 2.4: The one cable connection diagram between the WaveGuide server and radars when the radars are powered
from server.
14
2.5
Separate sensor power supply
In some cases it is more convenient to use a separate power supply to power the radar
sensors rather than supplying them with power from the server side. In that case a 24-64
[VDC] power supply can be used on the radar sensor side to supply them with a total of
18 [Watt] of power.
If a separate power supply is used for the radar sensors, then the one cable or three cables
used to connect the server to the radar sensors do not need the extra two wires per cable
for power. Hence, in the one cable solution seven wires will be sufficient and in the three
cable solution three wires per cable will be sufficient.
Figure 2.5: The three cable connection diagram between the WaveGuide server and radars when the radars are
powered from a separate source.
Figure 2.6: The one cable connection diagram between the WaveGuide server and radars when the radars are powered
from a separate source.
15
Chapter 3
WaveGuide system commissioning
With all the wiring in place as described in the previous chapter, the server can be configured
using the following steps (explained in the current chapter):
1. Connect the WaveGuide server to a computer.
2. Become an authorized user.
3. Configure the system.
4. Set sensor parameters
5. Perform a system check.
6. Set system date/time.
7. Configure the distribution of data.
The display on the server shows system information and measured parameters and is controlled using,
• Button 1: To switch between groups.
• Button 2: To switch between items within each group.
• Button 5: To confirm mounting and unmounting of USB data storage.
The server display contains the following groups and items:
• Parameters
– Scrolls through selected parameters (Appendix 1, Table 1)
• Network
– Host name
– IP address
• System information
– Date and time
– Uptime
– Software version
• USB storage (only appears when USB device is connected)
– State
– Mount USB disk?/ Unmount USB disk?
16
Step 1. Connect the WaveGuide server to a computer
Once the WaveGuide server is connected to a Local-Area-Network, communication with the
WaveGuide server can be done via the available web-interface (Fig. 3.1). For this purpose
any web browser with JavaScript enabled can be used.
Figure 3.1: The web interface of the WaveGuide server.
Note
A computer can be connected to the WaveGuide server directly using a network cable (a
crossover cable is not required).
By default, during startup the WaveGuide server tries to obtain an IP-address by searching
the Local-Area-Network for a DHCP server. If a DHCP server is not found, the WaveGuide
server will use the default IP-address 192.168.111.71.
When the WaveGuide server completes the startup process, its IP-address can be found via
the LCD display (it can take up to 10 minutes for the IP-address to appear). To view the
IP-address, scroll through the menu using button 1 until network information is displayed
and then use button 2 to switch between displaying the Host-Name and the IP-address.
The default IP-address can be modified via the web interface. To access the web-interface,
type the IP-address indicated on the LCD display (e.g. http://192.168.111.71) in the address line of your Internet browser. Note, that your computer must be on the same IPaddress subnet as the WaveGuide server that you are trying to connect to.
The WaveGuide server homepage contains 10 links in the menu bar on the left side (Fig.
3.1). Those links are described in Table 3.1.
17
Link
Description
Measurements
Parameters
Spectra
Data logger
Sensor raw data
Configure Sensor
Subscriptions
Configure Network
Set Date/Time
Expert Mode
System Info
Measured data plots.
Calculated parameter plots.
Spectral plots of energy density, mean direction and spreading.
Access to data logger files.
Preview of raw data required for data processing routines.
For defining the array and sensor configuration.
Settings for data distribution.
Allows the user to change the network settings.
WaveGuide server date and time settings.
Allows for editing more settings.
System state overview.
Table 3.1: Description of server links.
Step 2. Become an authorized user
To modify the WaveGuide system configuration you need to be an authorized user. Therefore, an authorization dialogue will appear when the user tries to change a configuration
item.
The authorization will become invalid after 5 minutes of inactivity. However, the web
browser may store the login name and password. In that case, the authorization data will
be submitted automatically by the browser without a pop-up dialog. The default login
name and password are both “radac”.
After successful authorization, the changed settings will be stored and a reboot dialog will
appear. The settings will not be effective until the WaveGuide server is rebooted.
Step 3. Configure the sensors
The "Configure Sensor" page will display a sensor drop-down menu. Choose "dirA" and
click the "edit" button. This will display the configuration page for the directional array
(Fig. 3.2).
Sensor names in the "port RADAR #" drop-down menu (sensor0, sensor1 and sensor2)
should not be altered unless the functions of the radar sensors need to be switched as in
the case of a line array. The physical radar sensors are called RADAR A, RADAR B
and RADAR C according to the connector they are connected to on the server side. The
actual radars must be mounted at positions A, B and C (depending on the chosen array
as explained in Chapter 1). If the radar sensor functionality is switched then the sensor
properties set using the web interface relate to the functional radar sensor A, B or C not
the physical radar sensor A, B or C.
18
Figure 3.2: The "configure sensor" page will display a sensor drop-down menu. Choose "dirA" and click "edit". This
will display the configuration page for the WaveGuide Direction radar sensors.
Fill in the distances between the radar mounting points (as defined by their functional
labels). Next fill in the "Angle-North-AC (deg)". This is the angle between the line formed
by functional radars A and C and the reference North direction. The “preview geometry” button, generates an illustration of the array configuration based on the parameters
provided (see Fig. 3.3).
Figure 3.3: Preview of the array orientation based on user input.
19
Step 4. Set sensor parameters
The mounting height and tilt angle (angle with vertical) for each radar sensor must be set,
even if all three mounting heights and tilt angles are equal. This can be done by clicking
the "configure" button for each sensor respectively (see Fig. 3.2 and 3.4).
Figure 3.4: Setting sensor parameters (changes only take effect after the system is rebooted).
The tilt angle or the angle with vertical is measured in [deg]. For the Point Array, only
radars B and C will have a tilt angle larger than 0 [deg]. In the triangular array, all 3 radars
have a tilt angle of 0 [deg]. While for the in-line array, only radar C will have a tilt angle
larger than 0 [deg] (as explained in Chapter 1).
The "Mounting height" is defined as the height of a radar above the reference water level
in [cm]. The reference point for measuring the height of each radar is the lower-side of the
radar mounting-plate (as shown in Fig. 1.1). By default, the mounting height is set to zero
[cm].
The "Range Maximum" is the maximum distance (in [m]) at which the sensor will detect
the water level. It is advised to set this parameter to a value lower than two times the
distance from the radar to the lowest expected water level. That is to avoid detecting
multiple echoes of the same measurement sweep.
The "Range Minimum" is the minimum distance (in [m]) at which the sensor will detect
the water level. This parameter is used to avoid spurious measurements and should be set
depending on the installation location. If there are any nearby surfaces that can reflect the
radar signal the "Range Minimum" should be set to a value higher than the distance to
those reflecting surfaces. The "Range Minimum" parameter should not be lower than 2 [m]
to avoid interference with the internal reflection in the radar antenna.
The "Signal Minimum" is the lower limit for the signal power that will be considered in
water level measurements. This parameter should be set to 20 [dB] in the case of a vertically
mounted radar sensor and set to 5 [dB] in the case of a tilted radar sensor.
After changing the sensor parameters for the three radar sensors, rebooting the system
is required for the changes to take effect. The reflection diagram of each sensor should
be checked to ensure that the water level measurement is within the defined limits (More
information can be found in "Step 5.1: Check the Reflection Diagrams").
20
Step 5: Perform a system check
This section explains how to inspect the quality of measurements after configuring and
rebooting the WaveGuide server (the start-up process can take up to 5 minutes):
Step 5.1: Check the System Info page
The bottom most table on the system info page, displays the sensor status (as shown in Fig.
3.5). The communication status "INIT" indicates that the WaveGuide server is initiating
the communication process with the radar sensors. Once the communication process is
initiated (a process that can take up to five minutes after reboot) the displayed status
becomes "OK".
Figure 3.5: System information.
In the same table, the ratio between the number of performed and invalid measurements
gives an indication of the system performance. When the system is setup in a correct manner, the number of invalid measurements should be below 10% of the number of performed
measurements. However, during the startup and communication initiation processes the
number of invalid measurements can grow to over 1000 (temporarily increasing the ratio between invalid measurements and performed measurements). The number of invalid
measurement will show a slow increase after the initial invalid measurements.
21
Step 5.2: Check the reflection diagrams
The reflection diagram for each radar sensor can be accessed via the sensor configuration
page by clicking on the corresponding "reflection" button (Fig. 3.2). Please note, that each
reflection diagram is displayed in a new window.
A reflection diagram is a graphic representation of a 25 [ms] scan, where the signal strength
[dB] is plotted against the measured distance [m]. A scan consists of one up-sweep (increasing frequency, red curve) and one down-sweep (decreasing frequency, blue curve).
Often several peaks are visible in a reflection diagram as shown in Fig. 3.6. This is caused
by the multiple signal reflections between radar, water surface and any objects within the
radar foot-print.
Figure 3.6: The reflection diagram of one of the three sensors.
Based on a one minute history of measured distance, the WaveGuide system calculates
an expected minimum and maximum distance for the next measurement. The values for
the expected minimum and maximum distance are shown on the reflection diagram using
vertical green lines. A horizontal green line shows the minimum expected reflection strength
(the value set as the Signal Minimum [dB] parameter).
The three green lines together form a region of acceptable values for the current measurement and any values outside of it are ignored. The highest peak in the region bounded by
the green lines, is considered to represent the distance to the water surface. The region of
acceptable values is automatically updated when persistent reflections occur outside this
region.
Step 5.3: Check measurements
On the "Measurements" page, the data measured during the last 1, 3 or 10 minutes can be
viewed. Please inspect the available graphs to visually confirm measured heave data.
22
Step 6: Set system date and time.
Some customers choose to use their own facilities to log the time at which data points are
collected. However, for the highest level of accuracy the WaveGuide server is capable of
adding time stamps to measured data points.
The current date and time can be set using the "Set Date/Time" page (Fig. 3.7). The date
and time are kept by an on-board clock (with battery back-up). Please be aware that such
on-board clocks are not very accurate and can drift over the years while the system is used.
If the system is connected to a network and has access to the Internet, then it will automatically synchronize the time and date with an Internet time server. Even then it is advised
to set the initial date and time as accurately as possible because the synchronization of date
and time when there is a large difference takes a long time due to the small incremental
changes. After changing the system time or date, the WaveGuide server must be rebooted.
Figure 3.7: Setting the system time and date.
If the WaveGuide system is not connected to the Internet but instead connected to a local
network that includes a time server, then the server can be adjusted to synchronize time
and date with the local time server. For more information regarding such an adjustment
please contact Radac.
23
Step 7: Configure the distribution of data
The WaveGuide server can transmit measured and calculated data via its serial ports
(COM2 & COM3) and via its network link to several network addresses. In the "Subscriptions" page (Fig. 3.8), the existing subscriptions can be removed or modified and new
ones can be added. Simultaneous subscriptions are possible.
Figure 3.8: List of defined subscriptions.
The address for a serial port subscription should have the following format: “port", "baudrate", "number of data bits", "number of stop bits", "parity", "handshake”. For example,
COM2,9600,7,1,EVEN,NONE.
If the address string is not complete the default values will be used. For example, COM2,9600
will be interpreted as COM2,9600,8,1,NONE,NONE.
The format for the network message is: "http://ip address:port". For example,
http://192.168.111.103:8032.
The format of the output string can be chosen from the drop-down menu. Four message
format options are available, Radac (default), KMA, SESAM and FGTI.
After modifying or creating a new subscription, click the "update" button and authorize
the changes. This will change and store the settings and implement the subscription (no
system reboot is required).
Radac message format
The Radac format starts a new line for each parameter in the subscription. The time used
in the Radac format is Unix Epoch time in milliseconds (UTC time in milliseconds since
00:00:00 on the 1st of January 1970). Each line in the Radac format ends with a Line-Feed
character (char10). When a parameter is disapproved or not available the string "NaN" is
inserted instead of the actual value (NaN stands for Not a Number). An example of the
output strings in the Radac format is,
time=1157359800206;sensor=radcan;H1=-319.9429cm;
time=1157359259847;sensor=radcan;Hm0=1.2517135cm;
time=1157359860268;sensor=radcan;H1=NaNcm;
24
KMA message format
Modifications can be made upon request. For example, the Korean Meteorological Administration (KMA format) preferred a readable time format in the Korean time zone. An
example of the output strings in the KMA format is,
time=2006/09/04 17:58:00;H1=-319.70026cm;
time=2006/09/04 17:48:59;Hm0=1.3314528cm;
time=2006/09/04 17:59:00;H1=NaNcm;
SESAM message format
The SESAM format, used by the Dutch Ministry of Infrastructure and the Environment
(Rijkswaterstaat), is only defined for the heave and the 10 second mean (H parameter). It
consists of 8 character lines (Line-Feed character + status character + sign character +
4 character value in cm + Carriage-Return character). For a regular message the status
character is a space. If an error occurs the status character becomes a letter A. An example
of the output strings in the RWS format is,
+0001
- 0004
A+9999
FGTI message format
The FGTI format used by the Belgium government. Where one string is used for all required
information (parameters + spectrum) per processing interval. The chosen parameters are
separated by a semicolon (;) and the 51 spectrum values (czz10) are included. The “NaN”
string is replaced with a “-9999” string. An example of the output string in the FGTI
format is,
time=1159898219628;sensor=radcan;H1/3=0.101608045cm;Hm0=0.070818946cm;Czz10=0.0,5.0869432E-5,
1.3970293E-4,4.7124052E-4,7.1615004E-4,7.975558E-4,7.6214876E-4,7.1647903E-4,7.6107396E-4,6.847791E4,6.6441507E-4,4.567583E-4,7.3393347E-4,8.3342794E-4,7.177321E-4,8.320104E-4,9.631133E-4,4.7024636E4,5.479116E-4,7.0798665E-4,7.973897E-4,8.964213E-4,0.0010354978,5.15721E-4,8.0113555E-4,8.009798E-4,
8.0272334E-4,8.0752687E-4,6.5126666E-4,8.172201E-4,5.1516114E-4,6.2683446E-4,5.63858E-4,3.5074513E-4,
6.5980386E-4,5.53472E-4,7.269641E-4,6.289437E-4,6.156702E-4,5.8503065E-4,6.2185246E-4,5.5198127E-4,
4.41777E-4,2.7770927E-4,3.3221033E-4,7.5746316E-4,6.8937184E-4,6.167301E-4,7.730603E-4,6.513776E-4,
5.5705215E-4cm2/Hz;
25
Chapter 4
Using the system
4.1
Calculated parameters
Once the system is commissioned the facilities of raw data presentation, reflection diagram,
system info etc. can be used to monitor the proper operation of the system.
Water level and wave height information are calculated using the measurements of one radar
(physical RADAR A). For directional information the measurements of all three radars are
analyzed and the directional parameters are calculated. There are two analysis routines:
Wave Analysis
The Standard Wave Processing Package (SWAP) is used in performing time and frequency
domain analysis on the measured data to calculate wave parameters. This package is the
standard processing package used by the Dutch government for wave height analysis. It
also meets the standards set by The International Association of Oil & Gas Producers
(OGP). A detailed description of the SWAP package is available on the Radac website
(http://www.radac.nl).
The SWAP parameters are calculated every minute using 20 minute data blocks. The 20
minute observation block is chosen as a compromise between short enough to obtain "small"
variance in the statistical parameters and long enough to assume it to be a stationary
process. The time stamp used on SWAP parameters is the mean between the start and end
time of the 20 minute data block.
Tide Analysis
The tide parameters are calculated by averaging measured data over 10 [min] periods by
default. Other averaging periods can be set upon request.
Parameters that are calculated over a time period get a time stamp that is in the center
of the time period used to calculate them. The spectra and parameters that can be calculated by the WaveGuide system are described in Appendix 1. Due to the large number
of parameters, only a selection of the most commonly used ones is displayed on the user
interface. This selection can be modified by Radac upon request.
4.2
Data logging
A USB storage device can be easily mounted to the WaveGuide server for data logging.
But without taking additional precautions, USB storage is not a safe method for archiving
data. Since power failures can damage USB devices, it is advised to use an Uninterrupted
Power Supply (UPS) together with a high quality USB device.
The WaveGuide server supports FAT32 , Ext2 and Ext3 formats. The majority of USB
devices are delivered with FAT32 format.
26
Note
The USB device used must not be formatted using NTFS.
A USB drive must be manually mounted when first used, and will be automatically remounted on system reboot. Mounting a USB drive can be done via the push buttons on
the front panel of the WaveGuide server. Using button "1" scroll to the storage menu. If
the message" Disk not mounted" is displayed click button "2". If the message "Mount USB
disk? OK" is displayed. Click button "5" to mount the device.
To unmount or remove the disk safely, use button "1" to scroll to the storage menu. Then
click button "2" to arrive at the "Safely remove? OK" option. Then Click button "5" to
unmount the device.
The "Data Logger" page in the web user interface (Fig. 4.1) gives access to the stored data.
Also the data can be transferred easily to other computers using an FTP program. Login
name and password for FTP file transfers are the same as the user-name and password for
modifying settings (by default both user-name and password are "radac")
Figure 4.1: Data logger page.
The folder structure used is one directory per system. In this directory, sub-directories are
created that contain the raw data and parameter files (one file per day per parameter).
If the drive is full a delete mechanism starts. This allows the system to store the most
recent parameters at the expense of the oldest data.
27
Appendix 1: System parameters
Default parameters
In the web user interface and the physical display, a selection of the raw and processed
parameters is made available to the user (Table 1).
Name
Description
Unit
heave
Instantaneous water level
cm
S0bh
Th0
Th010
S0bh10
Hm0
Ngd_zP
Average directional spreading in the frequency band 30-500mHz
Average mean direction in the frequency band 30-500mHz
10 mHz spectrum of mean direction
10 mHz spectrum of directional spreading
Significant wave height from M0
Percentage of datap oints that do not contain error code before pre-processing
deg
deg
deg
deg
cm
%
Tm02
Czz10
Tmax
Hmax
Fp
Average period from M0 and M2 in the range f=[30-500] mHz
10 mHz energy density spectrum
Period of longest wave in the last 20 [min]
Height of highest wave in the last 20 [min]
Frequency f where Czz10(f) has its maximum in the range f =[30-500]
s
cm
s
cm
mHz
H10
Average height over last 10 minutes
cm
Table 1: Default parameters
All possible parameters
Tables 2 to 11, describe all the parameters measured and calculated by the WaveGuide
Direction system.
Changing the parameters available by default on the web interface is possible. It is strongly
recommended that the user requests the changes when the WaveGuide Direction system is
ordered so that all necessary tests can be performed at Radac. Post-installation adjustments
to the available parameters are also possible upon request.
Name Description
Unit
heave Instantaneous water level
cm
slope Water surface slopes
−
Table 2: Raw data at 2 or 2.56 [Hz]
28
Name Description
Unit
Czz5
WTBH
WTBT
Czz10
mHz
cm
s
mHz
5 mHz energy density spectrum
Table of wave heights
Table of wave periods
10 mHz energy density spectrum
Table 3: Spectra and wave tables
Name
Description
Unit
Hm0
Significant wave height from M0
cm
M0
M0_M
Hm0_M
Tm02
Tm02_M
TE0
Band energy from Czz10(f) in the range f =[30-500] mHz
Band energy from Czz10(f) in the range f =[30-1000] mHz
Significant wave height from M0_M
Average period from M0 and M2 in the range f=[30-500] mHz
Average period from M0 and M2 in the range f =[30-1000] mHz
Band energy from Czz10(f) in the range f =[500-1000] mHz
cm2
cm2
cm
s
s
cm2
TE1
TE1_M
TE2
HTE3
Fp
Fp_M
Band energy from Czz10(f) in the range f =[200-500] mHz
Band energy from Czz10(f) in the range f =[200-1000] mHz
Band energy from Czz10(f) in the range f =[100-200] mHz
Wave height from TE3 (band energy from Czz10(f) where f =[30-100] mHz)
Frequency f where Czz10(f) has its maximum in the range f =[30-500] mHz
Frequency f where Czz10(f) has its maximum in the range f =[30-1000] mHz
cm2
cm2
cm2
cm
mHz
mHz
AV10_H
Theoretical number of degrees of freedom of the energy density spectrum (=
4 * Ndlr_H) 20 HS7 Wave height from band energy from Czz5(f) in the range
f =[30-142.5] mHz
Tm0_1
Minus first moment period from M-1 and M0 in the range f =[30-500] mHz
Tm0_1_M Minus first moment period from M-1 and M0 in the range f =[30-1000] mHz
cm
s
s
Table 4: Parameters of spectral processing
Name Description
Unit
H1/3
Average height of the highest 1/3 of the waves
cm
TH1/3
H1/10
H1/50
T1/3
GGH
GGT
Average
Average
Average
Average
Average
Average
s
cm
cm
s
cm
s
AG2
SPGH
SPGT
Hmax
Tmax
Number of waves
Standard deviation of the wave height
Standard deviation of the wave period
Height of highest wave
Period of longest wave
period of the highest 1/3 of the waves
height of the highest 1/10 of the waves
height of the highest 1/50 of the waves
period of the longest 1/3 of the periods
height of all waves
period of all waves
THmax Period of highest wave
HCM Crest height, maximum positive value of all data within one analysis period
−
cm
s
cm
s
s
cm
Table 5: Parameters from time domain processing of data collected in the last 20 [min]
29
Name
Description
Unit
Nwt_zP
Ndlr_H
Ngd_zP
Nu_z
Nv_z
Nd_z
Sum of periods of waves divided by analysis period
Number of valid sub-series of the signal in the vertical direction
Percentage of data-points that do not contain error code before pre-processing
Number of valid data-points that are rejected because of 0-sigma errors
number of valid data-points that are rejected because of 4-sigma errors
number of valid data-points that are rejected because of 4-delta errors
−
−
−
−
−
−
Ni_z
number of interpolated or extrapolated vertical wave motion datapoints
−
Table 6: Quality parameters
Name Description
H
H1
H5
H10
Average
Average
Average
Average
height
height
height
height
Unit
over
over
over
over
last
last
last
last
10 seconds
1 minute
5 minutes
10 minutes
cm
cm
cm
cm
Table 7: parameters from tide processing
Name Description
Unit
Th010 10 mHz spectrum of mean direction deg
deg
S0bh10 10 mHz spectrum of directional spreading deg
deg
Table 8: Directional spectra
Name Description
Unit
Th0 Average mean direction in the frequency band 30-500mHz
S0bh Average directional spreading in the frequency band 30-500mHz
Th3 Average mean direction in the frequency band 30-100mHz
deg
deg
deg
Table 9: Directional parameters
30
In the directional spectral analysis the frequency range from 30-500mHz is divided in 15
separate frequency bands. These frequency bands are given in the Table 10.
Name Description
Unit
B0
B1
B2
30-500
200-500
100-200
mHz
mHz
mHz
B3
B4
G1
G2
G3
G4
30-100
Peak frequency band ( fmax-∆ f to fmax+∆ f )
30-45
45-60
60-85
85-100
mHz
mHz
mHz
mHz
mHz
mHz
G5
G6
G7
G8
G9
G10
100-125
125-165
165-200
200-250
250-335
335-500
mHz
mHz
mHz
mHz
mHz
mHz
Table 10: Frequency bands from 5 [mHz] spectra
Per frequency band 7 parameters are calculated. These parameters are given in Table 11.
Name Description
Unit
Hm0_ Average wave height in the frequency band
Ndfe_ Number of degrees in the frequency band
m
deg
Th0_
S0bh_
G1_
G2_
Fm01_
deg
deg
−
−
mHz
Mean direction of the directional distribution in the frequency band
Average width of the directional distribution in the frequency band
Average asymmetry of the directional distribution in the frequency band
Average flatness of the directional distribution in the frequency band
Average frequency in the frequency band
Table 11: Parameters in each of the 15 frequency bands
31
Appendix 2: System specifications
WaveGuide radar
Mechanical
Dimensions
Weight
Casing material
Electrical
Radar frequency
Modulation
Emission
Power requirements
26 x 44 [cm] (diameter, height)
≈ 14 [kg]
Chromatized aluminum
9.9 – 10.2 [GHz]
Triangular FMCW
The emitted microwave energy is far below acceptable limits for exposure
of the human body. Depending on the type of antenna, a maximum
radiation of 0.1 [mW] is generated.
24-64 [VDC] and 6 [Watt] (when powered separately from server).
Environmental conditions
Ambient temperature
-40 to 60 [o C]
Relative humidity
0 – 100 %
Ingress protection
IP67
Safety
Explosion proof:
ATEX II 1/2 GD T80◦ C EEx d IIB T4
Class I, Division 1, Groups C and D, acc. to ANSI/NFPA 70 (FM, CSA)
WaveGuide server
Dimensions
Computer boards
Processor
COM ports
Network
Power requirements
Operating temperature
Cooling
Display
Memory
48 x 9 x 28 [cm] (width, height and depth)
AAEON, GENE-TC05
Intelr AtomTM E620T 600MHz
3 x RS485 (used to connect the radar).
3 x RS232.
Ethernet
24-36 [VDC] and 12 [Watt] if radar is powered via server.
9-36 [VDC] and 6 [Watt] if radar is powered separately.
-40 to 85 [o C]
No fan required
2 x 20 characters
On board flash
32
General system specifications
sampling rate
wave heights
wave periods
accuracy water level
processing period:
wave height
wave direction
tide
processing interval:
wave height
wave direction
tide
5 [Hz]
0 – 60 [m]
0 – 1 [Hz]
< 1 [cm]
20 [min] (SWAP standard)
20 [min] (SWAP standard)
can be changed upon request (default is 10 [min])
can be changed upon request (default is 1 [min])
can be changed upon request (default is 1 [min])
can be changed upon request (default is 1 [min])
33