1
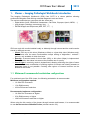
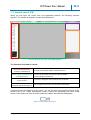
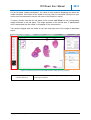
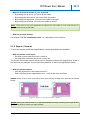
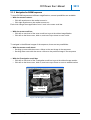
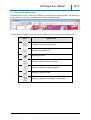
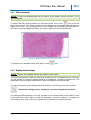
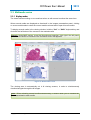
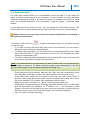
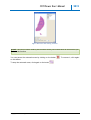
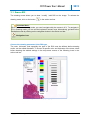
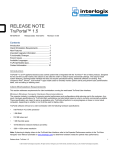
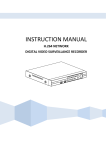
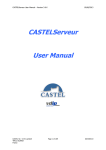
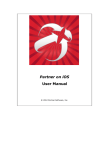
CCITI Viewer User’s Manual
2012
User’s Manual
CCITI Viewer
02/11/2012
Version build 20121102-170523375
Copyright CCITI – all rights reserved
1
CCITI Viewer User’s Manual
2012
Table of Contents
1.
1.1
1.2
1.3
VIEWER – IMAGING PATHOLOGIST WORKBENCH INTRODUCTION........................................... 3
MINIMUM & RECOMMENDED WORKSTATION CONFIGURATIONS.......................................................... 3
GENERAL VIEW OF IPW ............................................................................................................. 4
THE MEDIA VIEWING AREA ......................................................................................................... 6
2. MEDIA REVIEW ...................................................................................................................... 8
2.1 NAVIGATE INTO THE MEDIA ........................................................................................................ 8
2.1.1 NAVIGATION « IN X/Y » ................................................................................................................... 8
2.1.2 ZOOM IN / ZOOM OUT...................................................................................................................... 9
2.1.3 NAVIGATION FOR DICOM SEQUENCES .............................................................................................. 11
2.2 THE VISUALIZATION TOOLS ....................................................................................................... 12
2.2.1 FULL SCREEN MODE ........................................................................................................................ 13
2.2.2 DISPLAY CONTROL SETTINGS ............................................................................................................ 13
2.2.3 GREY LEVEL ................................................................................................................................... 14
2.2.4 « PREVIEW » WINDOW................................................................................................................... 14
2.2.5 « MAGNIFYING GLASS » WINDOW .................................................................................................... 16
2.2.6 SCALE BAR .................................................................................................................................... 17
2.2.7 DISPLAY/HIDE ROI ........................................................................................................................ 17
2.3 MULTIMEDIA REVIEW.............................................................................................................. 18
2.3.1 DISPLAY MODES............................................................................................................................. 18
2.3.2 SYNCHRONIZATION OF MEDIA .......................................................................................................... 20
2.4 SCAN SLIDE MODE .................................................................................................................. 21
3. ANNOTATE DIGITAL IMAGES ................................................................................................ 23
3.1 DRAW A ROI ........................................................................................................................ 24
3.2 DELETE A ROI ....................................................................................................................... 27
3.3 EDIT A ROI ........................................................................................................................... 28
3.3.1 ROI EDITOR - EDIT THE ASSOCIATED INFORMATION ............................................................................. 28
3.3.2 EDIT THE ROI DISPLAY PARAMETERS ................................................................................................. 28
3.3.3 DUPLICATE A ROI: ......................................................................................................................... 30
3.4 ACCESS TO LOCAL GREY LEVEL MEASUREMENT............................................................................... 31
4.
4.1
4.2
4.3
4.4
EXPORT FUNCTIONS............................................................................................................. 32
EXPORT VIEW ........................................................................................................................ 32
EXPORT OF A REGION OF INTEREST ............................................................................................. 33
EXPORT A PREDEFINED AREA ..................................................................................................... 34
EXPORT A FIELD OF VIEW (FOV) OR A ROI TO WORD® OR POWERPOINT® .......................................... 35
5. CUSTOMIZE YOUR INTERFACE .............................................................................................. 36
5.1 ORGANIZE WINDOWS ............................................................................................................. 36
5.1.1 MODIFY SIZE OF WINDOWS.............................................................................................................. 36
5.1.2 DISPLAY/HIDE PANELS .................................................................................................................... 36
5.2 PERSONAL SETTINGS ............................................................................................................... 37
6. FORM AREA & DIAGNOSTIC ITEMS ....................................................................................... 38
7. INDEX OF TOOLBAR BUTTONS .............................................................................................. 40
Copyright CCITI – all rights reserved
2
CCITI Viewer User’s Manual
2012
1. Viewer – Imaging Pathologist Workbench introduction
The Imaging Pathologist Workbench (IPW) from CCITI is a viewer platform allowing
multimedia navigation and offering extended diagnostic tools and items.
The various media that you can open with the viewer are:
Digital slides (Leica, 3DHistech, Hamamatsu, Carl Zeiss, Olympus, Aperio, IMPN, …)
Jpeg images (histology, macroscopy, blot, …)
DICOM images and sequences (MRI, PET, CT, …)
Figure 1: Multimedia IPW interface
IPW can work with media installed locally or distantly through internet and the media can be
stored on different servers.
Client: IPW runs a thin client (Windows or Mac) or a java thick client (Windows only).
Both clients offer the same functionalities except setting of brightness / contrast /
gamma, only available in thick client now.
Security: A secured mode for thick client (SSL) or thin client (Https) is implemented.
The application also takes into account the possible use of a proxy.
User’s right: A read only mode is implemented, allowing restricting the rights of some
users. In that case, modification of existing regions of interest and existing answers to
diagnostic forms is not possible. Creating new regions of interest however can be
allowed in this mode.
1.1 Minimum & recommended workstation configurations
For optimized use of the IPW viewer, the following workstation is recommended:
Minimum configuration required:
1.6 GHz Duo Processor
1 Go RAM memory
1024 x768 screen resolution
Recommended optimum configuration:
1.8 GHz Duo Processor or higher
2 Go RAM memory or higher
1280 x1024 screen resolution or higher
When using the thin version of the viewer through internet web browser, it is recommended
to use the last version of Mozilla Firefox (minimal version 3.6).
Copyright CCITI – all rights reserved
3
CCITI Viewer User’s Manual
2012
1.2 General view of IPW
When you first open the viewer from your application platform, the following interface
appears. The window is divided in 4 parts described below:
Figure 2: General overview of the IPW interface
The interface is divided in 4 areas:
Red section (Left panel)
« Images presentation »
Green section (central panel)
« Viewing area »
Violet section (right panel)
« Form area »
Orange section (right panel)
« Regions Of Interest editor »
Presents all available media in thumbnails form
To view and navigate through the selected media
To draw Regions Of Interest
To answer diagnostic items associated to the media
List of Regions Of Interest and associated information
If several media are loaded into the viewer, you will see during the loading process at the
bottom side of the “image presentation” panel a status bar indicating how many media
remain to be loaded. As soon as all the media are loaded, the status bar disappears.
Figure 3: The loading status bar
Copyright CCITI – all rights reserved
4
CCITI Viewer User’s Manual
2012
On the left panel “image presentation”, the name of each media is displayed just above the
media thumbnail. If the name of the media is too long, then it’s truncated. Simply move your
mouse over the thumbnail to see the full name of the media in a tooltip.
To open a media, click with the left button of the mouse (Left Click) on the corresponding
image thumbnail on the left panel. The image appears on the central area. If standardized
form is associated with the media, it will appear on the violet section.
Two sections appear with the media on top side and right side of the image as described
below:
Figure 4: General overview of the IPW interface after opening a media
Black section (Tool bar)
« Action tool bar »
Copyright CCITI – all rights reserved
Tool bar with icon providing navigation, display, drawing
and export functions
5
CCITI Viewer User’s Manual
2012
1.3 The Media viewing area
The media viewing area allows you to work on the image or sequence with review,
annotation and export functions.
When opening a slide, the viewer displays the digital slide by default at the lowest
magnification (other settings can be applied when opening the viewer from a CCITI
application). Several windows and tools are visible on the viewer window as described
below:
Magnifying glass
Preview window
Digital Slide at lowest
magnification
Continuous zoom
Scroll bar
Scale bar
Figure 5: Overview of the media viewing window
Red section (Left panel)
« Continuous zoom scroll bar »
Zoom out/in at all magnifications continuously by
moving the scroll bar up & down
Fixed map of the entire media.
To visualize current position of the field of view
To move rapidly between distant locations
Yellow section (upper right corner) To display extra magnification where the mouse
« Magnifying glass »
cursor is pointed
Green section (upper left corner)
« Preview window »
Black section (lower right corner)
« Scale Bar »
Pink section (central box)
« Media section »
Copyright CCITI – all rights reserved
To display horizontal and vertical scaling
To navigate through the media (XY and zoom)
6
CCITI Viewer User’s Manual
2012
The main components and actions are:
The “Media section” which shows the part of the image according to the zoom level
and the positioning X/Y on the media. The user can navigate through the media by
moving in X/Y and by zooming in/out.
The preview window, by default located on the top left corner of the viewing area. It
shows a map of the entire media and shows the location of the field of view thanks to
the blue rectangle. So the user can easily know where is located the region currently
reviewed.
The magnifying glass, by default located on the top right corner of the viewing area. It
shows an extra zoom of the media (X2 by default, but you can edit it) at the location of
the mouse cursor. For example, if a digital slide is shown at x5 magnification, the
magnifying glass will show the region pointed at x 10 magnification.
The scale which gives you the horizontal and vertical scales.
A detailed description of the use of each tool is given in the following chapters.
Copyright CCITI – all rights reserved
7
CCITI Viewer User’s Manual
2012
2. Media Review
This section gives you all the necessary information to navigate into your media and use the
visualization tools.
2.1 Navigate into the media
2.1.1 Navigation « in X/Y »
To navigate in “X/Y”, several possibilities are available:
• With the mouse left button:
Press, and hold down, the left button then drag the image in the direction you want.
Release the left button.
Example: If you want to move the media on the right, press and hold down the left button on
the mouse, then move the mouse to the left.
• With the scroll bars:
Use the scroll bars to move the media as you would do it with any other application. There
are 3 ways to use the scroll bars:
Left Click on the arrows of the scroll bars to move the image up/down or left/right.
Click on any point of the scroll bars (outside of the blue rectangle).
The image will move automatically.
Left click and hold on the mouse button on the blue cursor and move the cursor
up/down or left/right.
Note : The scroll bars are not visible when the whole sample can be seen in the viewing
window.
Scroll up & down
Scroll left & right
Figure 6: Navigate with the scroll bar
Copyright CCITI – all rights reserved
8
CCITI Viewer User’s Manual
2012
• With the directional arrows of your keyboard:
By pushing the up arrow, you move up the media
By pushing the down arrow, you move down the media
By pushing the right arrow, you move the media to the right
By pushing the left arrow, you move the media to the left
Note : Each push on an arrow generates a slight move of the field of view. Hold the key for
a continuous move on the side.
• With the preview window:
See chapter “2.2 The visualization tools” for a description of the function.
2.1.2 Zoom in / Zoom out
To view the sample at different magnifications, several possibilities are available:
• With the mouse scroll wheel:
Scrolling up once with the mouse = zoom in
Scrolling down once with the mouse = zoom out
The mouse scroll wheel feature allows you to navigate between the magnification levels of
the scroll bar (for example, zoom continuously between x5 and x10 magnification levels).
• With the mouse buttons:
Click left anywhere on the media to zoom in
Each click change the magnification from 1 level in the zoom scroll bar
Example: zoom in from zoom level x5 to zoom level x10 by clicking once with the left mouse
button.
Figure 7: Zoom in with the left mouse button
Remark: when you click to zoom in, it will automatically zoom by centering the image on the
point of the slide on which you have clicked.
Copyright CCITI – all rights reserved
9
CCITI Viewer User’s Manual
2012
Click right anywhere on the media to zoom out
Example: zoom out from zoom level x10 to zoom level x5 by clicking once with the right mouse
button.
Figure 8: Zoom out with the right mouse button
• With the zoom scroll bar:
Click left on one level of the zoom scroll bar to go at the wished magnification
Click left on the blue cursor, hold on, and move up or down to zoom out/in
Click left on the level
to go at 0.31x
Click left & hold on the blue cursor. Move
up or down to zoom out/in 0.31x
Figure 9: Zoom in/out with the zoom scroll bar
• Zoom in on a predefined area:
Define an area (rectangle) where you wish to zoom in:
Right click on the media and hold on. Then draw a rectangle which defines the area
you want to zoom in.
Release the right mouse button. It will automatically zoom in and center on this defined
area.
Copyright CCITI – all rights reserved
10
CCITI Viewer User’s Manual
2012
2.1.3 Navigation for DICOM sequences
To view DICOM sequences at different magnifications, several possibilities are available:
• With the mouse buttons:
Click left anywhere on the media to zoom in
Click right anywhere on the media to zoom out
Each click change the magnification from 1 level in the zoom scroll bar
• With the zoom scroll bar:
Click left on one level of the zoom scroll bar to go at the wished magnification
Click left on the blue cursor, hold on, and move up or down to zoom out/in
To navigate in the different images of the sequence, there are two possibilities:
• With the mouse scroll wheel:
Scrolling up once with the mouse = Move to the next image in the sequence
Scrolling down once with the mouse = Move to the previous image in the sequence
• With the Z navigation scroll bar:
Click left on one level of the Z navigation scroll bar to go at the wished image section
Click left on the blue cursor, hold on, and move up or down to move to wished section
Navigate
in
the
different sections of
Zoom in/out in
the
displayed
Figure 10: Navigate in a DICOM sequence
Copyright CCITI – all rights reserved
11
CCITI Viewer User’s Manual
2012
2.2 The visualization tools
Several buttons in the Toolbar are available to configure your viewing area. If you place the
mouse cursor on an icon, a brief description of the function appears.
Figure 11: Contextual description of the icons function
The list of the navigation icons and a brief description of the functions are listed below:
Icons
What it does
Toggle on/off to full screen mode
Display control settings
Display grey level
Display or hide the preview window
Display or hide the magnifying glass
Display or hide the scale
Display or hide the draws done on the media
Copyright CCITI – all rights reserved
12
CCITI Viewer User’s Manual
2012
2.2.1 Full screen mode
Remark: Function not available with the thin version of the viewer. Use the function F11 of
your keyboard.
To extend the IPW viewing window to a full screen mode, click on the
icon on the left
side of the tool bar. The viewing window will be displayed in full screen, allowing having a
bigger field of view. In the full screen mode, only navigation and annotations are possible. To
fill in forms and select diagnostic items, you have to go back to the standard mode.
Figure 12: Media displayed in full screen mode
To go back to the standard mode, click again on the
icon.
2.2.2 Display control settings
Remark: Function not available with the thin version of the viewer.
The viewer displays the media as it has been acquired and in a standardized way. However,
you can decide to modify the display features as brightness, contrast or gamma level. The
modification are only display modification, it does not modify the media file itself.
You can have access to the display control by clicking on the settings icon in the tool bar:
Access the settings control: brightness, contrast and gamma correction.
The settings window appears. Left click and hold on the mouse button on the slider of each
control and move left or right to modify the brightness, contrast or gamma. To change the
value step by step, click on the left or right arrow to decrease or increase the value.
Copyright CCITI – all rights reserved
13
CCITI Viewer User’s Manual
2012
Figure 13: Settings of brightness, contrast and gamma correction
The viewer will record the new settings of the media, as soon as the viewer remains opened.
To recover the default settings, click on “reset” in the settings control window.
Once the viewer is closed, the default settings will be applied automatically at the next
opening of the viewer.
2.2.3 Grey level
Cf. chapter « 3.4 - Access to local Grey level measurement »
2.2.4 « Preview » window
The preview window allows you:
to have a view of the whole media
To localize the area you are viewing on the media: this area, located in the blue
rectangle, is the area you are viewing in the navigation window.
Localization of the
current field of view
Figure 14: Preview window – map of the sample
Note: The dimensions of the blue rectangle are dynamically calculated according to the
zoom level.
Copyright CCITI – all rights reserved
14
CCITI Viewer User’s Manual
2012
Using the preview window, you have two ways to navigate through the media by moving the
blue rectangle:
Press, and hold down, the left button of the mouse on the blue rectangle then move
the rectangle.
Point the mouse cursor at the location you want to reach on the sample and left click
(outside of the blue rectangle). It will automatically move the blue rectangle to this area
and center the view (if possible) on the clicked point.
Left click on the region
you want to reach
BEFORE ACTION
AFTER LEFT CLICK
Figure 15: Navigation with the preview window
• Change the position of the preview window:
Put the mouse cursor inside the preview window (outside of the blue rectangle).
Press, and hold down, the right or left button then move the window until the wanted
position.
• Change the dimensions of the preview window:
Put your mouse cursor on the black border of the preview window. The cursor shape
will change from a hand shape to a double side arrow head shape.
Press, and hold down, the left button on the black border then move the mouse to
change the dimensions of the window.
The proportions of the preview window are automatically preserved.
Copyright CCITI – all rights reserved
15
CCITI Viewer User’s Manual
2012
2.2.5 « Magnifying glass » window
The magnifying glass window allows you to have an instant view at the next zoom level (or
another, according to your setup) of the part of the media centered on the mouse cursor.
x2 extra magnification
for the cursor pointed
region achieving x2.5
x1.25 magnification of
the field of view
Mouse cursor
pointed here
Figure 16: Magnifying glass
• Change the position of the magnifying glass window:
Put the mouse cursor in the magnifying glass window.
Press, and hold down, the left button then move the window until the wanted position.
• Change the dimensions of the magnifying glass window:
Put your mouse cursor on the black border of the magnifying glass window. The cursor
shape will change from a hand shape to a double side arrow head shape.
Press, and hold down, the left button on the black border then move the mouse to
change the dimensions of the window.
You can edit width and height independently. If you click on the corner of the magnifying
glass window, you will be able to change its dimensions proportionally.
• Change the extra zoom level of the magnifying glass:
Put your mouse cursor inside the magnifying glass window
Move the mouse wheel up to increase magnification from x2 to x10. Move the mouse
wheel down to decrease the magnification level.
Note: Double left click on the magnifying glass window allows extracting the magnifier as an
independent window that you can place anywhere on the screen, including outside the
viewing window. To replace back the magnifying glass inside the viewing window, double
right or left click on the magnifying glass window. Alternatively, you can click on the red
cross of the magnifier window.
Copyright CCITI – all rights reserved
16
CCITI Viewer User’s Manual
2012
2.2.6 Scale bar
The scale bar is shown by default on the lower right corner of the viewing window. The scale
bar shows horizontal and vertical scaling. The units are automatically calculated depending
on the magnification level and shift from millimeters to micrometers when relevant.
2.2.7 Display/Hide ROI
When you are in Navigation mode, it is possible to display or hide the ROI made on the
image. To display/hide the ROI, click on the
Copyright CCITI – all rights reserved
icon in the action toolbar.
17
CCITI Viewer User’s Manual
2012
2.3 Multimedia review
2.3.1 Display modes
The viewer allows working on one media at a time or with several media at the same time.
When several media are displayed as thumbnail in the images presentation panel, clicking
on a new media leads to close the current media reviewed and to open this new media.
To display several media in the viewing window, hold the “Ctrl” or “Shift” keyboard key and
click with the left button of the mouse on the wanted media.
Remark: Under MAC system, to get the discontinuous selection, click right in the left panel
and select the slides to visualize in the contextual menu that appears.
Figure 17: Multimedia review
The viewing area is automatically cut in N viewing screens, in order to simultaneously
visualize/navigate through the N images.
Note : When reviewing several media simultaneously, it doesn’t allow you to visualize the
forms associated to each media.
Copyright CCITI – all rights reserved
18
CCITI Viewer User’s Manual
2012
The following icons above the thumbnail images presentation panel allow selecting fixed
organization of the windows:
Icons
Function
Display each window side by side
Display windows in cascade
Close all the displayed media
To close one of the displayed medias, click on the “Reduction” button, located at the top right
of the media window.
Figure 18 : Closing of the displayed media
Copyright CCITI – all rights reserved
19
CCITI Viewer User’s Manual
2012
2.3.2 Synchronization of media
Icons
Function
Synchronized navigation through several media
In multimedia mode, you can decide to synchronize the navigation of each media in order to
navigate simultaneously in all the media in the same manner. It means each movement and
change of magnification will be applied to all the selected media. It is particularly useful when
reviewing HES & corresponding Immunohistochemistry of a digital slide or when reviewing
different phases of a MRI sequence for example.
Open all the media to review
Select a reference point on the media that you can easily recognize on each media and
position this point in the center of the window or in a corner of each window. Take care
to select the same magnification for each media.
In the left panel, select “X,Y relative” choice then click on the synchronization button
.
Your media are now synchronized
To go back to standard navigation mode, click on the
Reference
Reference
point
point
button.
Figure 19: Synchronized mode
Note : If you choose the “X,Y absolute” mode when starting the synchronized mode, IPW
will synchronize the media using the absolute coordinates of the media. Thus, this mode is
dedicated to images that have the same coordinates like different phases of MRI sequence
for example. In the case of digital slides, it will be useful only if samples have exactly the
same position on the slide, which has few chances to happen.
Copyright CCITI – all rights reserved
20
CCITI Viewer User’s Manual
2012
2.4 Scan slide mode
The scan slide function allows you to automatically screen the slide. You can define the
region to screen and the speed of the movement. It is also possible to create annotation
during the screening by clicking on the object of interest, for example tumor cells in a smear
slide. For a detailed description of the annotations, read the chapter 3 “Annotate digital
images”.
On the right side of the “Action tool bar”, you can activate the “Scan slide function”. This
function allows you to automatically scan the entire specimen or a part of it that you define.
Before entering the scan mode, select the wished magnification of screening in
the continuous zoom panel.
To activate it, click on the icon
. A window will appear, where you can define the area
you want to scan.
If you want to screen the entire slide, don’t touch to the thumbnail, you only need to
adjust the others settings, as explained below.
To define a scanning region, you can select one or several existing ROI if you created
those ROI previously. To select several ROI, hold on the “Ctrl” keyboard key while
clicking on corresponding ROI.
To create a screening region independently of the existing ROI, hold on the left button
of the mouse and draw a rectangle on the thumbnail.
Note : If you select a ROI on the right panel, you have to hold on the “Ctrl” key and click on
the ROI again to unselect it. To delete a screening region made independently of the ROI
list, click on the region on the thumbnail and press the “Suppr” key.
Enter the speed of the movement, defined in the “Wait” box, and corresponding to the
time the system will display a field of view before shifting to the next one (in ms)
In the “Move” box, select how the system moves from one field of view (FOV) to
another. 100% means the system moves from one complete field of view. 50% means
half of the displayed FOV remains, half is replaced by the next area.
Select if you want a “horizontal” or “vertical” screening in the “Mode” box.
If ROI has to be created during the screening, select the ROI size (from 1 to 100 pixels)
and the associated type (standard, for 2nd opinion, etc…). You can leave a mark
(Region of Interest) on the slide at any time during the screening by clicking with the
left button of the mouse on the slide (see chapter 3 for annotation handling).
Click on “Valid” to start the screening.
Copyright CCITI – all rights reserved
21
CCITI Viewer User’s Manual
2012
Figure 20: Scan slide setting window
Remark: The level of zoom used by this function will be your current level of zoom when you
activate the function
You can pause the automatic scan by clicking on the button
on this button.
To stop the automatic scan, click again on the button
Copyright CCITI – all rights reserved
. To resume it, click again
.
22
CCITI Viewer User’s Manual
2012
3. Annotate Digital Images
A Region Of Interest (ROI) corresponds to a part of the image that the user wants to
emphasis during his analysis.
Several reasons are possible:
I want to justify my diagnosis by indicating one or more ROI.
I have a doubt on a specific part of a media. I want to ask a question about this specific
region of the media.
I emphasize a region of the media because it is very rare or very interesting for a
learning purpose.
I want to make measurements (area, length, RGB levels, etc…) or use sections
annotation to make a 3D reconstruction
A ROI is characterized by:
A name and a set of optional information describing it
A part of the image, that means a set of pixels and its corresponding zoom level.
So, it’s possible:
That several users create their own ROI on the same image.
To view a ROI at various zoom levels when navigating through the media.
To have specific users rights: create/modify/view ROI.
Remark: The creation of a ROI does not modify the image. It’s just added information to the
image, which is superimposed on the image.
The ROI Manager has 2 main functionalities:
Drawing Tool: Create / modify ROI. The drawing mode allows you to draw / modify /
edit a ROI on the image.
Manager tool of information associated to each ROI: The offered possibilities are
detailed in the following chapters.
Copyright CCITI – all rights reserved
23
CCITI Viewer User’s Manual
2012
3.1 Draw a ROI
The drawing mode allows you to draw / modify / edit ROI on the image. To activate the
drawing mode, click on the button
in the action tool bar.
Important Note :
When you are in drawing mode, you can’t navigate with the mouse in X/Y. To navigate in
X/Y in drawing mode, you can use the keyboard “arrows” keys. Alternatively, go back to the
navigation mode by clicking on the navigation button in the action tool bar.
Navigation icon
Choose the drawing parameter & the ROI type
The color, thickness, and especially the type of the ROI must be defined before drawing
and/or can be edited afterward. To choose a specific color and thickness of the draw, select
before drawing the wished settings in the drop down menus of the following icons in the
action tool bar:
Select
ROI type
Select
thickness
Select
color
Figure 21: ROI display & type parameters
Copyright CCITI – all rights reserved
24
CCITI Viewer User’s Manual
2012
Choose the type of draw
Choose the type of draw in the action tool bar:
Type of
draw
Icons
1D
Line
1D
How to draw it
Click left once on the starting point and release the button.
Click left or right at the ending point.
The Line ROI is also a length measurement
Click left on the starting point and release the button.
Then move the mouse and click left to finish a first segment. Draw as
many segments as you need.
Polyline To finish the polyline, click right at the ending point.
The polyline is also a length measurement
1D
Curve
Click left on the starting point and release the button
Move the mouse, the curve will follow the cursor of the mouse.
To end the curve, click left or right at the ending point.
The curve is also a length measurement.
2D
Click left at the starting point and release the button.
Move the mouse in the wished direction to enlarge the rectangle as
wanted.
Rectangle Click left or right once the rectangle is drawn.
The rectangle is a surface & largest diameter measurement.
2D
Click left at the starting point and release the button.
Move the mouse in the wished direction to enlarge the circle as
wanted.
Click left or right once the circle is drawn.
The circle is a surface & largest diameter measurement.
Circle
2D
2D
Example
Click left on the starting point and release the button.
Draw the first segment and click left to start a new side. Draw as
many sides as you need.
Polygon To end the polygon, click right at the ending point.
The polygon is a surface & largest diameter measurement.
Click left at the starting point and release the button.
Move the mouse and the area will follow the cursor of the mouse.
To end the surface, click right at the ending point. The system will
Surface automatically close the surface
The surface is a surface & largest diameter measurement.
Point the mouse cursor on the structure of interest and click left to
create a marker of the position.
Marker
The distance / surface of the draw is automatically calculated and indicated in the Region Of
Interest Manager. For the drawings rectangle, circle, polygon and surface, the largest
diameter is also indicated.
Copyright CCITI – all rights reserved
25
CCITI Viewer User’s Manual
2012
Remark: When drawing, you can stop your draw at any moment by pushing the “ESC” key
of your keyboard. It will cancel the ROI.
Remark: Each time you want to draw an annotation, you have to click first on the
corresponding icon in the action toolbar, even if the drawing type is the same than the
previous ROI drawn.
The “marker” annotation is an exception. You can mark several time your slide without
having to click again on the marker icon. To stop the annotation process, click again on the
« Marker » icon.
Alternatively, you can right click on the image (take care to click in an area outside any drawn
ROI). A contextual window appears allowing you to choose the ROI to draw.
Figure 22: contextual ROI selection Window
Copyright CCITI – all rights reserved
26
CCITI Viewer User’s Manual
2012
3.2 Delete a ROI
To delete a draw, several possibilities are available:
Way A: Select the draw you want to delete, by clicking on the center of it (in drawing
mode), and use the key “Del” or “Suppr” on your keyboard.
Way B: Click on the button “Select a drawing”
in the action tool bar then click in
the middle of the draw to delete. Then click on the button “Delete selected drawing”
in the action tool bar.
Way C: Select the draw you want to delete and use the right click on it (on the border
or inside the draw) to open the contextual menu. Then select “Delete” in the contextual
menu.
Example: delete a draw using the contextual menu.
Figure 23: Delete a ROI – contextual menu
Note : When a ROI is selected, black squares appears on it at each line intersection. If you
don’t see such squares, your ROI is not selected and you can’t edit the ROI.
Figure 24: ROI selection
Copyright CCITI – all rights reserved
27
CCITI Viewer User’s Manual
2012
3.3 Edit a ROI
3.3.1 ROI editor - Edit the associated information
The region of interest editor allows you to review all the annotations made on an image and
to edit information associated with the annotations. The region of interest editor is located in
the panel immediately at the right side of the viewing window.
You can display/hide this panel by clicking on the toolbar icon
The number of annotations and the name of each annotation are indicated in the top part of
the ROI manager. The system generates automatic naming of the region.
You can change the name of a region by selecting the corresponding region in the list
and by entering the new name in the “name” field. Click “valid” to save the change.
Under the “name” field, you have access to the measurements information (distance,
area, largest diameter, mean RGB levels, Mean Grey levels) depending on the kind of
ROI.
To change the ROI class, select in the drop down menu of the “Type” field the class
you want to associate to the ROI.
In the “comments” field, you can add free text to your ROI
Figure 25: ROI manager Editor
3.3.2 Edit the ROI display parameters
You can modify the way the ROI is displayed by using a contextual menu associated with the
ROI:
• Change the color and the thickness of draws:
Before drawing: Use the buttons
and
in the action tool bar. Click on the
little arrow to display the various options.
After drawing: Select the draw of which you want to change the appearance. Use the
right click on the draw to open the contextual menu. Then, go to “change the color” or
to “change the thickness”.
Example: Change the color & Change the border thickness
Copyright CCITI – all rights reserved
28
CCITI Viewer User’s Manual
2012
Figure 26: Modify ROI color and border thickness
• Move a draw:
Select the draw you want to move and use the right click on it to open the contextual
menu. Then select “Move” in the contextual menu.
Then move the mouse to move your draw. Then click left to fix the draw
Example: move a draw using the contextual menu
Figure 27: Move a ROI
• Reshape a draw :
The function is available for line, polyline, rectangle, circle and polygon annotations.
Select the draw you want to reshape and use the right click on it to open the contextual
menu. Then select “reshape” in the contextual menu.
Move the mouse cursor on an intersection (Black Square). The cursor shift from an
arrow shape to a hand shape. Left click and release the mouse button then move the
mouse to reshape the draw. Click left again to end the operation.
Figure 28: Reshape a ROI
Copyright CCITI – all rights reserved
29
CCITI Viewer User’s Manual
2012
3.3.3 Duplicate a ROI:
Select the draw you want to duplicate and use the right click on it to open the
contextual menu. Then select “duplicate” in the contextual menu.
To duplicate the ROI in the current image, select “in the current media”.
o Move the mouse to move the duplicated ROI to the wanted position. Then click
left to fix the duplicate draw.
To duplicate the ROI in other images, select “in another media”. To be active, all the
concerned images have to be opened in the viewing area before using this function.
o Select the images to duplicate the ROI in the appearing “Choose Media” window
and click “validate”.
Note : Duplicate a ROI in another media can be useful to highlight the same region in HE
and IHC stained slides for example. However, the system will use absolute X,Y position to
duplicate the ROI so if both slides are not exactly matching, a manual move of the ROI will
be necessary to adjust the position.
Example: Duplicate a draw using the contextual menu
Figure 29: Duplicate a ROI
Copyright CCITI – all rights reserved
30
CCITI Viewer User’s Manual
2012
3.4 Access to local Grey level measurement
IPW allows you to measure at a precise pixel location the grey level of the pixel.
Select a ROI in the ROI manager editor.
When a ROI is selected, the “Display grey level”
icon becomes active in the
toolbar.
Click on the display grey level icon and point your mouse cursor at the location you
want to measure. The value of the pixel and the mean value on the whole selected ROI
appears in the bottom left corner of the viewing window as Grey/ROI : 163/150 for
example, 163 being the pixel value where the mouse cursor is pointed, 150 being the
mean value inside the selected ROI.
Figure 30: Grey value measurement
Copyright CCITI – all rights reserved
31
CCITI Viewer User’s Manual
2012
4. Export Functions
IPW allows exporting information automatically or manually. This section deals with the
manual export functions
4.1 Export view
You can export the current view of the media displayed on the viewing window by clicking the
button
in the «Action tool bar».
This action allows you two types of export:
In the Clipboard, so you can paste it in a document;
In a file, so you can save it where you want on your computer as a JPEG file. This will
open a dialog box where you will be able to choose the name of the file and where you
want to save it on your computer
You can decide if you want to export the view with or without the ROI displayed.
The image is exported along with the media name, the viewing magnification and the size
(x,y) in mm of the image.
Figure 31: jpg exported image with annotation
Copyright CCITI – all rights reserved
32
CCITI Viewer User’s Manual
2012
4.2 Export of a Region of Interest
You can export a region of interest. To do so, select a region of interest, then click right on
the ROI and select “Export” in the contextual menu. This action allows you two types of
export:
In the Clipboard, so you can paste it in a document.
In a file, so you can save it where you want on your computer as a JPEG file. This will
open a dialog box where you will be able to choose where you want to save it on your
computer.
Figure 32: Export a ROI
Alternatively, in Drawing mode, select a ROI and click on the
icon (the closest icon
from the ROI icons, with legend “export the selected draw” when putting the mouse cursor on
it).
The ROI when exported as a jpg file is exported along with the name of the media, the
viewing magnification, the name of the ROI, the surface if relevant and the size of the picture
in X,Y and in mm.
Figure 33: ROI exported jpg image
Copyright CCITI – all rights reserved
33
CCITI Viewer User’s Manual
2012
4.3 Export a predefined area
If you want to export a rectangular area larger than the field of view at a given magnification,
it is possible to do it without having to create a ROI.
In Navigation Mode, select the “select a region”
icon in the action Toolbar
Click on the left button twice to start to draw the region. Drag the mouse and click left
button to fix the defined region.
If you draw the region at x5 magnification for example, it is possible to export at higher
magnification. Go to the wanted resolution and click on the “Export” icon on the right of
the “select a region” icon
.
This will open a dialog box where you will be able to choose where you want to save it
on your computer. If nothing happens, it means the image size is too big for the jpg
format. Decrease the magnification and try again.
Note : Once you made your selection, you can center the field of view on the selection by
clicking on the “
center view on selection” icon.
Copyright CCITI – all rights reserved
34
CCITI Viewer User’s Manual
2012
4.4 Export a Field of view (FOV) or a ROI to Word® or PowerPoint®
IPW allows you to easily insert a field of view image in Microsoft Office word® or
PowerPoint®.
Open Microsoft Office word or PowerPoint and minimize the window
Open your media and navigate to the field of view you want to export.
Hold on the “Ctrl” keyboard key and click left with the mouse button on the viewing
area. Hold on the mouse button and drag the field of view to the Word or PowerPoint
window. You should see the field of view in transparency when dragging.
Release the mouse button. The field of view is inserted into your document.
Drag the field of view to the
PowerPoint minimized window
Figure 34: Insert a Field of view in Microsoft Word or PowerPoint
To insert a ROI, first select a ROI then follow the same procedure.
Copyright CCITI – all rights reserved
35
CCITI Viewer User’s Manual
2012
5. Customize your Interface
IPW gives you the possibility to customize the way you want to organize you working area.
5.1 Organize Windows
5.1.1 Modify size of windows
To modify the size of the different panels, put your mouse cursor at the border of a panel.
The mouse cursor changes from a hand shape or arrow shape to a double arrow head
shape.
Left click and hold on the mouse button and move left/right or up/down to increase/decrease
the size of a panel or window.
Figure 35: Increase/decrease the size of the windows
5.1.2 Display/Hide panels
To display or Hide the Thumbnail panel showing all the images and/or the plug-in panel
containing the form and the synchronization windows:
Click on the CCITI icon on the upper left corner of the IPW window
In the drop down menu, click on CCITI viewer / Thumbnail band or plug-in band to
display/hide the panels.
Figure 36: Display/Hide the Thumbnail & plug-in panels
Copyright CCITI – all rights reserved
36
CCITI Viewer User’s Manual
2012
5.2 Personal settings
IPW allows you to customize your interface to define preferences when the viewer opens. It
allows you to define which default parameter should be displayed when opening a media.
For example, if you never use the scale, you can select that the scale bar will not be visible
by default. If you draw a ROI with black border most of the time, you can define to show the
black border selected by default.
To access the preferences settings, click on the CCITI logo on the upper left corner of the
IPW window and select CCITI Viewer/preferences in the drop down menu.
Figure 37: Access the preferences
Once in the Preferences window, select in the menu the settings you want to modify. Don’t
forget to click on “Apply” after each modification.
If you want to save all the defined settings, click on “save” to create a “preference“ file. To
load a file saved previously, click on the “load” button.
Figure 38: Saving the preferences
Copyright CCITI – all rights reserved
37
CCITI Viewer User’s Manual
2012
6. Form area & diagnostic items
To help your diagnosis, the viewer allows you to answer a set of questions directly when
viewing a media. The answers will be recorded with the media and will be available the next
viewing. Depending on the media, a form will be associated or not to the media.
This set of questions can be configured according to the type of media (organ, HE/Immuno
…).
Remark: A form can only be shown when only one media is opened at a time.
Figure 39: Example of associated form for mesothelioma diagnosis
Various types of questions are possible:
Boolean question (Yes ; No)
Figure 40: Boolean question
List of values question: you choose one answer in the list of proposed answers
Figure 41: List of values question
Integer question: you choose one answer (an integer) in the list of proposed answers
Figure 42: Integer question
The same kind of question exists for real numbers.
Free text question: you answer the question by typing a free text
Figure 43: Free text question
Copyright CCITI – all rights reserved
38
CCITI Viewer User’s Manual
2012
Multiple choice question: click on an answer in the list to select it. The selected answer
appears highlighted in blue. To select several answers, hold on the “Ctrl” key and click
on additional answer in the list.
Figure 44: Multiple choice questions
Computational question: Some questions can use calculation based on other filled
question (like a sum, mean value, or more complex calculation.
Distance/surface measurement: to answer, click on the red question. The viewer
automatically enters the ROI mode. Draw a ROI (predefined type and color) and the
viewer will automatically calculate the distance/surface of your ROI.
Figure 45: Distance/Surface question
This type of question appears in red. That means a ROI has to be drawn to answer the
question. You don’t have to click on the drawing icon, the drawing type is automatically
selected by the software. After drawing the ROI, its distance or surface is automatically
calculated and added at the right side of this question as shown below. You may draw
as many ROI as needed to answer the question, the associated distances or surfaces
are added and the number of drawn ROI is indicated at the right side of the question
name.
Figure 46: Answered Distance/Surface question
For Boolean or list of values question, according to the answer you choose, new contextual
question fields may appear.
In some contexts, you will find this icon
before some question. This gives you access to
a knowledge sheet that presents explanations about the questions. Click on the icon
before the question. This will open a new window with the “K sheet” in relation with the
question.
At the top left of the form, there’s a button showing the name of the form. It allows the
downloading of your answers to the form in an XML format. Click on the button to open a
new window to download the XML file.
Figure 47: Download of the answers to the form
For more information about the form functions, please consult your application manual.
Copyright CCITI – all rights reserved
39
CCITI Viewer User’s Manual
2012
7. Index of toolbar buttons
Icons
What it does
Toggle on/off to full screen mode
Not available with the thin
version of the viewer
F11 of
keyboard
Display control settings
Not available with the thin
version of the viewer
Select a ROI
Delete a selected ROI
Export a selected ROI
Select Line ROI
Display Grey Level
Select Polyline ROI
Display/hide the preview window
Select Curve ROI
Display/hide the magnifying glass
Select Rectangle ROI
Display/hide the scale
Display/hide the draws done on the
media
Select Circle ROI
Select Polygon ROI
Export a Field Of View
Select Surface ROI
Activate Navigation Mode
Select Marker ROI
Activate Drawing Mode
Select the type of ROI
Select a region – Clear a region
Select color of the ROI
Export a selected area
Select thickness border of the ROI
Center view on selected region
Activate the screening mode
Pause the screening
Copyright CCITI – all rights reserved
40