1
Funcom Hardware Statistics System
Final Project Documentation
Project name
Funcom Hardware Statistics System
Client
Funcom N.V.
Date
Author
Acronym
FHaSS
Sensors & Supervisors
Internal sensor
Olaf Hallan Graven
Internal supervisor
Aurilla Aurelie Arntzen
External supervisor
Rui M. Monteiro Casais
Group members
............................
Sondre Bjerkerud
............................
Sverre Christoffer Thune
............................
Dag Hem
............................
Kent Brian Dreyer
............................
Kim Richard Johansen
Table of documents
User Requrement Specification.............................................................................................................. 3
Programming Language Document ........................................................................................................ 7
Vision Document................................................................................................................................... 16
Current System Description.................................................................................................................. 26
Test Strategy ......................................................................................................................................... 35
Requirements Specification ................................................................................................................. 43
Test Specification .................................................................................................................................. 55
Project Plan ........................................................................................................................................... 74
Risk Analysis Document........................................................................................................................ 87
Project Model Document ................................................................................................................... 101
IDE Document ..................................................................................................................................... 107
Quality Assurance Document ............................................................................................................. 112
Version Control Document ................................................................................................................. 124
Design Document................................................................................................................................ 131
Test summary...................................................................................................................................... 163
Project Reflection Document ............................................................................................................. 183
Funcom Hardware Statistics System
User Requirement Specification
Project name
Funcom Hardware Statistics System
Client
Funcom N.V.
Date
10.01.12
Author
Sondre Bjerkerud
Acronym
FHaSS
Sensors & Supervisors
Internal sensor
Olaf Hallan Graven
Internal supervisor
Aurilla Aurelie Arntzen
External supervisor
Rui M. Monteiro Casais
Group members
............................
Sondre Bjerkerud
............................
Sverre Christoffer Thune
............................
Dag Hem
............................
Kent Brian Dreyer
............................
Kim Richard Johansen
Project FHaSS
User Requirement Specification
2011
User Requirement Specification
1 General Document Information
Deliverable nr:
Deliverable type:
Release:
Workpackage:
Responsible:
D1.1.1
Report
Public
1
Sondre Bjerkerud
1.1 Declaration of intention
This document contains the functional and non-functional requirements captured during two
meetings with Funcom (e.g. September: at Funcom Oslo, 27.10.2011: Skype meeting).
This document gives a quick overview of what we are going to do/achieve in our project.
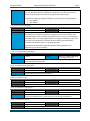
1.2 Definitions and Acronyms
DxDiag
Diagnostics file containing hardware and software
information Interface
1.3 Document History
Version
1.0
1.5
Description
First version created
Template added
Date
28.10.2011
10.01.2011
1.6
Updates after document review
29.05.2012
Page 4 of 194
Project FHaSS
User Requirement Specification
2011
2 Table of contents
1
General Document Information ...................................................................................................... 4
1.1
Declaration of intention .......................................................................................................... 4
1.2
Definitions and Acronyms ....................................................................................................... 4
1.3
Document History ................................................................................................................... 4
2
Table of contents ............................................................................................................................. 5
3
Functional requirements ................................................................................................................. 6
4
Non-functional requirements .......................................................................................................... 6
Page 5 of 194
Project FHaSS
User Requirement Specification
2011
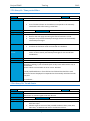
3 Functional requirements
1. As a user I want to be able to see information about the hardware of the client computers
that crashed, because I can then see which type of hardware there are most problems with.
2. As a user I want to be able to filter crash information based on time period,
region/geographical location (continent, countries, etc.) and hardware type, and all
combinations of these.
3. As a user I want to get more accurate information from the DxDiag file than the current
system, because there is currently a lot of unknown hardware.
4. As a user I want to add and remove hardware types to the database, because new types of
hardware is entering the market as technology evolves.
5. As a user I want the system to group almost identical hardware, because in a separate state
they would not give any extra relevant information.
6. As a user I want to see trends in what hardware the users are using as time passes.
7. As a user I want to be able to see a prediction of the hardware in the future based on the
trend from a specific time period, because this will give me information about what type of
hardware we will be developing games for.
8. As a user I want to be able to filter the information based on the game that was the source of
the crash.
4 Non-functional requirements
1. It is important that the new system will interface with external systems (for instance BugZilla)
in the same way as the current systems does.
2. The foundation of the system must be built general enough so that the same foundation can
be used for the eventual improvement/implementation of the Crash Statistics Systems.
Page 6 of 194
Funcom Hardware Statistics System
Programming Language Document
Project name
Funcom Hardware Statistics System
Client
Funcom N.V.
Date
10.01.2012
Author
Kent Brian Dreyer
Acronym
FHaSS
Sensors & Supervisors
Internal sensor
Olaf Hallan Graven
Internal supervisor
Aurilla Aurelie Arntzen
External supervisor
Rui M. Monteiro Casais
Group members
............................
Sondre Bjerkerud
............................
Sverre Christoffer Thune
............................
Dag Hem
............................
Kent Brian Dreyer
............................
Kim Richard Johansen
Project FHaSS
Programming Language Document
2011
Programming Language Document
5 General Document Information
Deliverable nr:
Deliverable type:
Release:
Workpackage:
Responsible:
D1.2.2
Research
Public
1
Kent B. Dreyer
Dag C. Hem
Kim R. Johansen
5.1 Declaration of intention
The purpose of this document is to clearly define the computer language(s) we will use for
the development of our given task.
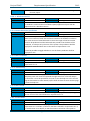
5.2 Definitions and Acronyms
ASP
Debugger
CLR
IDE
Active Server Pages
Tool for locating errors in software
Common Language Runtime
Integrated development environment
5.3 Document History
Version
1
2
Description
First version created
Document template added
Information reviewed and
updated
Page 8 of 194
Date
15.12.2011
10.01.2012
Project FHaSS
Programming Language Document
2011
6 Table of contents
5
General Document Information ...................................................................................................... 8
5.1
Declaration of intention .......................................................................................................... 8
5.2
Definitions and Acronyms ....................................................................................................... 8
5.3
Document History ................................................................................................................... 8
6
Table of contents ............................................................................................................................. 9
7
Introduction ................................................................................................................................... 10
8
Python ........................................................................................................................................... 10
9
8.1
Is it possible to use this programming language to solve our bachelor task? ...................... 10
8.2
Does it work well with other planned programming languages? ......................................... 10
C# ................................................................................................................................................... 11
10 C# with ASP.net ............................................................................................................................. 12
10.1
Is it possible to use this programming language to solve our bachelor task? ...................... 12
10.2
Does it work well with other planned programming languages? ......................................... 12
11 PHP: Hypertext Preprocessor ........................................................................................................ 13
11.1
Is it possible to use this programming language to solve our bachelor task? ...................... 13
11.2
Does it work well with other planned programming languages? ......................................... 13
12 Conclusion ..................................................................................................................................... 14
12.1
Languages used for database retrieving and web development .......................................... 14
12.2
Languages used for database-parsing ................................................................................... 14
13 References ..................................................................................................................................... 14
13.1
PHP ........................................................................................................................................ 14
13.2
C# / ASP.NET .......................................................................................................................... 15
13.3
Python ................................................................................................................................... 15
Page 9 of 194
Project FHaSS
Programming Language Document
2011
7 Introduction
Through this document we will review different computer languages for the development of our
project task. We need to find the technology that meets the necessary requirements needed. Our
client has already requested that we use C# with ASP.NET so that the system is easy maintainable
and accessible for future expansions.
8 Python
Python is a general-purpose, high-level programming language whose design philosophy emphasizes
code readability.
This object-orientated language is quite similar to PHP in its ability to create dynamic web pages and
various types of software web applications.
One of Pythons main strength’s is its simple syntax and easy to read code. That means, even though
this might be a new language for the team, we will be able to learn the language quite fast. Python is
a cross-platform scripting language, and can easily connect to different databases on multiple
platforms.
As mentioned earlier, Python is a general-purpose programming language; this means that we could
also use Python as our database parser as we would with C#. Python is an old language, this means
that it had time to grow, and developers has created a plethora of tools and frameworks for it to
make Python perform tasks that were otherwise lacking or hard to achieve.
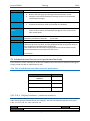
8.1 Is it possible to use this programming language to solve our bachelor
task?
Yes, Python is versatile both when it comes to web development and database information retrieval,
as well as parsing text. It would also be simple enough for us to learn without setting us back in
productivity.
The current system was based on Python, but the client request was primarily to use C# with
ASP.NET framework.
8.2 Does it work well with other planned programming languages?
Yes, if we were to create our database parser in Python, it would have a minimal effect on either PHP
or ASP.NET which would be used as our web development tools. We could choose to use Python as
the main web development tool, and it would have no issues with a parser created from C#.
Benefits
Very fast, little memory/CPU usage
Open source
Can be used as both our database
parser and our web development
language
Drawback
No compilation, no debugger
Page 10 of 194
Project FHaSS
Programming Language Document
2011
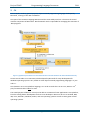
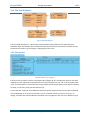
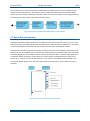
9 C#
C# is a simple, modern, general-purpose, object-oriented programming language developed by
Microsoft, running on the .NET Framework.
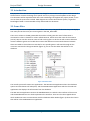
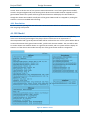
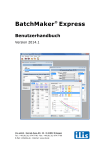
C# is part of the Common Language Runtime and the most widely used one. The CLR is the virtual
machine component of Microsoft's .NET framework and is responsible for managing the execution of
.NET programs.
Figur 1: A graphical representation from the initial execution of C# code and down the .NET framework hierarchy
C# uses visual studio as its native IDE, also developed by Microsoft for easy development for
Windows operating systems. Very similar to other object oriented programming languages i.e. java
and C++.
C# is however not a cross-platform language, so in order to make this run on Linux, Mac etc. a 3rd
party framework called “Mono”is used.
The stated purpose of Mono is not only to be able to run Microsoft .NET applications cross-platform,
but also to bring better development tools to Linux developers. Mono can be run on Android, BSD,
iOS, Linux, Mac OS X, Windows, Solaris, and Unix operating systems as well as some game console
operating systems.
Page 11 of 194
Project FHaSS
Programming Language Document
2011
10 C# with ASP.net
ASP.NET is part of the .NET Framework, and when coding ASP.NET applications you have access to
classes in the .NET Framework. You can code your applications in any language compatible with the
CLR, including Microsoft Visual Basic and C#. These languages enable you to develop ASP.NET
applications that benefit from the common language runtime, type safety, inheritance, and so on.
By compiling C# you get compatible ASP.NET code. C# may also be compiled as a file that can be
executed from a website. This gives great flexibility and makes code modification easy.
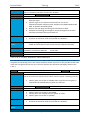
10.1 Is it possible to use this programming language to solve our bachelor
task?
Yes, to build a parser, create threads and to make SQL queries it will prove very useful for this task,
including the .NET debugger it will be easier to build solid code than with Python. Including the fact
that we can generate the full web representation by calling ASP.NET from C# simplifies the
development process greatly. C# with ASP.NET was also highly recommended by our client (Funcom)
for possible future expansion.
10.2 Does it work well with other planned programming languages?
C# is interoperable with the rest of the .NET framework (ASP.NET) and by using this we can develop
everything we would need for the given task with C# only.
C# is something that that the team hasn’t worked with yet, but it merges with all of .NET. Paired with
mono and the .NET debugger it is extremely versatile, and a solid cross compatible language for us to
develop in.
Benefits
language interoperability with .NET
framework
Cross-platform compatible with
Mono.
Easy accessible SQL-querying
Great debugger through .NET
Drawback
IDE choice might be restricted
Page 12 of 194
Project FHaSS
Programming Language Document
2011
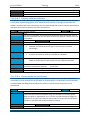
11 PHP: Hypertext Preprocessor
PHP is a quick and easy language to learn and a sophisticated language to master. Most (if not all) of
our groups members have worked with PHP before in different degrees, this gives PHP a small
advantage over the “new” languages since its going to take a lot less time for us to start using it for
our purpose.
PHP is mostly run on a Linux environment connected to a MySQL database, and its mostly for this
reason that it usually uses less memory during runtime than ASP.NET running on IIS(Internet
Information Services). This may not, however, be an issue due to the fact that our system will only be
used by a small amount of developers at a time.
The fact that PHP does not have a debugger present makes it the main reason we will probably
choose C# with ASP.NET as our web development tool.
PHP can be developed in a handful of IDE’s, but NetBeans IDE would be the IDE of choice if we
decided to use PHP because of its wide range of functions and we already have extensive knowledge
of NetBeans IDE.
11.1 Is it possible to use this programming language to solve our bachelor
task?
Yes, but it would not be optional over C# with ASP.NET because of its inability to easily debug and its
bad error handling. Security is not much of an issue since our system will run on a closed intranet,
neither is the server-side preprocessing (There will never be enough users using this system at the
same time).
11.2 Does it work well with other planned programming languages?
As C# with ASP.NET would also be used as our web programming language, they would fulfill the
same role. Our PHP supported web page would also have no trouble communicating with a database
built up from either a C# or a Python developed parser.
Benefits
Less (server)memory usage than ASP.NET
Less learning curve
Cross-platform capable
Easy access to the database
Drawbacks
Lacks API Consistency
Scripted language, not compiled (Hard to debug/ Bad
error handling)
Not thread safe
Does not have native support for Unicode or multibyte
strings
No debugger
Page 13 of 194
Project FHaSS
Programming Language Document
2011
12 Conclusion
12.1 Languages used for database retrieving and web development
The choice stands between ASP.NET, PHP and Python. They are all pretty similar in functionality and
all of them are capable of doing what is needed in our bachelor assignment, though ASP.NET is
dependent of C# to perform database calls.
What separates these languages is C#’s ability to do threading, something PHP cannot. C# with
ASP.NET is also a compiled language which makes it easier to debug and gives it a big advantage over
working with Python and PHP.
One of Python’s main benefits is the fact that it could be used as both a programming language for
our parser, and as a web development tool, this would eliminate the need to learn two languages.
The system our client is currently using was also created with Python.
So we could have used all the languages for web development, but since our client would prefer the
use of C# in combination with ASP.NET for further possible expansion, ASP.NET and C# is the logical
choice for us to use as our web development tool.
12.2 Languages used for database-parsing
We have the choice between C# and Python as they can both perform the job for parsing our
received data into the databases and thread creation which PHP cannot.
Python’s main benefit is the fact that we could use it for both database parsing and web
development, something our clients have done for their current system.
Since we have chosen to use ASP.NET as our web development tool (which is dependent on the C#
language) and our clients have already suggested that we use C# with ASP.NET, it is clear that C#
would be the best choice for us to write our database parser in.
13 References
13.1 PHP
http://www.pretechno.com/i/oracle-comparison-of-php-asp.net.html(Last visited 15.12.2011)
http://www.cio.com/article/197152/PHP_s_Enterprise_Strengths_and_Weaknesses_Take_2?pag
e=3&taxonomyId=3038(Last visited 15.12.2011)
http://www.cio.com/article/176250/You_Used_PHP_to_Write_WHAT_(Last visited 12.12.2011)
http://www.creativewebmall.com/cwm/php-strengths-and-weaknesses/444/
(Last visited 15.12.2011)
http://coding.smashingmagazine.com/2009/02/11/the-big-php-ides-test-why-use-oneandwhich-to-choose/(Last visited 14.12.2011)
Page 14 of 194
Project FHaSS
Programming Language Document
2011
13.2 C# / ASP.NET
http://en.wikipedia.org/wiki/C_Sharp_(programming_language)(Last visited 14.12.2011)
http://www.mono-project.com/Main_Page(Last visited 14.12.2011)
http://msdn.microsoft.com/en-us/library/z1zx9t92(v=vs.80).aspx(Last visited 14.12.2011)
http://en.wikipedia.org/wiki/Common_Language_Runtime(Last visited 15.12.2011)
http://en.wikipedia.org/wiki/ASP.NET(Last visited 15.12.2011)
http://en.wikipedia.org/wiki/List_of_CLI_languages(Last visited 15.12.2011)
http://wiki.answers.com/Q/What_are_the_advantages_and_disadvantages_of_aspnet(Last
visited 15.12.2011)
http://msdn.microsoft.com/en-us/library/k4cbh4dh.aspx#Y10154(Last visited 14.12.2011)
13.3 Python
http://wiki.python.org/moin/PythonVsPhp(Last visited 11.12.2011)
http://python.org/doc/(Last visited 11.12.2011)
http://en.wikipedia.org/wiki/Python_(programming_language)(Last visited 11.12.2011)
Page 15 of 194
Funcom Hardware Statistics System
Vision Document
Project name
Acronym
Funcom Hardware Statistics System
FHaSS
Client
Sensors & Supervisors
Funcom N.V.
Internal sensor
Olaf Hallan Graven
Date
Internal supervisor
Aurilla Aurelie Arntzen
10.01.2012
External supervisor
Rui M. Monteiro Casais
Group members
............................
Sondre Bjerkerud
............................
Sverre Christoffer Thune
............................
Dag Hem
............................
Kent Brian Dreyer
............................
Kim Richard Johansen
Project FHaSS
Vision Document
2012
Vision Document
14 General Document Information
Deliverable nr
Deliverable type
Release
Work package
Responsible
D1.3.3.1
Research
Public
1
Sondre Bjerkerud
14.1 Declaration of intention
This document is intended to give the reader a fundamental insight into our project assignment by
giving an introduction to our client and their area of business. It will give a more in-depth explanation
of the context and background of the system to give the reader an understanding of the necessity of
the system. Last but not least this document will go through what to improve about the current
system, how to improve it, and the benefits our client will obtain by using the new system.
14.2 Definitions and Acronyms
MMORPG
Crash
Bug
Patch
Massive Multiplayer Online Role Playing Game
A crash is a term for when a software system fails. A crash
usually occur because of incompatibility between the
software code and the hardware.
An issue with the software application causing it to crash or
behave in ways it isn’t supposed to.
A minor software update that usually fix specific issues, do
small changes to or add minor functionality.
14.3 Document History
Version
1
1.5
2
2.5
3
Description
First version created. General
outline/structure.
Most text rewritten.
Further detailing of text.
Project document template
adopted.
Updates after document review
Page 17 of 194
Date
15.10.2011
13.12.2011
21.12.2011
10.01.2012
29.05.2012
Project FHaSS
Vision Document
2012
15 Table of contents
14 General Document Information .................................................................................................... 17
14.1
Declaration of intention ........................................................................................................ 17
14.2
Definitions and Acronyms ..................................................................................................... 17
14.3
Document History ................................................................................................................. 17
15 Table of contents ........................................................................................................................... 18
16 Our client ....................................................................................................................................... 19
17 Context of the study ...................................................................................................................... 19
17.1
Computer technology evolution ........................................................................................... 19
17.2
Shortening of production time .............................................................................................. 20
17.3
Fault-tolerance ...................................................................................................................... 21
17.4
Hardware trends.................................................................................................................... 21
17.5
Online .................................................................................................................................... 22
17.6
Usage of the system .............................................................................................................. 22
18 What to improve ........................................................................................................................... 22
18.1
Crash report parsing .............................................................................................................. 22
18.2
Graphical User Interface........................................................................................................ 23
18.3
Lack of functionality .............................................................................................................. 23
19 How to improve it.......................................................................................................................... 23
20 Benefits.......................................................................................................................................... 24
21 Sources .......................................................................................................................................... 24
Page 18 of 194
Project FHaSS
Vision Document
2012
16 Our client
Our client – Funcom – is Norway’s largest game development company, and was founded in
1993 in Oslo. When internet became public property around 1995 Funcom began to head their
game production more and more towards online games, especially so-called MMORPG’s. In the
year 2001 Funcom released their first game of this type, namely Anarchy Online, and the second
game, Age of Conan, was released in 2008. The new MMORPG project that Funcom is currently
working on is called The Secret World and is planned to be released in April 2012, that is in the
middle of our project period [1].
17 Context of the study
17.1 Computer technology evolution
The evolution in the field of computer technology has in the last decades been enormous, with lots
of new and improved hardware components entering the market every year. New manufacturers
entering the market also increase the different amount of components available.
Take for instance the evolution when it comes to graphics processors and graphics cards on the PC
market. There are two main producers of graphical processors today; nVidia and AMD [2], with their
graphics processor series GeForce and Radeon, respectively. These processors are then bought by
graphics cards manufacturers who build them into their own type of graphics card. There are far
more graphics cards manufacturers than the two graphics processor producers, and many of the
manufacturers are making graphics card versions based on both of the processor technologies. In
addition, some manufacturers are even making several graphics card types based on the same
processor. This all sums up in that there is a very large amount of different graphics cards being
distributed on the user market.
An almost similar explanation can be given for other types of computer hardware such as processors,
main boards, and memory, as well. Taking into account the evolution of the technology, this results
in a market that is full of different computer components for the end user to buy. Because a regular
PC consists of several different hardware types this again results in an enormous amount of different
combinations of hardware a user potentially can have in his computer.
Funcom as a software developer has to take this fact into account when developing their games.
Either specific hardware types or specific combinations of hardware may result in the game not
functioning as it is supposed to. For instance outdated hardware will not be able to run - or run fast
enough - software written with the capabilities of the state of the art hardware technology in mind.
This specific problem is especially important when it comes to the gaming industry, because newer
games are so dependent on the ability to display complex graphics on a computer screen. It is the job
of the graphics card to create the graphics to be displayed, and with the game developers constantly
pushing the limits of graphical complexity in their games, graphics cards have a very limited lifetime.
Several game developer companies have had to shut down their whole production, or at least having
to do significant cuts in their staff, after releasing a game that was not compatible with large parts of
the players hardware combinations. Funcom has themselves been the victim of such disasters when
releasing their first two MMORPG games Anarchy Online [3] and Age of Conan [4].
Page 19 of 194
Project FHaSS
Vision Document
2012
17.2 Shortening of production time
The fact that the technology is evolving with the high velocity that it is, is resulting in shorter game
development periods per game [5]. If game development companies had not shortened their
development period their games would have been outdated when it entered the market, and
thereby no one would have bought the game. Shorter development periods can be solved in two
ways; by increasing the number of employees, or by using less time on less important parts of the
development. The first solution will result in larger wage expenses, and an increase in staff usually is
not proportional to the increase in development velocity – because of cooperation overhead.
Because of the usually unstable and unpredictable economy of game development companies, the
mentioned increase in staff size isn’t always a good or even a possible solution. Thus are the
companies forced the option of focusing less on some part of the development.
When choosing this solution, the companies are being met with the important decisions regarding
what or which parts to prioritize less. This brings us to a short explanation of the process of
developing a game. The source of a game is an idea. Based on the idea, a game designer is creating
documentation describing what the game is supposed to contain. This documentation is then used as
the foundation for the actual designing and implementation of the game. In the end the product has
to be tested to ensure that it contains what the design documentation says, that all functionality
works the way it is supposed to, and that it can be run on all the different hardware setups that it is
supposed to. This short introduction to game development gives an idea of which parts the game
development process the companies potentially can reduce focus on when shortening their
development periods.
Let’s take a look at each part and discuss which drawbacks can appear when reducing focus on them
specifically. The inception of an idea is a more or less instant process and can be neglected regarding
time consumption. The game design is a more or less time consuming activity, but requires just a
single or a few employees to be done. In addition, the idea inception and the game design are tasks
that can be done an unlimited time in advance to actual development of the game. So, to some
extent those two activities can be disregarded.
Further on regarding the game design, it is now more and more common that game development
companies work according to an agile project model which usually emphasizes the pre-development
design phase a lot less than the models mainly used in the past. This reduces the focus on the game
design part automatically without the administration having to actively reduce it.
Reducing the focus on the implementation phase will result in all or some of the functionality being
of lesser quality than originally intended, or some earlier designed functionality not being developed
at all. Consequently, the game title will not be as good as it was supposed to be, potentially resulting
in less games sold and thereby less income for the company. As a result, most game development
companies which are aiming for a large amount of sold games and having their existence depending
upon their games selling well (like Funcom does), will not reduce the focus on the design and
implementation phase. This phase is on the contrary the most important part of game production for
such companies. The more cool features, graphics, and gameplay the game contains, the more
games they sell.
The last part of the game production is the testing phase. Since none of the earlier phases have been
cut down on it is given that this is the phase that most game development companies are doing the
Page 20 of 194
Project FHaSS
Vision Document
2012
largest cuts in. Less emphasis on the testing phase will result in less code specific testing and less
hardware compatibility testing, which in turn can result in software code errors – so-called bugs –
and hardware incompatibility. The word can is important in this relation because it leaves room for
the possibility of an untested game being released without problems at all, or at least with few
enough problems for the game to sell well. As mentioned above, if the companies were to cut down
in the implementation phase it would almost without exception result in fewer sold games. If they on
the contrary were to cut in the testing phase there is a possibility that it would not have the same
effect. So in essence, the decision is easy to make for game development companies that rely on a lot
of sold games; they do the cuts in the testing phase.
17.3 Fault-tolerance
For game development companies that develop ordinary standalone offline games, a released title
with lots of bugs and/or hardware incompatibilities would not result in a lower release sales number
than without (except if the game is so full of faults that the customers demand their money
returned), but it will worsen the game title’s and the game company’s reputation *6+. This in turn
could lead to less sold games for the next releases. This “game-fault-ignorance” is not possible for
game development companies that rely heavily on periodic subscription fees, like Funcom does.
Gameplay-ruining bugs or large hardware incompatibilities with a game title in this category will
result in the players abandoning the game rather quickly, potentially resulting in a lot less income for
the company than expected. Such companies therefore have to firstly release a game without major
faults, and secondly create frequent updates (patches) for the game after the release to remove
averagely and minor rated faults from the game. This will ensure that people don’t stop to play the
game, that is stop paying to play the game, because of insufficient testing and bug fixing.
So what is said above is actually that game development companies relying on periodic subscription
fees have to do more complete testing than companies selling games with a one-time-purchase
business model. This is not solely true. Companies that are producing online games, like for instance
Funcom, use the fact that their games are online as an advantage. By implementing a bug report
functionality in their games the players themselves can report back errors that has to be fixed. By
taking this advantage even further and opening up the game for one or several pre-release beta
testing periods, Funcom can get bug and crash information sent to them even before the official
release of the game. This results in Funcom having to spend less time on testing and quality
assurance for the games themselves, that is the costs of the testing phase is automatically reduced.
Such companies can then use more time actually fixing the bugs rather than finding them.
The fact that Funcom employees will have to spend a lot of time fixing bugs and hardware
incompatibilities has resulted in a demand of a system that effectively handles the information
gathered about the faults in their games. Funcom is currently using a system for this purpose that is
both not precise enough for their use nor hold the required functionality that Funcom needs.
17.4 Hardware trends
The evolution of the computer technology is as discussed earlier very fast paced. This is resulting in a
problem for game development companies that it can be hard to determine what type of, or more
precisely the capabilities of, the hardware that will be mainstream when their new game is planned
to be released. Without this knowledge the companies would have to base this solely on guessing,
which could result in a released game that is technically outdated, or on the contrary, a game that is
Page 21 of 194
Project FHaSS
Vision Document
2012
putting too high demands on the hardware components of the players computers. Both scenarios
resulting in less sold games.
Funcom is of this reason in demand of a system that can capture the hardware evolution trend for a
time period and extend it a certain amount of time into the future. The future trends will of course
only be predictions, but they will undoubtedly limit, or even remove, the need for guesswork.
17.5 Online
The fact that Funcom is producing online games gives them a great opportunity of getting
information regarding bugs, hardware incompatibilities, and hardware information in general,
directly sent to them from the players over the internet. The only questions are how and when to
send such information. Funcom is currently using a system in their games that is identifying when a
crash has occurred. This system has the responsibility of informing the user that a crash has
happened and to ask the user whether or not he wants to report information back to Funcom.
17.6 Usage of the system
There are different groups of Funcom employees that experience benefits from all of the collected
crash-data. Quality Assurance and several managers watch the system for bugs and hardware
incompatibilities and creates tasks for the programmers to fix these issues. The programming team
use the system to test their patches, that is to find out whether the issue was actually fixed or not by
trying to force the same situation that created the issue in the first place. The game developers in
general use the collected information and read its hardware trends in order to be able to foresee
what type of hardware will be mainstream when the product they are working on at the moment will
be released. This will enhance hardware compatibility and make visible potential future problems.
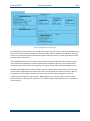
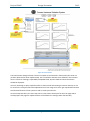
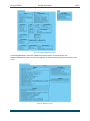
A typical crash scenario
1. A player is playing one of Funcom’s games.
2. The game crashes. A report of the crash including hardware specification and the part of
the source code where the crash occurred is sent to a Funcom server.
3. The report is stored in a database. Employees access the database through a web
interface to get crash specific and hardware information.
18 What to improve
18.1 Crash report parsing
When a crash occurs at a players computer a crash report is produced. This report consists of several
parts:
IP of the client, date, time, username, game server, etc.
Where in, and the actual part of, the code where the crash was produced (the callstack).
A so-called DxDiag file containing hardware information of the client computer in pure text
format.
This report is sent to one of Funcom’s web-servers where it is stored and extracted. A parser is then
starting to extract information from the components of the report. The information is stored in a
database for Funcom employees to later access.
Page 22 of 194
Project FHaSS
Vision Document
2012
The parser that extracts information does not extract enough nor exact enough information from the
report. There are even somewhat many cases where the parser is not able to obtain any information
at all about specific hardware, leaving the database field(s) as unknown. This results in insufficient
and inaccurate information for the Funcom employees to view, which in turn can result in poor
estimates. This part of the system will have to be improved.
18.2 Graphical User Interface
The Graphical User Interface (GUI) is not user friendly and is not representing the stored data in an
easy-to-understand way. For instance is information regarding percentage usage of the different
Windows versions displayed in a unaltered boring standard HTML table. The overall layout of the
web-pages are not very good-looking.
Further on, all the information for the employees to see is squeezed into one page, making the webbrowser’s scroll functionality heavily used. This is usually seen on as negative, and leaves the users
with a feeling of lack of overview and control.
18.3 Lack of functionality
Some functionality that Funcom employees would like to have in the system is not present in the
current system.
There is no handling of almost identical hardware types. This results in large tables of statistics with
rows for each and every type of GPU units ever discovered by the system. Since many hardware
types are varying by only tiny factors it’s very hard to get out the exact wanted information. For
instance it is usually more informational for the employees to know the percentage difference in
amounts of players that are using nVidia or ATI GPU’s, rather than the amount that are using specific
graphics cards from specific manufacturers.
It all comes down to the ability for the employees to filter what type of information they would like
to see. Some information can be more informal to the user when they have been
structured/grouped/organized in a certain way.
The current system is also lacking the future hardware evolution trend prediction functionality
described in the “Context of the study” part of this document. This is the functionality that the
employees can use to get a prediction of what hardware will be mainstream at a time in the future,
for instance on the release date of a new game. By getting such information, employees can plan for
optimizing the game towards the future mainstream hardware.
Further on there is currently no functionality for filtering the statistical data. That is; the statistics are
based on absolutely all data stored in the database. This is an enormous amount of data and is
gathered from players all over the world for many years and from several games. Funcom is
therefore in need of functionality for filtering the statistical data based on certain criteria, such as
geographical location of the players, time period, game title and game server.
19 How to improve it
To address the problem of a lot of unknown hardware we will be adding a functionality for adding
hardware information manually by the users. When unknown hardware has been recognized by the
Page 23 of 194
Project FHaSS
Vision Document
2012
system the users are given the possibility of entering the required information about the new
hardware type. This will then be reflected in the statistics with each entry of that specific hardware
no longer being unknown, but instead represented by the information the user entered. It must also
be possible to alter this information after the first time, in case of wrong input, input errors, etc.
The GUI can be enhanced a lot by generally giving the web-pages a good-looking and consistent
layout. Further on the statistical information can be given more life – and in fact be easier readable
and more containing – by displaying it as charts, as well as in tables.
For almost identical hardware types to be represented as one table row we will have to implement
some kind of grouping functionality. In some way a rule set of which hardware types are
corresponding to which table entry must be stored. This rule set must also either be automatically or
manually maintained, or a combination of the two approaches.
The filtering functionality can somewhat easily be implemented with the help of a bit more critical
and dynamic database queries than the current system is using. The actual filtering criteria can be
given as user input through the web-page interface. And the resulting filtered statistics returned and
shown through the same interface. For the users to be able to filter based on both geographical
location, time period, game title and game server, each of these criteria must have their own
possible input values.
20 Benefits
To both get rid of unknown hardware types and group almost identical hardware types as a single
type will make the statistics a lot more informative and complete, which in turn gives the employees
more and better hardware statistics of players of Funcom games. In other words the system is
enhanced with regard to what was the purpose of the system in the first place.
Improved GUI will in the first place of course give the users a more pleasant system to work with. The
statistics charts will put more information into less space, and graphs can also be read fast and
efficient without having to go into a very detailed level. The detailed level is what the tables are for.
With the new filtering functionality an employee can get more accurate and precise information, as
well as the more general information that the current system delivers. He/she can now for instance
get statistical information about the hardware of Korean players of Age of Conan in 2010 playing on a
specific server, as well as see the general statistics of all players ever reported a crash to the system.
This functionality gives the employees new possibilities of searching for trends and hardware
information based on their own criteria. For instance can geographically filtered information be very
valuable when it comes to porting a game to another country or region like Funcom did with Age of
Conan for the Asian market.
21 Sources
[1] http://en.wikipedia.org/wiki/Funcom (Last visited 13.12.2011)
[2] http://en.wikipedia.org/wiki/Graphics_processing_unit (Last visited 21.12.2011)
[3] http://www.vg.no/spill/artikkel.php?artid=182545 (Last visited 13.12.2011)
[4] http://www.idg.no/computerworld/article145027.ece (Last visited 13.12.2011)
Page 24 of 194
Project FHaSS
Vision Document
2012
[5] http://en.wikipedia.org/wiki/Video_game_development (Last visited 21.12.2011)
[6] http://www.shacknews.com/article/70451/rage-pc-players-report-bugs (Last visited 21.12.2011)
Page 25 of 194
Funcom Hardware Statistics System
Current System Description
Project name
Acronym
Funcom Hardware Statistics System
FHaSS
Client
Sensors & Supervisors
Funcom N.V.
Internal sensor
Olaf Hallan Graven
Date
Internal supervisor
Aurilla Aurelie Arntzen
10.01.2012
External supervisor
Rui M. Monteiro Casais
Group members
............................
Sondre Bjerkerud
............................
Sverre Christoffer Thune
............................
Dag Hem
............................
Kent Brian Dreyer
............................
Kim Richard Johansen
Project FHaSS
Current System Description
2011
Current System Description
22 General Document Information
Deliverable nr:
Deliverable type:
Release:
Workpackage:
Responsible:
D1.4.1.1
Reference
Public
1
Kent B. Dreyer
Sverre C. Thune
22.1 Declaration of intention
The purpose of this document is to help us understand how the current bug report system at Funcom
works. This will help us integrate our own system into the environment at Funcom.
22.2 Definitions and Acronyms
SFTP
GUI
TAR
DxDiag
Batch
Secure File Transfer Protocol
Graphical User Interface
Tape Archive File
DirectX Diagnostics
A collection (of files)
22.3 Document History
Version
1
1.5
2
Description
First version created
Renamed document from
"Current System Research" to
"Current System Description",
Updated structure
Updates after document review
Page 27 of 194
Date
07.12.2011
10.01.2012
29.05.2012
Project FHaSS
Current System Description
2011
23 Table of contents
22 General Document Information .................................................................................................... 27
22.1
Declaration of intention ........................................................................................................ 27
22.2
Definitions and Acronyms ..................................................................................................... 27
22.3
Document History ................................................................................................................. 27
23 Table of contents ........................................................................................................................... 28
24 The current system ........................................................................................................................ 29
24.1
Introduction ........................................................................................................................... 29
24.2
The Batchserver ..................................................................................................................... 29
24.3
The Internal Server ................................................................................................................ 29
24.3.1
General description of python files ............................................................................... 29
24.3.2
Miscellaneous Python files ............................................................................................ 31
24.3.3
Short rundown on remaining python files .................................................................... 32
24.4
The GUI server ....................................................................................................................... 32
25 Summary........................................................................................................................................ 32
26 Sources & References .................................................................................................................... 32
27 Attachments .................................................................................................................................. 32
Page 28 of 194
Project FHaSS
Current System Description
2011
24 The current system
24.1 Introduction
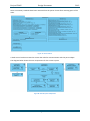
Funcom’s current bug report system consists of three servers: the batchserver, the internal server
and the GUI server. The first two are important for us to understand, because we will need to
integrate our own system to co-exist with these. The third, we will completely replace.
This document contains descriptions of the current system which will be a good reference for
ourselves when we are designing and implementing our system. Therefore it is quite technical. We
describe the current code with and then take notice of some of the important things we will need to
take into account.
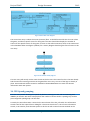
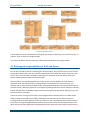
24.2 The Batchserver
The Batchserver is what we call the server which receives the bugs from the players. It is located
outside of the firewall of Funcom’s network. It is responsible for creating batches (a collection) of bug
files, which can then be downloaded to a server on the internal Funcom network.
A php file named ‘’bugsubmit’’ receives the bug report files (the XML files) from the the players.
These bug report files are then searched for keywords which define the category of the bug
(ldberrors, clientcrashes, clientasserts, scripterrors, bugreports, silentasserts). When the category is
detected the file is stored in a folder named ‘’batchtmp/subfolder’’ (where ‘’subfolder’’ are the
different categories).
WebRestarter.py starts processes of BatchMaker.py for each of the different categories.
Each process of BatchMaker.py creates a list of files in the subfolder it is assigned to within the
‘’batchtmp’’ folder. Then it creates a batch file (.tar) of all the files in that folder, and moves the
batch file to a subfolder of the same category within the ‘’batches’’ folder.
To sum up, the Batchserver receives bug reports, categorizes them and creates batches of the files to
be downloaded.
Initially we will not change anything on the Batchserver; it works good as it is.
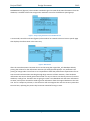
24.3 The Internal Server
The internal server consists of several python processes that together perform the
downloading of files from the batchserver, and then the parsing and storing of bug reports
and player hardware information.
This section explains the code of some of the important files in the current system, which we
can use for future reference when implementing our system.
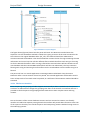
24.3.1 General description of python files
*see attachments for full flow of events on some of the files.
Restarter(Python):
Here all processes are started. Some even have multiple instances. (os.spawnvp())
Page 29 of 194
Project FHaSS
Current System Description
2011
Batchdownloader (Python, attachment 1):
The process receives arguments which sets the folder directory it will traverse. At this point it will
start downloading batch files from this path and move the files in the folder to the batch server’s
“outgoing” folder, and download it to the “incoming” folder on the internal server.
It deletes original files after successful transfer.
The important thing to noticehere is the connection to the batch server with user name and
password over SFTP. If we are going to replace the current system completely, we need to download
the files from the batch server with a similar method. Initially however, we can develop our system
to co-exist with the old one.
Reportdownloader(Python, attachment 2):
This file does similar work as the batch downloader, but moves files from the “complete “folder to
the “outgoing” folder on the batch server, and then downloads from the “outgoing” folder to the
“complete” folder on the internal server.
It deletes original files after successful transfer.
Also here the connection over SFTP is an important thing to notice(see explanation in previous
section)
XMLBugReport (Python, attachment 3):
This file calls the processing of the XML files when they are downloaded (and extracted). It uses a
method to parse the XML file, including the DxDiag file. It also moves the files to an archive when it is
finished with them. See attachment 3 for a more detailed flow of events.
fcBugMain (Python):
The function “ProcessFile” runs the “bugParser” function which returns a parsed bug report object.
This object is processed further and certain properties are updated if some conditions are true. Our
client informs that this bug report system functions well, thus should initially not be changed.
After the bug report object has been processed, “fcBugDXDiag” function is called and the DxDiag file
which belongs to the bug report is parsed.
After the DxDiag file is parsed, the bug report object is sendt to Bugzilla, which is a third party bug
tracking server software. However if the object has the type “DxDiag”, it is not sent. The type of the
bug report object is the category of the bug (originally parsed from the XML file). Under certain
conditions extra emails are sent to specific developers so that they get an alert when a certain bug
occur.
When we are going to develop our own parser for the DxDiag file, changes will be needed here. We
will want to keep the bugParsing, but use our own DXDiag parser. We might even use the already
exsisting DxDiag parser, but then parse again to get better control on and more accurate
information.
Page 30 of 194
Project FHaSS
Current System Description
2011
fcBugParser (Python, attachment 4):
Here we have the code responsible for parsing the XML files and creating bug report objects of them.
A bug report contains a lot of information parsed from the XML file (see attachment 4), which
includes the DxDiag file, the file we are initially interested in.
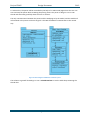
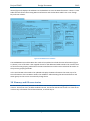
fcBugDXDiag.py
This file handles the parsing and storing of hardware information.
Some properties are taken from the bugReport:
● Username (player login name)
● Universe (game server)
● Bits (System architecture, 32bit / 64bit)
Then it collects text lines by parsing the DxDiag document for retrieving the following information:
● Operating system
● Processor
● Computer memory (RAM)
● Card name (Actual model name of graphic hardware)
● Video memory (Dedicated if exists, else display memory)
● Screen resolution
● Driver version (for the video card)
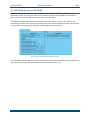
After the information is successfully retrieved from the document, it is inserted into the “hw_info”
table in the database:
● insert into hw_info (username, universe, os, cpu, ram, vcard, vram, driver, resolution, bits,
count)(Where count=count+1)
The insert sentence over displays the type of information that is currently being stored in the
“hw_info” table of the database. See attachment 5 for an example of the text lines extracted from
the DxDiag file. Because of the large file size we are not able to open the “hw_info” file in either
notepad++ or PhpMyAdmin for a complete analysis of the table.
24.3.2 Miscellaneous Python files
There are several other important files in the system that perform different tasks. However these
files are not essential to understand in detail for our first task (creating the new GUI), therefore we
will not go into the details regarding the source code of these files at this time. Below is a list of these
files with a general description of their responsibility.
fcBugEmail
fcBugzilla
fcPreforce
BugStats
fcBugStats
fcBugSymbols
Library designed for sending emails automatically regarding bugs or
crashes to specific developers.
Library for communicating with Bugzilla
Contains functions for version control with Preforce
This class retrieves and represents data from the database in HTML.
This works as the graphical representation of the system on the
internal server.
Library for manipulating the MySQL database.
Library for processing files (e.g. callstack) for debug symbols.
Page 31 of 194
Project FHaSS
Current System Description
2011
24.3.3 Short rundown on remaining python files
DumpRevision
createTables
Reporter
mapFileImporter
Simply calls upon fcPerforce.dumpRevisionList(63101, 63102)()
Simply calls upon the create_tables from the fcBugStats class
Contionously prints the number of files in the category subfolders to
the console
Collects and manages map files and sends it to fcBugSymbols for
parsing
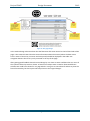
24.4 The GUI server
This is the server which runs the website GUI (in form of a website) for looking at the hardware
information extracted from the DxDiag files.
Hardware information is selected from the hardware database. The information is then put through
functions which results in the GUI website displaying some general statistics of the hardware
information (e.g. how many types of a certain processor). In its current state this GUI is very basic
and limited.
Our first task is to create a better and more useful GUI.
25 Summary
● The batch server creates batches of bug files and moves them to the appropriate
folder to be downloaded.
● The internal server downloads the files and extracts them.
● The files are parsed, bug reports and hardware information is extracted.
● The hardware information is stored in hw_info table.
26 Sources & References
http://www.bugzilla.org/ (Last visited 14.12.2011)
http://www.perforce.com/ (Last visited 14.12.2011)
Funcom’s current bug System
27 Attachments
Attachment 1: batchdownloader.py
An argument sets the path of the folder the instance of this process looks through.
An infinite loop that handles downloading files from where this folder starts.
Connects to the batch server with user name and password over SFTP.
Opens the correct folder in ‘’batches’’ on the batchserver and creates a list of all the files in
the folder.
5. Moves the files in the list to the outgoing folder on the batchserver and then downloads
them into the incoming folder on the internal server.
1.
2.
3.
4.
Page 32 of 194
Project FHaSS
Current System Description
2011
6. Deletes the original file from the outgoing folder on the batchserver.
7. Opens TAR-files in the incoming folder on the internal server and extracts them to the same
folder.
8. Closes the TAR-file, writing to file and the folder paths.
9. Closes all contact with the SFTP and sockets.
Attachment 2: Reportdownloader.py
1.
2.
3.
4.
5.
6.
7.
8.
Sets the path to the complete folder.
An infinite loop that handles downloading files from this folder starts.
Connects to the batch server with user name and password over SFTP.
Opens the correct folder in ‘’batches’’ on the batch server and creates a list of all the files in
the folder.
Moves files from the complete folder to the outgoing folder on the batch server.
Downloads the files from the batch server and moves them to the complete folder on the
internal server.
Deletes the original files in the outgoing folder on the batch server
The downloaded files will later on be handled by XMLBugReport described later.
Attachment 3: XMLBugReport.py
Handles arguments if they exsist (up to three: set incomingDir, logfile and forceid).
Infinite loop starts.
Creates a list of the files in the complete folder (on the internal server).
Moves the file from the complete folder to the processing folder.
Start to process the file (calls fcBugMain.ProcessFile, which parses the XML file, including
dxdiag).
6. If the processing is successful, the file is moved to its own subfolder in the archive/old folder.
7. If the processing fails, the file is moved to a failed folder.
1.
2.
3.
4.
5.
Attachment 4: List of contents of a ‘’bug report’’
●
●
●
●
●
●
●
●
●
●
●
●
●
●
IPAddress
Date
Username
Title
Type
Email
Category
Universe
Body
Attachments
BodyElements
BuzillaCCs
ExtraCCs
TeleportHistory
Attachment 5: mapfileimporter.py
● Runs the function importMapFiles continously
● makes a directory list of the files in the “mapfiles” folder.
● Traverses the directory looking for files to import.
Page 33 of 194
Project FHaSS
●
●
Current System Description
Takes all files and calls parseFile function from fcBugSymbols
Moves all files from “importMapFiles” folder to “archive” folder
Attachment 6: Example of extracted text lines from DxDiag
● Operating System: Windows XP Professional (5.1, Build 2600) Service Pack 3
●
●
●
●
●
●
(2600.xpsp_sp3_gdr.080814-1236)
Processor: Intel(R) Celeron(R) M processor
1.60GHz
Memory: 1016MB RAM
Card name: Mobile Intel(R) 915GM/GMS,910GML Express Chipset Family
Current Mode: 1280 x 800 (32 bit) (60Hz)
Display Memory: 96.0 MB
Driver Version: 6.14.0010.4609 (English)
Page 34 of 194
2011
Funcom Hardware Statistics System
Test Strategy
Project name
Funcom Hardware Statistics System
Client
Funcom N.V.
Date
29.05.2012
Author
Kim Richard Johansen
Acronym
FHaSS
Sensors & Supervisors
Internal sensor
Olaf Hallan Graven
Internal supervisor
Aurilla Aurelie Arntzen
External supervisor
Rui M. Monteiro Casais
Group members
............................
Sondre Bjerkerud
............................
Sverre Christoffer Thune
............................
Dag Hem
............................
Kent Brian Dreyer
............................
Kim Richard Johansen
Project FHaSS
Test Strategy
2012
Test Strategy
28 General Document Information
Deliverable nr
Deliverable type
Release
Work package
Responsible
D1.5.2
Report
Public
1
Kim Richard Johansen
28.1 Declaration of intention
The intention of this document is to give the reader insight into how the group is planning to test the
system they are to produce. It contains testing strategy, different testing methods and types we are
going to use and how we plan to document our performed tests.
28.2 Definitions and Acronyms
Bug
API
An error in the programming code
Application Programming Interface
28.3 Document History
Version
1
2
2.5
Description
First version created
Document template added.
Information reviewed and
updated.
Updates after document review
Page 36 of 194
Date
15.12.2011
04.01.2012
29.05.2012
Project FHaSS
Test Strategy
2012
29 Table of contents
28 General Document Information .................................................................................................... 36
28.1
Declaration of intention ........................................................................................................ 36
28.2
Definitions and Acronyms ..................................................................................................... 36
28.3
Document History ................................................................................................................. 36
29 Table of contents ........................................................................................................................... 37
30 Requirements for testing............................................................................................................... 38
31 Test strategy .................................................................................................................................. 38
32 Testing categories.......................................................................................................................... 39
32.1
Verification and validation .................................................................................................... 39
32.2
Functional and non-functional testing .................................................................................. 39
32.3
Static and dynamic testing .................................................................................................... 39
33 Testing methods ............................................................................................................................ 39
33.1
Strategy ................................................................................................................................. 39
33.1.1
Black-box testing ........................................................................................................... 39
33.1.2
White-box testing .......................................................................................................... 39
33.2
Methods ................................................................................................................................ 40
33.2.1
Function test .................................................................................................................. 40
33.2.2
Code Compilation .......................................................................................................... 40
33.2.3
Debugging ...................................................................................................................... 40
33.2.4
Code Review .................................................................................................................. 40
33.2.5
User Interface ................................................................................................................ 40
33.2.6
Ad Hoc test .................................................................................................................... 40
33.2.7
Strain test ...................................................................................................................... 40
33.2.8
Regression test .............................................................................................................. 40
33.2.9
Performance test ........................................................................................................... 40
34 Test documentation ...................................................................................................................... 41
34.1
Test specification ................................................................................................................... 41
34.2
Test log .................................................................................................................................. 41
34.3
Test reports ........................................................................................................................... 41
35 Responsibility ................................................................................................................................ 41
35.1
Test manager ......................................................................................................................... 42
35.2
Test analyst............................................................................................................................ 42
35.3
Tester ..................................................................................................................................... 42
Page 37 of 194
Project FHaSS
Test Strategy
2012
36 Sources .......................................................................................................................................... 42
30 Requirements for testing
The main purpose for testing is to ensure all specifications in the requirement specification are
implemented and approved.
The tester should distinguish between constructive and destructive approaches to the test. Think
about how the unit to be tested may fail, but do not be so critical that the unit never measure up and
is seen as unacceptable.
It is important when the testing is executed that the person doing the test is not the same person
who has written the code to be tested. This is because the person who has written the code often
gets blind on their own work and does not want to find any errors in the code. If the person who
executes the test has not written the code, the person goes deeper into the code and may think of
other ways to test the code that the developer may not have thought of.
31 Test strategy
This will be a system were the importance of stability and reliability is high at any time. The producer
of the game needs to get the information they want from the bug-system. The tests need to be
accurate and test the system in all ways possible.
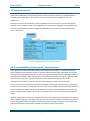
Our main strategy of testing will be a gradual step by step approach, critical to less important. The
basic elements of the system will have the highest priority and will be tested first. Regression tests
will be done after code alteration of previous tested functions or when new functions have been
added to the system. This is to ensure that previously tested functions still work.
When we are getting closer to a full release and most of our grade A requirements have been
completed and tested we will run an ad hoc test. This is to find functionality that may or may not be
intended that can “break” the system. When this had been completed a strain test will be
performed. This test simulates different work load for the system and will ensure us that our system
may handle a high pressure of crash reports and that no data gets corrupted due to a high workload
for the system.
Page 38 of 194
Project FHaSS
Test Strategy
2012
32 Testing categories
In the following are short descriptions of different testing categories our tests will be categorized
under.
32.1 Verification and validation
Verification tests of the system will answer if the system is built correctly based on the requirement
specification.
Validation tests will answer if the software created is what the customer wants.
32.2 Functional and non-functional testing
Functional testing is testing that verifies a specific functionality of the system. These are usually
directly related to the requirement specification.
Non-functional testing tests aspects of the system that may not be related to a specific functionality
of the system. This can for example be performance or security.
32.3 Static and dynamic testing
Reviewing/reading the code is considered static testing, while debugging or executing the code is
considered dynamic testing.
33 Testing methods
In the following are short descriptions of testing strategy and methods we will be using for testing
throughout this project.
33.1 Strategy
33.1.1 Black-box testing
The tests performed under this strategy are made directly from the requirements specification.
Black-box testing is a method of software testing for testing the functionality of the system without
knowing the structure of the system. Expected data on the output is a result of the known input data,
tests under this strategy are also called functional testing.
33.1.2 White-box testing
This strategy deals with the internal logic and structure of the code. It is possible to analyze the test
element and decide exactly how the test is built up and what to test. When making a test based on
white-box testing, knowledge about the structure for the element to be tested is needed.
Page 39 of 194
Project FHaSS
Test Strategy
2012
33.2 Methods
33.2.1 Function test
A function test is written in order to check if a functional completed requirement behaves and works
as planned.
33.2.2 Code Compilation
A successful compile of the code is a basic form of testing.
33.2.3 Debugging
This is a testing method done with the API to find out what part of the code that fails when a code
compilation fails. When a verification test fails and a code compilation is successful, debugging can
be used to go through the code step by step to indentify the error by examining the values of
variables.
33.2.4 Code Review
A person just reading the code is a form of static testing. He should not be the same person that
wrote the code.
33.2.5 User Interface
This type of testing is about confirming that the user get the correct response based on his actions.
33.2.6 Ad Hoc test
It’s a test commonly done after large system implementations and late in the project where the
tester goal is to “break” the system by trying different system functionality. This test is done without
any formal test plan. This test can also include negative testing.
33.2.7 Strain test
The purpose of the strain test is to give the system variable amounts of data (e.g. bug reports) over a
lengthy time to see how the system handles it. While the variable data is given to the system, we will
use the website to load/show results from the database. The point behind this test is to see how the
system handles/operates during what is looked at as normal phase (e.g. after bugs is fixed and
software crashes has reduced) and a high pressure phase (e.g. after large software implementations/
game extensions) where they may be a high amount of crashes experienced. An even larger pressure
will also be tested to ensure that the system will manage larger work than intended. All data inserted
into the system is checked up against manually calculated results to ensure that no data has been
corrupted due to high system load.
33.2.8 Regression test
The regression test is meant to see if previously tested functions in our system still work after new
code has been implemented or after an update.
33.2.9 Performance test
This type of testing is to check if the systems performance is good enough (e.g. the time it takes for
the website to load/show results as charts or tables with information from the database).
Page 40 of 194
Project FHaSS
Test Strategy
2012
34 Test documentation
Test documentation will help us to quality assure our project. The documents will also give us some
indication of the time used to quality assure our project in accordance to the requirements
specification.
34.1 Test specification
The test specification contains information about every test to be done with cross reference to other
documents that may be relevant.
34.2 Test log
The point behind a test log is to document every test that has been executed. It will contain:
Name of tester
When did the test occur
What was the result
Error list
Evaluation
34.3 Test reports
Tests that constitute a module will be reported in a test report. The meaning for the report is that
many of the tests are a part of the same module. The reports therefore create a good overview over
all the tests and summarize them into modules.
Currently there is just one module, but as we work on the project, extensions (e.g. more
requirements) may be added and from there more modules can be added.
Modules:
Web functionality
35 Responsibility
There are three roles to be filled when it comes to testing:
Test manager
Test analyst
Tester
In smaller projects it’s most common for the roles Test manager and Test analyst to be filled by the
same person. The Tester role is common to be filled by the whole group.
This is the case in our project.
Page 41 of 194
Project FHaSS
Test Strategy
35.1 Test manager
A test manager has the main responsibility for testing:
Ensure that tests are planned and the requirements are arranged.
Ensure that all test reports are made
Keep all test documentation up to date and organized
Define what test strategies to be used
Verify test results with the rest of the group and the employer
35.2 Test analyst
The main responsibility for a test analyst is:
Identify test elements
Describe test progression
Evaluate the quality of a unit tested
35.3 Tester
The tester role is a role every project member can take. The tester’s tasks are:
Follow the test procedure to execute the test
Write a test log with results
Separate errors to a separate list in the log
36 Sources
http://en.wikipedia.org/wiki/Test_management(Last visited 15.12.2011)
http://en.wikipedia.org/wiki/Test_plan(Last visited 15.12.2011)
http://www.aptest.com/glossary.html(Last visited 15.12.2011)
RIVET Test strategy document (HIBU Kongsberg library)
Dragonfly Test strategy document (HIBU Kongsberg library)
Page 42 of 194
2012
Funcom Hardware Statistics System
Requirements Specification
Project name
Funcom Hardware Statistics System
Client
Funcom N.V.
Date
10.01.2012
Author
Sondre Bjerkerud
Acronym
FHaSS
Sensors & Supervisors
Internal sensor
Olaf Hallan Graven
Internal supervisor
Aurilla Aurelie Arntzen
External supervisor
Rui M. Monteiro Casais
Group members
............................
Sondre Bjerkerud
............................
Sverre Christoffer Thune
............................
Dag Hem
............................
Kent Brian Dreyer
............................
Kim Richard Johansen
Project FHaSS
Requirements Specification
2012
Requirements Specification
37 General Document Information
Deliverable nr
Deliverable type
Release
Work package
Responsible
1.6.5
Research
Public
1
Sondre Bjerkerud
37.1 Declaration of intention
The intention of this document is to give the reader an understanding of the requirements of the
system we are to create. The requirements capturing methods we have been using will be explained
as well as the priority levels used to organize the requirements. The later sections will give both a list
of the requirements as well as a more in-depth description of each one. After having read this
document the reader shall know what features the product is to hold and how the features shall
work.
37.2 Definitions and Acronyms
BugZilla
CPU
GPU
RAM
DX
URL
Bug handling software used by Funcom.
Central Processing Unit
Graphical Processing Unit
Random Access Memory
DirectX: A collection of application programming
interfaces (APIs) for handling tasks related to
multimedia, like for instance game programming.
Uniform Resource Locator
37.3 Document History
Version
1
2
3
4
5
Description
Created the document. Created “Requirements list”
and “Requirements details” sections.
Added priority explanation and requirement
capturing sources. Updated origin and date fields of
the requirement details tables.
Rewrote the text about the requirement capturing
meeting. Project document template incorporated.
Added “Courses with Lorenzo Aurea” as a
requirement capturing source. Added requirement
A-NF-5. Rewrote/redefined requirements A-F-1, AF-4, A-NF-2, and A-NF-3.
Added paragraph under the “Meetings with
Page 44 of 194
Date
15.12.2011
19.12.2011
3.01.2012
19.03.2012
21.05.2012
Project FHaSS
Requirements Specification
2012
external supervisor” requirement capturing source.
Added requirements B-NF-1, C-F-2, C-F-3, C-F-4,
and C-NF-1. Rewrote/redefined requirement A-NF6.
38 Table of contents
37 General Document Information .................................................................................................... 44
37.1
Declaration of intention ........................................................................................................ 44
37.2
Definitions and Acronyms ..................................................................................................... 44
37.3
Document History ................................................................................................................. 44
38 Table of contents ........................................................................................................................... 45
39 Requirements capturing ................................................................................................................ 47
39.1
Meetings with the external supervisor ................................................................................. 47
39.2
The Product Backlog .............................................................................................................. 47
39.3
Technical Research ................................................................................................................ 47
39.4
Courses with Lorenzo Aurea.................................................................................................. 47
40 Changes in requirements .............................................................................................................. 47
41 Requirements list........................................................................................................................... 48
41.1
A Requirements ..................................................................................................................... 48
41.1.1
Functional ...................................................................................................................... 48
41.1.2
Non-Functional .............................................................................................................. 48
41.2
B Requirements ..................................................................................................................... 48
41.2.1
Functional ...................................................................................................................... 48
41.2.2
Non-Functional .............................................................................................................. 48
41.3
C Requirements ..................................................................................................................... 49
41.3.1
Functional ...................................................................................................................... 49
41.3.2
Non-Functional .............................................................................................................. 49
42 Requirements details..................................................................................................................... 49
A-F-1: Display hardware/software statistics ................................................................................. 49
A-F-2: Display hardware/software evolution charts ..................................................................... 50
A-F-3: Filter statistics ..................................................................................................................... 50
A-F-4: Hardware type management .............................................................................................. 50
A-F-5: Hardware grouping ............................................................................................................. 51
A-NF-1: Programming language .................................................................................................... 51
Page 45 of 194
Project FHaSS
Requirements Specification
2012
A-NF-2: Model-View-Controller .................................................................................................... 51
A-NF-3: Database type................................................................................................................... 51
A-NF-4: Database connection........................................................................................................ 51
A-NF-5: Database access ............................................................................................................... 51
A-NF-6: Web-page loading time .................................................................................................... 52
A-NF-7: Wiki pages documentation .............................................................................................. 52
A-NF-8: BugZilla interfacing ........................................................................................................... 52
B-F-1: Display hardware/network statistics .................................................................................. 52
B-F-2: Display software statistics................................................................................................... 52
B-NF-1: Windows service............................................................................................................... 53
C-F-1: Future hardware prediction ................................................................................................ 53
C-F-2: Chart raw data .................................................................................................................... 53
C-F-3: Textual help......................................................................................................................... 53
C-F-4: Chart zoom .......................................................................................................................... 53
C-NF-1: Filter URLs ......................................................................................................................... 53
43 Attachments .................................................................................................................................. 54
Page 46 of 194
Project FHaSS
Requirements Specification
2012
39 Requirements capturing
The requirements has been captured from the following four (4) sources.
39.1 Meetings with the external supervisor
There have been carried out two major meetings where the assignment has been discussed; the first
meeting at the Funcom office in Oslo in September, and a user requirements capturing meeting in
October. In the first meeting a brief explanation of the assignment was given for the group to be able
to consider accepting it, whereas a more in-depth requirements capturing interview was done in the
second. The second meeting was held via Skype and the interview part lasted for about half an hour.
The group asked a series of open questions regarding details about the assignment and eventual
extensions of it.
Throughout the project period there has before and after each Scrum Sprint been held a set of three
meetings with the external supervisor (Product Owner). In the latter of the three, the Sprint Planning
meeting, there has several times come up completely new requirements, or changes or extensions to
already existing requirements.
39.2 The Product Backlog
The Scrum project model is using a feature called the Product Backlog (PB) for the task of editing,
organizing and prioritizing requirements. It is the responsibility of the Product Owner (in our case this
is the external supervisor) to add so-called user stories to the PB. User stories are nothing more than
user requirements formulated in a specific way. We have converted the user stories from the PB into
ordinary requirements for this document. Most of the requirements in the PB are the same as those
captured in the meetings as described in the section above.
39.3 Technical Research
A Technical Research with a Technical Document as the result has been used to confirm that some of
the user requirements actually are the best possible choices for the given system.
39.4 Courses with Lorenzo Aurea
Lorenzo Aurea is an employee in Funcom and also one of the group’s unofficial supervisors in this
project. In the start of the development/implementation period of the project (after New Year)
Lorenzo organized two courses for the group to ease the many problems we most probably would
face with the technology we were to start using. In these courses some of the already defined
requirements in the PB were further explained in a bit more detail and on a more technical level, and
some new tweaks to them were introduced. Those tweaks has effected some of the requirements
defined in this document.
40 Changes in requirements
The Scrum project model handles the problem of fluid requirements by letting the Product Backlog
(PB) be fluid. It is up to the Product Owner to do changes, add, or delete user stories from the PB and
prioritize them. This means that the requirements described in this document are by no means final,
neither are the number, organization, nor the definition of them. The requirements are all fluid and
modifications can happen at all times throughout the project period. The current requirements will
act as a basis for the planning of, and the starting work with, the project, and in the case that no
Page 47 of 194
Project FHaSS
Requirements Specification
2012
changes are done to the PB they are the requirements we will work towards
developing/implementing for the whole project period.
41 Requirements list
Following is a list of the requirements for the Hardware Statistics System. The requirements are
organized by priority as they are given in the Product Backlog by the external supervisor. The Product
Backlog is prioritized as a list without categories, but there are a couple of somewhat clear but not
displayed lines partitioning the user stories with regard to priority. Of this reason it felt natural to
separate the requirements into three priority categories; A requirements are major features
necessary for the new system to be able to outdistance the current system, B requirements are
feature extensions that will further extend the range of use of the system, and C requirements are
features that can even further extend the range of use of the system, but which are of lesser
importance.
The following is only sort of a list of the titles of the requirements organized in their respective
priority category. Supplementary details for each requirement are given in the section
“Requirements Details”.
41.1 A Requirements
41.1.1 Functional
A-F-1
Display hardware/software statistics table.
A-F-2
Display hardware/software evolution charts.
A-F-3
Filter statistics.
A-F-4
Hardware type management.
A-F-5
Hardware grouping.
41.1.2 Non-Functional
A-NF-1
Programming language.
A-NF-2
Model-View-Controller.
A-NF-3
Database type.
A-NF-4
Database connection.
A-NF-5
Database access.
A-NF-6
Web-page loading time.
A-NF-7
Wiki pages documentation.
A-NF-8
BugZilla interfacing.
41.2 B Requirements
41.2.1 Functional
B-F-1
Display hardware/network statistics.
B-F-2
Display software statistics.
41.2.2 Non-Functional
B-NF-1
Windows service.
Page 48 of 194
Project FHaSS
Requirements Specification
2012
41.3 C Requirements
41.3.1 Functional
C-F-1
Future hardware evolution prediction.
C-F-2
Chart raw data.
C-F-3
Chart zoom.
C-F-4
Textual help.
41.3.2 Non-Functional
C-NF-1
Filter URLs.
42 Requirements details
The requirements from the requirement list will in this section be explained in detail. Each
requirement will be described using the following table:
Category
Date
Description
ID
Origin
An explanation of the fields in the table:
Category: A, B or C requirement.
ID: The requirement specific identification.
Date: The date the requirement was captured. In case the requirement has been captured
several times the date of the first capture will be given.
Origin: From what source was the requirement captured. The possibilities are the three
mentioned capturing sources described in the section above.
Description: Self-explanatory.
A-F-1: Display hardware/software statistics
Category
Date
Description
A
ID
A-F-1
27.10.2011
Origin
Meetings & Product Backlog
Display hardware information for players of Funcom games, over time, in table
format in a web-page. The table shall contain the percentage distribution of the
different possible hardware/software that players are using. The different
hardware/software categories to be displayed statistics for are:
a. CPU
o Speed: In MHz
o Number of cores.
o Model.
b. Graphics card
o GPU model.
o VRAM size/amount.
o Primary Display Resolution.
o Multi-Monitor Resolution.
c. RAM size/amount.
d. Windows OS: In groups by version, with 32 and 64 bit versions being
separate groups.
Page 49 of 194
Project FHaSS
Requirements Specification
2012
The grouping criteria, that is the boundary values that separate on group from
another, is to be defined/put in by the administrator(s) of the system.
The time period of hardware data for which the calculations are based upon shall
be put in by the user of the system.
A-F-2: Display hardware/software evolution charts
Category
Date
Description
A
ID
A-F-2
27.10.2011
Origin
Meetings & Product Backlog
Some of the hardware/software information that are displayed in tables (A-F-1)
shall also be displayed as evolution charts. The horizontal axis of the charts shall
describe time, and the vertical axis shall describe the percentage of players using
the corresponding hardware/software at the given time. The different charts to
be displayed are:
a. CPU: Split between AMD and Intel.
b. GPU: Split between nVidia, Intel, AMD and others.
c. CPU cores: Split between 1, 2, 4, and other, number of cores.
d. Windows OS version and DirectX version: Split between DX11 GPU &
Windows 7, DX10 GPU & Windows 7, and DX10/DX11 and Windows XP.
The current percentage distribution shall also be displayed in proximity to the
chart. The time period that the charts are showing the evolution for is to be put
in by the user of the system.
A-F-3: Filter statistics
Category
Date
Description
A
ID
A-F-2
27.10.2011
Origin
Meetings
Filter the hardware and software statistics. It must be possible to filter by a
combination of options from the different criteria. The criteria and their options
are:
a. Geographical location: All the different continents and countries that
are registered in the database. The countries shall be grouped by their
respective continent.
b. Time period: Date from and to.
c. Funcom game: The Secret World, Age of Conan, Pets Vs. Monsters.
d. Game server: The list of servers respective to the game selected (c). If
no game is selected it should not be possible to pick game server.
All the filter criteria are to be put in by the user of the system.
A-F-4: Hardware type management
Category
Date
Description
A
ID
A-F-2
27.10.2011
Origin
Meetings
It must be possible for an administrator of the system to add, edit, and delete,
so-called general hardware types.
The system must be able to recognize if new types of hardware has been
registered. When this happens it must be possible for an administrator of the
Page 50 of 194
Project FHaSS
Requirements Specification
2012
system to map the newly recognized hardware type onto a general hardware
type. The Hardware Statistics displayed in tables (A-F-1) and in charts (A-F-2)
will only be displaying information for the general hardware types.
The different categories of general hardware types that can be registered are:
CPU Model.
GPU Model.
A-F-5: Hardware grouping
Category
Date
Description
A
ID
A-F-2
27.10.2011
Origin
Meetings
The system must be able to recognize almost identical hardware types and
group them to be shown as only one more general type in the statistics. The
general hardware types are those of requirement A-F-2. The user shall be given
information about currently registered but not recognized hardware types. The
user will then manually have to decide what hardware type the different
unrecognized hardware types is to be grouped under.
Ungrouped/Unrecognized registered hardware shall be grouped in an
“Unknown” group in the statistics.
A-NF-1: Programming language
Category
Date
Description
A
ID
A-NF-1
Meetings, Product Backlog &
27.10.11
Origin
Technology Document
The whole system is to be implemented using the programming language C# on
top of the ASP.NET framework.
A-NF-2: Model-View-Controller
Category
Date
Description
A
ID
A-NF-2
11.12.11
Origin
Product Backlog
The code of the web-interface shall be designed and implemented following the
ASP.NET Model-View-Controller pattern.
A-NF-3: Database type
Category
Date
Description
A
ID
A-NF-3
11.12.11
Origin
Product Backlog
The system must be compatible with a database of the type Oracle.
A-NF-4: Database connection
Category
Date
Description
A
ID
A-NF-4
11.12.11
Origin
Product Backlog
The system, that is both the data collection from database and the parser, must
make use of nHibernate for connecting to and accessing the database.
A-NF-5: Database access
Category
Date
Description
A
ID
A-NF-5
11.12.11
Origin
Lorenzo Aurea
The web-interface shall be given an interface to the database from a Windows
Page 51 of 194
Project FHaSS
Requirements Specification
2012
Communication Foundation web-service. In other words, it shall not interface
with the database directly.
A-NF-6: Web-page loading time
Category
Date
Description
A
ID
A-NF-5
11.12.11
Origin
Product Backlog
The web-page displaying the statistics defined in requirement A-F-1 must load
within 10 seconds when the time filter defined in requirement A-F-3 is set to
span over the last month.
A-NF-7: Wiki pages documentation
Category
Date
Description
A
ID
A-NF-7
11.12.11
Origin
Product Backlog
The system must be documented using Wiki pages. Documentation shall consist
of:
A user manual.
A system overview/specification/description.
A-NF-8: BugZilla interfacing
Category
Date
Description
A
ID
A-NF-8
27.10.11
Origin
Meetings
The new system has to interface with BugZilla in the same way the current
system does.
B-F-1: Display hardware/network statistics
Category
Date
Description
B
ID
B-F-1
11.12.11
Origin
Product Backlog
This is an extension of requirement A-F-1. Two new types of information to be
displayed are added to the list. The two types of information to be displayed
statistics for and their specific grouping structure are as follows:
a. HDD (Hard Disk Drive)
a. Capacity: In the following groups: 10-99GB, 100-249GB, 250499GB, 500-749GB, 750-999GB, and above 1TB.
b. Type: In groups of SSD or Normal (Magnetic Disk).
b. Network download speed: In groups of all the different speeds
registered in the database.
All the filter types of requirement A-F-3 shall be compatible with the two new
types of information as well.
B-F-2: Display software statistics
Category
Date
Description
B
ID
B-F-2
11.12.11
Origin
Product Backlog
Statistical information about specific software installed on the players
computers shall be displayed in a table. The table shall contain entries for the
different types of software and the corresponding percentage of players who
have that software installed on his/her computer. The types of software are:
a. Java
b. Unity
c. Flash
Page 52 of 194
Project FHaSS
Requirements Specification
2012
d. Web browsers: Microsoft Internet Explorer, Mozilla Firefox, Google
Chrome, Opera.
B-NF-1: Windows service
Category
Date
Description
B
ID
B-NF-1
24.04.12
Origin
Meetings
Eventual modules needed to be implemented to support the web-interface and
the windows communication foundations (WCF) application layers shall be
implemented as a Windows Service.
C-F-1: Future hardware prediction
Category
Date
Description
C
ID
C-F-1
27.10.11
Origin
Meetings
Calculation of a prediction of the hardware evolution of the players of Funcom
games a set amount of time into the future based on the hardware evolution
from a set amount of time backwards in time. The length of the future time
period to be predicted and the backward time period to be the basis of the
prediction, is to be put in by the user of the system. The prediction shall be
displayed as extended chart lines in the charts of requirement A-F-2.
It must be possible to toggle whether or not the future prediction shall be
displayed or not.
C-F-2: Chart raw data
Category
Date
Description
C
ID
C-F-2
24.04.12
Origin
Meetings
The system must be able to display the raw data that the charts defined in
requirement A-F-2.
C-F-3: Textual help
Category
Date
Description
C
ID
C-F-3
24.04.12
Origin
Meetings
Functionalities in the web-page interface that is not self-explanatory to a
completely new user must be explained through some form of textual help in
the interface. It must be possible for the user to see the help text in the current
page he has loaded. In other words, he/she shall not have to enter another page
to view the help text.
C-F-4: Chart zoom
Category
Date
Description
C
ID
C-F-4
4.05.12
Origin
Meetings
It must be possible for the user to choose to get displayed a zoomed/enlarged
version of one of the charts defined in requirement A-F-2.
C-NF-1: Filter URLs
Category
Date
Description
C
ID
C-NF-1
4.05.12
Origin
Meetings
When the web-interface is displaying hardware statistics as defined in
requirement A-F-1 and B-F-1, based on the filters defined in requirement A-F-3,
the web browser must display an URL that when accessed at a later point in
Page 53 of 194
Project FHaSS
Requirements Specification
time will make the system reproduce the same statistics/filter selection.
43 Attachments
Product Backlog
Page 54 of 194
2012
Funcom Hardware Statistics System
Test Specification
Project name
Funcom Hardware Statistics System
Client
Funcom N.V.
Date
24.05.2012
Author
Kim Richard Johansen
Acronym
FHaSS
Sensors & Supervisors
Internal sensor
Olaf Hallan Graven
Internal supervisor
Aurilla Aurelie Arntzen
External supervisor
Rui M. Monteiro Casais
Group members
............................
Sondre Bjerkerud
............................
Sverre Christoffer Thune
............................
Dag Hem
............................
Kent Brian Dreyer
............................
Kim Richard Johansen
Project FHaSS
Test Specification
2012
Test Specification
44 General Document Information
Deliverable nr:
Deliverable type:
Release:
Workpackage:
Responsible:
D1.7.4
Report
Public
1
Kim Richard Johansen
44.1 Declaration of intention
This is a document containing information about all the tests that are to be done. All the
tests are made with basis upon the requirements specification that contains a list of all the
requirements.
44.2 Definitions and Acronyms
Bug
Parser
CPU
GPU
RAM
DX
HDD
SSD
OS
COS
An error in the programming code.
Searches a data file for key words and copies the values it
finds.
Central Processing Unit
Graphical Processing Unit
Random Access Memory
DirectX
Hard Disk Drive
Solid State Disk: A type of HDD.
Operating System
Condition of Satisfaction
44.3 Document History
Version
1
2
3
4
4.5
Description
First version created
Document template adopted.
Information reviewed and
updated.
Updated with new small scale
tests to be used to test sprint
results.
Updated document to latest QA
standards. Updated
information on tests.
Document reviewed
Page 56 of 194
Date
15.12.2011
05.01.2012
16.03.2012
24.04.2012
24.05.2012
29.05.2012
Project FHaSS
Test Specification
2012
45 Table of contents
44 General Document Information .................................................................................................... 56
44.1
Declaration of intention ........................................................................................................ 56
44.2
Definitions and Acronyms ..................................................................................................... 56
44.3
Document History ................................................................................................................. 56
45 Table of contents ........................................................................................................................... 57
46 Test layout ..................................................................................................................................... 58
46.1
Test data set .......................................................................................................................... 58
46.2
Test types .............................................................................................................................. 59
46.3
Identifying different tests and requirements ........................................................................ 59
Requirement ID ......................................................................................................................... 59
Test ID ........................................................................................................................................ 59
47 Tests............................................................................................................................................... 60
47.1
Test template ........................................................................................................................ 60
47.2
Validation tests ...................................................................................................................... 60
47.2.1
List of validation tests .................................................................................................... 60
47.2.2
Tests............................................................................................................................... 61
47.3
Verification tests.................................................................................................................... 72
47.3.1
Code Review .................................................................................................................. 72
47.3.2
Code Compilation .......................................................................................................... 72
47.3.3
Debugging ...................................................................................................................... 72
47.3.4
User Interface Testing ................................................................................................... 72
47.3.5
Ad Hoc test .................................................................................................................... 72
47.3.6
Strain test ...................................................................................................................... 73
47.3.7
Regression test .............................................................................................................. 73
47.3.8
Performance test ........................................................................................................... 73
48 Sources .......................................................................................................................................... 73
Page 57 of 194
Project FHaSS
Test Specification
2012
46 Test layout
46.1 Test data set
To test the system we will be creating a test data set that will be used in most of the tests. The type
of tests is explained under test criteria for each of the tests. We will manually calculate values for the
different categories beforehand of the tests and compare them to the results the website produces.
The data set will consist of fictional bug reports that will be used to test each part of the system such
as testing the system web functionality (i.e. sorting and grouping algorithms + calculation algorithms)
and testing the result by sending complete bug reports that ventures through the different modules
of the system (i.e. parser, database and web functionality)i.
A complete fictional bug report will contain this information:
e. CPU
o Speed
o Number of cores
o Manufacturer
o Model
f. Graphics card
o VRAM size
o Primary Display Resolution
o Manufacturer
o Model
g. RAM size
h. Windows OS version
i. DirectX version
j. Geographical location (may be in the form of IP)
k. Date and time
l. Funcom game
o Game server
Our system will group most of this information (e.g. CPU: speed, cores, GPU: Model, Manufacturer)
and then show it in tables and charts. So to test the grouping functionality we need to put in some
smart values that are close to or exactly in the boundary range of the different grouping ranges.
Page 58 of 194
Project FHaSS
Test Specification
2012
46.2 Test types
Tests types listed are explained in more detail in the “Test strategy document” and the procedure for
the tests is listed under Tests.
Function test
Code Compilation
Debugging
Code Review
User Interface
Ad Hoc test
Strain test
Regression test
Performance test
46.3 Identifying different tests and requirements
Short explanation of the ID used for requirements and tests.
Requirement ID
A-F-1
Letter explaining the importance of the requirement where A is highest and C lowest
Letter explaining the requirement as Functional (F) or non-functional (FN)
Requirement number
Test ID
T-R-1-2
Letter T means test.
Letter R means requirement.
The first number equals test number.
If a second number is present the test is divided into more than one test and the number represents
the test number of that test.
Page 59 of 194
Project FHaSS
Test Specification
2012
47 Tests
47.1 Test template
Name
{Test Name}
Requirement ID: {ID}
Test description: {Test description}
Test date:
Testing method:
Test approach:
Test criteria
Expected results
Test creator:
Errors:
Outcome
Test ID
{dd.mm.yyyy}
Tester:
{Test type, black box/ white box}
{Name of tester}
1. {approach}
{what type of criteria}
{Expected errors and results}
{name date, updated by: name date}
{Encountered errors}
{What happened?}
47.2 Validation tests
47.2.1 List of validation tests
T-R-1
T-R-1-1
T-R-1-2
T-R-1-3
T-R-1-4
T-R-1-5
T-R-2
T-R-3-1
T-R-3-2
T-R-3-3
T-R-3-4
T-R-3-5
T-R-3-6
T-R-4-1
T-R-4-2
T-R-5
T-R-6
Display hardware / software statistics
Display hardware / software statistics –CPU information
Display hardware / software statistics –GPU information
Display hardware / software statistics –RAM information
Display hardware / software statistics –OS information
Display hardware / software statistics –Direct X information
Display hardware / software evolution charts
Filter statistics
Filter statistics – user interface test
Filter statistics – game filter
Filter statistics – server/universe filter
Filter statistics – time period filter
Filter statistics – geographical location filter
Hardware type management and grouping
Hardware type management and grouping –new hw type
Display software statistics
Future hardware prediction
Page 60 of 194
{Test ID}
Project FHaSS
Test Specification
2012
47.2.2 Tests
Name
Display hardware / software statistics
Test ID
T-R-1
Requirement ID: A-F-1 and B-F-1
Test description: Test to see if tables are created and contains accurate information about the
different hardware/software stored in the database.
Test date:
Testing method:
Test approach:
09.02.2012
Tester:
Kim Richard Johansen
25.03.2012
Function test, black box
1. Put in the time period for which the statistical data shall be produced
with basis upon.
2. Choose to get to see statistical information for one of the
hardware/software categories; CPU, Graphics Card, RAM, Windows OS,
HDD, or Network download speed.
3. Wait for the web-page containing the information to load.
4. Compare the resulting percentages to the percentages that have been
manually calculated from the test data set.
Test criteria
Database and website is up and running.
Test data set has been made and inserted into database
Expected
results:
The percentages the system produces and displays on the web-page
based on the test data set are similar to those calculated manually.
Test creator:
Errors:
Outcome
Sondre Bjerkerud, Sverre C. Thune
Updated by: Kim Richard Johansen
{Encountered errors}
{What happened?}
21.12.2011
23.12.2011
Name
Display hardware / software statistics –CPU information
Test ID
T-R-1-1
Requirement ID: A-F-1 and B-F-1
Test description: Test to see if tables are created and contains accurate information about the
different CPUs stored in the database.
Test date:
Testing method:
Test approach:
It should be possible to toggle between number of entries and %.
Data to be shown:
CPU speed by brackets (like Steam).Starting at 0 - 1.0hgz, Inc. at 400mhz.
Show split between AMD and Intel (and other)
Show number of cores
11.03.2012
Tester:
Kim Richard Johansen
27.04.2012
Function test, black box
1. Put in the time period for which the statistical data shall be produced
with basis upon.
2. Choose to get to see statistical information for CPU.
3. Wait for the web-page containing the information to load.
4. Compare the resulting percentages to the percentages that have been
manually calculated from the test data set.
Page 61 of 194
Project FHaSS
Test Specification
Test criteria
Database and website is up and running.
Test data set has been made and inserted into database
Expected
results:
The percentages the system produces and displays on the web-page
based on the test data set are similar to those calculated manually.
Test creator:
Errors:
Outcome
2012
Kim Richard Johansen 23.12.2011
{Encountered errors}
{What happened?}
Name
Display hardware / software statistics –GPU information
Test ID
T-R-1-2
Requirement ID: A-F-1 and B-F-1
Test description: Test to see if tables are created and contains accurate information about the
different GPUs stored in the database.
Test date:
Testing method:
Test approach:
It should be possible to toggle between number of entries and %.
COS: Show split between nVidia, Intel, AMD, and others.
Data to be shown:
Show video card model like Steam.
Show VRAM
Show Primary and multi-monitor resolution.
27.04.2012
Tester:
Kim Richard Johansen
Function test, black box
1. Put in the time period for which the statistical data shall be produced
with basis upon.
2. Choose to get to see statistical information for GPU.
3. Wait for the web-page containing the information to load.
4. Compare the resulting percentages to the percentages that have been
manually calculated from the test data set.
Test criteria
Database and website is up and running.
Test data set has been made and inserted into database
Expected
results:
The percentages the system produces and displays on the web-page
based on the test data set are similar to those calculated manually.
Test creator:
Errors:
Outcome
Kim Richard Johansen 23.12.2011
{Encountered errors}
{What happened?}
Name
Display hardware / software statistics –RAM information
Test ID
T-R-1-3
Requirement ID: A-F-1 and B-F-1
Test description: Test to see if tables are created and contains accurate information about the
different RAM stored in the database.
It should be possible to toggle between number of entries and %.
COS: Show the RAM from all systems in the DB and group them under different
range groups.
Page 62 of 194
Project FHaSS
Test Specification
2012
Data to be shown:
RAM grouped under:
Test date:
Testing method:
Test approach:
Less than 513 MB
513 MB to 999 MB
1 GB
2 GB
3 GB
4 GB
5GB and higher
Unknown
13.03.2012
Tester:
Kim Richard Johansen
Function test, black box
1. Put in the time period for which the statistical data shall be produced
with basis upon.
2. Choose to get to see statistical information for GPU.
3. Wait for the web-page containing the information to load.
4. Compare the resulting percentages to the percentages that have been
manually calculated from the test data set.
Test criteria
Database and website is up and running.
Test data set has been made and inserted into database
Expected
results:
The percentages the system produces and displays on the web-page
based on the test data set are similar to those calculated manually.
Test creator:
Errors:
Outcome
Kim Richard Johansen 13.03.2011
{Encountered errors}
{What happened?}
Name
Display hardware / software statistics –OS information
Test ID
T-R-1-4
Requirement ID: A-F-1 and B-F-1
Test description: Test to see if tables are created and contains accurate information about the
different OS information stored in the database.
It should be possible to toggle between number of entries and %.
COS: Show the OS from all systems in the DB and group them under different
groups.
Data to be shown:
OS grouped under:
Windows 7 64 bit
Windows 7 32 bit
Windows Vista 64 bit
Windows Vista 32 bit
Windows XP 64 bit
Windows XP 32 bit
Page 63 of 194
Project FHaSS
Test Specification
2012
Unknown
Test date:
Testing method:
Test approach:
14.03.2012
Tester:
Kim Richard Johansen
Function test, black box
1. Put in the time period for which the statistical data shall be produced
with basis upon.
2. Choose to get to see statistical information for GPU.
3. Wait for the web-page containing the information to load.
4. Compare the resulting percentages to the percentages that have been
manually calculated from the test data set.
Test criteria
Database and website is up and running.
Test data set has been made and inserted into database
Expected
results:
The percentages the system produces and displays on the web-page
based on the test data set are similar to those calculated manually.
Test creator:
Errors:
Outcome
Kim Richard Johansen 13.03.2011
{Encountered errors}
{What happened?}
Name
Display hardware / software statistics –Direct X information
Test ID
T-R-1-5
Requirement ID: A-F-1 and B-F-1
Test description: Test to see if tables are created and contain accurate information about the
different Direct X information stored in the database.
It should be possible to toggle between number of entries and %.
COS: Show the Direct X from all systems in the DB and group them under
different groups.
Data to be shown:
Direct X grouped under:
Test date:
Testing method:
Test approach:
Test criteria
Direct X 11.1
Direct X 11.0
Direct X 10.1
Direct X 10.0
Direct X 9.0c
Unknown
27.04.2012
Tester:
Kim Richard Johansen
Function test, black box
1. Put in the time period for which the statistical data shall be produced
with basis upon.
2. Choose to get to see statistical information for GPU.
3. Wait for the web-page containing the information to load.
4. Compare the resulting percentages to the percentages that have been
manually calculated from the test data set.
Database and website is up and running.
Page 64 of 194
Project FHaSS
Expected
results:
Test creator:
Errors:
Outcome
Test Specification
Test data set has been made and inserted into database
The percentages the system produces and displays on the web-page
based on the test data set are similar to those calculated manually.
2012
Kim Richard Johansen 16.03.2011
{Encountered errors}
{What happened?}
Name
Display hardware / software evolution charts
Test ID
T-R-2
Requirement ID: A-F-2
Test description: Test to see if evolution charts are created and to see if the contained
information is accurate against the test data set.
Test date:
Testing method:
Test approach:
02.05.2012
Tester:
Kim Richard Johansen
Function test, black box
1. Put in the time period for which the evolution charts are to be produced
with basis upon.
2. Choose to get to see one of the possible evolution charts; CPU, GPU,
CPU cores, or Windows OS version and DirectX version.
3. Wait for the chart to load.
4. Do as exact a comparison between the manually calculated data and the
chart. The chart shall be compared to the manually calculated data at
five (5) times/points with equal distance between them. The first and
the last times/points are the same values that was put in at stage 1 of
this test, which will be the start and end of the chart lines.
5. The percentages displayed in proximity to the chart are compared to the
manually calculated percentages for the last time/point the chart is
describing.
Test criteria
Database and website is up and running.
Test data set has been made and inserted into database
Expected
results:
That the chart seems to display similar values to those who have been
calculated manually for each of the five points/times of the chart.
That the percentages displayed in proximity to the chart based on the
test data set are similar to those calculated manually.
Test creator:
Errors:
Outcome
Sondre Bjerkerud, Sverre C. Thune
Updated by: Kim Richard Johansen
{Encountered errors}
{What happened?}
21.12.2011
23.12.2011
Name
Filter statistics
Test ID
T-R-3-1
Requirement ID: A-F-3
Test description: Test to see if the different filter combinations are working correctly.
Test each filter by itself. That is for instance putting in values for the
time period filter only, leaving the other filters with null value/the
Page 65 of 194
Project FHaSS
Test Specification
2012
standard value.
Test with all filters set.
The filter values that will be beneficial to put in will depend on the data set. For
instance should both values that are represented in the data set and values that
are not represented in it (say for instance a specific Funcom game) be filtered
upon. For the time period filter both the whole period which the test data set is
describing, and only parts of it, and also with time periods where the to and
from limits are stretched further into time or farther back in time than the test
data set describes.
Test date:
Testing method:
Test approach:
23.05.2012
Tester:
Kim Richard Johansen
Function test, black box
1. Put in the filter combination to be tested.
2. Wait for the web-page containing the filtered statistics to load.
3. Compare the produced filtered percentage statistics to the manually
calculated percentages.
Test criteria
Database and website is up and running.
Test data set has been made and inserted into database
Expected
results:
That the produced filtered percentages based on the test data set are
similar to the manually calculated percentages for each of the tested
filter combinations.
Test creator:
Errors:
Outcome
Sondre Bjerkerud, Sverre C. Thune
Updated by: Kim Richard Johansen
{Encountered errors}
{What happened?}
21.12.2011
23.12.2011
Name
Filter statistics user interface test
Test ID
T-R-3-2
Requirement ID: A-F-3
Test description: Test is run after T-R-3-1.
Test to see if the user interface for the filter statistics option is working correctly.
Test date:
Testing method:
Test approach:
Check if game server filter is available when a specific Funcom game is
selected and unavailable when a game isn’t selected.
24.05.2012
Tester:
Kent Brian Dreyer
User interface test, Black box
1. Set all filter options blank/null.
2. Check if game server filter is unavailable.
3. Choose one of the available Funcom games as a filter.
4. Check if game server filter is available.
Test criteria
Database and website is up and running.
Test data set has been made and inserted into database
Expected
results:
Game server filter works as explained in the test description.
Page 66 of 194
Project FHaSS
Test creator:
Errors:
Outcome
Test Specification
Kim Richard Johansen
09.01.2012
{Encountered errors}
{What happened?}
Name
Filter statistics – game filter
Test ID
Requirement ID: A-F-3
Test description: Test to see if the game filter combinations are working correctly.
Test date:
Testing method:
Test approach:
2012
T-R-3-3
Test if results after filtering show Funcom games and entries for each of
them.
02.02.2012
Tester:
Kim Richard Johansen
Function test, black box
1. Start the filter combination to be tested.
2. Wait for the web-page containing the filtered statistics to load.
3. Compare the produced filtered percentage statistics to the manually
calculated percentages.
Test criteria
Database and website is up and running.
Test data set has been made and inserted into database
Expected
results:
That the produced filtered percentages based on the test data set are
similar to the manually calculated percentages for the tested filter
combination.
Test creator:
Errors:
Outcome
Kim Richard Johansen
{Encountered errors}
{What happened?}
31.01.2011
Name
Filter statistics – server filter
Test ID
T-R-3-4
Requirement ID: A-F-3
Test description: Test to see if the server filter combinations are working correctly.
Test date:
Testing method:
Test approach:
Test if results after filtering show Funcom servers and entries for each of
them.
26.02.2012
Tester:
Kim Richard Johansen
Function test, black box
1. Start the filter combination to be tested.
2. Wait for the web-page containing the filtered statistics to load.
3. Compare the produced filtered percentage statistics to the manually
calculated percentages.
Test criteria
Database and website is up and running.
Test data set has been made and inserted into database
Expected
results:
That the produced filtered percentages based on the test data set are
similar to the manually calculated percentages for the tested filter
Page 67 of 194
Project FHaSS
Test Specification
2012
combination.
Test creator:
Errors:
Outcome
Kim Richard Johansen
{Encountered errors}
{What happened?}
31.01.2012
Name
Filter statistics – time period filter
Test ID
Requirement ID: A-F-3
Test description: Test to see if the time filter combinations are working correctly.
Test date:
Testing method:
Test approach:
T-R-3-5
Test if the data shown on the website corresponds to the manually
calculated results after setting a time filter.
27.04.2012
Tester:
Kim Richard Johansen
Function test, black box
1. Set the filter combination to be tested.
2. Wait for the web-page containing the filtered statistics to load.
3. Compare the produced filtered percentage statistics to the manually
calculated percentages.
Test criteria
Database and website is up and running.
Test data set has been made and inserted into database
Expected
results:
That the produced filtered percentages based on the test data set are
similar to the manually calculated percentages for the tested filter
combination.
Test creator:
Errors:
Outcome
Kim Richard Johansen
{Encountered errors}
{What happened?}
24.04.2012
Name
Filter statistics – geographical location filter
Test ID
T-R-3-6
Requirement ID: A-F-3
Test description: Test to see if the geographical location filter combinations are working correctly.
It should be possible to choose between continent and country as a filtering
option.
COS: That the data shown after choosing a continent or country corresponds to
the manually calculated results.
Continents to be able to choose from:
North America
South America
Antarctica
Africa
Europe
Asia
Page 68 of 194
Project FHaSS
Test Specification
2012
Australia
Test date:
Testing method:
Test approach:
27.04.2012
Tester:
Kim Richard Johansen
Function test, black box
1. Set the filter combination to be tested.
2. Wait for the web-page containing the filtered statistics to load.
3. Compare the produced filtered percentage statistics to the manually
calculated percentages.
Test criteria
Database and website is up and running.
Test data set has been made and inserted into database
Expected
results:
That the produced filtered percentages based on the test data set are
similar to the manually calculated percentages for the tested filter
combination.
Test creator:
Errors:
Outcome
Kim Richard Johansen
{Encountered errors}
{What happened?}
24.04.2012
Name
Hardware type management and grouping
Test ID
T-R-4-1
Requirement ID: A-F-5
Test description: Test to see if the hardware from the bug reports is grouped correctly under
general hardware types and that it shows the correct percentage for each of
them based on the total.
This test will also contain:
Test if registered but unrecognized hardware is grouped in the
unrecognized category and shows the right percentage.
Test date:
Testing method:
Test approach:
Test criteria
22.05.2012
Tester:
Sverre C. Thune
Function test, black box
1. Get the statistics page. Print out, write down, etc., the groups and their
respective percentages.
2. Compare the group percentages to percentages manually calculated
from the test data set.
Expected results
Test creator:
Errors:
Outcome
Database and website is up and running.
There has to be one or more currently registered but not recognized
hardware types.
Test data set has been made and inserted into database
That the system produced percentages is the same as the manually
calculated ones.
Sondre Bjerkerud, Sverre C. Thune
Updated by: Kim Richard Johansen
{Encountered errors}
{What happened?}
Page 69 of 194
21.12.2011
23.12.2011
Project FHaSS
Test Specification
2012
Name
Hardware type management and grouping –new hw type
Test ID
T-R-4-2
Requirement ID: A-F-4 and A-F-5
Test description: Test is run after T-R-4-1
Create a new general hardware type and choose which type of hardware it
should contain from the unrecognized hardware group.
Test date:
Testing method:
Test approach:
Test criteria
Expected results
Test creator:
Errors:
Outcome
22.05.2012
Tester:
Sverre C. Thune
Function test, black box
1. Get the statistics page. Print out, write down, etc., the groups and their
respective percentages.
2. Create a new general hardware type of one of the possible categories;
CPU, Graphics Card, or Windows OS.
3. Choose group one/some/all of the registered but not recognized
hardware types under the newly created general hardware type.
4. Get the updated statistics page. Print out, write down, etc., the groups
and their respective percentages.
5. Compare the new group percentages to percentages produced before
adding the hardware type(s) to the new general hardware type (step 1).
6. Compare results the group percentages whit percentages manually
calculated from the test data set.
Database and website is up and running.
There has to be one or more currently registered but not recognized
hardware types.
Test data set has been made and inserted into database
That the system produced percentages is the same as the manually
calculated ones. That is, both the basis statistics page (step 1) and the
updated statistics page (step 4) contain the same percentages as the
manually calculated percentages for the two instances of the general
hardware type grouping.
Sondre Bjerkerud, Sverre C. Thune
Updated by: Kim Richard Johansen
{Encountered errors}
{What happened?}
21.12.2011
23.12.2011
Name
Display software statistics
Test ID
T-R-5
Requirement ID: B-F-2
Test description: Test to see if the tables are created and contain the same percentage value as
manually calculated from the test data set about the different software stored in
the database.
Test date:
14.04.2012
Tester:
Sverre C. Thune
Testing method: Function test, black box
Test approach:
1. Load the web-page containing the software statistics.
2. Compare the calculated percentages to the manually calculated
percentages.
Test criteria
Database and website is up and running.
Page 70 of 194
Project FHaSS
Expected results
Test creator:
Errors:
Outcome
Test Specification
Test data set has been made and inserted into database
The percentages the system produces and displays on the web-page
based on the test data set are similar to those calculated manually.
Sondre Bjerkerud, Sverre C. Thune
Updated by: Kim Richard Johansen
{Encountered errors}
{What happened?}
2012
21.12.2011
23.12.2011
Name
Future hardware prediction
Test ID
T-R-6
Requirement ID: C-F-1
Test description: Test to see if an extension of requirement A-F-2 works. The extension is to
predict the future trend of hardware usage for the players of Funcom games.
When the chart for requirement A-F-2 is shown it will be possible to toggle the
prediction on and off. The prediction will extend the current lines for hardware
evolution in the chart and predict the future evolution.
Test date:
Testing method:
Test approach:
22.05.2012
Tester:
Kim Richard Johansen
Function test, black box
1. Put in the amount of time into the future the system is to predict the
hardware evolution for.
2. Load the web-page containing one of the possible charts containing
future hardware prediction.
3. Toggle the chart to display the future hardware prediction chart lines if
toggled off.
4. Check that the hardware evolution prediction lines are proportional.
5. Compare the updated percentages in proximity to the chart to the
manually calculated percentages. This stage corresponds to testing the
last time/point on the chart to the manually calculated percentages for
the whole test data set for the whole time period put in (1).
Test criteria
Database and website is up and running.
Test data set has been made and inserted into database
Expected results
That the hardware evolution prediction lines are proportional.
The percentages the system produces and displays on the web-page
based on the test data set are similar to those calculated manually.
Test creator:
Errors:
Outcome
Sondre Bjerkerud, Sverre C. Thune
Updated by: Kim Richard Johansen
{Encountered errors}
{What happened?}
Page 71 of 194
21.12.2011
23.12.2011
Project FHaSS
Test Specification
2012
47.3 Verification tests
47.3.1 Code Review
All developed code shall be reviewed by another person than the one who developed it. The
organization of code reviews will be as follows: The code developer notifies the Test Manager, Kim R.
Johansen, when the code development has been completed. It is then up to the Test Manager to
delegate the task of reviewing the code to another team member. The review shall result in a code
review feedback document for the code developer to examine. The feedback document shall consist
of comments and suggestions for improvements of the overall code or parts of the code. Code parts
shall be identified using line numbers. It is up to the code developer to consider whether or not the
comments and/or suggestions shall be taken into account/implemented. Both part can, and shall,
request a short meeting/discussion when disagreements arise about the developed code. A third
part can be brought into the meeting/discussion to further investigate the code.
47.3.2 Code Compilation
It is up to each code developer to ensure that the code he has produced compiles without errors or
warnings. It is natural that compilation will be attempted regularly throughout the code development
process and that the source of eventual errors/warnings is corrected before resuming the code
development. This is to ensure that faults in the code are fixed as early in the development process
as possible, which in turn will save development time because of the exponential growth of time
needed to fix errors as development continues.
47.3.3 Debugging
Debugging will be used in two ways:
1. To identify the problem area(s) of the code when compilation of the code fails. This will help
the developer to fix the error/warning to make the code compile without faults.
2. In the case that any of the verification tests fails there will be one or more logical errors in
the code that the corresponding test(s) are testing. Debugging can be used to identify these
errors by going through the code step by step and examining the values of the variables in
the code.
47.3.4 User Interface Testing
When the user interface for our system has been designed, user interface tests can be created to
ensure that the user interface behaves the way it is supposed to. These tests will be made and
carried through when the user interface corresponding to the specific test has been designed and
implemented.
47.3.5 Ad Hoc test
The Ad Hoc test is a test we will be done late in our project when most of our grade A requirements
are completed and tested. This test is done without any formal test plan and the purpose of this test
is to try and “break” the system by trying different system functionality. Since the purpose is to try
and “break” the system, negative testing is allowed. Negative testing means that the tester can try to
find not intended functionality that may “break” the system.
Page 72 of 194
Project FHaSS
Test Specification
2012
47.3.6 Strain test
The Strain test is a test that will be done when all our A grade requirement are completed and
successfully tested. We will insert variable amounts of bug reports over a length time to ensure that
the system can handle the pressure and still be operational by our client under the two second load
time they wanted for their website. The bug reports will be created beforehand of the test and the
results will be manually calculated to check up against the data from the website after the test. This
is to ensure that the data from the bug reports did not get corrupted due to high work load the
system encounters.
47.3.7 Regression test
Regression tests will be done after code alteration of previous tested functions or when new
functions have been added to the system. This test is to ensure that previously successful tests still
give the same results.
47.3.8 Performance test
This test is about measuring the performance of the system (e.g. the time it takes for the website to
load/show results as charts or tables with information from the database).This test will be done
regularly to ensure that a new functionality or code alteration keeps the loading times under two
seconds as the client wants.
48 Sources
http://en.wikipedia.org/wiki/Test_plan(Last visited 15.12.2011)
http://en.wikipedia.org/wiki/Test_case(Last visited 15.12.2011)
RIVET test specification (HIBU Kongsberg library)
Dragonfly test specification (HIBU Kongsberg library)
Page 73 of 194
Funcom Hardware Statistics System
Project Plan
Project name
Funcom Hardware Statistics System
Client
Funcom N.V.
Date
20.03.2012
Author
SondreBjerkerud
Acronym
FHaSS
Sensors & Supervisors
Internal sensor
Olaf Hallan Graven
Internal supervisor
AurillaAurelieArntzen
External supervisor
Rui M. Monteiro Casais
Group members
............................
SondreBjerkerud
............................
SverreChristoffer Thune
............................
Dag Hem
............................
Kent Brian Dreyer
............................
Kim Richard Johansen
Project FHaSS
Project Plan
2012
Project Plan
49 General Document Information
Deliverable nr
Deliverable type
Release
Work package
Responsible
D2.1.3
Research
Public
WP2
SondreBjerkerud
49.1 Declaration of intention
The intention of this document is to give the reader insight into what the project group is supposed
to do at which times throughout the project period, at a reasonable abstraction level. The plan is
supposed to work as a guideline for the team in the project period and the project progress shall be
measured against it. The plan can eventually be updated if it becomes obvious that it won’t be
possible for the team to follow it. This document will also describe how responsibility areas are
distributed between the team members, as well as give some insight into how the time estimations
were done to produce the project plan. Lastly this document will summarize how the resource
distribution ended up to be per month and for the whole project period.
49.2 Definitions and Acronyms
Product Owner
JS
HTML
CSS
The stakeholder’s representative when following the
Scrum project model.
JavaScript
Hyper Text Markup Language
Cascading Style Sheets
49.3 Document History
Version
1
2
3
4
Description
First version created. Time estimations done
and Gantt diagram made.
Project document layout adopted.
Resources, responsibility areas, and
requirements breakdown sections added.
Modified section Personnel under the main
section Resources. Added section “Remake
of the Requirement breakdown” under the
main section “Requirement breakdown”.
Added section “Remake of the Gantt
diagram” under the section “Gantt diagram”.
Added “Activity description” and “Actual
resource usage” sections under the
Page 75 of 194
Date
16.12.2011
04.01.2012
19.03.2012
28.05.2012
Project FHaSS
Project Plan
2012
“Resources” section. Also added “Milestones
accomplishment” section under “Milestones”
section.
50 Table of contents
49 General Document Information .................................................................................................... 75
49.1
Declaration of intention ........................................................................................................ 75
49.2
Definitions and Acronyms ..................................................................................................... 75
49.3
Document History ................................................................................................................. 75
50 Table of contents ........................................................................................................................... 76
51 Resources ...................................................................................................................................... 78
51.1
Personnel ............................................................................................................................... 78
51.2
Hardware ............................................................................................................................... 78
51.3
Software ................................................................................................................................ 78
51.4
Activity description ................................................................................................................ 78
Meetings & Planning ............................................................................................................. 78
Documentation...................................................................................................................... 79
Research & Set-up ................................................................................................................. 79
Implementation ..................................................................................................................... 79
Design .................................................................................................................................... 79
Test ........................................................................................................................................ 79
Presentation .......................................................................................................................... 79
Other ..................................................................................................................................... 79
51.5
Actual resource usage ........................................................................................................... 80
51.5.1
Per month ...................................................................................................................... 80
51.5.1.1
September, October, and November .................................................................... 80
51.5.1.2
December .............................................................................................................. 80
51.5.1.3
January................................................................................................................... 80
51.5.1.4
February................................................................................................................. 80
51.5.1.5
March..................................................................................................................... 81
51.5.1.6
April ....................................................................................................................... 81
51.5.1.7
May ........................................................................................................................ 81
51.5.1.8
June........................................................................................................................ 81
51.5.2
For the whole project period......................................................................................... 81
Page 76 of 194
Project FHaSS
Project Plan
2012
52 Responsibility ................................................................................................................................ 82
52.1
Fields of responsibility ........................................................................................................... 82
52.2
Scrum team responsibilities .................................................................................................. 82
53 Requirements breakdown ............................................................................................................. 83
53.1
Remake of the Requirements breakdown ............................................................................ 83
54 Milestones ..................................................................................................................................... 83
54.1
Milestones accomplishment ................................................................................................. 84
55 Gantt diagram................................................................................................................................ 84
55.1
Remake of the Gantt diagram ............................................................................................... 84
56 Conduction .................................................................................................................................... 85
56.1
Meetings ................................................................................................................................ 85
56.1.1
Meetings with internal supervisor ................................................................................ 85
56.1.2
Meetings with external supervisor ................................................................................ 85
56.1.2.1
Sprint planning meeting ........................................................................................ 85
56.1.2.2
Sprint review meeting ........................................................................................... 85
56.1.2.3
Sprint retrospective meeting................................................................................. 85
56.2
Updates to the project plan .................................................................................................. 85
56.3
File repository ........................................................................................................................ 86
57 Attachments .................................................................................................................................. 86
Page 77 of 194
Project FHaSS
Project Plan
2012
51 Resources
In the following are the different resources that are needed to complete this project. As you will see
there are no resources needed for this project that aren’t available at all times, that is all times that
people are working on the project. Due to this fact there is no need for a resource plan defining
when certain time critical resources can be used by whom/what and so forth.
51.1 Personnel
The project team is the main resource needed to get any project work done at all. The team
members will be working eight (8) hours a day, three days a week until Easter, and five days a week
from the end of Easter until project end. The project team will be having one full week of Easter
vacation.
Take a look at the “Requirements breakdown” document attached to this document to get an
overview of how the amount of work for the project has been estimated.
51.2 Hardware
Each of the members of the project team owns their own portable computer. These will be used for
just about anything regarding the project work; development, project management, web-page
updates, etc. The portable computers are of course available at all times.
51.3 Software
The project team will be using several software applications for the project work:
GanttProject: Project management
Microsoft Excel/Google Docs Spreadsheet: Project management
Visual Paradigm: UML Design
Visual Studio: Coding
Perforce: Version control
Microsoft Word: Documentation
MySQL: Database
We will also be using several pieces of software that cannot be considered to be applications. The
software are either necessary for the system to work or are required by our client to be used:
ASP.NET with C#: Programming language& Compiler
ASP.NET MVC: Web-page framework
nHibernate: Database abstraction layer
51.4 Activity description
The following is a list of the different activities that the work hours has been categorized in, as well as
a more detailed list of what types of specific activities that belong to each activity.
Meetings & Planning
o Meetings and preparation for meetings with supervisors and/or sensors as well as
internally in the project team.
o Completion of minutes.
Page 78 of 194
Project FHaSS
o
o
Project Plan
Mailing and Skype chatting in conjunction with meetings and/or planning.
Scrum task breakdown, estimation, and picking.
Documentation
o Project documentation.
o Wikipages documentation.
o Project documentation research.
Research & Set-up
o Learning
o Reading
o Lessons
o Installation of software.
o Server set-up.
o Fixing of software problems.
Implementation
o Coding (C#, C++, JS, HTML, CSS), debugging, building, and test executing new code.
o Uploading files to file repository and resolving file merging issues.
o Code review.
o Bug fixing.
o Stylecop/ReSharper code standard maintenance.
Design
o UML design.
o UI design.
o Design discussion (verbally and text chat).
Test
o
o
o
Conduction
Preparation
Logging
Presentation
o Conduction
o Preparation
Other
o
o
o
o
o
o
Deployment to Funcom.
Test deployment.
Contracts
Room ordering.
Prepare documentation for delivery.
Etc.
Page 79 of 194
2012
Project FHaSS
Project Plan
2012
51.5 Actual resource usage
51.5.1 Per month
51.5.1.1 September, October, and November
Activity/Person
Sondre
Sverre
Meetings & planning
18,25
10
Documentation
11
8
Research & Set-up
Implementation
Design
Test
Presentation
Other
4
Total
33,25
18
51.5.1.2 December
Activity/Person
Meetings & planning
Documentation
Research & Set-up
Implementation
Design
Test
Presentation
Other
Total
51.5.1.3 January
Activity/Person
Meetings & planning
Documentation
Research & Set-up
Implementation
Design
Test
Presentation
Other
Total
51.5.1.4 February
Activity/Person
Meetings & planning
Documentation
Research & Set-up
Implementation
Design
Test
Presentation
Other
Sondre
8
37,5
1
1,5
48
Sondre
12,75
14,75
49
10,25
Kent
10
6
4
Kim
10
6
2
Dag
10
10
20
18
20
Sverre
4
31
5
Kent
2
28
4
Kim
2
18,5
3
Dag
2
32
4,5
40,5
2
36
2,5
26
39,5
Kent
7
12
39
3
1
Kim
5
38
25
Sverre
7,5
8,5
37
12,5
20
2,75
109,5
27
92,5
Sondre
15
0,25
25,25
54,75
10,25
Sverre
8,75
9,5
1
49,5
14,5
24
29
115
Kent
5
8
61
1
20
19
107
Kim
3,5
4
2,5
20
Dag
5
8
42
8,5
3,5
24
6
97
Dag
4
7,5
9,5
48
8
30
2,75
4
Page 80 of 194
3
2
Project FHaSS
Total
51.5.1.5 March
Activity/Person
Meetings & planning
Documentation
Research & Set-up
Implementation
Design
Test
Presentation
Other
Total
Project Plan
2012
108,25
83,25
79
63
79
Sondre
5
2,5
1,5
88,75
2,5
Sverre
7,5
8
Kent
3,5
7
1
42
Dag
3,5
7
5
49,5
5
21,5
1,5
123,25
20
1
95
Kim
3,5
10
1
33,5
0,5
12
21
0,5
82
53,5
5
22
2
77.5
22
92
51.5.1.6 April
In the month of April the project team had one (1) whole week off from the project to load the
batteries with some Easter vacation.
Activity/Person
Meetings & planning
Documentation
Research & Set-up
Implementation
Design
Test
Presentation
Other
Total
51.5.1.7 May
Activity/Person
Meetings & planning
Documentation
Research & Set-up
Implementation
Design
Test
Presentation
Other
Total
Sondre
4,75
0,5
12,75
44
2
Sverre
2,5
2
10,25
74,25
1
47
2
58
1
48,5
Sondre
8,25
26,75
4
40,5
7
Sverre
6,5
30
16,5
54
4
1
Kent
3
39
Kim
3
31,5
72.5
52
18
130
1
115.5
6
4,25
96,75
34,5
7
Kent
5
51
Kim
1
21
1
24,5
Dag
2
1,5
8,5
42,5
5
59,5
Dag
3
32
8,5
61,5
6
8
11,5
106
5
116
51.5.1.8 June
Due to the fact that the final documentation delivery date is set to the 29th of May 2012 there has of
course not been logged any work hours in June at this point. However, the project team has
estimated that each team member will work approximately 40 hours on the “Presentation” activity in
this month.
51.5.2 For the whole project period
The following table is a summary of the monthly tables given in the section “Hour list per month” and
is thereby an hour list for each team member and the team as a whole for the whole project period.
Page 81 of 194
Project FHaSS
Activity/Person
Meetings & planning
Documentation
Research & Set-up
Implementation
Design
Test
Presentation
Other
Total
Project Plan
Sondre
72
93,25
93,5
238,25
21,75
0
87,5
27
633,25
Sverre
46,75
97
59,5
191,5
43
1
87
20,5
546,25
2012
Kent
30.5
92
61
229.5
2
0
86
40
541
Kim
28
106
33,5
126,5
1,5
94,5
80
18,5
490,5
Dag
30
98
78
210
28
0
86
14
543
Total number of work hours for the whole project
52 Responsibility
52.1 Fields of responsibility
SondreBjerkerud
Project Management (until 7.05.2012)
ScrumMaster
Dag Hem
Quality Assurance
Risk
Kent B. Dreyer
Implementation
Web-page
Sverre C. Thune
Project Management (from 7.05.2012)
Design
Kim R. Johansen
Test
52.2 Scrum team responsibilities
Following the Scrum project model a project team will be doing a standard meeting before each
sprint (iteration). In this sprint startup meeting the team will together with the Product Owner (the
stakeholders representative) decide which user stories (requirements) to implement in the following
sprint. All the user stories agreed upon goes into the Sprint Backlog where they are broken down into
tasks. It is then up to the team members to pick the tasks they would like to do in the following
sprint.
In our project team we have somewhat clearly defined fields of responsibility as given in the section
“Fields of responsibility”. These responsibilities will be the basis for task picking in the sprint startup
meeting. For instance Sverre will mainly pick designing tasks, while Kent will mainly pick
implementation tasks.
In the case when there will be an overweight of tasks relating to the fields of responsibility of only a
part of the team, the other members will “help” the responsible persons by picking tasks from their
Page 82 of 194
Project FHaSS
Project Plan
2012
field of responsibility. However, the person with the field of responsibility relating to that task will
have the head responsibility of the task, independently of who is actually doing it. For instance can
Dag be implementing some functionality of the system, but it is still Kent - who has implementation
as one of his fields of responsibility - who will be the person responsible for that task being done and
done properly.
53 Requirements breakdown
To get an idea of what has to be done to manage to implement the functionality that the
requirements are describing, we had to break down the requirements into tasks. These tasks had to
be specific enough for us to be able to give a good estimate of the work required to do them, but
also general enough so they could be used as the basis of a project plan. Too specific task definitions
would also be way too time consuming to produce and would probably not improve the time
estimates because of the lack of experience we’ve got in this specific technical area.
There is a document attached to this project plan called “Requirements breakdown”. In that
document the requirements breakdown lists and the time estimations for each task that was used as
a basis for the project plan is given.
53.1 Remake of the Requirements breakdown
Closely related to the remake of the Gantt diagram (see section 6: Gantt diagram) is the remake of
the Requirements breakdown. This breakdown is now estimating the time usage for implementing
the User Stories in the Product Backlog instead of the requirements in the Requirements
Specification.
For the user stories in the Product Backlog following the “Time Period Filter” it is still hard to make
good time estimates for. We will therefore be keeping the time estimates for this portion of the
Product Backlog as they were with the 1st version of the Project Plan. The portion of user stories
following the “Time Period Filter” is basically the same functionality that the requirements “Display
hardware/software statistics”, “Display Software Statistics”, and “Future Hardware Prediction”, are
describing. Therefore the time estimate for this portion of functionality is the same, but with the new
version of course distributing the time between the user stories. The distribution has been done
following our experience and intuition.
54 Milestones
Milestones functions as intermediate goals for the project work and will help the project manager
with the task of knowing whether or not the project work is going according to the plan. When
milestones are reached, can and should, the project team gather and celebrate that the goal has
been achieved to strengthen the mentality and focus of the team members for the upcoming work
period against the next milestone.
The following will list the milestones and their respective dates that the project team will work
towards:
1. The 1st presentation (13.01.2012)
2. Release/Deployment: High Priority Requirements (19.03.2012)
Page 83 of 194
Project FHaSS
3.
4.
5.
6.
Project Plan
2012
The 2nd presentation (22.03.2012)
Release/Deployment: Middle Priority Requirements (5.05.2012)
Release/Deployment: Final release (19.05.2012)
The 3rd and final presentation (06.06.2012)
After each of the release/deployment milestones the system that we are producing will be deployed
at the office in Oslo of our client Funcom and be taken into use by their employees.
54.1 Milestones accomplishment
Both the first project presentation milestones (1 and 3) were accomplished as expected.
Before the 1st project presentation the project team worked hard to be able to reach the first
release/deployment milestone (2), but unfortunately more and more unforeseen problems appeared
and the team realized that the milestone was not completeable at that point. However, after the 1st
presentation, the team continued the work to get the 1st version of FhaSS deployed to the Funcom
severs. Again, unfortunately, more and more problems occured, and the team had to rebuild large
portions of the system. Due to this development/test deployment period the second
release/deployment milestone was just more or less accomplished; The team managed to get a
version of the system deployed, but it was not completely functional and did not have all of the
middle priority requirements implemented. In essence the second release/deployment milestone
was also not accomplished.
The final release milestone (5) on the other side is considered as accomplished. The project team did
their last deployment to the Funcom servers on the 10th and 11th of May. However, the Funcom
employees that also served as supervisors for the project team throughout the project period has at
later dates done deployments to their own server, with some or none assistance from the project
team. Some of these deployments has happened after the set milestone date of 19th of May, but the
project team consider their last major deployment as the final deployment, and therefore consider
this milestone as accomplished.
The sixth (6.) and last milestone date is yet to come, but the project team is on schedule wioth regard
to the preparations for the 3rd and final project presentation.
55 Gantt diagram
In the attachment “Gantt diagram” of this document the Gantt diagram for the project periodis
displayed. The Gantt diagram lists the requirements to be implemented and when the work on them
should start and be finished. All the presentations are added to this diagram as well. The milestones
“High Priority Requirements” and “Middle Priority Requirements” are displayed only as the end of
their corresponding work packages.
55.1 Remake of the Gantt diagram
The first version of the Gantt diagram was based on the requirements in the Requirements
Specification. Because some of those requirements include the functionality described in several user
stories we found it hard to decide whether or not a specific requirement was completed or not. We
decided of this reason to remake the Gantt diagram (31.01.2012) to instead be based on the User
Page 84 of 194
Project FHaSS
Project Plan
2012
Stories in the Product Backlog. This decision and remake has proven itself very useful as it is now a
lot easier to gauge the progress of the project with regard to the diagram.
56 Conduction
56.1 Meetings
56.1.1 Meetings with internal supervisor
Meetings between the project team and the internal supervisor AurillaAurelieArntzen will occur on a
regular basis throughout the project period. Each week, on the same day and time of the week, a
follow-up meeting will be held between the two parts. A follow-up document is to be delivered to
the internal supervisor at last 24 hours before the start of this meeting. The contents of these
meetings will be a review of the follow-up document and other project related subjects that are of
interest to/that should be discussed with, the internal supervisor.
56.1.2 Meetings with external supervisor
Following the Scrum project model the project team and the Product Owner shall arrange meetings
before and after each sprint. All of the three following types of meetings will generally be held as one
single meeting, separated into three parts, at the start of a new sprint. That means there will only be
a sprint planning meeting at the start of the first sprint.
56.1.2.1 Sprint planning meeting
The purpose of this meeting is to decide on which user stories/requirements or which parts of them
the project team shall be working on in the following sprint. It is mainly up to the Product Owner to
decide which user stories/requirements the team shall focus on, but it is solely up to the team
themselves to accept what to actually do. The amount of work the team accepts in this meeting shall
and will be expected to be finished at the end of the sprint.
56.1.2.2 Sprint review meeting
The purpose of this meeting is for the project team to show off to the Product Owner what has been
developed in the past sprint. The newly produced functionality shall either be accepted or denied by
the Product Owner, or eventually form the basis for an eventual changes in the Product Backlog.
56.1.2.3 Sprint retrospective meeting
The purpose of this meeting is for the project team to discuss what went well and what went not so
well in the past sprint. The conduction of such a discussion is supposed to improve the effectiveness
and efficiency of the work of the project team.
56.2 Updates to the project plan
The Gantt diagram will typically be updated, if needed, after each sprint (every second week). The
work velocity of the project team is very uncertain at this point, but estimates will probably improve
drastically after just a few sprints, as well as the speed itself. The same goes for the requirements
implementation time estimates. The result is that the project plan will probably have to be updated
often, reflecting both a new work velocity estimate and the new requirements implementation time
estimates.
Page 85 of 194
Project FHaSS
Project Plan
2012
56.3 File repository
The project team will be using two types of file repositories in this project:
1. Dropbox will be used for storing and sharing documentation and planning files.
2. Perforce is the versioning software that will be used to handle versioning and storage of files
containing code. That is system specific files.
57 Attachments
Requirements breakdown
Gantt diagram
Page 86 of 194
Funcom Hardware Statistics System
Risk Analysis Document
Project name
Funcom Hardware Statistics System
Client
Funcom N.V.
Date
29.05.2012
Author
Dag Hem
Acronym
FHaSS
Sensors & Supervisors
Internal sensor
Olaf Hallan Graven
Internal supervisor
Aurilla AurelieArntzen
External supervisor
Rui M. Monteiro Casais
Group members
............................
Sondre Bjerkerud
............................
Sverre Christoffer Thune
............................
Dag Hem
............................
Kent Brian Dreyer
............................
Kim Richard Johansen
Project FHaSS
Risk Analysis Document
2012
Risk Analysis Document
58 General Document Information
Deliverable nr:
Deliverable type:
Release:
Workpackage:
Responsible:
D2.2.3
Guidelines
Public
WP2
Dag Hem
58.1 Declaration of intention
The intention behind this document is to give its reader a quick understanding of what risks are and
how to handle them properly so that we are better equipped when a risk strikes. This document will
also list most known and large risk along with a small description of the risks consequence and a
possible solution. By reading, understanding and using this document we will be more aware of the
overhanging risks we face during this project and also how to avoid, or even solve them if they
occurred. It is this documents main intention to lower the chances of risks happening, and help us
handle them as quickly as possible when they occur.
The assessments that are made in this document are meant to guide the project group through hard
choices regarding activities, priorities, strategic choices of solutions and project management.
58.2 Definitions and acronyms
Impact
API
NDA
TSW
ID
Crash
Browser
MVC
PM
N/A
WCF
The damage caused to our project. (Often in form of timeloss)
Application Programming Interface
Non-Disclosure Agreement
The Secret World
Identity
When a program unexpectedly stops running
Internet browser
Model View Controller (.Net standard)
Project Manager
Not applicable
Windows Communication Foundation
58.3 Document history
Version
1
1.5
2
Description
First version created
Peer reviewed
Supervisor reviewed
Page 88 of 194
Date
1.12.2011
14.12.2011
10.01.2012
Project FHaSS
Risk Analysis Document
2.5
3
3.5
Correcting risks
Finalized document
Document reviewed
2012
20.03.2012
21.05.2012
25.05.2012
59 Table of contents
58 General Document Information .................................................................................................... 88
58.1
Declaration of intention ........................................................................................................ 88
58.2
Definitions and acronyms ...................................................................................................... 88
58.3
Document history .................................................................................................................. 88
59 Table of contents ........................................................................................................................... 89
60 Risk analysis ................................................................................................................................... 90
60.1
Risk handling.......................................................................................................................... 90
60.2
Risk table template ................................................................................................................ 90
61 Risks ............................................................................................................................................... 91
61.1
Requirements related risks ................................................................................................... 92
61.2
Technical risks........................................................................................................................ 93
61.3
Human risks ........................................................................................................................... 94
61.4
Other risks ............................................................................................................................. 97
62 Occurred risks ................................................................................................................................ 98
62.1
Requirement related ............................................................................................................. 98
62.2
Technical ................................................................................................................................ 98
62.3
Human ................................................................................................................................... 99
62.4
Other ................................................................................................................................... 100
Page 89 of 194
Project FHaSS
Risk Analysis Document
2012
60 Risk analysis
60.1 Risk handling
Risks are a large part of project management, and as the project grows larger, so does the amount of
risks we are going face. As this is a small-scale project with only a handful of developers we do not
expect to be overwhelmed by many risky decisions but it is nevertheless important to have a basic
knowledge of the risks we are up against, and how to handle them in the best possible manner.
The understanding of risk revolves around two main problems; what are the chances of us running
into this risk and how much threat does this risk pose to our project?
These two questions can be summarized in two words: probability and impact, and the product of
these two become the total severity involved with a given risk. The following graph shows the
connection between probability and impact.
Fig 1: Risk probability matrix
The hard part about risk management is to detect large risks that may occur during the development
of a project and identify these properly. If a risk can be foreseen and understood before it has the
possibility to occur, we stand a much better chance at making the right decision when we know the
gravity and seriousness of our choice.
If a new risk is found, and it is believed to be a viable threat to our project its will be brought to the
risk manager for further research. If a risk is deemed dangerous enough the risk manager will analyze
the risk in an effort to learn more about its nature, these are the most important subjects:
The consequence of the risk – Time setback, data loss or other
How to prevent the risk – If any measures can and should be taken to avoid this risk
Finding a possible solution – If the risk have occurred and if it has any simple solutions
60.2 Risk table template
As risks are found and identified they are put in a basic risk table and categorized in the list of risks.
A risks ID is written R[Category number] – [ID] in order to minimize clutter as we add and edit risks
Page 90 of 194
Project FHaSS
Risk Analysis Document
2012
during the course of this project.
Every risk will be given a unique risk ID which can be referenced to from other documents in the
project if this is needed; the risks are also given an evaluation of their probability and impact (See fig
2 below).
Probability:
Description(If
needed):
R[Cat]-[ID]: [Risk name]
[The chance of occurrence] Impact:
[The impact of the risk]
[A short description/clarification of the risk. Only if needed]
Consequence:
[A short description of the consequence of this risk occurring]
Prevention:
[A short guideline on how to prevent this risk from occurring]
Possible
solution(If any):
[If there is a simple solution to a risk that has occurred, it should be explained
here]
Fig 2: Color-coded chart describing the total severity of probability and impact.
61 Risks
Here is a list over all known and identified risks, placed into several categories.
Project requirements related risks:
Any A-requirement not met
Any B-requirement not met
Any C-requirement not met
Technical & System risks:
ASP.net or C# programming language difficulties
Loss of data
Slow web-page loading times
Page 91 of 194
Project FHaSS
Risk Analysis Document
2012
Bad internal server performance
Personal computer problems
Web-page not viewed correctly by different internet browsers
Human risks:
Broken NDA
Miscommunication
Lack of knowledge
Teammate is unavailable of an extended amount of time
Solution disagreement
Internal conflicts
Disencouragement and workload
Major project changes/additions
Change of supervisor
Change of project manager
Other risks:
Acquisition of computer hardware
61.1 Requirements related risks
R1-1: Any A-Requirement (functional & non-functional) not working
Probability:
Very unlikely
Impact:
Catastrophic
Functional A requirements: Display statistics table & evolution charts, filter
statistics, hardware type management and hardware grouping.
Description:
Non-functional: Programming language, MVC, Database
type/connection/access, loading times, wiki documentation, BugZilla interface,
windows service
Failing one or more A-requirements means our system will not be satisfactory
Consequence:
for our clients use and will lack crucial functions.
Planning ahead and keeping to the project plan and delivery dates. Detect any
Prevention:
abnormalities early on and deal with them.
Probability:
Description:
Consequence:
Prevention:
R1-2: Any B-Requirement not working
Unlikely
Impact:
Major
B requirements: Display additional hardware, network and software statistics
By being unable to meet any B-requirement in time we are failing to meet a
secondary requirement set by the client resulting in a sub-optimal system.
Keeping to the schedule and deal with abnormalities early will give us the
needed time to develop and finish this feature.
R1-3: Any C-Requirement not working
Page 92 of 194
Project FHaSS
Risk Analysis Document
Probability:
Description:
Consequence:
Prevention:
Unlikely
Impact:
2012
Moderate
C requirements: Future hardware evolution prediction
By being unable to meet any C-requirement in time we are failing to meet a
tertiary requirement set by the client resulting in a still functional system, but it
will be lacking a highly desired functionality.
Keeping to the schedule and deal with abnormalities early will give us the
needed time to develop and finish this feature.
61.2 Technical risks
Probability:
Description:
Consequence:
Prevention:
Probability:
Consequence:
Prevention:
Possible
solution:
Probability:
Description:
Consequence:
Prevention:
Possiblesolution:
R2-1: ASP.Net, nHibernate or C# difficulties
Unlikely
Impact:
Major
Since we are using a new programming language as well as a new programming
standard, some trouble is to be expected. Can be caused by lacking
understanding, API or documentation.
By using too much time learning the language, our development timetable may
be affected.
A proper study done in the Programming Language document. Spending
personal time getting used to the language if personal level is below your peers.
Unlikely
R2-2: Data loss
Impact:
Moderate
May cost us varying amounts of time loss to restore the system.
Keeping backup versions of documents manually, using version verifying
software, securing personal computer with backup systems.
If data is lost and cannot be regained, the quickest solution would be for the
project member losing the data to reproduce it as quickly as possible. We also
rely heavily on version verifying software.
R2-3: Slow web-page loading times
Unlikely
Impact:
Major
The user experiences that his browser uses a long time loading the hardware
crash statistics web page. May be due to web-page programming or slow
database connection.
It may be undesirable for the user to even use our new system due to long
loading time.
Having a good understanding of ASP.Net and C# and good programming ethics
will help reuse of code, no memory leaks, low memory usage and flexible yet
robust code. Can be prevented by optimizing system & cleaning code after
testing.
If this problem is persistent after several iterations and there is enough time, it
Page 93 of 194
Project FHaSS
Risk Analysis Document
2012
might be advisable to either take a closer look and restructure the architecture,
or optimize the code.
Probability:
Description:
Consequence:
Prevention:
Possible
solution:
Probability:
Description:
Consequence:
Prevention:
Possible
solution:
Probability:
Description:
Consequence:
Prevention:
Possible
solution:
R2-4: Bad internal server performance
Unlikely
Impact:
Major
If the internal server does not have enough resources to handle our parser and
all its received data, it may slow down or even experience crashes.
It may hinder the admittance of new data into the database and in a worst case
situation slow down, or even break the database-connection to the user’s web
page.
Enough system resources on the internal server to handle all the processing
(Should be discovered during testing).
Optimized parser-coding and web-page towards fewer and smaller dataconnections.
Optimized parser-coding and web-page towards fewer and smaller dataconnections.
Either upgrade current server, or switch to a new one if the problem persists
after several iterations with testing.
R2-5: Personal Computer problems
Moderate
Impact:
Minor
One of the projects member’s laptop breaks down, leaving him without a
workstation at the school/other locations.
Affected person will be unable to work outside of his home for the duration of
the problem. Might hinder communication and workflow with other project
members.
Backup personal data, keep your system up to date, and check your
warranty/guarantee.
We may be able to borrow workstations from both the school and our client.
R2-6: System not viewed correctly by different internet browsers
Likely
Impact:
Minor
As different internet browsers handle html code differently there may be
discrepancies between how the page is viewed on the different browsers.
Minor visual glitches or lack of data on unsupported browsers.
Writing structured and robust code will always help program stability. By testing
our system up against different types of browsers and using code checking
software we should be able to detect any malfunctioning browser.
A workaround solution would be to use a specific browser desired by the user.
61.3 Human risks
Page 94 of 194
Project FHaSS
Probability:
Description:
Consequence:
Prevention:
Possible
solution:
Probability:
Description:
Consequence:
Prevention:
Probability:
Description:
Consequence:
Prevention:
Risk Analysis Document
2012
R3-1: Broken NDA / Leaked data
Very unlikely
Impact:
Moderate
If one of our project group’s members breaks our written NDA by disclosing
information about FunCom’s current system and their upcoming game: The
Secret World.
Project member will be unable to work for FunCom anymore, not wanted on the
project group for breaking our trust.
Keeping both our physical and digital information away from prying eyes by using
password protected systems and common sense. Not discussing, or “leak”
information about TSW to outsiders.
We may be able to change the projects scope in order to accommodate the
missing group member.
R3-2: Miscommunication
Unlikely
Impact:
Moderate
Problems often arise from misunderstandings and miscommunication between
people; we would like to minimize these.
The consequence may vary depending on the matter and the misunderstanding.
The impact ranges from missing a workday and undesired design to extra work.
All resulting in lost time.
The user requirements and our product backlog prevent any misunderstandings
towards the project requirements. Minutes from meetings helps us minimize the
chance of misinterpreting the new information. Skype chatting with both our
client and internal supervisor can help clear up misunderstandings quickly.
Weekly meeting with our internal supervisor as well as daily internal meetings
within the group.
R3-3: Lack of knowledge
Likely
Impact:
Moderate
By lack of knowledge it is meant both your personal coding skill and your general
understanding of the system we are creating.
A lack of knowledge may hamper our teams work pace considerably.
This is considered a likely probability due to the fact that we will use ASP.Net and
C# as none of us is familiar with it.
Beyond the slow work pace when working with an unfamiliar language you may
also experience a morale decrease. Another consequence is our project plans
may be written on the wrong basis if we have a shallow knowledge of the
current system.
It is each person’s own responsibility to keep their coding skill at an acceptable
level. To avoid misunderstandings around the system, we should use both our
internal and external supervisors to help us gain a better understanding of what
we’re doing.
R3-4: Group member is unavailable for an extended amount of time
Probability:
Very unlikely
Impact:
Moderate
There are outside forces that may affect our ability to work, such as long term
Description:
illness and jail time amongst others.
Page 95 of 194
Project FHaSS
Consequence:
Prevention:
Possible
solution:
Probability:
Description:
Consequence:
Prevention:
Possible
solution:
Probability:
Description:
Consequence:
Prevention:
Possible
solution:
Probability:
Description:
Consequence:
Risk Analysis Document
2012
This will leave the rest of the group with more work, while we may not be able to
shorten down the project scope. The impact depends on the amount of time the
missing member is unable to work.
It is not always possible to foresee or prevent this from occurring, but keeping
healthy and abiding the law is a good start.
Some possible solutions could be to either change project scope, getting an
outside workforce or reuse some of the old system.
R3-5: Project related disagreement
Likely
Impact:
Minor
Many of the choices in a large project is often planned months ahead, or
extensively researched if we are unsecure about how to proceed. We may,
however, still come across small issues that need to be resolved quickly between
us.
The consequence will be minor, because of all the larger issues are already
resolved. A conflict like this may take time if the parties does not seek out to find
new information, or fail to reach an agreement.
Many of these disagreements can be avoided by assigning a responsible person
for a certain task and letting them decide.
If the parties fail to resolve the issue quickly, they could either take their
argument to an objective team member, or if it seems fitting, ask our
supervisors.
R3-6: Internal Conflicts
Unlikely
Impact:
Moderate
Most people working closely together for an extended period of time are prone
to internal conflicts. Internal conflicts are personal issues between two parties.
Depending on the issue the impact may range between a team member having
to work at home for a short time to relax away from the group, or removing
them from the group permanently.
Celebrate achievements together, discussing your issues with other people in a
grown-up constructing way and have teambuilding sessions.
If an internal conflict occurs it is important to know that you can still keep things
at a professional level between co-workers and not necessarily dragging personal
feelings into the workplace.
R3-7: Disencouragement and workload
Unlikely
Impact:
Minor
It is easy to lose morale and be discouraged if you put a lot of work on yourself
for an extended period of time, this may cause burnout. But on the other hand it
is quite easy to deliver uncompleted work and miss deadlines if you take your
work too lightly.
If a member of our group experiences burnout during the course of this project
and renders himself discouraged from working we as a group need to use time
and energy nursing our member into working normally.
By taking our work too lightly, we risk missing deadlines and delivering sub-par
products.
Page 96 of 194
Project FHaSS
Prevention:
Risk Analysis Document
Discussing your workload with the project leader, teambuilding and celebrating
achievements.
R3-8: Major project changes/additions
Likely
Impact:
Probability:
Description:
Consequence:
Prevention:
Possible
solution:
Probability:
Description:
Consequence:
Possible
solution:
Probability:
Description:
Consequence:
Prevention:
Possible
solution:
2012
Moderate
If it is necessary to make major additions or changes to the project.
The consequences may vary depending on the addition, but in large cases where
new systems should be implemented it may mean an extra set of documentation
in addition to the actual system development.
There isn’t much one can do, except having close communication with our client
and supervisors to get an insight to their future plans.
If a major addition is added, the project leader should perhaps develop several
different strategies for handling this additional problem and discussing the best
solution with the project team or supervisors.
R3-9: Change of Supervisor
Very unlikely
Impact:
Moderate
The risk of having to change either the internal or external supervisor because of
illness, change of job, complications or other reasons.
Having to change a supervisor will both be time-consuming and slowing down
our project due to spending time replacing and briefing the new supervisor.
We could rely more on our other supervisor during a transition phase.
R3-10: Change of Project Manager
Very unlikely
Impact:
Major
The risk of having to change the current project manager and reinstate another
project member.
A change of Project Manager would cost us a large amount of time to reinstate
another project member. It would also severely decrease the morale of the
affected member as well as the other members of the group. Loss of knowledge
/ routines.
Clear communication with the other project members as well as the client and
any supervisors so that any problem or issue may be solved through constructive
criticism instead of a sudden change as the easiest solution.
The team must go together and to coordinate the PM change
61.4 Other risks
Probability:
R4-1: Acquisition of computer hardware
Very unlikely
Impact:
Page 97 of 194
Moderate
Project FHaSS
Description:
Consequence:
Prevention:
Possible
solution:
Risk Analysis Document
To run and test our system we have the need for an internal server hosting our
software.
If there are no servers available to us we will be unable to test the system in a
proper and realistic environment.
Research if either the school or our client can offer/lend us the necessary
hardware.
We could test the system exclusively on our own systems, test the system at
Funcom’s location or acquire our own personal hardware.
R4-2: Relocation of offices / hosting
Unlikely
Impact:
Probability:
Description:
Consequence:
Prevention:
Possible
solution:
2012
Minor
If we for some reason have to relocate our equipment.
Relocating would cause both a time-loss and other possible
software/network/firewall issues.
A thorough discussion with the possible parties that can accommodate us such
as HiBu or Funcom to establish whether or not they can meet our requirements.
If we are unable to find a suitable office we may have to work at one of the
project member’s house. If we are unable to find a suitable hosting solution for
our internal sever, we might be able to set it up in one of the project member’s
apartments.
62 Occurred risks
62.1 Requirement related
Sprint recognized:
Description:
Consequence /
Solution:
R1-1 A single A-Requirement: BugZilla not implemented
N/A
Severity:
None
It was an early request made by our client, that our system should use their
current BugZilla to post error reports.
With agreement with our client, we decided to implement our own.
62.2 Technical
Sprint recognized:
Description:
Consequence /
Solution:
R2-4: Bad internal server performance
Sprint nr 3
Severity:
Moderate
As we fetched more and more data from our database, we recognized a steadily
increased load time for the site as data grew due to un-optimized code.
We have done several updates, both to the client-side fetching and to database
optimization through parsing & grouping.
Page 98 of 194
Project FHaSS
Sprint recognized:
Description:
Consequence /
Solution:
Sprint recognized:
Description:
Consequence /
Solution:
Sprint recognized:
Description:
Consequence /
Solution:
Sprint recognized:
Description:
Consequence /
Solution:
Sprint recognized:
Description:
Consequence /
Solution:
Risk Analysis Document
2012
R2-4: Bad internal server performance
Sprint nr 9
Severity:
Minor
Our system required more and more information from the database as the
system evolved thus slowing down loading-times further.
We came up with a caching solution together with our external supervisors in
order to greatly reduce loading times for a limited time span. The consequence
for this was a large rewrite of our fetching mechanisms (basically some time
loss).
R2-2: Data-loss / Setback
Sprint nr 7
Severity:
Moderate
Due to inexperience with our version verifying software (Perforce) one of the
project members inadvertently set an earlier version of the project as the
current one, overwriting several updated files.
After a heroic effort from several team members we were able to restore the
system. Moderate amount of time-loss.
R2-5: Personal Computer Problem
Sprint nr 6 & 8
Severity:
Minor
At the first occurrence, a laptop charger broke. Second time a team member lost
their charger.
In both occurrences the affected member had to work from home a small
amount of time before fixing / acquiring new chargers.
R2-6: System is not viewed the same on different browsers
Sprint nr 3
Severity:
Minor
Discovered some minor visual glitches on the page when using different
browsers.
Changed some deprecated css usage while agreeing with the client on to
optimize towards a specific browser while maintaining functionality in other
browsers.
R2-1: Bad API/Documentation for nHibernate
n/a
Severity:
Moderate
nHibernate became an integral part of our system and we lacked the necessary
experience to use and understand it correctly.
More time spent learning the software than anticipated. Relied heavily on
external supervisor’s support. Designs were a bit off.
62.3 Human
Sprint recognized:
R3-3: Lack of knowledge
n/a
Severity
Page 99 of 194
Moderate
Project FHaSS
Description:
Consequence /
Solution:
Sprint recognized:
Description:
Consequence /
Solution:
Risk Analysis Document
The nature of the project required us to take use of some programming
languages and standards we were inexperienced with, such as C#, the .Net MVC,
WCF services and nHibernate.
These challenges did create some small issues during the course of our project.
In the early stage, our inexperience made our analysis and designs somewhat
faulty. The consequence was iterations on the system as our experience grew.
In the middle stages we might “run into a wall” when we failed to properly grasp
a specific concept and loose some morale. The consequence was to switch tasks
and support each other when needed; work might have been a bit slower than
optimal.
In the later stages of the project we recognized that some people became a bit
more specialized in a certain area the more they worked on it. The consequence
became that we could get “tunnel vision” by focusing purely on our own areas
loosing perspective.
R3-10: Change of Project Manager
Sprint nr 8
Severity:
Major
At the beginning of our 8th sprint, our supervisors and sensors decided to change
the Project Manager due to some minor misunderstanding between the PM and
our client.
The transition between PM’s went very good but we still lost a lot of sorely
needed management expertise the original PM had. The consequence for this
was a severely decreased morale across the board.
62.4 Other
Sprint recognized:
Description:
Consequence /
Solution:
2012
R4-2: Relocation of internal server
Sprint nr 1
Severity:
Minor
During our set-up sprint, the IT-Department at HiBu was unable to get our
internal server through their firewall in time.
We had to relocate the internal server to avoid additional downtime. We
relocated it to our project manager’s apartment.
Page 100 of 194
Funcom Hardware Statistics System
Project Model Document
Project name
Funcom Hardware Statistics System
Client
Funcom N.V.
Date
10.01.2012
Author
Sondre Bjerkerud
Acronym
FHaSS
Sensors & Supervisors
Internal sensor
Olaf Hallan Graven
Internal supervisor
Aurilla Aurelie Arntzen
External supervisor
Rui M. Monteiro Casais
Group members
............................
Sondre Bjerkerud
............................
Sverre Christoffer Thune
............................
Dag Hem
............................
Kent Brian Dreyer
............................
Kim Richard Johansen
Project FHaSS
Project Model Document
2012
Project Model Documents
1 General Document Information
Deliverable nr:
Deliverable type:
Release:
Work package:
Responsible:
D2.3.1
Research
Public
WP2
Sondre Bjerkerud
1.1 Declaration of intention
This document will explain several project models that our team has considered working according
to, as well as a conclusion discussing which model we believe will fit our project the best and why.
1.2 Definitions and Acronyms
UP
XP
Unified process
Extreme programming
1.3 Document History
Version
1.0
1.1
Description
First version created
Peer reviewed. Document
template adopted.
Page 102 of 194
Date
19.12.2011
10.01.2011
Project FHaSS
Project Model Document
2012
2 Table of contents
1
General Document Information .................................................................................................. 102
1.1
Declaration of intention ...................................................................................................... 102
1.2
Definitions and Acronyms ................................................................................................... 102
1.3
Document History ............................................................................................................... 102
2
Table of contents ......................................................................................................................... 103
3
Unified Process ............................................................................................................................ 104
3.1
Inception.............................................................................................................................. 104
3.2
Elaboration .......................................................................................................................... 104
3.3
Construction ........................................................................................................................ 104
3.4
Transition............................................................................................................................. 104
4
Scrum ........................................................................................................................................... 104
5
Extreme Programming ................................................................................................................ 105
6
Conclusion ................................................................................................................................... 105
Page 103 of 194
Project FHaSS
Project Model Document
2012
3 Unified Process
The Unified Process (UP) is an iterative and incremental development process. UP is supposed to
work in close collaboration with the Unified Modeling Language (UML). A Use Case Diagram is used
for requirements capturing. In each iteration the project team is developing a set of use cases
entirely, that is all the way from requirements capturing to deployment. When using UP the team is
supposed to address all possible risks as early as possible, both in the overall project period, and in
each iteration.
The Unified Process consists of four major phases; Inception, Elaboration, Construction and
Transition. Within each phase – especially in the three latter ones – it is common to work in
iterations.
3.1 Inception
In this phase the project team is focusing on making major decisions for the work to come in the later
phases. The scope of the project is established and the use cases are outlined as well as one or
several potential system architectures. It is also in this phase that the major risk analysis is done and
the project management is setting up a preliminary project plan as well as a cost estimate.
3.2 Elaboration
In the elaboration phase the work done in the inception phase is elaborated upon, with the primary
goal being to address the risk factors and to establish and validate the system architecture. The
architecture must be validated to ensure that it is possible to implement the major system
requirements, which are also captured in this phase. A final deliverable is supposed to be a plan for
the construction phase.
3.3 Construction
The project team will in this phase be building the complete system upon the foundation that came
out of the Elaboration phase. This phase is the largest of the four and will be divided into a series of
time boxed iterations.
3.4 Transition
In this phase the system is deployed at the user’s location and feedback is gathered for a future
system update. User training and conversion is also included in this phase.
4 Scrum
Scrum is one of several so-called agile software development methodologies which aims to be
flexible throughout the whole project period regarding changes in requirements. They also aim to
reduce the risk of the stakeholders by developing a part of the final system completely in each
iteration.
Scrum represents requirements in terms of user stories. User stories are small stories that describes
a specific thing that the system should do for a specific user, and if found necessary, why this is. User
stories are added and prioritized throughout the project period by the Product Owner, that is the
person that the stakeholders has decided that will represent them towards the Project Team, and are
stored in a Product Backlog.
Page 104 of 194
Project FHaSS
Project Model Document
2012
A project team working by the Scrum model is divided into several smaller teams consisting of about
ten people at max. Teams work in time boxed iterations of one to four weeks called sprints where
each team is supposed to completely develop one vertical slice of the final project. Before every
sprint each team picks user stories from the Product Backlog that they commit to fulfill in the
upcoming sprint in a sprint planning meeting. After each sprint the workflow and problem areas are
discussed in a sprint evaluation meeting meant to improve the cooperation and effectiveness of the
team. A so-called daily scrum meeting is a short meeting held each day in a sprint to ensure that the
team is on track against their sprint goal and to let potential problems be discovered. Several sprints
can be gathered and called a release. In the end of a release the developed software will be polished
even more than after each sprint and potentially be shown off for the stakeholders or others.
In each team there is one ScrumMaster. The ScrumMaster’s primary role is to address all problems
that arise that can influence the optimal progress of the team and potentially result in the team not
reaching their sprint goal(s). The ScrumMaster is not supposed to be a developer.
5 Extreme Programming
Extreme programming (XP), as the name hints, is a project model that takes programming to the
extreme. That is to take all the beneficial elements of traditional software development to the
extreme, on the theory that more is better. XP, like Scrum, is a project model of the agile family, and
there are of this reason many similarities between the two.
XP is arranged around four basic activities; Listening, Designing, Implementing, and Testing. Listening
is the activity of listening to the customer and produce a list of requirements which in turn the
Designing, Implementing, and Testing activities, are supposed to accomplish.
With XP the team is working in short iterations, typically one week, and like Scrum also defines
certain releases that is a set of iterations and where the result is a more polished version of the
system developed so far. At the start of an iteration and/or a release a so-called Planning Game is
done by the team accompanied by the client. At this meeting user requirements, in the form of user
stories, are developed and the team is committing to complete a set, or subset, of them in the next
iteration/release. Throughout the iteration/sprint the stakeholders can adjust the plan by adding,
removing or editing requirements.
XP is known for its practice of Pair Programming where two people is programming on the same
computer together. That is one who is writing the actual code and the other who is ensuring
correctness of the code, and both taking part in the discussion of how to code. XP is also known for
its frequent and in-depth testing throughout the development period.
6 Conclusion
There are mainly two forces pulling on us in a direction of which project model to use, so the decision
is not actually one of the group to make.
Høgskolen I Buskerud (HiBU) requires of us to deliver certain documents at certain points in the
project period. Many of the documents are typical deliverables in the standard Unified Process preface (Inception and Elaboration phases), but are documents that not usually are produced when
Page 105 of 194
Project FHaSS
Project Model Document
2012
following the agile models Scrum or Extreme Programming. The agile models are a lot more straight
to the point of development, whereas UP is starting up with a thorough pre-face before the actual
development starts. So, in one way our school requires of us to more or less follow the practices of
UP, which isn’t a factor we can influence.
On the other side we’ve got our client Funcom. Game development companies in general have the
last years more and more converted their workflow towards agile practices. This goes for Funcom as
well, working by their own modified version of Scrum. Of this simple reason Funcom urged us to use
Scrum as our project model.
When the UP type of requirements are already set from the school there isn’t much that the project
model choice is actually influencing. Even though we will try to take the practices of Scrum to the
largest extent as possible – both because of the urge from Funcom but also because it seems to be
the most appropriate model to work by for this project; given the team composition, the fluid
requirements, and the good easy-to-understand and clearly defined structure of the Scrum model –
this will probably at most influence the day-to-day workflow of the project, as well as maybe some
per-iteration planning. We will also be adopting the short iterations of only one week that are usually
the case when working by XP. The reason for this is that is gives the team more frequent chances of
steering the development process, more frequent - and thereby more improvements of - time
estimation for planning purposes, and more frequent evaluation of the development process for the
purpose of improving the team’s practices. All as a result of more frequent sprint planning and sprint
evaluation meetings. It is however possible that the lengths of the sprints will be increased to two
weeks after the initial couple of sprints, if we feel that this is more practical. In the start of the main
project period we will only be working three days a week on the project and one full week of work (5
days a week) almost equals two weeks of three days a week. Therefore sprints will start out to be of
two weeks length.
As a sum-up we can say that we will be following a combination of all three of the described project
models; the preface in accordance to the Unified Process, the day-to-day workflow and practices in
accordance to Scrum, but incorporating the short iterations common for XP.
Page 106 of 194
Funcom Hardware Statistics System
IDE Document
Project name
Funcom Hardware Statistics System
Client
Funcom N.V.
Date
10.01.2012
Author
Kent Brian Dreyer
Acronym
FHaSS
Sensors & Supervisors
Internal sensor
Olaf Hallan Graven
Internal supervisor
Aurilla Aurelie Arntzen
External supervisor
Rui M. MonteiroCasais
Group members
............................
Sondre Bjerkerud
............................
Sverre Christoffer Thune
............................
Dag Hem
............................
Kent Brian Dreyer
............................
Kim Richard Johansen
Project FHaSS
IDE-document
2011
IDE-document
7 General Document Information
Deliverable nr:
Deliverable type:
Release:
Workpackage:
Responsible:
D2.4.1
Research
Public
2
Kent Brian Dreyer
7.1 Declaration of intention
The purpose of this document is to review available IDE options and clearly define which IDE will be
most beneficial for us to use for this project, so that the team works with a standardized tool.
7.2 Definitions and Acronyms
IDE
VS
OS
Integrated Developer Environment
Visual Studio
Operating System
7.3 Document History
Version
1
2
Description
First version created
Document template added
Information reviewed and
updated
Page 108 of 194
Date
15.12.2011
10.01.2012
Project FHaSS
IDE-document
2011
8 Table of contents
7
General Document Information .................................................................................................. 108
7.1
Declaration of intention ...................................................................................................... 108
7.2
Definitions and Acronyms ................................................................................................... 108
7.3
Document History ............................................................................................................... 108
8
Table of contents ......................................................................................................................... 109
9
Introduction ................................................................................................................................. 110
9.1
Visual Studio 2010 Ultimate ................................................................................................ 110
9.2
#Develop.............................................................................................................................. 111
9.3
MonoDevelop ...................................................................................................................... 111
10 Conclusion ................................................................................................................................... 111
11 References ................................................................................................................................... 111
Page 109 of 194
Project FHaSS
IDE-document
2011
9 Introduction
C# is an official Microsoft computer language and its native IDE is Visual Studio, also
developed by Microsoft. There are also a few other good IDE’s for C# development, but very
few presents all the features and content that we require for our project.
In a sense, the other IDE’s will be matched against VS, since it is generally considered the
natural choice for C# and the .NET framework.
9.1 Visual Studio 2010 Ultimate
Visual Studio is Microsoft’s own IDE for development in C# with .NET framework. The
licensing for this IDE is not free, but via the e-Academy agreement with our school we have
the possibility to get this license free of charge.
VS is a large software and thus will require more processing power to run than the other
IDE’s reviewed in this document. This also means that we will be in a safer position later in
the implementation phase that we have access to required IDE functionality for our project.
Benefits
Drawback
Code Snippet Manager( auto
generation of code )
Database Designer Tools
Web Forms Designer
Superior auto-complete with
Visual Studio IntelliSense
Custom debugger visualizers
Native IDE
Large software
Reports that VS handles certain
functionality suboptimal or buggy
Reported file cache problems
No edit and Continue functionality
Page 110 of 194
Project FHaSS
IDE-document
2011
9.2 #Develop
#Develop (SharpDevelop) is an IDE for Microsoft's C# with .NET platform. It is open-source
and free.
#Develop is a lighter software to run than VS, which can be an important factor in the long
run, working with it. The later stable releases of #develop is considered good enough by the
community to compete with VS, but is really regarded as a free option to VS if you are on a
budget. The fact that it is open source doesn’t concern us as we will not spend time
modifying the functionality of the IDE.
Benefits
Drawback
Fast and responsive
Builds projects faster than other
IDE’s
Shortcut keys aren’t customizable
No edit and Continue functionality
9.3 MonoDevelop
MonoDevelop is another free alternative to VS and it is cross-platform, meaning we can use
the same environment to develop on Windows, Mac OS X and Linux. In this project we will
exclusively develop on Windows OS for Windows OS so advantages and drawbacks will not
be listed as this IDE is severely lacking in the feature department, and is not considered a
viable option for us.
10 Conclusion
For this project we will use Visual Studio 2010 Ultimate because of the best integration with
the intended language. It has most features, including debugger, extensive auto-complete
and features we might need in later phases of the implementation.
The sheer size of the IDE is a minor problem, and should not cause any problem for the
team. As of the reported issues these are considered to unimportant for us to discard VS as
the IDE choice.
11 References
●
●
●
●
http://www.icsharpcode.net/opensource/sd/(Last visited 13.12.2011)
http://community.sharpdevelop.net/blogs/mattward/pages/VisualStudioExpressComparison
.aspx(Last visited 13.12.2011)
http://blog.codebeside.org/post/2011/04/19/replacing-visual-studio-2010-withsharpdevelop-4-1.aspx(Last visited 15.12.2011)
http://desipenguin.com/techblog/2009/07/10/why-sharpdevelop-is-better-ide/(Last visited
11.15.2011)
Page 111 of 194
Funcom Hardware Statistics System
Quality Assurance Document
Project name
Funcom Hardware Statistics System
Client
Funcom N.V.
Date
29.05.2012
Author
Dag Hem
Acronym
FHaSS
Sensors & Supervisors
Internal sensor
Olaf Hallan Graven
Internal supervisor
Aurilla Aurelie Arntzen
External supervisor
Rui M. MonteiroCasais
Group members
............................
Sondre Bjerkerud
............................
Sverre Christoffer Thune
............................
Dag Hem
............................
Kent Brian Dreyer
............................
Kim Richard Johansen
Project FHaSS
Quality Assurance Document
2011
Quality Assurance Document
12 General Document Information
Deliverable nr:
Deliverable type:
Release:
Workpackage:
Responsible:
D2.5.3
Guidelines
Public
WP2
Dag Hem
12.1 Declaration of intention
This quality assurance document should teach its readers the quality and standard that any of the
project group’s deliverables should uphold to reach the high quality standard needed to satisfy our
client. This document will review the following:
Group communication and information exchange
Quality assurance regarding deliverables and documents
Quality assurance regarding other publications (such as web-blog or posters)
Code development standard
12.2 Definitions and Acronyms
QA
NDA
MSN
WP
e.g.
FHaSS
Quality Assurance
Non-disclosure agreement
Microsoft Network (Messenger)
Workpackage
Exemplī grātiā (for example)
FunCom Hardware Statistics System
12.3 Document History
Version
1
1.5
2
3
3.5
Description
First version created
Peer reviewed
Updated
Document finalization
Document reviewed
Page 113 of 194
Date
20.12.2011
15.03.2012
19.03.2012
29.05.2012
28.05.2012
Project FHaSS
Quality Assurance Document
2011
13 Table of contents
12 General Document Information .................................................................................................. 113
12.1
Declaration of intention ...................................................................................................... 113
12.2
Definitions and Acronyms ................................................................................................... 113
12.3
Document History ............................................................................................................... 113
13 Table of contents ......................................................................................................................... 114
14 Introduction ................................................................................................................................. 116
15 Communication and Information Exchange ................................................................................ 116
15.1
Communication ................................................................................................................... 116
15.1.1
E-mail guidelines.......................................................................................................... 116
15.1.2
Regular supervisor meetings ....................................................................................... 116
15.1.3
Group communication................................................................................................. 117
15.2
Information Exchange (File sharing) .................................................................................... 117
15.2.1
Project files folder (Dropbox) ...................................................................................... 117
16 Deliverable guidelines ................................................................................................................. 117
16.1
Deliverable distribution ....................................................................................................... 117
16.1.1
Deliverable list ............................................................................................................. 118
16.1.2
Naming convention ..................................................................................................... 118
16.1.3
File formats .................................................................................................................. 118
16.2
Deliverable quality process ................................................................................................. 118
16.2.1
Document creation and Structure ............................................................................... 119
16.2.2
Timelines ..................................................................................................................... 119
16.2.2.1
Timeliness & exceptions ...................................................................................... 119
16.2.3
Pre-completion process............................................................................................... 119
16.2.4
Reviewing a deliverable ............................................................................................... 120
17 Other publications and releases .................................................................................................. 120
17.1
Notice of meeting, Agenda and Minutes guidelines ........................................................... 121
17.1.1
Notice of meeting & Agendas...................................................................................... 121
17.1.2
Minutes........................................................................................................................ 121
18 Coding standards and plugins ..................................................................................................... 121
18.1
Coding guidelines ................................................................................................................ 121
18.1.1
Naming conventions .................................................................................................... 121
18.1.2
VAR vs. specified type ................................................................................................. 121
18.1.3
LINQ usage ................................................................................................................... 121
Page 114 of 194
Project FHaSS
Quality Assurance Document
2011
18.2
Versioning Control - Perforce .............................................................................................. 122
18.3
Plugins ................................................................................................................................. 122
18.3.1
StyleCop ....................................................................................................................... 122
18.3.2
ReSharper .................................................................................................................... 122
19 References ................................................................................................................................... 123
Page 115 of 194
Project FHaSS
Quality Assurance Document
2011
14 Introduction
As our group consists of persons from very different backgrounds we therefore have many different
views on document layout, document and code quality, timeliness, communication and information
exchange. This gives us the need for a collected set of rules and guidelines so that we are all on the
same level regarding document, code and communication standards.
To ensure the highest possible quality in all our written forms (Deliverables, documents, code syntax
and other publications) every member of the project group shall read and apply the rules discussed
in this document to their work.
15 Communication and Information Exchange
This section is divided into two parts and contains information regarding the communication flow
and information exchange between the members of the project group, the supervisors and our
client.
The communications section handles how the group will communicate with others and what
communication channels that are used while the information exchange section handles the
management of digital files such as deliverables & documents, source files and other project files.
15.1 Communication
15.1.1 E-mail guidelines
E-mail is our main communication channel to both our supervisors and our client and will mainly be
used for:
Announcing completed documents that are ready for comment and review
Announcing up-coming deadlines to our project members
Administrating meetings (More information below)
Notifications about large project changes or changes to the product backlog
While we use E-mail to announce documents that are to be reviewed (or that the review is
completed), it is encouraged that comments and changes is added to the document using the built in
office tool (See point16.2.4Reviewing a deliverable). If any large changes are to be made it should be
announced via email to the parties involved.
15.1.2 Regular supervisor meetings
The project group will hold regular meetings with one or more of our supervisors approximately once
a week. This meeting may be held in personor via teleconference.
The participants should be given approximately 1 day notification email ahead of the meeting to give
them the opportunity to reschedule. The meeting agenda should also be sent to all participants at
least one day before the meeting as well as being placed in our Meetings/Notices and Agendas folder
(See section15.2.1Project files folder (Dropbox)and section17.1Notice of meeting, Agenda and
Minutes guidelines).
Page 116 of 194
Project FHaSS
Quality Assurance Document
2011
There should always be a secretary present to take minutes of the meeting that should be edited and
distributed to all participants within one workday as well as being placed in our Meeting/Minutes
folder.
Meeting topics may vary in scope, but will at a minimum, contain the following:
Project updates on all completed work (Since last meeting) or work in progress.
Questions from the team to the supervisor(s).
Work to be done until the next meeting.
Topics for the next meeting.
Any conflicts/problems the supervisor should be aware of.
The meeting is always started and closed by the meeting leader; the meeting leader may alternate or
change depending on the meeting.
15.1.3 Group communication
The project group will use additional communication means (such as Skype and MSN) between each
other for faster and easier communication, however, any major item or news should be announced
via email to all affected parties.
15.2 Information Exchange (File sharing)
15.2.1 Project files folder (Dropbox)
The project group will be using a collaboration tool called Dropbox to store and share all our project
related files. Dropbox gives us easy access to all our files wherever we are, as well as synchronizing
them to the latest version.
Only the project members and our supervisors will be given access to our Dropbox files.
16 Deliverable guidelines
This section covers the structure, layout and routines of the group’s deliverables; it also defines the
quality process and timelines that any group member should follow.
16.1 Deliverable distribution
Deliverable distribution between members of the project group will usually happen using an ad-hoc
communications channel and as a benefit of using the Dropbox file sharing system we will always be
able to reach our documents on our workstations. Any completed deliverable should be moved from
its temporary folder to the “Deliverables” folder and then to the correct Workpackage.
Distributing a deliverable to either supervisor requires that the document has been completed and
reviewed by a fellow project member (See section16.2.3Pre-completion process) before delivering
the document either by e-mail, cd/dvd or a paper copy.
If a deliverable is to be delivered in paper format it should be printed out in color and stapled
together at the top-left corner, also review the document and check if any page-layout errors are
visible.
Page 117 of 194
Project FHaSS
Quality Assurance Document
2011
16.1.1 Deliverable list
An updated list off all deliverables and their respective delivery date is found in our Gantt-diagram
which all project members and supervisors have access to.
16.1.2 Naming convention
Any completed deliverable should be named after the following format:
D[Workpackage nr] . [Deliverable nr] . [Version] [Document name]
(Ex: D2.5.1 Quality Assurance Document)
Where:
Field
[Workpackage nr]
[Deliverable nr]
[Version]
[Document name]
Content
The workpackage the deliverable belongs in.
The deliverables number.
Starts with1
Minor changes add 0.5 to the version number.
If it has gone through major changes or review it is increased by 1
The entire name of the document
All the information needed is to be found in the project Gantt diagram where all the documents are
listed.
16.1.3 File formats
Any new deliverable should be created from the pre-formatted template (See section
16.2.1Document creation and Structure) and will therefore be of the Microsoft Office 2007(or later)
Word format .DOCX.
After a document have been reviewed (See section 16.2.3Pre-completion process) and completed it
should be converted to the Adobe.PDF format.
16.2 Deliverable quality process
A deliverable is a document which will be passed to the sensors and supervisors both in electronic
and paper form for extensive reviewing; it is therefore of the upmost importance that any
deliverable holds the highest standard possible. The quality process is a guideline to make sure the
deliverable meets the minimum of requirements, the quality process consists of:
Having the correct document structure (Introduction, Content, Summary)
Making sure all technical references are correct and valid
Any comparison to other work in the field is adequate
Following the document template
Correcting any typographical errors such as spelling and sentence structure
Using correct cross-references if you are referencing something within the same document
In addition, the process is also intended to ensure that every contributor to the deliverable ensures
that their submission adequately reflects their intention.
Page 118 of 194
Project FHaSS
Quality Assurance Document
2011
16.2.1 Document creation and Structure
Any new deliverable is to be created from the document template foundin “../Temporary”.
This template contains the modified styles that are changed according to this projects color and
layout, such as numbered headers, different theme colors and general structure examples.
A newly created deliverable or document that is yet to be completed should be placed in either the
“../Temporary” folder or any personal folder.
Most deliverables should contain the most basic of content to keep the wanted document structure:
A front page
A general document information page
A table of contents
An introduction relative to the technical field the deliverable is about
A summary or conclusion(Where applicable)
A list of references and sources (Where applicable)
Beyond this, any deliverable should be neatly structured for easy navigation using the correct
headers and sub-headers.
16.2.2 Timelines
A document should be completed by its original authors at least 2 workdays before the planned
completion date, before it is given to another project member for a peer review(See section
16.2.3Pre-completion process).
The peer review should be done at least 2 workdays before the delivery deadline and mailed to the
internal supervisor by the original author for a final review.
16.2.2.1 Timeliness & exceptions
It is each author’s own responsibility to ensure the on-time completion of their deliverable, and also
their responsibility to make sure that each review step is completed on time. The project manager
should, however, still keep track of each author’s progress and give them a notification if it is
believed that their deliverable should take longer than planned.
If a project member feels that their given time will not be enough to complete the deliverable they
should discuss this with the project manager.
16.2.3 Pre-completion process
Completed 1st version:
When a document or deliverable is nearing completion its author should take his time to do a
complete self-assessment review before deeming it completeand place it in the
“Deliverables/*Correct WP+/” folder.
After a deliverable is considered completed by its author it should be reviewed by a suitable peer
within the project group, this individual should ideally be:
Knowledgeable about the subject
Page 119 of 194
Project FHaSS
Quality Assurance Document
2011
Not a co-author of the document
Have the time to perform a thorough review
Completed peer review:
After the peer has reviewed the document according to the QA specifications (See section
16.2.4Reviewing a deliverable)he should update the deliverables versionand notify the original
author.
After the original author reviews and accept any changes made by his peer he should place a backup
version of the document under the “Deliverables/*Correct WP+/Old Versions” folder before sending
it for a final review to our internal supervisor.
Completed supervisor review:
When the internal supervisor has reviewed the document and either applied changes or added
comments the original author should go through these and make the appropriate adjustments to the
deliverable and updating the document version. After the corrections have been made, the author
should update the documents version.
16.2.4 Reviewing a deliverable
To make sure the reviewing process is performed optimally one should always follow these
guidelines:
Fix faulty typography(spell check, punctuation, etc.) and grammar
Be critic about what you read (mark statements that lack proper citation)
Optimize the document structure/layout if possible
Make updates to the document if the document template has been changed
Add comments and notes where needed.
Use the “Track Changes” function of Microsoft Office Word
Update all document references (To files, headings or web pages)
The reviewer should fix any minor errors if possible, but it is the author’s job to be aware of and
possibly improve any area commented by the reviewer.
17 Other publications and releases
In addition to formal deliverables the project group may from time to time publish material that does
not count as a document and may even be open for public viewing; therefore certain guidelines have
been created to keep any of our publications at a professional level with the same high quality
standard one would find in our deliverables.
Any official project group document shall follow the given document guidelines to the extent
necessary and work closely with the quality assurance manager in order to create new guidelines and
templates if needed.
If any member of the project group is planning to create a publication or release information under
the project group’s name they must notify the other members of the group regarding the planned
publication and provide the opportunity to both perform a quality check of a reasonable length and
gain the approval of the project member’s that the publication is bearing the project group’s name.
Page 120 of 194
Project FHaSS
Quality Assurance Document
2011
17.1 Notice of meeting, Agenda and Minutes guidelines
17.1.1 Notice of meeting & Agendas
Any notice of meeting and agenda should be created using the Notice of Meeting Template found in
“../Meetings/Notices and Agendas/”.
17.1.2 Minutes
Any minute from a meeting should be created using the Minutes template (“../Meetings/Minutes”),
and one should also refer to the Minutes writing guidelines(“../Meetings/Minutes/”) for further
assistance.
18 Coding standards and plugins
Because every member of the project group has taken the same classes during their bachelor it is
natural that their “way of coding” (coding standard) resembles each other’s to some degree, but we
are still in the need of some external tools and predetermined set of rules to make sure we deliver
code with a high standard and a clear conformitythroughout the project.
The project group will not be weighted down by a large list of specific rules, but rather take use of
plugins that are tweaked for our specific needs and a small set of guidelines set by this document.
18.1 Coding guidelines
18.1.1 Naming conventions
It is the project group’s intention that our code is easily readable and understandable by external
viewers.
CamelCase: The project group will take use of “CamelCase” on variables, methods and classes. The
initial letter is lower case on variables, while methods and classes use upper case on initial letters.
(E.g. variable “gpuModelDictionary” and method “RefreshCache”)
Descriptive naming: Every variable, method and class name should be descriptive of their respective
purpose without creating unnecessary confusion.
18.1.2 VAR vs. specified type
In many situations it is faster to use a non-specified variable type, but it more often than not
complicates code for a reader. A non-specified variable type should mostly be used where the
variable has a simple and specific usage (e.g. the int i in a for-loop).
18.1.3 LINQ usage
LINQ may sometimes be used to refactor/simplify certain (for/foreach) loops in our code but it
should be noted that LINQ is somewhat hard to read and understand for people with little previous
knowledge of the system. Only use LINQ where it would be an improvement to the code, and
comment it properly.
Page 121 of 194
Project FHaSS
Quality Assurance Document
2011
18.2 Versioning Control - Perforce
Perforce is a piece of version control software to help the project members share and merge their
additions to the project in fast and simple manner. Perforce keeps the latest deployment/version of
the system on its depot while each team member must “check out” any files they wish to edit and
make additions to. After changes have been made, the team member uploads their addition to the
project back into the depot.
Any member should only upload files that contain changes to the original file. They should also get
the latest revision (if any) from the depot and thoroughly test this with their own version of the
project. If everything works after merging with the latest deployment on the depot, the user should
write a description explaining the changes they have done and the necessary precautions other users
should be aware of (such as schema changes or getting acquainted with the new functionality).
After submitting a new build of the project, it is advised that at least one other project member
immediately test this new version to uncover any bugs that might appear due to discrepancies
between their versions (if any).
18.3 Plugins
Each student in the project group can and should take use of two additional plugins at their own
leisure to help them conform to the set standards.
Each student is responsible for their own licenses.
18.3.1 StyleCop
StyleCop is an open source code analysis tool that helps us use the correct standards when it comes
to code naming, readability, ordering, spacing, maintainability and layout amongst others. ReSharper
helps us maintain our code standards and thereby keep the code as easy to read and structured as
possible without hampering implementation.
We have implemented Funcom’s StyleCop rules into our own add-ons to make sure our codefollows
our client’s standard.
Each student using StyleCop is advised to take use of the configuration filelocated in
“../Other/Settings.StyleCop”
18.3.2 ReSharper
ReSharper is a refactoring and productivity extension used to point out bad programming practices
and better solutions to our code. It is a tool that helps us with hints, errors and warnings to make
sure our code is as quick and clean as possible.
We have implemented Funcom’s ReSharper rules into our own add-ons to make sure our code
follows our client’s standard.
Each student using ReSharper is advised to use theconfiguration filelocated in
“../Other/ReSharper_CodeStyleSettings.v6”
Page 122 of 194
Project FHaSS
Quality Assurance Document
19 References
http://blogs.msdn.com/b/sourceanalysis/ (Last visited 24.05.2012)
http://www.jetbrains.com/resharper/ (Last visited 24.05.2012)
http://www.perforce.com/ (Last visited 24.05.2012)
https://www.dropbox.com/home (Last visited 24.05.2012)
Page 123 of 194
2011
Funcom Hardware Statistics System
Version Control Document
Project name
Funcom Hardware Statistics System
Client
Funcom N.V.
Date
29.05.2012
Author
Sverre C. Thune
Acronym
FHaSS
Sensors & Supervisors
Internal sensor
Olaf Hallan Graven
Internal supervisor
Aurilla Aurelie Arntzen
External supervisor
Rui M. Monteiro Casais
Group members
............................
Sondre Bjerkerud
............................
Sverre Christoffer Thune
............................
Dag Hem
............................
Kent Brian Dreyer
............................
Kim Richard Johansen
Project FHaSS
Version Control Document
2012
Version Control Document
20 General Document Information
Deliverable nr:
Deliverable type:
Release:
Workpackage:
Responsible:
D2.6.1.1
Research
Public
2
Sverre C. Thune
20.1 Declaration of intention
The purpose of this document is to decide which version control system is best to use for our project.
20.2 Definitions and Acronyms
Impact
API
NDA
TSW
ID
IDE
Crash
P4
SVN
Revision
Check out
Check in
Merge
User
The damage caused to our project.
Application Programming Interface
Non-Disclosure Agreement
The Secret World
Identity
Integrated development environment
When a program unexpectedly stops running
Perforce, version control software
Subversion, version control software
A version of a file in the files history
A user checks out a copy of a file from the server which he
can edit
A user checks in an edited copy of a file so the server so the
server has the latest revision
Combine the changes from two users on the same file
A developer in the team
20.3 Document History
Version
1
1.1
1.5
Description
First version created
Supervisor suggestions integrated
Updates after document review
Page 125 of 194
Date
16.12.2011
03.01.2012
29.05.2012
Project FHaSS
Version Control Document
2012
21 Table of contents
20 General Document Information .................................................................................................. 125
20.1
Declaration of intention ...................................................................................................... 125
20.2
Definitions and Acronyms ................................................................................................... 125
20.3
Document History ............................................................................................................... 125
21 Table of contents ......................................................................................................................... 126
22 Introduction ................................................................................................................................. 127
23 Version Control............................................................................................................................ 127
24 Perforce ....................................................................................................................................... 127
25 Subversion ................................................................................................................................... 128
26 Other Systems ............................................................................................................................. 129
27 Comparison ................................................................................................................................. 129
28 Conclusion ................................................................................................................................... 130
29 Sources ........................................................................................................................................ 130
Page 126 of 194
Project FHaSS
Version Control Document
2012
22 Introduction
In this document we will take into account that IDE document (our deliverable about which IDE we
are going to use) concludes that we are going to use Visual Studio 2010 Ultimate to write code. So a
prerequisite for this document is that we are using the Visual Studio 2010 Ultimate IDE and therefore
need a version control system that works well with Visual Studio.
To work simultaneously on the same Visual Studio project we need a version control system. The
purpose of this document is to decide which version control system is best to use for our project.
Certain operations that we need to do will be tested in the different version control systems. This
includes installing the server and client, adding files, checking out files, checking in files, merging
files, viewing changes between revisions and reverting to an older revision.
23 Version Control
Version control is also known as revision control and source control.
A version control system is software that keeps track of the history of your project, including code
files, documents and any other type of file that you want to track. It is also a tool for sharing a project
so that multiple people (a team) can work on the same project (even the same files) simultaneously.
This is done by having a server which hosts the main project, every file that belong to the project is
stored on this server. A user (a developer in the team) can then connect to the server and "check
out" the files he is going to work on. When the user is finished working on the file he needs to "check
in" the files he edited, so that the new revision is stored on the server. When a file is checked in, it
becomes a part of the current revision of the project. Before it is checked in it is just an unfinished
temporary copy of the file.
There are some criteria for checking in files that should be followed. The most important is that the
project should always be able to build on the client before checking in updated files. If you check in a
file that makes the project unable to build, this can lead to everyone working on the project to be not
able to build. Never check in files that does this. Also every check in should have a comment attached
that shortly describes what the changes are.
24 Perforce
Perforce (P4) is a version control system developed by Perforce Software. You can use P4 for free
with either two users and five workspaces or unlimited users but up to 1000 files.
Installing the P4 server is very easy, you only need to download the installation file and run it. You
need to make sure that the clients can connect through the firewall on the server, if there is one. The
P4 GUI client is also as easy to install. When the client is installed you just run it and connect to the
server with the IP address of the server. You also have to create an account to connect, but it is really
fast to do it. Just input a username, if you want, a password, and an email address and you are ready
to connect. You also need to install and set Visual Studio to use the Perforce SCC plug-in.
Setting up a project to use P4 is straightforward. First you create a project and then "add the solution
to source control" in Visual Studio. After that, adding a file to the version control is easy. Just create
Page 127 of 194
Project FHaSS
Version Control Document
2012
the file in Visual Studio and it is automatically added to the pending change list. Check in and the new
files are added. To submit changes you are required to add a comment describing what the change is.
This way it is easy to track the history, since you can view the comments of every change submitted.
You can also use the P4 GUI client to add files, which can be useful for adding other types of files
than code to the version control.
If files have been changed by other users, after you refresh your P4 GUI client (by pressing F5) you
will get a notice that there is a new revision. By choosing "get latest revision" you download the
newest changes from the server.
Checking out files can be done either manually through the P4 GUI client or automatically in Visual
Studio just by starting to write in the code file. You can even see if files are checked out by other
users and by whom.
After you are done editing a file (or multiple files) you need to check them in, just like when adding
new files, you then have to submit the change in the "pending" list. As mentioned earlier, to submit
you are required to add a comment describing what the change is. This way it is easy to track the
history, since you can view the comments of every change submitted.
If two different users have checked out the same file and both wants to check them in a conflict
occurs, and it has to be resolved. This can be done be merging the files. P4 has a tool for this, which
works very well. You can view the changes from both of the users and compare them to both the
current revision on the server and the automatically merged file. If you are happy with the result,
accept the merge and re-submit the merged result. You can also edit the merge to your liking.
You can compare different revisions of files by using the "diff" function in the both visual studio and
the P4V GUI client. Changes between the revisions are displayed very well and it is easy to
understand. It is also no problem reverting to an older revision of a file.
Deleting files locally can create problems. You have to delete files with the P4 GUI client so the server
knows. If you delete a file locally, it will not be downloaded again on successive updates because the
server thinks you already have it. If this happens you may need the clean your local copy and
download it again, which can be time consuming. By just making sure to delete files with the P4 GUI
client this problem is avoided.
25 Subversion
Subversion is an open source version control system developed as a project of the Apache Software
Foundation. There are different software that uses this open source project as a basis. For the server
we will test "VisualSVN Server", and for the client we test "AnkhSVN", because these are free and
recommended by multiple people (on stackoverflow.com). Throughout the document "SVN"
(Subversion) will be used to refer to this system.
First we have to install the subversion server "VisualSVN Server". You have to set up users/accounts
on the server which clients can connect with. Then we install "AnkhSVN" on the clients, which is the
plug-in for Visual Studio. The installation process is straightforward and without problems.
Page 128 of 194
Project FHaSS
Version Control Document
2012
Setting up a project to use SVN is straightforward. First create a project and then "add the solution to
subversion" in Visual Studio. Commit the changes and it is done. After that, adding files works very
well, just like with P4, you just have to create the file in Visual Studio and it will automatically be
added to your pending change list. Then you just have to commit the change and the file is added.
Checking out files is also very easy, it is completely automatic, just start writing code in the file and it
is checked out. With this plug-in you can’t see if there is someone else who have checked out a file.
Also you cannot see if there is a newer revision of the file on the server, you have to manually check
if you can get a new revision.
Checking in files is also simple, just like with P4. Every file you change is automatically added to a
pending list. Just click "commit" and the files are checked in.
The merging tool works well enough with AnkhSVN. The new code from two users is merged
automatically, but some extra lines are added that show which user that part of the code was from,
these extra lines you will need to remove manually before committing the change. There are also not
simultaneous views to compare the different revisions that you want to merge.
Comparing changes between different revisions in the history of a file is simple. Right-click and
choose view history and then choose two revisions to view the changes. It is simple and easy to use.
There is no problem reverting a file to an older revision.
26 Other Systems
GIT and Mercurial are two other version control systems that could be used. They include similar
features to P4 and SVN, but the server set-up is more complicated than just installing and running it
(command-line seems to be unavoidable). Because the setup is not simple enough, these two
alternatives are discarded and will not be compared or taken into account in the conclusion.
27 Comparison
The installation process for P4 and SVN are both quite easy. You only need to install one plug-in for
each of the version control systems, but by also installing the P4 GUI client you get some extra
features. For example being able to see if there are newer revisions of files on the server just by
pressing refresh (F5) is one of these features that are very useful. With SVN this is not available.
Adding new files, checking out and checking in files in a project are easy with both systems, within
Visual Studio it is done almost identically. You can also use the P4 GUI client.
Both systems have tools to merge a file edited by two different users. The merge tool in P4 works
better than the merge tool in SVN. In P4 you can simultaneously view the current revision on the
server, the two new revisions from the users and the automatically merged version. Changes are
easily done and saved if needed. The tool with SVN works alright, but not as good as P4. The new
code is merged, however some extra lines are added that show which user that part of the code was
from, these you need to remove manually before committing the change. With SVN you also don’t
have the nice simultaneous view of all the revisions.
Page 129 of 194
Project FHaSS
Version Control Document
2012
Viewing the changes between revisions of files is easy in both systems, but P4 does have better
graphical representation of the changes. The lines highlighting the changes are linked between the
views for the different revisions.
Reverting to an older revision works well and similarly with both systems.
28 Conclusion
Both systems work very well and include the features we need for our project. However, P4 is the
optimal choice for us, because of the feature to easily view which revision of a file you have
compared to the server, and if other users have checked out files. Also the merge tool in P4 is also
better and easier to use.
A potential problem with P4 is that the free version will only allow 1000 files when working with
more than two users. This is not a problem with SVN, but it is unlikely that our project will contain so
many files, so P4 is still preferred.
29 Sources
D2.4.1 IDE Document.docx project FHaSS (Last visited 03.01.2012)
http://stackoverflow.com/questions/157429/what-are-the-benefits-of-using-perforceinstead-of-subversion (Last visited 16.12.2011)
http://www.perforce.com/ (Last visited 19.12.2011)
http://ankhsvn.open.collab.net/ (Last visited 19.12.2011)
http://stackoverflow.com/questions/453481/what-subversion-plugins-for-visual-studio-arethere(Last visited 19.12.2011)
http://johnhforrest.com/2010/09/how-to-subversion-server-for-windows/(Last visited
20.12.2011)
Page 130 of 194
Funcom Hardware Statistics System
Design Document
Project name
Funcom Hardware Statistics System
Client
Funcom N.V.
Date
28.05.2012
Author
Sverre C. Thune
Acronym
FHaSS
Sensors & Supervisors
Internal sensor
Olaf Hallan Graven
Internal supervisor
Aurilla Aurelie Arntzen
External supervisor
Rui M. MonteiroCasais
Group members
............................
Sondre Bjerkerud
............................
Sverre Christoffer Thune
............................
Dag Hem
............................
Kent Brian Dreyer
............................
Kim Richard Johansen
Project FHaSS
Design Document
2012
Design Document
30 General Document Information
Deliverable nr:
Deliverable type:
Release:
Workpackage:
Responsible:
D4.1.16
Report
Public
Independent
Sverre C. Thune
30.1 Declaration of intention
The purpose of this document is to present our design for user stories in the sprints. Each section of
the document contains the design for a specific user story or larger overall updates to the design.
30.2 Definitions and Acronyms
FHaSS
ASP.NET
MVC3
WCF Service
nHibernate
UML
OS
Funcom Hardware Statistics System
ASP.NET MVC3 is a framework for how code should be
structured using the Model View Controller pattern.
Windows Communication Foundation Service
A library for accessing a database
Unified Modeling Language
Operating System
30.3 Document History
Version
1
1.5
2
3
4
5
6
7
8
9
10
11
Description
First version created
Updated class diagram after review and feedback of the document
from Funcom employees Lorenzo Aurea and Hans Birkeland
Game filter design, added database diagram and server filter design
Added design for CPU speed grouping
Added redesign of WCF web service (Sondre).
Added new database and parser design (Sverre)
Added CSS & UI Design (Dag)
Added design for GPU manufacturer and vram
Added design for memory and os
Added Redesign of responsibilities of WCF and Parser, and GPU user
story (Sondre).
Added HWParser Interface design (Dag)
Update design with CPU model
Updates after code review / before first deployment
HighCharts
Page 132 of 194
Date
26.01.2012
26.01.2012
07.02.2012
12.02.2012
15.02.2012
23.02.2012
29.02.2012
01.03.2012
01.03.2012
14.03.2012
19.03.2012
18.04.2012
Project FHaSS
12.0
13.0
14.0
15.0
16.0
Design Document
Geographical Location (Dag)
Windows service
General model relation search / manufacturer
Hard disk information
Filter storage and URL, exception handling and logging, caching
Final updates after document review
Page 133 of 194
2012
24.04.2012
27.04.2012
04.05.2012
09.05.2012
28.05.2012
Project FHaSS
Design Document
2012
31 Table of contents
30 General Document Information .................................................................................................. 132
30.1
Declaration of intention ...................................................................................................... 132
30.2
Definitions and Acronyms ................................................................................................... 132
30.3
Document History ............................................................................................................... 132
31 Table of contents ......................................................................................................................... 134
32 Introduction ................................................................................................................................. 135
33 Game filter................................................................................................................................... 135
34 CPU Speed grouping .................................................................................................................... 137
34.1
The new database ............................................................................................................... 139
34.2
The parser............................................................................................................................ 139
34.2.1
The Parser interface .................................................................................................... 140
35 Redesign of the WCF web service ............................................................................................... 142
36 Designing the page layout ........................................................................................................... 143
37 GPU Manufacturer and VRAM .................................................................................................... 146
38 Memory and OS user stories ....................................................................................................... 148
39 Redesigned responsibilities of WCF and Parser .......................................................................... 151
40 GPU user story ............................................................................................................................. 152
40.1
Resolution............................................................................................................................ 153
41 CPU Model ................................................................................................................................... 153
42 Updates after code review / before first deployment ................................................................ 154
43 HighCharts ................................................................................................................................... 157
44 Geographical Location ................................................................................................................. 157
45 Windows service.......................................................................................................................... 158
46 General model relation search / manufacturer .......................................................................... 158
47 Hard disk information.................................................................................................................. 159
48 Filter storage and URL ................................................................................................................. 160
49 Exception handling and logging................................................................................................... 160
50 Caching ........................................................................................................................................ 161
51 Conclusion ................................................................................................................................... 162
Page 134 of 194
Project FHaSS
Design Document
2012
32 Introduction
The purpose of this document is to present our design for user stories in the sprints. Each section of
the document contains the design for a specific user story or larger overall updates to the design.
This document will be expanded when we create new designs throughout the project period, so one
can see how the system has evolved. UML diagrams are used to describe the system, so general
knowledge of UML is recommended to fully understand this document.
33 Game filter
Our first objective is to complete the "Game filter" user story. The goal of this user story is to display
how many entries there are per Funcom game in the HW_INFO table.
There is no column in the HW_INFO table that tells us which game the row of information is
connected to. There is however a column called Universe, which stores the name of the universe
(server). We can use the universe name to find out the game. To do this we will create a table that
contains different games and a table that contains the different universesand relations between
these two tables so that when one searches for one specific game it will search through all the
universes connected to that game. Below (figure 1) you can see the tables that will be in the
database.
Figure 1 Database tables
The overall system will contain two applications. The WCF Service Application where the database
queries and calculations will take place, and the ASP.NET MVC3 Application which is the web side
application that displays the information from the database.
The WCF Service Application contains the IReadDataService.cs which is the interface of the service
and the ReadDataService.svc which implements the interface. There are also the mapped classes
which nHibernate uses to communicate with the database tables. Below (figure 2) shows the classes
that will be in the ReadDataService application.
Page 135 of 194
Project FHaSS
Design Document
2012
Figure 2 ReadDataService class diagram
By finding the universes that exist in the HW_INFO table, the system won't need to be updated in the
future, as it will automatically detect new universes when they are added to the database. You only
need to set up the new relations between the games and the universes, so that application will take
the new server into account.
The ReadDataService will need a method that updates the Games table with all the distinct games
and a method that updates the Universe table with all the distinct universes. Also a method that
counts how many entries there are per game in the games table, and hold these numbers in a list.
ASP.NET MVC3 Application will have models to get the required information from the service, and
we also need an appropriate controller and a view to finally display the amount of entries. We are
also going to have a model, controller and views to let the user set up new game-to-universe
relations easily through the web interface. Below (figure 3) you can see a figure of these classes.
(The views are not really classes, however it is an important part of the MVC pattern so I decided to
include it here).
Page 136 of 194
Project FHaSS
Design Document
2012
Figure 3: Game filter class diagram
The second user story is about the server (universe) filter. It should function like this: the user select
the game, and then a specific server for that game. The view should then display the number of
entries for the specific server for the game. A server is also called a universe, which is the name used
in the database tables. See figure 2 (below) for a activity diagram describing the flow of events in this
user story.
Figure 4: Server filter activity diagram
This user story will mostly use the same classes as the last one. The reason for this is that we already
had the need for retrieving universes in the game filter user story, so most of the logic is already in
place. Some methods will be created or modified in the ReadDataService to reach the desired
information with new queries.
34 CPU Speed grouping
This user story entails showing CPU speeds by brackets starting at 1 GHz and incrementing with
400Mhz per bracket. We want to display both the number of entries within a speed group and the
percentage that speed group is of the total.
Currently the CPU information is stored in the CPU column of the hw_info table. The information
stored is the full line copied from a dxdiag file. This means that there is a lot of extra information
stored, so we need to parse the CPU speed. To do this we will create a few new methods in the
Page 137 of 194
Project FHaSS
Design Document
2012
ReadDataService (figure 5). This includes a method to get a list with all the CPU information from the
database, a method to filter the strings and a method to count for the different speed groups.
Figure 5: CPU grouping methods for the ReadDataService
A new model, controller and view (figure 6) also needs to be created so that we have a specific page
that displays the information in this user story.
Figure 6: MVC Classes
After the second iteration it became clear to us that using the original hw_info database table by
parsing the columns for the information we want (for example CPU speed) is very inefficient. The
parsing of strings takes a lot of time so it is impossible to fulfill the performance requirement of max
two seconds load time when searching through large amounts of data. However, if the hardware
information we want is already parsed and stored in a way so that we can directly extract it from the
database, it will go fast. Therefore we are going to create a new database with the exact information
we want, and a parser that will be used to get the information from the original database to the new
one. This is a temporary solution, in the future we will use integrate this into the current system that
Funcom have, replacing the parser they have now instead of having an extra.
Page 138 of 194
Project FHaSS
Design Document
2012
34.1 The new database
Figure 7: Database diagram
The new database (figure 7, above) will contain multiple tables, with the main table being the
hardware table. The columns will as mentioned only contain the exact information we want. So the
CPUCores will contain e.g. the integer 4, meaning four CPU cores.
34.2 The parser
Figure 8: HWParser class diagram
The parser will contain the classes in the figure above (figure 8). The stringParser will be a class with
methods to parse a general string based on a start and end keywords. E.g. "@" as start keyword and
"GHz" as end keyword. In some cases the strings stored will need extra checks to be able to find what
we want, as not every string use the same format.
Each of the filter methods in the HWParser will have specific keywords and this way find the desired
result. Depending on if the result returned is text or a number we want to return a string or an
integer, therefore we will need different methods in the stringParser that can return different types.
Page 139 of 194
Project FHaSS
Design Document
2012
Figure 9: HWParser sequence diagram
The figure above (figure 9) shows how the parser will work. The RunParser method starts the
sequence. First the GetCPUList method is called, this is going to return all the rows contained in the
CPU column in the original database table (hw_info). This method should use nHibernate to
communicate with the database. Then the FilterCPUList receives the list of strings containing the CPU
information and runs a loop the calls the different filter methods that filters each string in the string
list for the desired information. After a string is filtered the returned values will be inserted into the
new database with the InsertIntoDB method (which will also use nHibernate). The loop continues
filtering each string and inserting the information into the new database until the whole string list is
filtered.
The parser will run in a console application containing a Main method with a loop that starts
RunParser after a certain amount of time has passed. This console application will therefore need a
timer to keep track of how much time has passed, so it will know if the RunParser method should be
executed.
34.2.1 The Parser interface
Since the parsing and grouping of tables happen automatically as data is entered into the system or
each time an administrator changes the grouping rules there is the need for an interface where it is
possible to check the parser and grouping threads status due to their complex nature and long
runtime.
Due to the nature of the current database structure and size we need to create a user-friendly
interface to handle the separate parsing thread. The interface will provide basic functions to the user
of the system so that they can control the parser and view parsing statistics without having access to
the underlying systems.
Page 140 of 194
Project FHaSS
Design Document
2012
To achieve this, the parser will be controlled by the help of an admin web-page where the user can
start and stop the parser while reviewing the parsing status. The parser is design to run its own
thread and terminate gracefully when the user so chooses.
The only communication between the parser and the web-page is by the model, and the model will
call methods in the parser to achieve its goals. The MVC framework communicates in the normal
way.
Figure 10: Class diagram of HWParsers interface system
The solution to graceful threading is to use a volatile Boolean to exit the while loop sustaining the
thread alive.
Page 141 of 194
Project FHaSS
Design Document
2012
Figure 11: Sequence diagram of parser interface
As we can see from the diagram above, the MVC framework communicates through normal means
while the parserModel calls method in the parser.
35 Redesign of the WCF web service
After discussion both internally and externally with the external supervisor and employees at
Funcom we came to the solution to add a parsing application layer between the current hw_info
table and a new hw_info table. The addition of this parser made it clear that some of the
functionality that the WCF service currently possess would be transfered to this new parser layer.
After our discussion about the parser we also understood that the way the WCF service is currently
handling queries to the database could be improved. We decided therefore to implement a more
general database fetching method that is responsible for building up a query dynamically. The query
shall be built based on filtering criteria given by the client (MVC) as arguments to the fetching
method. This new method will also have the responsibility of sending the fetched result to private
grouping methods in the WCF where the data will handled and grouped according to the
requirement specifications. Lastly the method is responsible for returning the result back to the
client.
Since the rules of WCF web services sets restrictions on what types of data can be returned to the
client we had to think of a good way for returning the fetched and processed data. The conclusion we
came to was to create two new classes; FetchResult and FetchResultPart, which has the responsibility
of storing the results produced from the grouping methods. An instance of FetchResult, built up by a
set of FetchResultPart’s, is then returned to the client.
Page 142 of 194
Project FHaSS
Design Document
2012
Figure 12: ReadDataService class diagram
After feedback from a Funcom employee we also decided to make the NhibernateHelper non-static,
and instead initiate an instance of it in the ReadDataService.svc.cs class. Since the UpdateUniverses
method will be run in its own thread we concluded to open a new session from the
NhibernateHelper for each time our system is talking with the database.
36 Designing the page layout
The web-page design and layout have so far primarily been designed through internal discussion
within the team as we add functionality to the page (such as the hardware statistics table).
Both we and our client have the need of a layout mockup and CSS design so that we have something
steadfast to iterate on while we also make sure that our vision of the system matches with our
clients. Because the system is still in its early stages there is a lot of unknown functionality that we
cannot account for (or it simply isn’t implemented yet) but we can still create a general layout for the
page, and CSS styles from that.
The early designs were created from the idea that our system should replicate a similar system
(Steam Hardware Survey©) in terms of functionality and appearance and from that a few key
elements were quickly in place like the evolution charts, hardware statistics table, header and footer.
Our distinguished feature is the filter menu which can (in some situations) take a lot of room while it
still needs to be readily available on the page. In addition to this we need to display meta-data
(information about the selected entries) to the user as well as figure out how the menu, charts and
table should behave from user input.
Page 143 of 194
Project FHaSS
Design Document
2012
Figure 13: Early page design
In the earliest design it became clear that the filtermenu felt most natural on the left hand side of the
page, it also seemed natural that the meta-information about the entries (where the data comes
from in terms of universes, countries and time period) should be displayed in the table. Site
navigation buttons also fit very nicely centered at the top of the page.
After getting good feedback about the initial design by our client we were confident that our vision of
the system matched up with our clients. A few more mockups were created to illustrate different
solutions we could have chosen for our page which in turn gave us some ideas for where to place the
future functionality, but the layout itself stayed true to the original designs.
Page 144 of 194
Project FHaSS
Design Document
2012
Figure 14: Final iteration
The final iteration design became a bit more complex as we factored in functionality that have not
yet been planned (let alone implemented). The UI’s behavior became more defined in this iteration
when it comes to markings, expandable/collapsible fields, dynamic fields and how information
should be displayed.
All in all, the design is quite simple but offers a clean natural look making it intuitive and easy to use
for new users. Tooltips will also be implemented in a later stage to let users get acquainted with both
the advanced features of the system as well as some tips and tricks.
As the mockup was done, the next step was to create a basic CSS layout for the main page which
would prepare the page for implementation of the filtermenu amongst other functionality.
Page 145 of 194
Project FHaSS
Design Document
2012
37 GPU Manufacturer and VRAM
This user story will add information about the GPU manufacturer and vram for the user to see
information about. One should be able to see how many players use ATI, NVIDEA or Intel GPUs in
both numbers and percentage and also how much vram they have.
The HWParser needs to be updated so it will filter the vcard column in the hw_info table for the
manufacturer and the vram column for the amount of vram. Also the database needs to be extended
to include this new information. Below are updated diagrams illustrating this.
Figure 15: GPU methods added to HWParser class
The class diagram above (figure 11) shows the new GPU related methods and also some changes that
were done to the design during implementation of the previous user story.
Page 146 of 194
Project FHaSS
Design Document
2012
Figure 16: GPU methods added to HWParser sequence
The sequence diagram above (figure 12) shows how the GPU methods in the sequence for the
HWParser and also some changes that were done to the design during implementation of the
previous user story. The best way to actually transfer the GPU information to the new tables will be
to delete all the previous entries and run the parser through fully once more.
Figure 17: GPU info added to database
Page 147 of 194
Project FHaSS
Design Document
2012
Above (figure 13) displays the additions to the database to store the GPU information. There is a new
table that will contain the existing GPU manufacturers and the hardware table have a new foreign
key and vram column.
Figure 18: ReadDataService additions
The ReadDataService and the MVC also needs to be updated to include the GPU information (figure
14, above). First of all there is the mapped classes for the additional tables needs to be created. Then
we have the new grouping methods for the GPU manufacturer and the Vram which will be similar to
the previous grouping methods.
In the end the MVC also needs to be updated to display the GPU information the same way as for
CPU information. Also new MVCs needs to be added for administrating the GPU manufacturer and
VRam groups so that a user can manually change these.
38 Memory and OS user stories
For the memory user story we want to be able to see memory information by groups of memory
amount. The OS user story includes windows version, bit version and DirectX version. For now we do
not have any information stored about DirectX, so we will skip it.
Page 148 of 194
Project FHaSS
Design Document
2012
Figure 19: Memory, OS and bit methods
New filter methods needs to be created to get the data from hw_info and into the Hardware table.
Also the InsertIntoHardwareDbTable method needs to be updated.
Below, we can see the new sequence of the methods in the HWParser.
Page 149 of 194
Project FHaSS
Design Document
Figure 20: New HWParser sequence
Then we have the updates to the database.
Page 150 of 194
2012
Project FHaSS
Design Document
2012
Figure 21: Database updates
The OS table will contain the different existing OS. the hardware table have new columns for ram, os
and bits. Then we have the ramgroup table.
In the end new MVCs must be created to administrate the OS table and ramgroup table.
39 Redesigned responsibilities of WCF and Parser
Because of the bad performance that our system encountered when querying the database for large
sets of data, we had to look into enhancing the data processing. The result we came to was to move
the grouping functionality that was currently implemented in the WCF web service layer to the new
Parser layer. This will make it possible for the system to do almost all the pre-display work even
before the SQL query has been sent from the WCF.
Since the filtering and grouping operations of the current hw_info database are two separate
operations that most often will be run independently and with different intervals in time, our
solution was to create another hardware table called groupedhardware (see database illustration in
previous section). With this separation of storage the grouping operations will be working on already
parsed data stored in the hardware table, while the parsing functionality will be working on the raw
data from the hw_info table.
The Parser will be running kind of more in the background than the WCF will do. The WCF will be
doing its work on demand from the MVC, while the Parser will more or less almost always be
running. Because of these different modes of runtime it is more appropriate that the Parser will be
the process running the UpdateDistinctUniverses function that was previously implemented in the
WCF, and also the new UpdateDistinctGpuModels function. Because of the decision that the Parser
Page 151 of 194
Project FHaSS
Design Document
2012
will now take over the grouping functionality it would also be a breach of the separation of concerns
to still have these functions still running in the WCF layer.
In meetings with Funcom employees we have found out that they want to be able to control almost
everything related to the systems grouping functionality manually. Since the only interface our
system has with the user is the MVC, and the only interface between the MVC and the database is
the WCF, the WCF is of course then the part that will have to handle this database table updating.
The WCF has earlier only been used for retrieving data from the database and sending it to the MVC
for display. Since the WCF has now been extended with this new administration functionality it has
become obvious that the most appropriate action is to separate the earlier service methods and the
new admin methods into their own services. The old functionality will still be stored in the
ReadDataService service, while the new admin functionality will be stored in the AdminService
service.
Figure 22: Admin Service class
40 GPU user story
Because of a large variety in the different GPU models that is registered in the hw_info database, a
bit more sophisticated filtering and grouping functionality had to be used for this. If we had gone
with the same functionality as used in earlier user stories the hardware statistics display would
contain lots and lots of GPU models with both big and small differences in their names.
Our solution to this problem was to create two database tables; distinctgpumodel and
generalgpumodel (see database illustration in section 8). The distinctgpumodel table will be a table
similar to the universe table where all distinct registered GPU models in the hardware table are
Page 152 of 194
Project FHaSS
Design Document
2012
stored. Then we let the user of our system create and maintain a set of more general GPU models,
stored in the generalgpumodel, and choosing which distinct GPU models shall be mapped to which
general GPU model. Our system will then generate all statistics and displays for GPU models as
though the distinct GPU models actually was of the general GPU model it is mapped to, making the
statistics a lot more readable and informing.
40.1 Resolution
For the resolution parsing filter we will create a new resolution table that will contain the resolutions
that are going to be parsed.
41 CPU Model
Like the GPU user story Funcom wants to see statistics of general CPU models. For example they
want to see how many percentage of the players have a Core 2 Duo or an i5 processor. A
distinctcpumodel and a generalcpumodel table will be used and the user of our system will be able to
create and maintain these general CPU models, just like with the GPU models. The user will be able
to set the distinct CPU models relation to a general CPU model, and our system will then display all
statistics as if the distinct CPU model actually was of the general CPU model it is mapped to.
Figure 23: HWParser classes
Page 153 of 194
Project FHaSS
Design Document
2012
The class diagram above shows the updated design of our parser, including the CPU model additions
and also general updates to the design that have been made while implementing the code. The
grouping logic have been moved to its own class, and so has the update and auto relate methods for
the distinct tables.
Figure 24: Database tables
Above are the tables in our database, including the distinctcpumodel and generalcpumodel tables.
In addition to the previous updates, all the data models that nHibernate uses and the nHibernate
helper are moved to its own project.
42 Updates after code review / before first deployment
After reviewing our code before the first deployment, better ways to structure our system were
discovered. These updates are represented in the updated UML diagrams below.
Page 154 of 194
Project FHaSS
Design Document
2012
Figure 25: nHibernateMappings classes
All the MappedClasses created for nHibernate and the helper are moved to the new
NHibernateMappings project so that the mappings can be used in both the services and the parser
easily.
Figure 26: HWParser classes
Page 155 of 194
Project FHaSS
Design Document
2012
Some unnecessary methods have been removed from the parser classes after rewriting parts of the
code.
Figure 27: Service classes
A third service has been created to contain the code for communication with the parser object.
The diagram below shows the main components for the current system.
Figure 28: Overall system components
Page 156 of 194
Project FHaSS
Design Document
2012
43 HighCharts
For creating the charts we were recommended to use a JavaScript API called HighCharts.
This API contains a lot of different functionalities and has a lot of customization options available to
generate whichever charts necessary for displaying the relevant information.
The way they are generated is by dynamically generating JavaScript with Razor C# syntax using loops
and conditions.
HighCharts are structured in a simple, yet expansive fashion. The UML diagram below shows a simple
version of the structure, and shows the parts we used to generate the charts for our system.
The Highcharts.js file contains the main graph rendering tools, where as we customize it further with
the use of the themes class to make it match our system’s color scheme and the export class simply
to export the charts as image- or PDF files.
There are many ways to define the options of the charts, either via an options instance or directly in
the charts instance right before rendering. We went for the latter one giving us complete control to
customize the individual parts of the charts from our dynamically generated hardware lists.
44 Geographical Location
Because of the nature of our system is to filter information according to what the user needs it is
imperative to be able to filter the database entries by their geographical location. Being able to filter
entries by location would help the users to easily see statistical differences (in hardware) between
countries or entire regions.
In order to specify the origin of a bug report we would first need its IP address, but because of a
limitation within Funcom’s current python parser it does not currently provide this information.
There were also several other pieces of information that our new system needed (such as OS bit,
resolution and DirectX information) and after we brought this to Funcom’s attention they did the
necessary alterations to the python parser in order to make this information available in our
database.
Researching geotargeting quickly told us that we need some external pieces of software and data to
retrieve a country from an IP address. Because a country does not have a predetermined range of IPs
but rather a set of ranges that may vary you end up with a whole lot of different ranges to different
countries, luckily this information is collected by interested parties and stored within a geolocation
database which is available for free. In addition to requiring the data itself, we also need to
implement an external C# class that handles the conversion of IP address to a number (IP number)
which is used as the key for values within the database.
We settled with MaxMind®’s free GeoIP database as well as the accompanying open source C#
CountryLookup class. The GeoIP data file is to be implemented as an embedded resource while the
open source code is to be used as a standalone class in our parser.
Page 157 of 194
Project FHaSS
Design Document
2012
45 Windows service
Originally the parser was a console application which had to be started by a exe file. A new
requirement added late in the project period was that the parser had to be re-implemented as a
windows service application. The reason for this is that it should be installed to run in the
background.
So the parser had to be rewritten to support windows service functionality. Several new specific
windows service methods needs to be added like for starting and stopping the service. Other than
the new methods that are used to manage the application as a windows service the code of the
parser is the same.
Figure 29: Illustrating the parser as a windows serivce
46 General model relation search / manufacturer
In the general CPU and GPU models section of the administration page it is possible to add new
general models to the database, similar to the other administration pages. Specifically it works like
the universe to game administration in the way that a general model will have a database relation to
multiple distinct models. There are however a lot more distinct models to relate to a general model
than there is universes for a game, therefore an easier way to relate many of the models
automatically is wanted, so that the user can avoid relating one distinct model at a time.
The automatic relation should be done when the model is first created. A simple way to do this will
be that the user provides a string that will occur in the distinct model names. One will then retrieve a
list of all the distinct models that do not already have a relation, iterate through it and check if the
names contains the provided string. If it does, the relation will be set to the newly created general
model.
Another feature that is wanted is to easily be able to sort the models after manufacturer and also be
able to display a logo for it. A simple way to do this is to let the user choose a manufacturer when he
creates the general model. The general model can contain a database relation to the manufacturer
and the manufacturer should also be added to the name of the general model.
Page 158 of 194
Project FHaSS
Design Document
2012
So to summarize, to create a new general model the user should specify a name, a relation search
(optional) and a manufacturer. The relation search is optional because the user should be able to
choose to set the relations manually if wanted. If this is the case the relation search string should just
be left empty and this needs to be handled by the system.
Figure 30: Sequence of automatically relating distinct to general models
47 Hard disk information
This task in our project requires code to be written that will be used in the game client to extract
hardware information from the player pc and add this to the bug report that is sent to Funcom. The
task was to make a prototype program that would find out if the hard disk is a SSD disk or not, based
on the model number of the disk, and also the free and total space available on the disk.
The prototype should just get the information and then print it out. So the design is quite simple. All
the disks on the pc should be found, and then the model number and free/total disk space should be
extracted and printed. If the model number contains the keyword "SSD" it should be printed that it is
an SSD disk. While the design is quite simple, the task is quite a challenge because it needs to be
written in C++ without the use of .NET libraries or CLR, so that it eventually can be included in the
“The Secret World” game client. This will require finding and learning to use low level functions in
windows.
Figure 31: Sequence for finding hard disk information
Page 159 of 194
Project FHaSS
Design Document
2012
48 Filter storage and URL
There are some filters the users of the system would like to be able to view easily and fast because it
is information they regularly want to review or show to different people. Two new functionalities will
give the users the ability to do this.
The first one is the filter storage. The user should be able to select what he wants in the filter menu
and the give the filter a name and save it. The filter should then appear in a secondary menu that all
users of the system can see. When the name of the filter is clicked the filter will be loaded. To store
the filter some new database tables are needed. One table will store the name of the filter and the
timer period. Another will store countries connected to saved filters and the last will store the
universes connected to the saved filters.
Figure 32: Database tables for storing filters
The second is that the filter should generate a unique URL which the user can then bookmark and/or
share with other users. This will easily be done by changing theHTML request method of the Filter
Menu form from POST to GET.This results in a resulting URL including all the forms inputs names and
values. The URL can for instance be accessed by other users of the system, and he/she will get the
exact same data presented.
49 Exception handling and logging
Late in the project period we have realized that a lot of the crashes we experienced with the parser /
grouper are not really possible to always avoid. These are for instanceissues like timeouts to the
database. The only realistic fix is to handle these exceptions that occur, because they can't always be
avoided and will happen randomly.
Our solution is to try to run a method again when an exception occurs. The event should be logged to
the database (if possible, if this fails then to a file). If the exception should occur again on the next
attempt, then it needs to try again. This should repeat until it is successful or it have tried a maximum
amount of times (four). Between each attempt it should wait a short but increasing amount of time
before trying again, so that the other systems it is relying on can become available (e.g. the database
connection). If it fails the last attempt the program should log this and then shut down and needs to
be restarted. Functionality to automatically restart is included in the windows service.
Page 160 of 194
Project FHaSS
Design Document
2012
Figure 33: Sequence for exception handling
The last few entries in the log should be viewable on the administration page under the interface
section.
50 Caching
As our queries to the database took longer and longer as the database grew we had no chance of
meeting the loading time requirements with the current system, so after a discussion with the
product owner and other Funcom employees this requirement has been dropped. Good
performance is of course one of our top priorities so we (with the help of Funcom employees)
developed a solution which could work as a compromise between extremely large amounts of data
as well as fast loading times. The compromise would be that this solution only works on a preset time
span of data, in our case this became one month of information.
By caching every entry for the last month into the service memory, any request regarding
information within that time span would be processed without needed to query the database.
This way we avoid the heavy loading time caused by accessing the database with several million rows
(about four and a half at the moment).
The caching is implemented by having the WCF service retrieve the database rows for the previous
month and store this in memory. Every day it should update the memory so that this stays true. For
example, one day the memory will contain data from 10.04.2012 to 10.05.2012 and the next day the
memory will contain data from 11.04 to 11.05.
A logical check on the dates is needed in the ReadDataService to decide whether or not to use the
cached memory, the input (parameters like universe and country) and the output (the result) from
the service remains the same.
Page 161 of 194
Project FHaSS
Design Document
2012
New methods need to be written to iterate through the cached entries for sorting, counting and
grouping before returning the result in the same fashion a normal database query would.
51 Conclusion
The system has evolved quite a lot throughout the project period. Some of the requirements we have
implemented have made us realize better ways to solve specific problems which have led us to
rewrite parts of the code.
This is especially true for the parser, where the design and implementation has been changed quite a
few times. It started out just as a simple console application that later was being handled by a WCF
Service, but in the end we ended up designing and implementing it as a Windows Service.
On the MVC (i.e. the user interface) side, after our mock-ups were done of the system, not much
have been changed other than implementing new features over time as we got to designing and
implementing the requirements.
The WCF Service have changed quite a lot. From only doing database queries with nHibernate to
using cache for faster loading times inside the last month.
Page 162 of 194
Funcom Hardware Statistics System
Test summary
Project name
Funcom Hardware Statistics System
Client
Funcom N.V.
Date
29.05.12
Author
Kim Richard Johansen
Acronym
FHaSS
Sensors & Supervisors
Internal sensor
Olaf Hallan Graven
Internal supervisor
Aurilla Aurelie Arntzen
External supervisor
Rui M. MonteiroCasais
Group members
............................
Sondre Bjerkerud
............................
Sverre Christoffer Thune
............................
Dag Hem
............................
Kent Brian Dreyer
............................
Kim Richard Johansen
Project FHaSS
Test log
2012
Test summary
52 General Document Information
Deliverable nr:
Deliverable type:
Release:
Workpackage:
Responsible:
D8.2.1
Report
Public
Independent
Kim Richard Johansen
52.1 Declaration of intention
This is a document containing information about all tests that has been completed, successful and
unsuccessful. Tests that have not been executed are also listed with an explanation for why it has not
been completed. Verification tests are listed with a short summary.
52.2 Definitions and Acronyms
Bug
Parser
CPU
GPU
RAM
DX
HDD
SSD
OS
COS
Bug
IDE
An error in the programming code.
Searches a data file for key words and copies the values it
finds.
Central Processing Unit
Graphical Processing Unit
Random Access Memory
DirectX: A collection of application programming interfaces
(APIs) for handling tasks related to multimedia, like for
instance game programming.
Hard Disk Drive
Solid State Disk: A type of HDD.
Operating System
Condition of Satisfaction
An error in the programming code
Integrated development environment
52.3 Document History
Version
1
1.5
Description
First version created
Updates after document review
Page 164 of 194
Date
24.05.2012
28.05.2012
Project FHaSS
Test log
2012
53 Table of contents
52 General Document Information .................................................................................................. 164
52.1
Declaration of intention ...................................................................................................... 164
52.2
Definitions and Acronyms ................................................................................................... 164
52.3
Document History ............................................................................................................... 164
53 Table of contents ......................................................................................................................... 165
54 List of validation tests completed ............................................................................................... 166
55 Logs for validation tests performed ............................................................................................ 166
55.1
Story 3: Game filter ............................................................................................................. 167
55.2
Story 4: Server filter............................................................................................................. 167
55.3
Story 5: CPU information..................................................................................................... 168
55.4
Story 6: Graphics card information ..................................................................................... 170
55.5
Story 6/7: Hardware type management and grouping ....................................................... 170
55.6
Story 7: OS information ....................................................................................................... 172
55.7
Story 8: Memory information.............................................................................................. 174
55.8
Story 9: Geographical location filter.................................................................................... 175
55.9
Story 11: Time period filter ................................................................................................. 176
55.10
Story 20: Trend charts ..................................................................................................... 176
Other ............................................................................................................................................... 177
56 Validation tests that were not performed and why .................................................................... 178
56.1
List of validation tests that were not performed ................................................................ 178
56.2
T-R-1 Display hardware / software statistics....................................................................... 178
56.3
T-R-3-2 Filter statistics –user interface................................................................................ 179
56.4
T-R-5 Display software statistics.......................................................................................... 180
56.5
T-R-6 Future hardware prediction ....................................................................................... 180
57 Verification tests.......................................................................................................................... 181
57.1
Code review ......................................................................................................................... 181
57.2
Code compilation ................................................................................................................ 181
57.3
Debugging ............................................................................................................................ 181
57.4
Strain test ............................................................................................................................ 181
57.5
Regression test/Ad hoc test ................................................................................................ 182
57.6
Performance test ................................................................................................................. 182
Page 165 of 194
Project FHaSS
Test log
2012
54 List of validation tests completed
Userstory
3: Game filter
Name of test
Filter statistics –game filter
Test id
T-R-3-3
Date
02.02.2012
4: Server filter
Filter statistics –server filter
T-R-3-4
26.02.2012
Display hardware / software
statistics –CPU information
Display hardware / software
statistics –GPU information
Hardware type management
and grouping
Hardware type management
and grouping –new hw type
Display hardware / software
statistics –OS information
Display hardware / software
statistics –Direct X information
Display hardware / software
statistics –RAM information
Filter statistics –geographical
location filter
Filter statistics –time period
filter
Display hardware / software
evolution charts
Filter statistics
T-R-1-1
T-R-1-2
27.04.2012
11.03.2012
27.04.2012
T-R-4-1
22.05.2012
T-R-4-2
22.05.2012
T-R-1-4
14.03.2012
T-R-1-5
27.04.2012
T-R-1-3
13.03.2012
T-R-3-6
27.04.2012
T-R-3-5
27.04.2012
T-R-2
02.05.2012
T-R-3-1
23.05.2012
5: CPU information
6: Graphics card information
6/7: Hardware type
management and grouping
6/7: Hardware type
management and grouping
7: OS information
7: OS information
8: Memory information
9: Geographical location filter
11: Time period filter
20: Trend charts
Other
55 Logs for validation tests performed
This is meant as a short overview for each of the validation tests performed.
Explanation:
Tests with outcome --Test Failure-- means that the test failed and the system worked as planned.
Tests with outcome --Test Successful-- means that the test successfully pointed out that something in
the system did not work as planned. Modifications where needed on the system and a new test was
scheduled.
Page 166 of 194
Project FHaSS
Test log
2012
55.1 Story 3: Game filter
Name
Filter statistics –game filter
Test ID
Requirement ID: A-F-3
Test description: Test to see if the game filter combinations are working correctly.
Test date:
Testing method:
Test approach:
T-R-3-3
Test if results after filtering show entries for each universe for that game
02.02.2012
Tester:
Kim Richard Johansen
Function test, black box
4. Start the filter combination to be tested.
5. Wait for the web-page containing the filtered statistics to load.
6. Compare the produced filtered percentage statistics to the manually
calculated percentages.
Test criteria
Database and website is up and running.
Test data set has been made and inserted into database
Expected
results:
That the produced filtered percentages based on the test data set are
similar to the manually calculated percentages for the tested filter
combination.
Test creator:
Errors:
Outcome
Kim Richard Johansen
01.31.2011
None. Tried each filter combination and the right amount of entries did
show for each of them.
Tried each game filter. The results after filtering did give the right amount of
data from the universes for that game. The test data set confirms the result.
Age of Conan
390
13 universes
The Secret World
210
7 universes
Global
90
3 universes
At this stage in the project CPU results did show for the universe filtering, but
due to the parser not being 100% at the moment, results did not match the test
data set.
---Test Failure---
55.2 Story 4: Server filter
Name
Filter statistics –server filter
Test ID
T-R-3-4
Requirement ID: A-F-3
Test description: Test to see if the server filter combinations are working correctly.
Test date:
Testing method:
Test approach:
Test if results after filtering universe show entries.
26.02.2012
Tester:
Kim Richard Johansen
Function test, black box
1. Start the filter combination to be tested.
2. Wait for the web-page containing the filtered statistics to load.
Page 167 of 194
Project FHaSS
Test log
2012
3. Compare the produced filtered percentage statistics to the manually
calculated percentages.
Test criteria
Database and website is up and running.
Test data set has been made and inserted into database
Expected
results:
That the produced filtered percentages based on the test data set are
similar to the manually calculated percentages for the tested filter
combination.
Test creator:
Errors:
Outcome
Kim Richard Johansen
31.01.2012
None. Tried each filter combination and the right amount of entries did
show for each of them.
Tried each filter combination. Each of the 23 universes showed 30 entries and
that is correct with the manual calculations in the test data set.
Combining universes also worked, showed and combined entries correctly.
At this stage in the project CPU results did show for the universe filtering, but
due to the parser not being 100% at the moment, results did not match the test
data set.
---Test Failure---
55.3 Story 5: CPU information
Name
Display hardware / software statistics –CPU information
Test ID
T-R-1-1
Requirement ID: A-F-1 and B-F-1
Test description: Test to see if tables are created and contains accurate information about the
different CPUs stored in the database.
Test date:
Testing method:
Test approach:
It should be possible to toggle between number of entries and %.
Data to be shown:
CPU speed by brackets (like Steam). Inc. at 400mhz, staring at 1.0hgz.
Show split between AMD and Intel (and other)
Show number of cores
27.04.2012
Tester:
Kim Richard Johansen
Function test, black box
5. Put in the time period for which the statistical data shall be produced
with basis upon.
6. Choose to get to see statistical information for CPU.
7. Wait for the web-page containing the information to load.
8. Compare the resulting percentages to the percentages that have been
manually calculated from the test data set.
Test criteria
Database and website is up and running.
Test data set has been made and inserted into database
Expected
results:
The percentages the system produces and displays on the web-page
based on the test data set are similar to those calculated manually.
Test creator:
Kim Richard Johansen 23.12.2011
Page 168 of 194
Project FHaSS
Errors:
Outcome
Test log
2012
None
Test data set loaded into the data base and went through the parser and
grouper functionality successfully.
The information displayed on the website corresponded to the manually
calculated results for different models, speed groups, manufacturer and number
of cores.
--Test Failure--
Name
Display hardware / software statistics –CPU information
Test ID
T-R-1-1
Requirement ID: A-F-1 and B-F-1
Test description: Test to see if tables are created and contains accurate information about the
different CPUs stored in the database.
Test date:
Testing method:
Test approach:
It should be possible to toggle between number of entries and %.
Data to be shown:
CPU speed by brackets (like Steam). Inc. at 400mhz, staring at 1.0hgz.
Show split between AMD and Intel (and other)
Show number of cores
11.03.2012
Tester:
Kim Richard Johansen
Function test, black box
1. Put in the time period for which the statistical data shall be produced
with basis upon.
2. Choose to get to see statistical information for CPU.
3. Wait for the web-page containing the information to load.
4. Compare the resulting percentages to the percentages that have been
manually calculated from the test data set.
Test criteria
Database and website is up and running.
Test data set has been made and inserted into database
Expected
results:
The percentages the system produces and displays on the web-page
based on the test data set are similar to those calculated manually.
Test creator:
Errors:
Outcome
Kim Richard Johansen 23.12.2011
Information display correctly on the web site but:
- CPU manufacturer does not contain the right percentages
- CPU speed does not contain the right percentages
- CPU core does not contain the right percentages
Information displayed correctly but does not correspond with the data in the
test data set.
The reason for not showing the right percentages could be that the parser is not
accurate enough when it comes to extracting the speed, manufacturer and cores
from CPU information. A few entries differed for speed and manufacturer but
cores did not even show all the different types.
--Test Successful--
Page 169 of 194
Project FHaSS
Test log
2012
55.4 Story 6: Graphics card information
Name
Display hardware / software statistics –GPU information
Test ID
T-R-1-2
Requirement ID: A-F-1 and B-F-1
Test description: Test to see if tables are created and contains accurate information about the
different GPUs stored in the database.
Test date:
Testing method:
Test approach:
It should be possible to toggle between number of entries and %.
COS: Show split between nVidia, Intel, AMD, and others.
Data to be shown:
Show video card model like Steam.
Show VRAM
Show Primary and multi-monitor resolution.
27.04.2012
Tester:
Kim Richard Johansen
Function test, black box
5. Put in the time period for which the statistical data shall be produced
with basis upon.
6. Choose to get to see statistical information for GPU.
7. Wait for the web-page containing the information to load.
8. Compare the resulting percentages to the percentages that have been
manually calculated from the test data set.
Test criteria
Database and website is up and running.
Test data set has been made and inserted into database
Expected
results:
The percentages the system produces and displays on the web-page
based on the test data set are similar to those calculated manually.
Test creator:
Errors:
Outcome
Kim Richard Johansen 23.12.2011
None
Test data set loaded into the db and then went through the parser and grouper
functionality.
The information displayed on the website corresponded to the manually
calculated results for video card model, VRAM and Primary resolution.
Multi-monitor resolution has been changed to an extension of the system and
therefore not a part of this test.
--Test failure--
55.5 Story 6/7: Hardware type management and grouping
Name
Hardware type management and grouping
Test ID
T-R-4-1
Requirement ID: A-F-5
Test description: Test to see if the hardware from the bug reports is grouped correctly under
general hardware types and that it shows the correct percentage for each of
them based on the total.
Page 170 of 194
Project FHaSS
Test log
2012
This test will also contain:
Test if registered but unrecognized hardware is grouped in the
unrecognized category and shows the right percentage.
Test date:
Testing method:
Test approach:
Test criteria
22.05.2012
Tester:
Sverre C. Thune
Function test, black box
3. Get the statistics page. Print out, write down, etc., the groups and their
respective percentages.
4. Compare the group percentages to percentages manually calculated
from the test data set.
Expected results
Test creator:
Errors:
Outcome
Database and website is up and running.
There has to be one or more currently registered but not recognized
hardware types.
Test data set has been made and inserted into database
That the system produced percentages is the same as the manually
calculated ones.
Sondre Bjerkerud, Sverre C. Thune
21.12.2011
Updated by: Kim Richard Johansen
23.12.2011
None
The statistics in the hardware info table show the same counts and percentages
as the test data set. All the percentages add up to a hundred percent.
--Test Failure--
Name
Hardware type management and grouping –new hw type
Test ID
T-R-4-2
Requirement ID: A-F-4 and A-F-5
Test description: Test is run after T-R-4-1
Create a new general hardware type and choose which type of hardware it
should contain from the unrecognized hardware group.
Test date:
Testing method:
Test approach:
Test criteria
22.05.2012
Tester:
Sverre C. Thune
Function test, black box
7. Get the statistics page. Print out, write down, etc., the groups and their
respective percentages.
8. Create a new general hardware type of one of the possible categories;
CPU, Graphics Card.
9. Choose group one/some/all of the registered but not recognized
hardware types under the newly created general hardware type.
10. Get the updated statistics page. Print out, write down, etc., the groups
and their respective percentages.
11. Compare the new group percentages to percentages produced before
adding the hardware type(s) to the new general hardware type (step 1).
12. Compare results the group percentages whit percentages manually
calculated from the test data set.
Database and website is up and running.
There has to be one or more currently registered but not recognized
Page 171 of 194
Project FHaSS
Test log
Expected results
Test creator:
Errors:
Outcome
2012
hardware types.
Test data set has been made and inserted into database
That the system produced percentages is the same as the manually
calculated ones. That is, both the basis statistics page (step 1) and the
updated statistics page (step 4) contain the same percentages as the
manually calculated percentages for the two instances of the general
hardware type grouping.
Sondre Bjerkerud, Sverre C. Thune
21.12.2011
Updated by: Kim Richard Johansen
23.12.2011
None
After mapping all the distinct GPU models and CPU models to general GPU
models and CPU models, the values printed in the statistics table corresponded
to the test data set.
--Test Failure--
55.6 Story 7: OS information
Name
Display hardware / software statistics –OS information
Test ID
T-R-1-4
Requirement ID: A-F-1 and B-F-1
Test description: Test to see if tables are created and contains accurate information about the
different OS information stored in the database.
It should be possible to toggle between number of entries and %.
COS: Show the OS from all systems in db and group them under different groups.
Data to be shown:
OS grouped under:
Test date:
Testing method:
Test approach:
Test criteria
Windows 7 64 bit
Windows 7 32 bit
Windows Vista 64 bit
Windows Vista 32 bit
Windows XP 64 bit
Windows XP 32 bit
Unknown
14.03.2012
Tester:
Kim Richard Johansen
Function test, black box
5. Put in the time period for which the statistical data shall be produced
with basis upon.
6. Choose to get to see statistical information for GPU.
7. Wait for the web-page containing the information to load.
8. Compare the resulting percentages to the percentages that have been
manually calculated from the test data set.
Database and website is up and running.
Page 172 of 194
Project FHaSS
Expected
results:
Test creator:
Errors:
Outcome
Test log
Test data set has been made and inserted into database
The percentages the system produces and displays on the web-page
based on the test data set are similar to those calculated manually.
2012
Kim Richard Johansen 13.03.2011
None.
After the test data set had been parsed and grouped the information displayed
on the website was correct according to the manual calculated results in the test
data set. Correct amount and percentages.
--Test Failure--
Name
Display hardware / software statistics –Direct X information
Test ID
T-R-1-5
Requirement ID: A-F-1 and B-F-1
Test description: Test to see if tables are created and contain accurate information about the
different Direct X information stored in the database.
It should be possible to toggle between number of entries and %.
COS: Show the Direct X from all systems in db and group them under different
groups.
Data to be shown:
Direct X grouped under:
Test date:
Testing method:
Test approach:
Direct X 11.1
Direct X 11.0
Direct X 10.1
Direct X 10.0
Direct X 9.0c
Unknown
27.04.2012
Tester:
Kim Richard Johansen
Function test, black box
5. Put in the time period for which the statistical data shall be produced
with basis upon.
6. Choose to get to see statistical information for GPU.
7. Wait for the web-page containing the information to load.
8. Compare the resulting percentages to the percentages that have been
manually calculated from the test data set.
Test criteria
Database and website is up and running.
Test data set has been made and inserted into database
Expected
results:
The percentages the system produces and displays on the web-page
based on the test data set are similar to those calculated manually.
Test creator:
Errors:
Outcome
Kim Richard Johansen 16.03.2011
None.
Loaded test data set containing DirectX into the database and ran the parser and
Page 173 of 194
Project FHaSS
Test log
2012
grouper system.
Loaded the website and checked if the information displayed corresponded to
the manually calculated results. It did.
--Test Failure--
55.7 Story 8: Memory information
Name
Display hardware / software statistics –RAM information
Test ID
T-R-1-3
Requirement ID: A-F-1 and B-F-1
Test description: Test to see if tables are created and contains accurate information about the
different RAM stored in the database.
It should be possible to toggle between number of entries and %.
COS: Show the RAM from all systems in db and group them under different
range groups.
Data to be shown:
RAM grouped under:
Test date:
Testing method:
Test approach:
Less than 512 MB
512 MB to 999 MB
1 GB
2 GB
3 GB
4 GB
5GB and higher
Unknown
13.03.2012
Tester:
Kim Richard Johansen
Function test, black box
5. Put in the time period for which the statistical data shall be produced
with basis upon.
6. Choose to get to see statistical information for GPU.
7. Wait for the web-page containing the information to load.
8. Compare the resulting percentages to the percentages that have been
manually calculated from the test data set.
Test criteria
Database and website is up and running.
Test data set has been made and inserted into database
Expected
results:
The percentages the system produces and displays on the web-page
based on the test data set are similar to those calculated manually.
Test creator:
Errors:
Outcome
Kim Richard Johansen 13.03.2011
Zero errors.
All the different universes gave the same results and they corresponded to the
test data set.
Page 174 of 194
Project FHaSS
Test log
2012
--Test Failure--
55.8 Story 9: Geographical location filter
Name
Filter statistics –geographical location filter
Test ID
T-R-3-6
Requirement ID: A-F-3
Test description: Test to see if the geographical location filter combinations are working correctly.
It should be possible to choose between continent and country as a filtering
option.
COS: That the data shown after choosing a continent or country corresponds to
the manually calculated results.
Test date:
Testing method:
Test approach:
Continents to be able to choose from:
North America
South America
Antarctica
Africa
Europe
Asia
Australia
27.04.2012
Tester:
Kim Richard Johansen
Function test, black box
4. Set the filter combination to be tested.
5. Wait for the web-page containing the filtered statistics to load.
6. Compare the produced filtered percentage statistics to the manually
calculated percentages.
Test criteria
Database and website is up and running.
Test data set has been made and inserted into database
Expected
results:
That the produced filtered percentages based on the test data set are
similar to the manually calculated percentages for the tested filter
combination.
Test creator:
Errors:
Outcome
Kim Richard Johansen
24.04.2012
None.
Combinations tested:
Each country and combination of countries from different regions.
Each region and combination of different regions.
Mapping interface.
All worked successfully.
--Test failure--
Page 175 of 194
Project FHaSS
Test log
2012
55.9 Story 11: Time period filter
Name
Filter statistics –time period filter
Test ID
Requirement ID: A-F-3
Test description: Test to see if the time filter combinations are working correctly.
Test date:
Testing method:
Test approach:
T-R-3-5
Test if the data shown on the website corresponds to the manually
calculated results after setting a time filter.
27.04.2012
Tester:
Kim Richard Johansen
Function test, black box
4. Set the filter combination to be tested.
5. Wait for the web-page containing the filtered statistics to load.
6. Compare the produced filtered percentage statistics to the manually
calculated percentages.
Test criteria
Database and website is up and running.
Test data set has been made and inserted into database
Expected
results:
That the produced filtered percentages based on the test data set are
similar to the manually calculated percentages for the tested filter
combination.
Test creator:
Errors:
Outcome
Kim Richard Johansen
24.04.2012
None.
Tested information that gives an error in the date fields such as non numeric
characters, nothing, 0, out of bounds (such as day nr 32 and month nr 13). It
worked well.
Default values are used when an error occurs. Worked.
Tested predefined dates in from field and to field and checked if the total
amount of entries displayed corresponded to the manually calculated results.
They did.
--Test failure--
55.10 Story 20: Trend charts
Name
Display hardware / software evolution charts
Test ID
T-R-2
Requirement ID: A-F-2
Test description: Test to see if evolution charts are created and to see if the contained
information is accurate against the test data set.
Test date:
Testing method:
Test approach:
02.05.2012
Tester:
Kim Richard Johansen
Function test, black box
6. Put in the time period for which the evolution charts are to be produced
with basis upon.
7. Choose to get to see one of the possible evolution charts; CPU, GPU,
CPU cores, or Windows OS version and DirectX version.
Page 176 of 194
Project FHaSS
Test log
2012
8. Wait for the chart to load.
9. Do as exact a comparison between the manually calculated data and the
chart. The chart shall be compared to the manually calculated data at
five (5) times/points with equal distance between them. The first and
the last times/points are the same values that was put in at stage 1 of
this test, which will be the start and end of the chart lines.
10. The percentages displayed in proximity to the chart are compared to the
manually calculated percentages for the last time/point the chart is
describing.
Test criteria
Database and website is up and running.
Test data set has been made and inserted into database
Expected
results:
That the chart seems to display similar values to those who have been
calculated manually for each of the five points/times of the chart.
That the percentages displayed in proximity to the chart based on the
test data set are similar to those calculated manually.
Test creator:
Errors:
Outcome
Sondre Bjerkerud, Sverre C. Thune
21.12.2011
Updated by: Kim Richard Johansen
23.12.2011
None.
The manually calculated results had data from 07.01.2012 to 12.31.2012 set with
a time span resolution of 6.
The same time span and resolution was chosen in the filtermenu and the site
refreshed.
The charts displayed correctly and the % values for each category and time
resolution corresponded to the manually calculated results.
--Test Failure--
Other
Name
Filter statistics
Test ID
T-R-3-1
Requirement ID: A-F-3
Test description: Test to see if the different filter combinations are working correctly.
Test each filter by itself. That is for instance putting in values for the
time period filter only, leaving the other filters with null value/the
standard value.
Test with all filters set.
The filter values that will be beneficial to put in will depend on the data set. For
instance should both values that are represented in the data set and values that
are not represented in it (say for instance a specific Funcom game) be filtered
upon. For the time period filter both the whole period which the test data set is
describing, and only parts of it, and also with time periods where the to and
from limits are stretched further into time or farther back in time than the test
data set describes.
Test date:
23.05.2012
Tester:
Kim Richard Johansen
Page 177 of 194
Project FHaSS
Testing method:
Test approach:
Test log
2012
Function test, black box
7. Put in the filter combination to be tested.
8. Wait for the web-page containing the filtered statistics to load.
9. Compare the produced filtered percentage statistics to the manually
calculated percentages.
Test criteria
Database and website is up and running.
Test data set has been made and inserted into database
Expected
results:
That the produced filtered percentages based on the test data set are
similar to the manually calculated percentages for each of the tested
filter combinations.
Test creator:
Errors:
Outcome
Sondre Bjerkerud, Sverre C. Thune
21.12.2011
Updated by: Kim Richard Johansen
23.12.2011
None.
Mapped all countries to their respective region and servers to their game.
Tried to use just the time filter, just the geographical filter and just the universe
filter. All data corresponded to the test data set.
Tried combinations of time with both geographical and universe filter and all
data corresponded to the test data set. Zero errors.
--Test Failure--
56 Validation tests that were not performed and why
This is meant as a short summary for each of the validation tests that were not performed during our
project period also with an explanation for why.
56.1 List of validation tests that were not performed
Name of test
Display hardware / software
statistics
Filter statistics –user interface
Test id
T-R-1
T-R-3-2
Display software statistics
T-R-5
Future hardware prediction
T-R-6
56.2 T-R-1 Display hardware / software statistics
This test ended up being too vague due to covering all the information to be showed in the statistical
table without going into details about each category. The test was therefore split into 5 new tests:
T-R-1-1, T-R-1-2, T-R-1-3, T-R-1-4 and T-R-1-5.
Name
Display hardware / software statistics
Requirement ID: A-F-1 and B-F-1
Page 178 of 194
Test ID
T-R-1
Project FHaSS
Test log
2012
Test description:
Test to see if tables are created and contains accurate information about the
different hardware/software stored in the database.
Test date:
Testing method:
Test approach:
.-.-.-.-.-.-.-.-.-.-.-. Tester:
Kim Richard Johansen
Function test, black box
1. Put in the time period for which the statistical data shall be produced
with basis upon.
2. Choose to get to see statistical information for one of the
hardware/software categories; CPU, Graphics Card, RAM, Windows OS,
HDD, or Network download speed.
3. Wait for the web-page containing the information to load.
4. Compare the resulting percentages to the percentages that has been
manually calculated from the test data set.
Test criteria
Database and website is up and running.
Test data set has been made and inserted into database
Expected
results:
The percentages the system produces and displays on the web-page
based on the test data set are similar to those calculated manually.
Test creator:
Sondre Bjerkerud, Sverre C. Thune
Updated by: Kim Richard Johansen
21.12.2011
23.12.2011
Errors:
Outcome
56.3 T-R-3-2 Filter statistics –user interface
This test ended up being unnecessary due to change in the user interface originally planned. Now all
the games and underling servers are always shown on the left side and it is now possible to filter with
more than one game and not only one. The user interface has also been thoroughly tested in test
T-R-3-1.
Name
Filter statistics user interface test
Test ID
T-R-3-2
Requirement ID: A-F-3
Test description: Test is run after T-R-3-1.
Test to see if the user interface for the filter statistics option is working correctly.
Test date:
Testing method:
Test approach:
Check if game server filter is available when a specific Funcom game is
selected and unavailable when a game isn’t selected.
.-.-.-.-.-.-.-.-.-.-.-. Tester:
Kent Brian Dreyer
User interface test, Black box
5. Set all filter options blank/null.
6. Check if game server filter is unavailable.
7. Choose one of the available Funcom games as a filter.
8. Check if game server filter is available.
Test criteria
Database and website is up and running.
Test data set has been made and inserted into database
Expected
results:
Game server filter works as explained in the test description.
Page 179 of 194
Project FHaSS
Test creator:
Errors:
Outcome
Test log
Kim Richard Johansen
2012
9.01.2012
56.4 T-R-5 Display software statistics
This test was to check if the software programs (e.g. Skype, Steam, MSN...) stored on the computer
from a player experiencing a game crash, would show up correctly in the right groups under the
software statistics table. This functionality was not implemented due to other priorities and time and
therefore there were no need for this test to be executed.
Name
Display software statistics
Test ID
T-R-5
Requirement ID: B-F-2
Test description: Test to see if the tables are created and contains the same percentage value as
manually calculated from the test data set about the different software stored in
the database.
Test date:
.-.-.-.-.-.-.-.-.-.-.-. Tester:
Sverre C. Thune
Testing method: Function test, black box
Test approach:
3. Load the web-page containing the software statistics.
4. Compare the calculated percentages to the manually calculated
percentages.
Test criteria
Database and website is up and running.
Test data set has been made and inserted into database
Expected results
The percentages the system produces and displays on the web-page
based on the test data set are similar to those calculated manually.
Test creator:
Sondre Bjerkerud, Sverre C. Thune
Updated by: Kim Richard Johansen
21.12.2011
23.12.2011
Errors:
Outcome
56.5 T-R-6 Future hardware prediction
After discussion with the project manager we decided to not perform this test due to the time it
would take to create the data for the test data set and this being a C requirement. The functionality
is implemented and debug tested locally by the creator to ensure that it works, but it is not
documented.
Name
Future hardware prediction
Test ID
T-R-6
Requirement ID: C-F-1
Test description: Test to see if an extension of requirement A-F-2 works. The extension is to
predict the future trend of hardware usage for the players of Funcom games.
When the chart for requirement A-F-2 is shown it will be possible to toggle the
prediction on and off. The prediction will extend the current lines for hardware
evolution in the chart and predict the future evolution.
Test date:
Testing method:
.-.-.-.-.-.-.-.-.-.-.-. Tester:
Function test, black box
Kim Richard Johansen
Page 180 of 194
Project FHaSS
Test log
2012
Test approach:
6. Put in the amount of time into the future the system is to predict the
hardware evolution for.
7. Load the web-page containing one of the possible charts containing
future hardware prediction.
8. Toggle the chart to display the future hardware prediction chart lines if
toggled off.
9. Check that the hardware evolution prediction lines are proportional.
10. Compare the updated percentages in proximity to the chart to the
manually calculated percentages. This stage corresponds to testing the
last time/point on the chart to the manually calculated percentages for
the whole test data set for the whole time period put in (1).
Test criteria
Database and website is up and running.
Test data set has been made and inserted into database
Expected results
That the hardware evolution prediction lines are proportional.
The percentages the system produces and displays on the web-page
based on the test data set are similar to those calculated manually.
Test creator:
Sondre Bjerkerud, Sverre C. Thune
Updated by: Kim Richard Johansen
21.12.2011
23.12.2011
Errors:
Outcome
57 Verification tests
This is meant as a short summary for each of the verification tests performed during our project
period.
57.1 Code review
Most of the code review work was not documented but instead orally communication between the
project members was used and worked without problems.
57.2 Code compilation
When compiling produced code we removed most of the possibilities for a group member to upload
a code to the source control with issues, but since more than one member could be working on the
same code fileuser related issues still did occur.
57.3 Debugging
Debugging has been done regularly by each group member when developing functionality on the
system. The built in debugger in our IDE Visual Studio was quite powerful and enable us to have a full
overview of the system when we executed the code developed. Debugging has therefore been a big
help when trying to indentify bugs/issues that occurred.
57.4 Strain test
This test ended up being unnecessary due to change in our project requirement. Our system will
parse newly added entries in Funcoms database when theirown parser has parsed the bug
Page 181 of 194
Project FHaSS
Test log
2012
reportssupplied by players. The amount of entries to parse/group in our system is set to only deal
with a fixed amount at a time so therefore the strain test was unnecessary.
57.5 Regression test/Ad hoc test
These tests have been performed by the test manager at regularly intervals to detect issues/bugs on
the system. If something was detected the issue/bug has been added to a list. Group members that
were responsible for theissues/bugs were notified of these bugs and when resolved they were
removed from the list.
57.6 Performance test
Has been done regularly to keep track of loading times for the different web pages of our system and
the time our parser and grouper uses average per workload.
All in all a big help for improving the performance of the code and finding new ways to do the same
task but with a shorter loading time.
Page 182 of 194
Funcom Hardware Statistics System
Project Reflection Document
Project name
Funcom Hardware Statistics System
Client
Funcom N.V.
Date
5/29/2012
Author
All members
Acronym
FHaSS
Sensors & Supervisors
Internal sensor
Olaf Hallan Graven
Internal supervisor
Aurilla AurelieArntzen
External supervisor
Rui M. Monteiro Casais
Group members
............................
Sondre Bjerkerud
............................
Sverre Christoffer Thune
............................
Dag Hem
............................
Kent Brian Dreyer
............................
Kim Richard Johansen
Project FHaSS
Reflection Document
2012
Reflection Document
58 General Document Information
Deliverable nr:
Deliverable type:
Release:
Workpackage:
Responsible:
D8.3.1
Report
Public
W8
All members
58.1 Declaration of intention
The purpose of this document is to reflect on our work during the development period of our
product and present features with intentions as well as what could have been done differently.
58.2 Definitions and Acronyms
FHaSS
JPEG / PNG
nHibernate
.NET
WCF
Funcom Hardware Statistics System
Standardized image file formats
A library for accessing a database
Framework library we use for the system
Windows Communication Foundation
58.3 Document History
Version
1
2
Description
First version created
Updated content, finalized document
Page 184 of 194
Date
22.05.2012
29.05.2012
Project FHaSS
Reflection Document
2012
59 Table of contents
58 General Document Information .................................................................................................. 184
58.1
Declaration of intention ...................................................................................................... 184
58.2
Definitions and Acronyms ................................................................................................... 184
58.3
Document History ............................................................................................................... 184
59 Table of contents ......................................................................................................................... 185
60 Introduction ................................................................................................................................. 187
61 Challenges ................................................................................................................................... 187
61.1
Loading time ........................................................................................................................ 187
61.1.1
Parser........................................................................................................................... 187
61.1.2
Grouper ....................................................................................................................... 187
61.1.3
Further loading time improvements ........................................................................... 188
61.2
61.1.3.1
Single SQL query .................................................................................................. 188
61.1.3.2
Memory cache ..................................................................................................... 188
NHibernate .......................................................................................................................... 189
62 Filter saving ................................................................................................................................. 189
63 Read Data Service ........................................................................................................................ 189
64 Graphs and visual presentation of data ...................................................................................... 190
64.1
HighCharts ........................................................................................................................... 190
64.2
View raw data / view full screen graphs ............................................................................. 191
64.3
X-axis zoom for graphs ........................................................................................................ 191
64.4
Exporting the graphs ........................................................................................................... 191
64.5
Future prediction of hardware in graphs ............................................................................ 191
65 Administration side, full control to the user ............................................................................... 191
66 Reflection..................................................................................................................................... 192
66.1
Requirements capturing ...................................................................................................... 192
66.2
Differences in development and production environments ............................................... 192
66.3
Very large amounts of data ................................................................................................. 192
67 FHaSS extension suggestions ...................................................................................................... 192
67.1
CPU cores groups with range .............................................................................................. 193
67.2
Physical and virtual CPU cores statistics ............................................................................. 193
67.3
Saved filter administration with AJAX ................................................................................. 193
67.4
Graph resolution.................................................................................................................. 193
67.5
Dual page view .................................................................................................................... 194
Page 185 of 194
Project FHaSS
Reflection Document
2012
67.6
Toggle displaying individual charts...................................................................................... 194
67.7
Compare newest event log entry from database to local event log ................................... 194
67.8
Recommended hardware/software to look into/these need attention ............................. 194
Page 186 of 194
Project FHaSS
Reflection Document
2012
60 Introduction
The purpose of this document is to view our work and implementation period in retrospect, giving a
short explanation of the implemented functionalities and features, evaluate what was excluded from
the extensions and go into detail about what could be done differently and explain the workarounds
we had to undergo with to get the FHaSS-system to the usable state it is in now.
61 Challenges
61.1 Loading time
When we first had a meeting with the product owner we were told that 2 seconds load time was the
requirement, and that it was a quite feasible time to retrieve the entries from the database. Looking
at this in retrospect we now understand that this wouldn’t be doable, given that there are far beyond
four million entries in the hardware statistics database and that this number will increase each day.
At the start of our project we had huge problems with the loading time, which required us to
constantly try to optimize the database fetching queries and algorithms.
In the first version of the system we handled everything on demand, per request. Everything in this
context means; handling the request from the users web browser, setting up the connection with the
WCF web-service, retrieving the hardware statistics from the database, process and prepare the
data, and return them to the MVC layer for display. This solution gave us very long loading times for
the final web-page displaying the hardware statistics. This was especially true for large time spans
(large amounts of statistics data), and we quickly understood that some of the work that back then
was done per request, had to be done in advance of the actual request instead, to decrease the
overall loading time.
61.1.1 Parser
The second version of the systems backbone layer therefore had a new feature implemented; the
Parser. Some of the work that in the previous version was done in the data processing and
preparation phase had now been moved to another part of the system. Here the work could be done
completely independent and in advance of the users requests. More specifically, the Parsers job is to
improve the accuracy of the hardware information stored. For instance it is the job of the Parser to
retrieve the CPU speed from the original CPU string that is sent by the crashed game clients. Having
the more accurate data retrieved in advance and stored in another database table, one major
operation earlier done per request had been removed.
61.1.2 Grouper
With the wide range of different hardware specifications in terms of memory, CPU frequency,
storage and so forth we needed to group similar hardware in the database, to improve the load time
and how we retrieve and present the data. The new version of the system worked well, and the
loading time improvements were significant, but still they did not match the requirements of
Funcom. After discussion with the Funcom employees we decided to again build more of the work,
which at that point was done per request, into its own part of the system. We called the new part the
Grouper and its job was to work on the data that was the product of the Parser and make them even
more optimized for counting. By using a set of supporting database tables giving the restrictions and
limits for the groups in each hardware category, the Grouper could group every hardware statistics
Page 187 of 194
Project FHaSS
Reflection Document
2012
entry in to their respective group for all the hardware categories. For instance the grouper would
group a hardware statistics entry with a CPU speed of 2300MHz into the CPU speed group that has a
range from 2000 to 2400MHz, and in a highly optimized database table only store the CPU speed
group id. After implementing the Parser and Grouper, the work left to be done per request was
reduced a lot.
61.1.3 Further loading time improvements
The load times decreased even more after the implementation of the new Grouper, but still we were
experiencing way too long loading times. The project team was out of ideas on how to improve the
loading times and we had extensive discussions with the Funcom employees on possible solutions to
this. The Funcom employees came up with several new ideas, two of which has been implemented in
the current version of FHaSS; a single SQL query per hardware category and memory caching.
61.1.3.1 Single SQL query
Up until this point the WCF web-service interacting with the database had done one database query
per hardware category per day. As a result, a lot of queries had to be done for each user request. By
following the test-and-fail procedure the project team managed to put together more sophisticated
SQL queries that retrieved all the information for all days for one hardware category. The load time
improvement the system saw after this enhancement was enormous compared to the amount of
work hours that had been used for the implementation of it.
61.1.3.2 Memory cache
There was a lot of back and forth regarding the load issue, but just needed the users to accept the
fact that we are dealing with a lot of information here, this is a heavy system. So fetching all the
entries in the database ( 4.000.000+ entries ) takes about 40 seconds which is far from the original
requirement, but thinking about it, how often does the users need to view this long term
information? This is a quick analysis system to check on how the latest patches are working out, and
what types of hardware that causes the most significant crashes, that’s why we came up with the
caching solution.
The caching was implemented by fetching every single entry for the last month and storing them in
the program memory as a static variable, and because the entries were fetched using nHibernate it
automatically created objects and groups of that fetch for us. Because the home page uses the last
month by default the users will almost always be using the cached information.
This made our home index pop up almost instantly, given the fact that this is also the most relevant
information to analyze this was a great solution to our load time issues. The drawback is that the
cache needs to be built the first time the system starts up and the first time a user uses the page for
the first time in a day to let the cache refresh itself, this should take as much time as a normal
database fetch (as if a user wanted information about a time period that goes back more than one
month).
We also considered using a thread that would do this at the turn of a day, but that could cause issues
with the web client which is a singleton, meaning there’s only one instance of the client at any given
time. If several processes would try to access this simultaneously there could be problems.
Workarounds for this problem could obviously been developed, but this was implemented in one of
Page 188 of 194
Project FHaSS
Reflection Document
2012
the later periods of the project so we didn’t have the resources or time to implement this potential
improvement.
61.2 NHibernate
NHibernate is an object-relational mapper for the .NET framework and it was a requirement from
Funcom to use this software for the systems database interaction. In essence NHibernate has been a
big blunder to the project team. NHibernate was very stubborn, hard to work with and far from
intuitive, and we had to make many workarounds to make this work. All the project members had
previous experience with writing SQL database queries and handling the results of such. The
transition to writing, reading, and thinking in the way of NHibernate Criteria Queries was nothing but
painful. And so was the adaptation of having to write out the mapping database-table-to-object
mapping XML documents. A stream of errors that felt endless, was hard to debug and even harder to
fix, was awaiting the project members when we started out on the development phase of the
project.
62 Filter saving
To save some time on inputting commonly used filter combinations, we created default saved filters
for The Secret world, Age of Conan and a filter combination of both games. Aswell as access to these
filters, the user can also save their own combinations of filter parameters for a quicker and easier
hardware monitoring experience. The filters are saved on the database so that they will show up for
all users accessing the system. This was implemented purely for the reason that we want this to be a
quick-to-use system where the users can get specified information in no time.
In addition to this we wanted to implement a “dual-view” functionality e.g. to view a crash
comparison of ”The Secret World” and “The Age of Conan: Hyborian Adventure”. This was a low
priority extension however so sadly this did not get implemented the way we wanted, but the filter
save functionality will somewhat fill the dual view’s place and give them the specified information
needed.
63 Read Data Service
Our system uses two WCF services in order to separate two largely different information services,
where one handles everything related to administration of the system (the AdminService) while the
other has the sole role of delivering the actual statistical data (the ReadDataService).
The ReadDataService uses (just as the AdminService) the nHibernate API to fetch and insert
information to and from the database which has caused some issues during development. The main
issue with nHibernate was a lack of experience from our side and the lack of documentation that
came with nHibernate; this mainly caused minor problems where we were unsure about how we
should use nHibernate to get the correct information back as simple as possible. nHibernate also
caused some larger issues when we were unsure about how it worked and even what we could use it
for (this is explained more in-depth elsewhere).
This WCF service slowly changed over the course of the project period due to a number of
optimization efforts and the increasing the demand for more and more statistical information, this
Page 189 of 194
Project FHaSS
Reflection Document
2012
way it has become a part that has been completely rewritten and gone through numerous iterations
since we first created it in the beginning of the project.
The ReadDataService had to evolve to supply more and more data using less and less time, and is
solely used to fetch, sort, count and group statistical information. It contains the following
functionality (when fetching information it always accounts for the filtered options such as universes,
country and time span):
Fetching/Sorting/Counting/Grouping information for every hardware part from the database
Fetching/Sorting/Counting/Grouping information for a single hardware part from the
database
Fetching information for a month and storing this in a cache
Sorting/Counting/Grouping information for every hardware part from the cache
Sorting/Counting/Grouping information for a single hardware part from the cache
Estimate future values for a set of data
64 Graphs and visual presentation of data
64.1 HighCharts
For creating the visual graphs we were recommended to use a JavaScript API called HighCharts.
This API contains a lot of different functionalities and has a lot of customization options available to
generate whichever graph necessary for displaying the relevant information. Our graphs are of the
type “Stacked Percent Area” which was a request from the product owner. This type of graph
displays the percentage of entries for a hardware part based on the other hardware parts entries.
We started out with having a fixed resolution of 12 x-axis points, where we printed out the date from
and date to, summarizing the entries between the intervals as the y-axis value.
As we improved the fetching of data from the database we wanted the graphs to yield more precise
information, thus we made an x-axis point for each single day of the filter period. Although this yields
better information over short periods of time (1 – 4 months) it gets a bit overpopulated when they
request data spanning over vast time periods. However, the visual information given by the graphs
are not particularly affected by this.
If the user requests a date in the future, a mathematical formula will calculate the predicted entries
based on the past entries. We didn’t get time to implement a way to indicate the transition to a
future date in the graphs, since there was a problem extracting the point positions after the graph
was rendered. A fix for this is possible, but alas we did not have the time to fully implement this since
other known issues had a higher priority.
The tooltip also has a minor problem where it won’t show the dates if the x-point is an empty string,
this is solely because HighCharts require that the series data and the x-axis categories (arrays) are of
same length, so we had to print empty strings in order not to overlap the dates printed below the
graphs.
In the end the graphs turned out quite nicely after a bit of trouble getting it dynamic and finely tuned
to fit into the rest of the design and layout of the FHaSS-system
Page 190 of 194
Project FHaSS
Reflection Document
2012
64.2 View raw data / view full screen graphs
Above the graphs there are two links which opens in a new browser tabs. The linked views contains
raw graph data, showing all the entries in a HTML table for each date. The other link extends the
desired graph in to a full screen window for in depth analysis. To store the filter information for use
in a new View we store the settings in Session variables. These variables timeouts and resets after 20
min of inactivity, but can be increased in binding options. We experimented putting this information
as cookies, but were deemed useless as the Session variables work better, keeping the time out in
mind. These functionalities were a request from the product owner, but prior to this already noted as
an extension task.
64.3 X-axis zoom for graphs
The graphs support zooming by clicking and dragging the mouse over the desired period. This works
in the Home index as well as in the full screen extension. We experimented with making this zoom
compatible for both X- and Y-axis but since the graphs are of the type “stacked Percent” graph zoom
for the Y-axis would be irrelevant as the data must be compared to the other hardware entries, thus
we did not include the y-axis zoom functionality.
64.4 Exporting the graphs
In the top right corner of the graphs we implemented a functionality to export the graphs to an
image file ( PNG / JPEG ) as well as support for exporting it to a PDF-file. This was a feature
implemented by us if the graphs are to be used in a presentation or similar.
64.5 Future prediction of hardware in graphs
We wanted to give the users the possibility to apply future dates to the filter menu, so instead of
giving them some sort of an error or warning, we calculate the predicted trend pattern of the
hardware parts with the use of linear regression based on previous entries, giving the developers an
idea of what the coming days or months might bring in terms of hardware crashes. It has to be noted
that the hardware info table will not get populated with this information, since this cannot be
monitored in a day-to-day sense, and we do not want the table to yield any ‘false’ information
regarding the crash statistics. This functionality was requested by the product owner, so we
implemented it, but it should be used with care by the users since the entries are in a way just fictive
predictions.
65 Administration side, full control to the user
In this section the users of the system can modify the structure of the database without the need to
manually inject database queries, as well as start and stop the grouper and parser. This section was
created to make the system modifiable and dynamic for future use. If there are hardware changes in
the market or Funcom releases new titles, entries can be added, deleted, mapped and modified
whilst making the parser and grouper aware of these changes. We managed to make the interface
self-explanatory and intuitive yet expansive. Changes in this section however might require reparsing
and regrouping of the database structure which can be time consuming for the back-end of the
system. For this reason we display warnings before any changes are applied. The users should be
aware of this and the administration section should not be used to frequent as it is designed for
larger changes in the system.
Page 191 of 194
Project FHaSS
Reflection Document
2012
We feel that we have covered every necessary option in this section, the Funcom employees has not
raised any additional requests to this part. There was problems getting all of this completely
debugged but as of now, none are reported.
66 Reflection
Looking back at the last months (of the development period) it is easy to see what mistakes the
project team has done and what could have been done differently.
66.1 Requirements capturing
In the startup of the project the team should have put more time into understanding exactly what
way and to what purpose the FHaSS was going to be used. A better understanding of this would have
saved us very much time. On the other side we would have had to put in more time in the pre-face of
the project, and probably much more time in a pre-face design period, which is not according to how
the Scrum project model suggests the project workflow.
66.2 Differences in development and production environments
Ever since the first attempt to deploy the FHaSS in the Funcom offices in Oslo the differences
between the project team’s software development environment and Funcoms production
environment has been prominent. A lot of thought and work hours have been put into solving
problems that only occurred in the production environment throughout the latest half of the project
development period.
We could probably have been able to become better known with the environment differences had
we been able to spend more time in the Funcom offices in Oslo. However, this was not easy to
accomplish both due to time and economy.
66.3 Very large amounts of data
The raw hardware statistics database table that Funcom was already using for their previous
hardware statistics system had over four (4) million entries. With the help of the Funcom employees
we quickly got a dump of this table downloaded to our server to test our system against. However,
testing for instance the parser and grouper (discussed in section …) against such a large number of
database table entries takes a lot of time. We are talking up to several days to complete such a
process. As a result, the testing and debugging of the system in the development period has mainly
been done on a subset of the original database table. While this gave us the opportunity to test more
frequently and efficiently, it introduced another potential area of issues; the stability and endurance
of the backbone of the system. We now see that this area was not tested as frequently and thorough
as it probably should have, and as well there should have been created one or several tests in the
test specification for testing this area specifically.
67 FHaSS extension suggestions
In the following will several ideas to extension features that either the project team has thought of
themselves or that Funcom gave as feedback after the first successful deploy of the system, be
discussed and given proposals to design solutions of.
Page 192 of 194
Project FHaSS
Reflection Document
2012
67.1 CPU cores groups with range
The grouper is currently grouping hardware statistics entries for the CPU cores hardware category
based on groups representing distinct number of cores values (for instance four (4) cores). Say in five
years, the computer hardware market will have changed much, and the CPU evolution trend of more
and more CPU cores onto a single CPU chip will most probably just continue. Using FHaSS, Funcom
will then have to have one CPU cores group for each possible CPU cores number, while it is at this
point probably more informative to get statistics for how many CPUs there are in this and this range
of number of CPU cores (like FHaSS has for CPU speed for instance). The current system does not
take this into account because it is not a demand of the current computer hardware market. A
“range” solution would both work with the current market situation and an eventual future situation
like explained above.
67.2 Physical and virtual CPU cores statistics
On the client side of their MMORPG games Funcom is using the DirectX Diagnostic (DxDiag) tool that
comes with Windows to retrieve hardware statistics to return to their hardware statistics server. One
of the problems with this approach is that the DxDiag tool does not take into account whether or not
the amount of CPU cores that Windows is working on are physical cores on the CPU chip or just
virtual cores. As a result, the statistics that FHaSS is producing about CPU number of cores is a
merged statistics of both physical and virtual number of cores.
A possible solution for giving correct statistics in this context is to rewrite the hardware information
gathering software to gather the CPU number of cores information from the msinfo32 system
information tool instead of the DxDiag tool.
67.3 Saved filter administration with AJAX
Currently the saved filter administration functionality has got its own page in FHaSS. This
functionality could potentially have been put in the administration section, but since all the
functionality in the administration section controlled the backend part of the system it felt wrong to
put frontend administration functionality like this in the same section. The functionality could also
have been implemented into the Filter Menu on the Home page, but due to the Home page having to
reload between each new HTTP request (which a deletion of a saved filter would produce) the user
would get very bad loading times for a simple operation (having to wait for all the hardware statistics
to load once more).
The solution that the project team has come up with to remove the need for the single Saved Filters
administration page is to implement the administration functionality into the Filter Menu like
explained above, by using AJAX. By using AJAX the web-browser can send HTTP requests without
having to reload the page, and thereby good response times could be kept up while at the same time
offering a good user interface to the Funcom employees.
67.4 Graph resolution
The graphs on the Home page of the web-page interface of FHaSS is currently displaying one data
point for each day for each of the top six (6) groups of the hardware category. If the user choose to
get statistics from the last year for instance (by using the Time Period Filter) the charts would display
365 * 6 = more than 2000 data points, which is quite a lot. Given that the charts are displayed side by
side the amount of space they’ve got for displaying their data is limited, and with many data points
Page 193 of 194
Project FHaSS
Reflection Document
2012
the charts are looking very spiky. The charts could potentially be more informative if the chart
resolution (number of data points) was either static, variable and calculated based on the charts
available space, or given by the user. With some more fixing in the backend of FHaSS such a solution
could potentially also improve the loading times for the Home page.
67.5 Dual page view
Feedback from the Funcom employees said that it was wanted that the FHaSS web-page interface
should be capable of displaying two or several pages of hardware statistics without having to reload
the page. Such functionality would make it easier for the user to compare statistics calculated based
on two or more different filter selections in the Filter Menu.
67.6 Toggle displaying individual charts
How the system works today is that all categories displayed in the statistical table have their own
chart showing information. These charts will be created as long as the amount of days in the time
span chosen is under 600 days.
An option to choose which charts to be created could be added to reduce the loading time of the
statistical page or to just show the relevant ones and use less space.
67.7 Compare newest event log entry from database to local event log
How the parser, grouper and distinct updater of the system works today if an exception was to
happen is that an event log about the exception is written to the database and to a local file where
the windows service is stored. If the database connection is down (still after 4 retries) the event log
will only be written to the local event log and another log saying could not log event to database.
Today there is no functionality to check if the local file has newer log entries than the database. This
could be implemented so the user could be given a message of this when viewing the event log on
the parser interface page under administration without having to check this manually.
67.8 Recommended hardware/software to look into/these need attention
The group has come up with an extension of the system that could be helpful for Funcom employees
using the FHaSS system. Another list could be added to the statistical table showing the most
frequent hardware/software found in the database. This could identify the source of most recent
crashes. This extension should also have the possibility to remove entries in the list if the
hardware/software is not the cause of the bug but is just often used in computers that experience
crashes or that the specific hardware/software issue has been resolved.
Page 194 of 194