1
TDT4290 - Customer Driven Project
Norwegian Public Road Administration
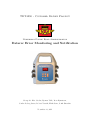
Datarec Error Monitoring and Notification
Group 10: Kato Stølen, Bjørnar Valle, Roar Bjurstrøm,
Sondre Løberg Sæter, Robert Versvik, Eirik Stene, Sonik Shrestha
November 23, 2011
Abstract
The Norwegian Public Road Administration (NPRA) is the public agency responsible for
the public road network and security in Norway. They have numerous road-side installations that perform vehicle counting and statistics. These road-side installations stores
data that can be accessed through various interfaces. Currently the NPRA has a manual
and labour-intensive method of collecting and processing this data. As it is now, it can
take up to several months before the information gathered can be of any use. This is
due to the fact that the road-side installations do not notify anyone of hardware errors,
forcing the NPRA to manually check if the data is usable.
The NPRA has asked for a proof-of-concept system that automatically detects and stores
hardware errors that may corrupt the statistics gathered by the road-side installations.
Through the course TDT4290 - Customer Driven Project, they have asked student group
10 to create this solution. This meant that we would take on the role of consultants, and
the NPRA would be the customer.
This report is the documentation of the development process. It describes the process
from preliminary study and planning through implementation to the project evaluation.
The report consists of chapters describing these phases in detail, given in an intuitive
order.
To solve the problem we developed a SOAP based service that continuously requests
the status of the installations and pushes any changes to an error handler. This service
was to be placed on a computer connected to the road-side equipment. The error handler
checks the received statuses for errors or irregularities and stores them in a database.
In addition to this, a web service and a web page was created. The web service acts as
the access point to the information stored in the database, and the web page shows the
statuses of the road-side equipment in a list, and the errors are shown on a map with a
location marker.
For a future system, we recommend using a push-based protocol. Even though it is
more complex than a pull-based protocol, it will make the system real-time at minimum
bandwidth costs by only pushing when there are any changes. The Datex II v2.0 standard
seems to be a good choice as it aims at traffic management and road-side data gathering,
and supports both pushing and pulling of data.
As for further use of the traffic data, we suggest, among other things, making it available for emergency transport, helping them calculate the most efficient route to their
destination.
Contents
I
Introduction
1 Project Directive
1.1 Project Name . . . . . . . .
1.2 Original Project Description
1.3 Project Goal . . . . . . . . .
1.4 Involved Parties . . . . . . .
1.5 The Customer . . . . . . . .
1.6 Project Background . . . . .
1.7 Duration . . . . . . . . . . .
1
.
.
.
.
.
.
.
.
.
.
.
.
.
.
.
.
.
.
.
.
.
.
.
.
.
.
.
.
.
.
.
.
.
.
.
.
.
.
.
.
.
.
.
.
.
.
.
.
.
.
.
.
.
.
.
.
2 Planning
2.1 Phases . . . . . . . . . . . . . . . . . . . .
2.1.1 Planning Phase . . . . . . . . . . .
2.1.2 Preliminary Study . . . . . . . . .
2.1.3 Implementation . . . . . . . . . . .
2.1.4 Report Writing . . . . . . . . . . .
2.1.5 Effort Estimation and Registration
2.2 Risk Management . . . . . . . . . . . . . .
2.2.1 Risk Assessment . . . . . . . . . .
2.3 Project Organization . . . . . . . . . . . .
2.3.1 Roles . . . . . . . . . . . . . . . . .
2.3.2 Weekly Schedule . . . . . . . . . .
2.4 Planning for Quality Assurance . . . . . .
2.4.1 Internal Routines . . . . . . . . . .
2.4.2 Meetings . . . . . . . . . . . . . . .
2.4.3 Templates . . . . . . . . . . . . . .
2.4.4 File and Document Management .
2.4.5 Task Reviewing and Inspection . .
2.4.6 Customer Interaction . . . . . . . .
2.4.7 Advisor Interaction . . . . . . . . .
3 Preliminary Study
3.1 Problem and Solution Space
3.1.1 Original Situation . .
3.1.2 System Expansion .
3.1.3 Solution Space . . .
3.1.4 Existing Solutions . .
3.2 Field Excursion . . . . . . .
3.2.1 Extra Excursion . . .
.
.
.
.
.
.
.
.
.
.
.
.
.
.
.
.
.
.
.
.
.
.
.
.
.
.
.
.
i
.
.
.
.
.
.
.
.
.
.
.
.
.
.
.
.
.
.
.
.
.
.
.
.
.
.
.
.
.
.
.
.
.
.
.
.
.
.
.
.
.
.
.
.
.
.
.
.
.
.
.
.
.
.
.
.
.
.
.
.
.
.
.
.
.
.
.
.
.
.
.
.
.
.
.
.
.
.
.
.
.
.
.
.
.
.
.
.
.
.
.
.
.
.
.
.
.
.
.
.
.
.
.
.
.
.
.
.
.
.
.
.
.
.
.
.
.
.
.
.
.
.
.
.
.
.
.
.
.
.
.
.
.
.
.
.
.
.
.
.
.
.
.
.
.
.
.
.
.
.
.
.
.
.
.
.
.
.
.
.
.
.
.
.
.
.
.
.
.
.
.
.
.
.
.
.
.
.
.
.
.
.
.
.
.
.
.
.
.
.
.
.
.
.
.
.
.
.
.
.
.
.
.
.
.
.
.
.
.
.
.
.
.
.
.
.
.
.
.
.
.
.
.
.
.
.
.
.
.
.
.
.
.
.
.
.
.
.
.
.
.
.
.
.
.
.
.
.
.
.
.
.
.
.
.
.
.
.
.
.
.
.
.
.
.
.
.
.
.
.
.
.
.
.
.
.
.
.
.
.
.
.
.
.
.
.
.
.
.
.
.
.
.
.
.
.
.
.
.
.
.
.
.
.
.
.
.
.
.
.
.
.
.
.
.
.
.
.
.
.
.
.
.
.
.
.
.
.
.
.
.
.
.
.
.
.
.
.
.
.
.
.
.
.
.
.
.
.
.
.
.
.
.
.
.
.
.
.
.
.
.
.
.
.
.
.
.
.
.
.
.
.
.
.
.
.
.
.
.
.
.
.
.
.
.
.
.
.
.
.
.
.
.
.
.
.
.
.
.
.
.
.
.
.
.
.
.
.
.
.
.
.
.
.
.
.
.
.
.
.
.
.
.
.
.
.
.
.
.
.
.
.
.
.
.
.
.
.
.
.
.
.
.
.
.
.
.
.
.
.
.
.
.
.
.
.
.
.
.
.
.
.
.
.
.
.
.
.
.
.
.
.
.
.
.
.
.
.
.
.
.
.
.
.
.
.
.
.
.
.
.
.
.
.
.
.
.
.
.
.
.
.
.
.
.
.
.
.
.
.
.
.
.
.
.
.
.
.
.
.
.
.
.
.
.
.
.
.
.
.
.
.
.
.
.
.
.
.
.
.
.
.
.
.
.
.
.
.
.
.
.
.
.
.
.
.
.
.
.
.
.
.
.
2
2
2
3
3
4
4
5
.
.
.
.
.
.
.
.
.
.
.
.
.
.
.
.
.
.
.
6
6
6
6
7
7
7
8
8
9
10
12
12
13
13
13
14
14
15
15
.
.
.
.
.
.
.
16
16
16
17
19
22
22
25
3.3
3.4
3.5
3.6
3.7
3.8
3.9
Testing . . . . . . . . . . . . . . . . . . . . . .
3.3.1 Test Methods Used During the Project
The Hardware . . . . . . . . . . . . . . . . . .
3.4.1 Datarec 7 . . . . . . . . . . . . . . . .
3.4.2 Induction Loops . . . . . . . . . . . . .
Technologies Used During the Project Period .
Coding Conventions . . . . . . . . . . . . . . .
3.6.1 Naming Conventions . . . . . . . . . .
Software Qualities . . . . . . . . . . . . . . . .
Development Method . . . . . . . . . . . . . .
3.8.1 Scrum . . . . . . . . . . . . . . . . . .
3.8.2 Waterfall . . . . . . . . . . . . . . . . .
Conclusion Based on Preliminary Study . . .
3.9.1 Table Properties . . . . . . . . . . . .
3.9.2 Product Backlog Table . . . . . . . . .
3.9.3 Choice of Development Method . . . .
.
.
.
.
.
.
.
.
.
.
.
.
.
.
.
.
.
.
.
.
.
.
.
.
.
.
.
.
.
.
.
.
4 Requirements Specification
4.1 Table Properties . . . . . . . . . . . . . . . . . .
4.2 Functional Requirements . . . . . . . . . . . . . .
4.2.1 High Priority Functional Requirements . .
4.2.2 Medium Priority Functional Requirements
4.2.3 Low Priority Functional Requirements . .
4.3 Non-Functional Requirements . . . . . . . . . . .
4.4 Quality Assurance and Requirement Specification
II
.
.
.
.
.
.
.
.
.
.
.
.
.
.
.
.
.
.
.
.
.
.
.
.
.
.
.
.
.
.
.
.
.
.
.
.
.
.
.
.
.
.
.
.
.
.
.
.
.
.
.
.
.
.
.
.
.
.
.
.
.
.
.
.
.
.
.
.
.
.
.
.
.
.
.
.
.
.
.
.
.
.
.
.
.
.
.
.
.
.
.
.
.
.
.
.
.
.
.
.
.
.
.
.
.
.
.
.
.
.
.
.
.
.
.
.
.
.
.
.
.
.
.
.
.
.
.
.
.
.
.
.
.
.
.
.
.
.
.
.
.
.
.
.
.
.
.
.
.
.
.
.
.
.
.
.
.
.
.
.
.
.
.
.
.
.
.
.
.
.
.
.
.
.
.
.
.
.
.
.
.
.
.
.
.
.
.
.
.
.
.
.
.
.
.
.
.
.
.
.
.
.
.
.
.
.
.
.
.
.
.
.
.
.
.
.
.
.
.
.
.
.
.
.
.
.
.
.
.
.
.
.
.
.
.
.
.
.
.
.
.
.
.
.
.
.
.
.
.
.
.
.
.
.
.
.
.
.
.
.
.
.
.
.
.
.
.
.
.
.
.
.
.
.
.
.
.
.
.
.
.
.
.
.
.
.
.
.
.
.
.
.
26
26
27
27
29
29
36
37
37
39
39
41
43
43
44
44
.
.
.
.
.
.
.
46
46
46
46
47
48
48
49
Sprints and Implementation
5 Sprint Planning
5.1 Sprint Phases . . . . . . . . . . . . . .
5.2 Quality Assurance . . . . . . . . . . .
5.2.1 Milestones . . . . . . . . . . . .
5.3 Product Backlog . . . . . . . . . . . .
5.3.1 Table . . . . . . . . . . . . . . .
5.3.2 Sprint 1 . . . . . . . . . . . . .
5.3.3 Sprint 2 . . . . . . . . . . . . .
5.3.4 Sprint 3 . . . . . . . . . . . . .
5.4 Test Plan . . . . . . . . . . . . . . . .
5.4.1 The Testing Procedures . . . .
5.4.2 Overall Schedule of the Testing
6 Sprint 1
50
.
.
.
.
.
.
.
.
.
.
.
.
.
.
.
.
.
.
.
.
.
.
.
.
.
.
.
.
.
.
.
.
.
.
.
.
.
.
.
.
.
.
.
.
.
.
.
.
.
.
.
.
.
.
.
.
.
.
.
.
.
.
.
.
.
.
.
.
.
.
.
.
.
.
.
.
.
.
.
.
.
.
.
.
.
.
.
.
.
.
.
.
.
.
.
.
.
.
.
.
.
.
.
.
.
.
.
.
.
.
.
.
.
.
.
.
.
.
.
.
.
.
.
.
.
.
.
.
.
.
.
.
.
.
.
.
.
.
.
.
.
.
.
.
.
.
.
.
.
.
.
.
.
.
.
.
.
.
.
.
.
.
.
.
.
.
.
.
.
.
.
.
.
.
.
.
.
.
.
.
.
.
.
.
.
.
.
.
.
.
.
.
.
.
.
.
.
.
.
.
.
.
.
.
.
.
.
.
.
51
51
52
52
55
55
56
57
57
58
58
59
61
6.1
6.2
6.3
6.4
6.5
6.6
6.7
Sprint 1: Sprint Goals . . . . . . . . . . . . . . . .
Sprint 1: Sprint Backlog . . . . . . . . . . . . . . .
6.2.1 Sprint 1 Backlog Table . . . . . . . . . . . .
6.2.2 Comments on the Sprint 1 Backlog . . . . .
Sprint 1: Main Deliverables . . . . . . . . . . . . .
Sprint 1: Design and Implementation . . . . . . . .
6.4.1 Datarec 7 SOAP Client . . . . . . . . . . . .
6.4.2 Datarec Database . . . . . . . . . . . . . . .
6.4.3 Web Service . . . . . . . . . . . . . . . . . .
6.4.4 Web Page . . . . . . . . . . . . . . . . . . .
6.4.5 Error Handler . . . . . . . . . . . . . . . . .
Sprint 1: Testing . . . . . . . . . . . . . . . . . . .
6.5.1 Web Page . . . . . . . . . . . . . . . . . . .
6.5.2 Web Service . . . . . . . . . . . . . . . . . .
6.5.3 Database . . . . . . . . . . . . . . . . . . .
6.5.4 Datarec 7 SOAP Client . . . . . . . . . . . .
6.5.5 Testing the Integration of the Database, the
Web Page . . . . . . . . . . . . . . . . . . .
Sprint 1: Review . . . . . . . . . . . . . . . . . . .
6.6.1 Sprint 1: Positive Experiences . . . . . . . .
6.6.2 Sprint 1: Negative Experiences . . . . . . .
6.6.3 Sprint 1: Planned Actions . . . . . . . . . .
Sprint 1: Feedback . . . . . . . . . . . . . . . . . .
7 Sprint 2
7.1 Sprint
7.2 Sprint
7.2.1
7.2.2
7.3 Sprint
7.4 Sprint
7.4.1
7.4.2
7.5 Sprint
7.5.1
7.6 Sprint
7.6.1
7.6.2
7.6.3
7.7 Sprint
8 Sprint 3
2: Sprint Goals . . . . . . . . . . . . . .
2: Sprint Backlog . . . . . . . . . . . . .
Sprint 2 Backlog Table . . . . . . . . . .
Comments on the Sprint 2 Backlog Table
2: Main Deliverables . . . . . . . . . . .
2: Design and Implementation . . . . . .
ONSITE Server . . . . . . . . . . . . . .
Error Handler . . . . . . . . . . . . . . .
2: Testing . . . . . . . . . . . . . . . . .
Error Handler . . . . . . . . . . . . . . .
2: Review . . . . . . . . . . . . . . . . .
Sprint 2: Positive Experiences . . . . . .
Sprint 2: Negative Experiences . . . . .
Sprint 2: Planned Actions . . . . . . . .
2: Feedback . . . . . . . . . . . . . . . .
.
.
.
.
.
.
.
.
.
.
.
.
.
.
.
.
.
.
.
.
.
.
.
.
.
.
.
.
.
.
. . . . . . . . . . . .
. . . . . . . . . . . .
. . . . . . . . . . . .
. . . . . . . . . . . .
. . . . . . . . . . . .
. . . . . . . . . . . .
. . . . . . . . . . . .
. . . . . . . . . . . .
. . . . . . . . . . . .
. . . . . . . . . . . .
. . . . . . . . . . . .
. . . . . . . . . . . .
. . . . . . . . . . . .
. . . . . . . . . . . .
. . . . . . . . . . . .
. . . . . . . . . . . .
Web Service and the
. . . . . . . . . . . .
. . . . . . . . . . . .
. . . . . . . . . . . .
. . . . . . . . . . . .
. . . . . . . . . . . .
. . . . . . . . . . . .
.
.
.
.
.
.
.
.
.
.
.
.
.
.
.
.
.
.
.
.
.
.
.
.
.
.
.
.
.
.
.
.
.
.
.
.
.
.
.
.
.
.
.
.
.
.
.
.
.
.
.
.
.
.
.
.
.
.
.
.
.
.
.
.
.
.
.
.
.
.
.
.
.
.
.
.
.
.
.
.
.
.
.
.
.
.
.
.
.
.
.
.
.
.
.
.
.
.
.
.
.
.
.
.
.
.
.
.
.
.
.
.
.
.
.
.
.
.
.
.
.
.
.
.
.
.
.
.
.
.
.
.
.
.
.
.
.
.
.
.
.
.
.
.
.
.
.
.
.
.
.
.
.
.
.
.
.
.
.
.
.
.
.
.
.
.
.
.
.
.
.
.
.
.
.
.
.
.
.
.
61
61
61
63
63
65
65
65
65
66
67
68
68
69
70
71
71
72
73
73
74
74
76
76
76
76
77
77
78
78
78
79
79
80
81
82
82
83
84
8.1
8.2
8.3
8.4
8.5
8.6
8.7
Sprint
Sprint
8.2.1
8.2.2
Sprint
Sprint
Sprint
8.5.1
8.5.2
Sprint
8.6.1
8.6.2
8.6.3
Sprint
3: Goals . . . . . . . . . . . . . . . . . .
3: Sprint Backlog . . . . . . . . . . . . .
Sprint 3 Backlog Table . . . . . . . . . .
Comments on the Sprint 3 Backlog Table
3: Main Deliverables . . . . . . . . . . .
3: Design and Implementation . . . . . .
3: Testing . . . . . . . . . . . . . . . . .
ONSITE Server . . . . . . . . . . . . . .
Complete System Test . . . . . . . . . .
3: Review . . . . . . . . . . . . . . . . .
Sprint 3: Positive Experiences . . . . . .
Sprint 3: Negative Experiences . . . . .
Sprint 3: Planned Actions . . . . . . . .
3: Feedback . . . . . . . . . . . . . . . .
9 User Guide
9.1 ONSITE Server . .
9.1.1 Installation
9.1.2 Usage . . .
9.2 Error Handler . . .
9.2.1 Installation
9.2.2 Usage . . .
9.3 Web Service . . . .
9.3.1 Installation
9.3.2 Usage . . .
9.4 Web Page . . . . .
9.4.1 Installation
9.4.2 Usage of the
. . .
. . .
. . .
. . .
. . .
. . .
. . .
. . .
. . .
. . .
. . .
Web
. . .
. . .
. . .
. . .
. . .
. . .
. . .
. . .
. . .
. . .
. . .
Page
.
.
.
.
.
.
.
.
.
.
.
.
.
.
.
.
.
.
.
.
.
.
.
.
10 Discussion of the Implementation
10.1 ONSITE Server . . . . . . . . . .
10.1.1 Rationale . . . . . . . . .
10.1.2 Details of the Protocol . .
10.1.3 Discussion . . . . . . . . .
10.2 Error Handler . . . . . . . . . . .
10.3 Web Service . . . . . . . . . . . .
10.4 Web Page . . . . . . . . . . . . .
10.4.1 Exception Handling . . . .
10.4.2 Improvements . . . . . . .
.
.
.
.
.
.
.
.
.
.
.
.
.
.
.
.
.
.
.
.
.
.
.
.
.
.
.
.
.
.
.
.
.
.
.
.
.
.
.
.
.
.
.
.
.
.
.
.
.
.
.
.
.
.
.
.
.
.
.
.
.
.
.
.
.
.
.
.
.
.
.
.
.
.
.
.
.
.
.
.
.
.
.
.
.
.
.
.
.
.
.
.
.
.
.
.
.
.
.
.
.
.
.
.
.
.
.
.
.
.
.
.
.
.
.
.
.
.
.
.
.
.
.
.
.
.
.
.
.
.
.
.
.
.
.
.
.
.
.
.
.
.
.
.
.
.
.
.
.
.
.
.
.
.
.
.
.
.
.
.
.
.
.
.
.
.
.
.
.
.
.
.
.
.
.
.
.
.
.
.
.
.
.
.
.
.
.
.
.
.
.
.
.
.
.
.
.
.
.
.
.
.
.
.
.
.
.
.
.
.
.
.
.
.
.
.
.
.
.
.
.
.
.
.
.
.
.
.
.
.
.
.
.
.
.
.
.
.
.
.
.
.
.
.
.
.
.
.
.
.
.
.
.
.
.
.
.
.
.
.
.
.
.
.
.
.
.
.
.
.
.
.
.
.
.
.
.
.
.
.
.
.
.
.
.
.
.
.
.
.
.
.
.
.
.
.
.
.
.
.
.
.
.
.
.
.
.
.
.
.
.
.
.
.
.
.
.
.
.
.
.
.
.
.
.
.
.
.
.
.
.
.
.
.
.
.
.
.
.
.
.
.
.
.
.
.
.
.
.
.
.
.
.
.
.
.
.
.
.
.
.
.
.
.
.
.
.
.
.
.
.
.
.
.
.
.
.
.
.
.
.
.
.
.
.
.
.
.
.
.
.
.
.
.
.
.
.
.
.
.
.
.
.
.
.
.
.
.
.
.
.
.
.
.
.
.
.
.
.
.
.
.
.
.
.
.
.
.
.
.
.
.
.
.
.
.
.
.
.
.
.
.
.
.
.
.
.
.
.
.
.
.
.
.
.
.
.
.
.
.
.
.
.
.
.
.
.
.
.
.
.
.
.
.
.
.
.
.
.
.
.
.
.
.
.
.
.
.
.
.
.
.
.
.
.
.
.
.
.
.
.
.
.
.
.
.
.
.
.
.
.
.
.
.
.
.
.
.
.
.
.
.
.
.
.
.
.
.
.
.
.
.
.
.
.
.
.
.
.
.
.
.
.
.
.
.
.
.
.
.
.
.
.
.
.
.
.
.
.
.
.
.
.
.
.
.
.
.
.
.
.
.
.
.
.
.
.
.
.
.
.
.
.
.
.
.
.
.
.
.
.
.
.
.
.
.
.
.
.
.
.
.
.
.
.
.
.
.
.
.
.
.
.
.
.
.
.
.
.
.
.
.
.
.
.
.
.
.
.
.
.
.
.
.
.
.
.
84
84
84
85
85
86
86
86
87
87
88
89
90
90
.
.
.
.
.
.
.
.
.
.
.
.
91
91
91
92
92
92
94
96
96
97
97
97
98
.
.
.
.
.
.
.
.
.
101
101
101
101
102
104
105
105
105
105
III
In Retrospect
107
11 Project Evaluation
11.1 Cultural Differences between the Students
11.2 Becoming a Team . . . . . . . . . . . . . .
11.3 Inefficiency and Internal Information Flow
11.4 Contact with the Customer . . . . . . . .
11.5 Utilizing the Advisor . . . . . . . . . . . .
11.6 Risks that Became Problems . . . . . . . .
11.7 Changes in Requirements . . . . . . . . . .
11.8 Initial Backlog . . . . . . . . . . . . . . . .
IV
.
.
.
.
.
.
.
.
.
.
.
.
.
.
.
.
.
.
.
.
.
.
.
.
.
.
.
.
.
.
.
.
.
.
.
.
.
.
.
.
.
.
.
.
.
.
.
.
.
.
.
.
.
.
.
.
.
.
.
.
.
.
.
.
.
.
.
.
.
.
.
.
.
.
.
.
.
.
.
.
.
.
.
.
.
.
.
.
.
.
.
.
.
.
.
.
.
.
.
.
.
.
.
.
.
.
.
.
.
.
.
.
.
.
.
.
.
.
.
.
.
.
.
.
.
.
.
.
.
.
.
.
.
.
.
.
Appendices
A Appendix: Testing
A.1 Display Unit Information . .
A.2 Display State Logs for Units
A.3 Map Service . . . . . . . . .
A.4 Web Service . . . . . . . . .
A.5 Datarec Database . . . . . .
A.6 Datarec 7 SOAP Client . . .
A.7 Error Handler . . . . . . . .
A.8 ONSITE Server . . . . . . .
108
108
108
109
110
110
110
112
112
113
.
.
.
.
.
.
.
.
.
.
.
.
.
.
.
.
.
.
.
.
.
.
.
.
.
.
.
.
.
.
.
.
.
.
.
.
.
.
.
.
.
.
.
.
.
.
.
.
B Appendix: Templates
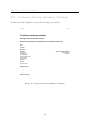
B.1 Advisory Meeting Summary Template
B.2 Customer Meeting Summary Template
B.3 Meeting Agenda Template . . . . . . .
B.4 Status Report Template . . . . . . . .
B.5 Work Sheet Template . . . . . . . . . .
B.6 Test Table Template . . . . . . . . . .
.
.
.
.
.
.
.
.
.
.
.
.
.
.
.
.
.
.
.
.
.
.
.
.
.
.
.
.
.
.
.
.
.
.
.
.
.
.
.
.
.
.
.
.
.
.
.
.
.
.
.
.
.
.
.
.
C Appendix: Initial Requirement Specification
C.1 Functional Requirements . . . . . . . . . . . .
C.2 Non-Functional Requirements . . . . . . . . .
C.3 Changes in Requirement Specification . . . . .
C.4 Inital Product Backlog . . . . . . . . . . . . .
.
.
.
.
.
.
.
.
.
.
.
.
.
.
.
.
.
.
.
.
.
.
.
.
.
.
.
.
.
.
.
.
.
.
.
.
.
.
.
.
.
.
.
.
.
.
.
.
.
.
.
.
.
.
.
.
.
.
.
.
.
.
.
.
.
.
.
.
.
.
.
.
.
.
.
.
.
.
.
.
.
.
.
.
.
.
.
.
.
.
.
.
.
.
.
.
.
.
.
.
.
.
.
.
.
.
.
.
.
.
.
.
.
.
.
.
.
.
.
.
.
.
.
.
.
.
.
.
.
.
.
.
.
.
.
.
.
.
.
.
.
.
.
.
.
.
.
.
.
.
.
.
.
.
.
.
.
.
.
.
.
.
.
.
.
.
.
.
.
.
.
.
.
.
.
.
.
.
.
.
.
.
.
.
.
.
.
.
.
.
.
.
.
.
.
.
.
.
.
.
.
.
.
.
.
.
.
.
.
.
.
.
.
.
.
.
.
.
.
.
.
.
.
.
.
.
.
.
.
.
.
.
.
.
.
.
.
.
.
.
.
.
.
.
.
.
.
.
.
.
.
.
.
.
.
.
.
.
.
.
114
114
114
115
115
117
118
119
121
.
.
.
.
.
.
123
123
123
125
126
127
127
.
.
.
.
128
128
130
130
132
D Appendix: Design
133
D.1 Common Library . . . . . . . . . . . . . . . . . . . . . . . . . . . . . . . 134
D.2 Web Page . . . . . . . . . . . . . . . . . . . . . . . . . . . . . . . . . . . 135
D.3 Web Service . . . . . . . . . . . . . . . . . . . . . . . . . . . . . . . . . . 136
D.4 Error Handler . . . .
D.4.1 Initial Design
D.4.2 Final Design .
D.5 Database . . . . . . .
D.6 ONSITE server . . .
.
.
.
.
.
.
.
.
.
.
.
.
.
.
.
.
.
.
.
.
.
.
.
.
.
.
.
.
.
.
.
.
.
.
.
.
.
.
.
.
.
.
.
.
.
.
.
.
.
.
E Appendix: Further Use of Traffic Data
.
.
.
.
.
.
.
.
.
.
.
.
.
.
.
.
.
.
.
.
.
.
.
.
.
.
.
.
.
.
.
.
.
.
.
.
.
.
.
.
.
.
.
.
.
.
.
.
.
.
.
.
.
.
.
.
.
.
.
.
.
.
.
.
.
.
.
.
.
.
.
.
.
.
.
.
.
.
.
.
.
.
.
.
.
.
.
.
.
.
.
.
.
.
.
140
140
141
147
148
150
List of Tables
2.1
2.2
2.3
2.4
Effort Registration Table
Risk Assessment . . . . .
Project Roles . . . . . .
Weekly Meetings . . . .
.
.
.
.
.
.
.
.
.
.
.
.
.
.
.
.
.
.
.
.
.
.
.
.
.
.
.
.
.
.
.
.
.
.
.
.
.
.
.
.
.
.
.
.
.
.
.
.
.
.
.
.
.
.
.
.
.
.
.
.
.
.
.
.
.
.
.
.
.
.
.
.
.
.
.
.
.
.
.
.
.
.
.
.
.
.
.
.
.
.
.
.
.
.
.
.
.
.
.
.
.
.
.
.
.
.
.
.
7
9
11
12
3.1
3.2
3.3
3.4
3.5
3.6
3.7
3.8
3.9
Datarec 7 . . . . . . .
ONSITE Server . . . .
Error Handler . . . . .
Datarec Database . . .
Web Service . . . . . .
Web Page . . . . . . .
Technical Information
Technical Tools Matrix
Product Backlog . . .
.
.
.
.
.
.
.
.
.
.
.
.
.
.
.
.
.
.
.
.
.
.
.
.
.
.
.
.
.
.
.
.
.
.
.
.
.
.
.
.
.
.
.
.
.
.
.
.
.
.
.
.
.
.
.
.
.
.
.
.
.
.
.
.
.
.
.
.
.
.
.
.
.
.
.
.
.
.
.
.
.
.
.
.
.
.
.
.
.
.
.
.
.
.
.
.
.
.
.
.
.
.
.
.
.
.
.
.
.
.
.
.
.
.
.
.
.
.
.
.
.
.
.
.
.
.
.
.
.
.
.
.
.
.
.
.
.
.
.
.
.
.
.
.
.
.
.
.
.
.
.
.
.
.
.
.
.
.
.
.
.
.
.
.
.
.
.
.
.
.
.
.
.
.
.
.
.
.
.
.
.
.
.
.
.
.
.
.
.
.
.
.
.
.
.
.
.
.
.
.
.
.
.
.
.
.
.
.
.
.
.
.
.
.
.
.
.
.
.
.
.
.
.
.
.
.
.
.
.
.
.
.
.
.
.
.
.
.
.
.
.
.
.
18
18
18
19
19
19
28
35
44
4.1
4.2
4.3
4.4
4.5
High Priority Functional Requirements . . . . . . . . . . . . . .
Medium Priority Functional Requirements . . . . . . . . . . . .
Low Priority Functional Requirements . . . . . . . . . . . . . .
Non-Functional Requirements . . . . . . . . . . . . . . . . . . .
Mapping Non-Functional Requirement with Software Attributes
.
.
.
.
.
.
.
.
.
.
.
.
.
.
.
.
.
.
.
.
.
.
.
.
.
47
48
48
49
49
5.1
5.2
5.3
5.4
5.5
5.6
5.7
5.8
5.9
Task, Duration and Dependencies . . . . . . . . . . . . .
Milestone Table - Preliminary Study and Planning (M1)
Milestone Table - Sprint 1 (M2) . . . . . . . . . . . . . .
Milestone Table - Sprint 2 (M3) . . . . . . . . . . . . . .
Milestone Table - Sprint 3 (M4) . . . . . . . . . . . . . .
Milestone Table - Report (M5) . . . . . . . . . . . . . . .
Milestone Tentation (M6) . . . . . . . . . . . . . . . . .
Product Backlog . . . . . . . . . . . . . . . . . . . . . .
Test Overview . . . . . . . . . . . . . . . . . . . . . . . .
.
.
.
.
.
.
.
.
.
.
.
.
.
.
.
.
.
.
.
.
.
.
.
.
.
.
.
.
.
.
.
.
.
.
.
.
.
.
.
.
.
.
.
.
.
.
.
.
.
.
.
.
.
.
.
.
.
.
.
.
.
.
.
.
.
.
.
.
.
.
.
.
.
.
.
.
.
.
.
.
.
52
53
54
54
54
54
55
56
59
6.1
6.2
6.3
6.4
6.5
6.6
6.7
6.8
Sprint 1 Backlog . . . . . . . . . . . . . . . . . . .
High Priority Functional Requirements Sprint 1 . .
Medium Priority Functional Requirements Sprint 1
Tests Performed on the Web Page . . . . . . . . . .
Web Page Test Cases . . . . . . . . . . . . . . . . .
Web Service Test Cases . . . . . . . . . . . . . . . .
Database Test Cases . . . . . . . . . . . . . . . . .
Datarec 7 SOAP Client Test Cases . . . . . . . . .
.
.
.
.
.
.
.
.
.
.
.
.
.
.
.
.
.
.
.
.
.
.
.
.
.
.
.
.
.
.
.
.
.
.
.
.
.
.
.
.
.
.
.
.
.
.
.
.
.
.
.
.
.
.
.
.
.
.
.
.
.
.
.
.
.
.
.
.
.
.
.
.
63
64
64
68
69
70
71
71
7.1
7.2
Sprint 2 Backlog . . . . . . . . . . . . . . . . . . . . . . . . . . . . . . .
Functional Requirements Sprint 2 . . . . . . . . . . . . . . . . . . . . . .
77
78
.
.
.
.
.
.
.
.
.
vii
.
.
.
.
.
.
.
.
.
.
.
.
.
.
.
.
.
.
.
.
.
.
.
.
7.3
Error Handler Test Cases . . . . . . . . . . . . . . . . . . . . . . . . . . .
80
8.1
8.2
8.3
Sprint 3 Backlog . . . . . . . . . . . . . . . . . . . . . . . . . . . . . . .
Functional Requirements for the ONSITE Server . . . . . . . . . . . . . .
ONSITE Server Test Cases . . . . . . . . . . . . . . . . . . . . . . . . . .
85
86
86
B.1 Template for Functionality Tests . . . . . . . . . . . . . . . . . . . . . . .
127
C.1
C.2
C.3
C.4
C.5
129
129
129
130
132
High Priority Functional Requirements . .
Medium Priority Functional Requirements
Low Priority Functional Requirements . .
Non-Functional Requirements . . . . . . .
Product Backlog . . . . . . . . . . . . . .
.
.
.
.
.
.
.
.
.
.
.
.
.
.
.
.
.
.
.
.
.
.
.
.
.
.
.
.
.
.
.
.
.
.
.
.
.
.
.
.
.
.
.
.
.
.
.
.
.
.
.
.
.
.
.
.
.
.
.
.
.
.
.
.
.
.
.
.
.
.
.
.
.
.
.
.
.
.
.
.
.
.
.
.
.
List of Figures
2.1
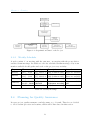
2.2
Gantt-Chart Diagram . . . . . . . . . . . . . . . . . . . . . . . . . . . . .
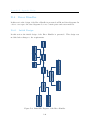
Organization Chart for the Project . . . . . . . . . . . . . . . . . . . . .
6
12
3.1
3.2
3.3
3.4
3.5
3.6
3.7
3.8
3.9
3.10
3.11
3.12
3.13
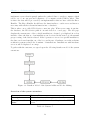
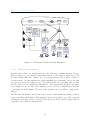
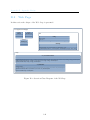
Original System at the NPRA . . . . . . . . . . . . . . .
Dataflow Model of the System Additions We Are Making
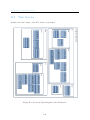
Data Flow: Error Handler and ONSITE Server . . . . .
Data Flow: Web Service . . . . . . . . . . . . . . . . . .
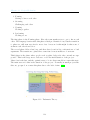
The Future System with Our Extensions . . . . . . . . .
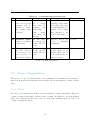
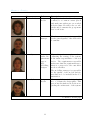
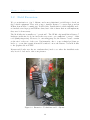
Excursion - Technicians and Jo Skjermo . . . . . . . . .
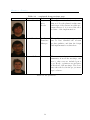
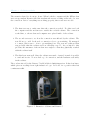
Excursion - Cabinet and Datarec 7 . . . . . . . . . . . .
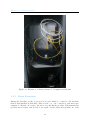
Excursion - Cabinet, Datarec 7, Computer and Modem .
Black Box Testing . . . . . . . . . . . . . . . . . . . . . .
Datarec 7 Signature . . . . . . . . . . . . . . . . . . . . .
Datarec - Induction Loops . . . . . . . . . . . . . . . . .
Scrum Model . . . . . . . . . . . . . . . . . . . . . . . .
Waterfall Model . . . . . . . . . . . . . . . . . . . . . . .
.
.
.
.
.
.
.
.
.
.
.
.
.
16
18
20
21
21
23
24
25
26
28
29
41
43
5.1
5.2
Gantt-Chart Diagram Describing the Sprints . . . . . . . . . . . . . . . .
Activity Network Chart . . . . . . . . . . . . . . . . . . . . . . . . . . .
51
53
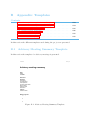
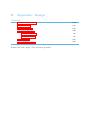
6.1
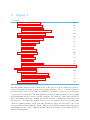
Sprint 1 Burndown Chart . . . . . . . . . . . . . . . . . . . . . . . . . .
73
7.1
Sprint 2 Burndown Chart . . . . . . . . . . . . . . . . . . . . . . . . . .
81
8.1
Sprint 3 Burndown Chart . . . . . . . . . . . . . . . . . . . . . . . . . .
88
9.1
9.2
9.3
9.4
9.5
9.6
9.7
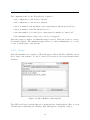
Error Handler - Subscriptions . . . . . .
Error Handler - Add Subscription . . . .
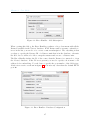
Error Handler - Database Configuration
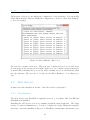
Error Handler - Error Log . . . . . . . .
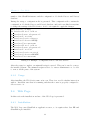
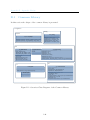
Web Page - Front Page . . . . . . . . . .
Web Page - Display Unit Status . . . . .
Web Page - Display State Logs . . . . .
123
124
125
126
127
ix
.
.
.
.
.
.
.
.
.
.
.
.
.
.
.
.
.
.
.
.
.
.
.
.
.
.
.
.
.
.
.
.
.
.
.
.
.
.
.
.
.
.
.
.
.
.
.
.
.
.
.
.
.
.
.
.
.
.
.
.
.
.
.
.
.
.
.
.
.
.
.
.
.
.
.
.
.
.
.
.
.
.
.
.
.
.
.
.
.
.
.
.
.
.
.
.
.
.
.
.
.
.
.
.
.
.
.
.
.
.
.
.
.
.
.
.
.
.
.
.
.
.
.
.
.
.
B.1
B.2
B.3
B.4
B.5
.
.
.
.
.
.
.
.
.
.
.
.
.
.
.
.
.
.
.
.
.
.
.
.
.
109
.
.
.
.
.
.
.
.
.
.
.
.
.
.
.
.
.
.
.
.
.
.
.
.
.
11.1 Tuckman’s Theory . . . . . . . . . . . . . . . . . . . . . . . . . . . . . .
.
.
.
.
.
.
.
.
.
.
.
.
.
.
.
.
.
.
.
.
.
.
.
.
.
101
101
.
.
.
.
.
.
.
.
.
.
.
.
.
.
.
.
.
.
.
.
.
.
.
.
.
10.1 Flow Chart . . . . . . . . . . . . . . . . . . . . . . . . . . . . . . . . . .
10.2 ONSITE Server in the System . . . . . . . . . . . . . . . . . . . . . . . .
.
.
.
.
.
.
.
.
.
.
.
.
.
.
.
.
.
.
.
.
.
.
.
.
.
94
94
95
96
98
99
100
.
.
.
.
.
.
.
.
.
.
.
.
.
.
.
.
.
.
.
.
.
.
.
.
.
.
.
.
.
.
.
.
Advisory Meeting Summary Template
Customer Meeting Summary Template
Meeting Agenda Template . . . . . . .
Status Report Template . . . . . . . .
Work Sheet Template . . . . . . . . . .
.
.
.
.
.
.
.
.
.
.
.
.
.
.
.
.
.
.
.
.
.
.
.
.
.
.
.
.
.
.
.
.
.
.
.
.
.
.
.
.
.
.
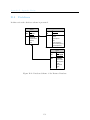
D.1 Overview Class Diagram of the Common Library .
D.2 Overview Class Diagram of the WebPage . . . . . .
D.3 Overview Class Diagram of the WebService . . . . .
D.4 Class Diagram: no.vegvesen.webservice.bal . . . . .
D.5 Class Diagram: no.vegvesen.webservice.dal . . . . .
D.6 Class Diagram: no.vegvesen.webservice.soap . . . .
D.7 Class Diagram: no.vegvesen.webservice.dr . . . . .
D.8 Class Diagram: no.vegvesen.webservice.nt . . . . .
D.9 Initial ER diagram of the Error Handler . . . . . .
D.10 ER Diagram of the ErrorHandlerService . . . . . .
D.11 Overview Class Diagram of the Error Handler . . .
D.12 Class Diagram: no.vegvesen.errorhandler . . . . . .
D.13 Class Diagram: no.vegvesen.errorhandler.dal . . . .
D.14 Class Diagram: no.vegvesen.errorhandler.dr.db . . .
D.15 Class Diagram: no.vegvesen.errorhandler.service.dal
D.16 Class Diagram: no.vegvesen.errorhandler.errorcheck
D.17 Class Diagram: no.vegvesen.errorhandler.net . . . .
D.18 Class Diagram: no.vegvesen.errorhandler.nt.dal . .
D.19 Class Diagram: no.vegvesen.errorhandler.nt.db . . .
D.20 Class Diagram: no.vegvesen.errorhandler.soap . . .
D.21 Database Scheme of the Datarec Database . . . . .
D.22 Class Diagram of DrRegusterNotificationPusher . .
D.23 Class Diagram of DrRegisterNotifications . . . . . .
.
.
.
.
.
.
.
.
.
.
.
.
.
.
.
.
.
.
.
.
.
.
.
.
.
.
.
.
.
.
.
.
.
.
.
.
.
.
.
.
.
.
.
.
.
.
.
.
.
.
.
.
.
.
.
.
.
.
.
.
.
.
.
.
.
.
.
.
.
.
.
.
.
.
.
.
.
.
.
.
.
.
.
.
.
.
.
.
.
.
.
.
.
.
.
.
.
.
.
.
.
.
.
.
.
.
.
.
.
.
.
.
.
.
.
.
.
.
.
.
.
.
.
.
.
.
.
.
.
.
.
.
.
.
.
.
.
.
.
.
.
.
.
.
.
.
.
.
.
.
.
.
.
.
.
.
.
.
.
.
.
.
.
.
.
.
.
.
.
.
.
.
.
.
.
.
.
.
.
.
.
.
.
.
.
.
.
.
.
.
.
.
.
.
.
.
.
.
.
.
.
.
.
.
.
.
.
.
.
.
.
.
.
.
.
.
.
.
.
.
.
.
.
.
.
.
.
.
.
.
.
.
.
.
.
.
.
.
.
.
.
.
.
.
.
.
.
.
.
.
.
.
.
.
.
.
.
.
.
.
.
.
.
.
.
.
.
.
.
.
.
.
.
.
.
.
134
135
136
137
137
137
138
139
140
141
142
143
143
144
144
145
145
146
146
146
147
148
149
Acronyms and Glossary
API Application Programming Interface - An interface for third party applications, so
that it’s possible to communicate between software.
COTS Commercial of-the-shelf.
DB Database.
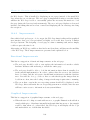
Error An error is when the internal state of the system deviates from the correct service
state. [3]
Failure The inability of the Datarec 7 hardware to perform its required functions.
[3]
Faraday cage An enclosure formed by conducting material that blocks out external
static and non-static electric fields. [32]
Fault A fault is a defect in a hardware device or component, or an incorrect step,
process, or data definition in a computer program. [3]
Gantt Chart A bar chart used for demonstrating project schedules.
HTML Hypertext Markup Language - A standard language for web pages.
HTTP Hypertext Transfer Protocol - A communication protocol that is used for data
transfer between a server and a client.
HTTPS Hypertext Transfer Protocol Secure - A communication protocol used for encrypted data transfer of web pages.
IDE Integrated Development Environment.
ISO International Organization of Standardization.
JAVA EE JAVA Enterprise Edition.
xi
JAVA RMI JAVA Remote Method Invocation.
JDBC JAVA Database Connectivity.
JMS JAVA Message Service.
JSP JAVA Server Pages.
JVM JAVA Virtual Machine.
MIB Management Information Base.
NPRA Norwegian Public Roads Administration (Statens Vegvesen)
PHP PHP, Hypertext Preprocessor.
PMA Post Mortem Analysis - A method used to evaluate a project to find weak and
strong points in the project.
RMON Remote Monitoring - A standard monitoring specification.
SDK Software Development Kit - A set of development tools that help in the creation
of applications.
SNMP Simple Network Management Protocol.
SVN Subversion.
SQL Structured Query Language.
URL Uniform Resource Locator.
XML Extensible Markup Language - A universal and extensible markup language.
Preface
This project report, together with the proof-of-concept prototype, is the deliverable in the
course Customer Driven Project, TDT4290. This course is a subject at the Norwegian
University of Science and Technology, NTNU.
We got an assignment from the Norwegian Public Roads Administration (Statens Vegvesen). The assignment was to create a system that could report errors in real time for
their existing roadside equipment. This system had to be a web application that can
easily be integrated into their existing system.
We would like to thank our supervisor, Reidar Conradi, for his continuous feedback
during the project.
We would also like to thank the customer representatives, Jo Skjermo and Kristin Gryteselv, from the Norwegian Public Roads Administration, for making this possible.
Trondheim, November 23, 2011
Sondre Løberg Sæter
Bjørnar Valle
Kato Stølen
Roar Bjurstrøm
Eirik Stene
Robert Versvik
Sonik Shrestha
xiii
Part I
Introduction
1
Project Directive
Contents
1.1
Project Name . . . . . . . . . . . . . . . . . . . . . . . . . . . .
2
1.2
Original Project Description . . . . . . . . . . . . . . . . . . .
2
1.3
Project Goal . . . . . . . . . . . . . . . . . . . . . . . . . . . .
3
1.4
Involved Parties . . . . . . . . . . . . . . . . . . . . . . . . . .
3
1.5
The Customer . . . . . . . . . . . . . . . . . . . . . . . . . . .
4
1.6
Project Background . . . . . . . . . . . . . . . . . . . . . . . .
4
1.7
Duration . . . . . . . . . . . . . . . . . . . . . . . . . . . . . . .
5
This section will present the purpose of the project, the mandate and the goal.
1.1
Project Name
The title of the project is “Hardware fault monitoring and notification for roadside infrastructure”. It was given by the customer, and it describes in short what will be
created. For more information about the problem and solutions, see Preliminary Study,
section 3.
1.2
Original Project Description
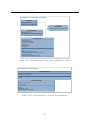
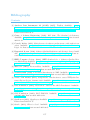
”The Norwegian Public Roads Administration has a large number of installations at the side of the Norwegian road network that performs vehicle registration and counting. The data from these installations is used for multiple
purposes, included deciding on future infrastructure needs.
As of today there is no overall system for detection or notification of hardware
failure at these installations, even if the hardware is able to perform some selfdiagnostic. Because of this the collected data has to undergo a manual and
somewhat labor-intensive process before it can be of further use. With better
notification and logging of errors this process can hopefully be reduced.
Our wish is a design and prototype for a system that gather information on
both hardware (Datarec7 or newer) and data communication state (given from
our telecom provider), and display this information in a clear interface. We
wish for a web-based interface where we can check status, analyze faults and
read out state logs. We also wish to examine if it is possible to automatically
estimate undetected hardware errors from lack of expected vehicle traffic, and
Chapter 1. Project Directive
display this in the interface. Automatic notification of hardware faults to the
correct instances using sms or email could also be considered. Finally, it is
also a wish that the system should be easy to integrate into existing systems
and databases at the Norwegian Public Roads Administration.” [8]
In the original project description the words error, fault and failure are used to denote the
same threat. We have chosen to use different meanings for each word. Their respective
meaning is defined in the glossary.
1.3
Project Goal
For this project the ultimate goal was to deliver a well defined and functional prototype
product which related to the client’s expectations. This report summarizes the handling
and work done and assures that the customer can continue to work on the prototype
delivered and integrate it into the existing system.
We agreed to strive for the best grade possible, and as such it was a major driver in
reaching the project goal.
During the project phase there were plenty of things to learn. Beforehand, we had
expectations to acquire a sense of real life work experience. Other big goals would be
to learn as much as possible about working in teams, documenting a customer project
process, and learning as much as possible about the technical aspects involved in the
development of the software.
In the customer’s current systems, the Datarec 7 hardware has no good way of notifying
maintenance crew about errors. This leads to a high percentage of downtime when
the hardware is of no use. This downtime also lead to loads of extra work, since the
information has to be controlled before it can be used. Our practical goal of the project is
to develop a prototype system for the customer that will drastically lower this percentage
of downtime, by making the Datarec 7 hardware automatically notify maintenance crew
about errors if they occur.
When the NPRA gather the data that is collected by the Datarecs, they can very rarely
use a 100% of it. If they download the data directly from the site, 85-95% of the data
are on average usable. If downloaded form the Traffic6 software though, the percentage
of usable data can go as low as 50%. This is a worryingly low number. Hopefully the
proof-of-concept system that we are developing will improve this number drastically.
3
Chapter 1. Project Directive
1.4
Involved Parties
There are three groups of stakeholders for this project. The customer, the Customer
Driven Project course staff and the project group.
The customer is represented through:
• Jo Skjermo
• Kristin Gryteselv
The course staff, represented through:
• Reidar Conradi
The project group:
• Kato Stølen
• Roar Bjurstrøm
• Bjørnar Valle
• Sondre Løberg Sæter
• Eirik Stene
• Robert Versvik
• Sonik Shrestha
1.5
The Customer
The customer that represented the assignment is The Norwegian Public Roads Administration, a Norwegian government agency. Being one of the largest agencies in Norway,
they are responsible for the planning, construction and operation of the national road
network, vehicle inspection and vehicle requirements, driver training and licensing. Before the founding of The Norwegian Public Roads Administration, Justisdepartementet
had the responsibility of public roads in Norway. [16]
In 1864, The Directorate of Public Roads were established and Norway got their first
’Vegdirektør’. From 1885 to 1944 it was placed under The Ministry of Labour, and has
since been a subordinate of The Ministry of Transport.
Jo Skjermo and Kristin Gryteselv represent the Intelligent Transport System and Services (ITS) department of The Norwegian Public Roads Administration. ITS is a common
4
Chapter 1. Project Directive
term for the use of information and communication technology in the transport sector.
Through the use of technology, the ITS department is trying to make a safer transportation system with better passability, accessibility and a better environment. [25]
1.6
Project Background
The Norwegian Public Roads Administration are recording the individual vehicles that
pass certain points on the public roads. To do this, they have installed roadside equipment throughout Norway. Their solution, as of today, records the number of vehicles, as
well as the velocity and the length of the vehicle. The system does not have the ability
to report errors on this equipment. Therefore, the customer came to us with the task to
create a system that runs diagnostics on the system. The system should have the ability
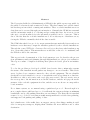
to send notifications if any errors occur. This information should be displayed through a
web service.
The web service shows different kinds of error messages. It reports whether there is
a failure, what type of failure it is, what kind of equipment it is and where it is located.
1.7
Duration
The estimated workload per person was 5 hours each day. This gives 25 hours per person
every week in the assigned project period. During the semester, this adds up to 310
hours for each project member. Since our group consisted of seven students, the estimated workload would be 2170 hours for the whole project.
Project Start: 30th of August, 2011.
Project end and presentation: 24th of November, 2011.
5
2
Planning
Contents
2.1
2.2
Phases . . . . . . . . . . . . . . . . . . . . . . . . . . . . . . . .
2.1.1
Planning Phase . . . . . . . . . . . . . . . . . . . . . . . . . . .
6
2.1.2
Preliminary Study . . . . . . . . . . . . . . . . . . . . . . . . .
6
2.1.3
Implementation . . . . . . . . . . . . . . . . . . . . . . . . . . .
7
2.1.4
Report Writing . . . . . . . . . . . . . . . . . . . . . . . . . . .
7
2.1.5
Effort Estimation and Registration . . . . . . . . . . . . . . . .
7
Risk Management . . . . . . . . . . . . . . . . . . . . . . . . .
2.2.1
2.3
2.4
6
Risk Assessment . . . . . . . . . . . . . . . . . . . . . . . . . .
Project Organization . . . . . . . . . . . . . . . . . . . . . . .
8
8
9
2.3.1
Roles
. . . . . . . . . . . . . . . . . . . . . . . . . . . . . . . .
10
2.3.2
Weekly Schedule . . . . . . . . . . . . . . . . . . . . . . . . . .
12
Planning for Quality Assurance . . . . . . . . . . . . . . . . .
12
2.4.1
Internal Routines . . . . . . . . . . . . . . . . . . . . . . . . . .
13
2.4.2
Meetings . . . . . . . . . . . . . . . . . . . . . . . . . . . . . .
13
2.4.3
Templates . . . . . . . . . . . . . . . . . . . . . . . . . . . . . .
13
2.4.4
File and Document Management . . . . . . . . . . . . . . . . .
14
2.4.5
Task Reviewing and Inspection . . . . . . . . . . . . . . . . . .
14
2.4.6
Customer Interaction
. . . . . . . . . . . . . . . . . . . . . . .
15
2.4.7
Advisor Interaction . . . . . . . . . . . . . . . . . . . . . . . . .
15
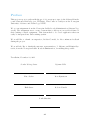
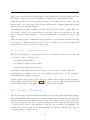
This section is dedicated to the planning of the project. It describes the organization,
scheduling and risk management of the project.
2.1
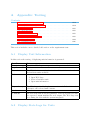
Phases
To get a better overview of the project, we divided the process into phases. The first
two phases are spent on planning and preliminary study, while the remaining phase is
an implementation phase. The planning of this phase is covered in section 5.1. A report
phase for evaluation was also added, since writing the report is a continuous process
throughout the project and consumes a lot of time. The phases are shown in the Gantt
chart below.
Chapter 2. Planning
Figure 2.1: Gantt-Chart Diagram
2.1.1
Planning Phase
Organizing the process is an essential part of the project. A thorough plan will help us
to get off to a good start and keep up the momentum. It is also important to identify
risks and create strategies to avoid or minimize the impact of them.
2.1.2
Preliminary Study
The preliminary study phase is dedicated to getting a good understanding of the problem
at hand, and identifying the existing solutions. By getting a good overview of both the
problem and the solution space, the probability of making a satisfiable system increases
significantly. The result of the preliminary study will be a choice of life cycle model and
a prioritized list of requirements.
2.1.3
Implementation
The implementation phase of our project is the part where the implementation of the
system is carried out. The choice of how to execute this phase is based on the conclusion
of the preliminary study.
2.1.4
Report Writing
Writing the report, meeting summaries and agendas consumes a lot of time, and for this
reason a report phase was created. This phase runs in parallel with the other phases and
stretches from the beginning to the end of the project.
7
Chapter 2. Planning
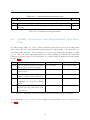
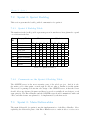
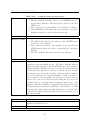
2.1.5
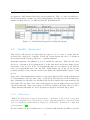
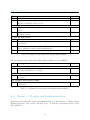
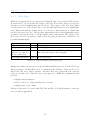
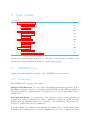
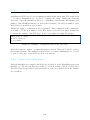
Effort Estimation and Registration
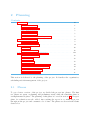
In order to keep record of the progress, a system that shows the actual hours versus the
estimated hours was needed. An easy way to do this is by setting up an effort registration
table. The effort registration table would be updated every week to indicate how many
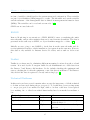
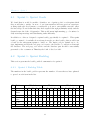
estimated person hours is left of the phase. In the table below ‘E’ notates the estimated
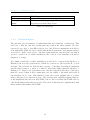
person hours while ‘A’ the actual hours.
Group no: 10
Date: November 23, 2011
Activity / Pe- 35-37 38-40
riod
Planning
E:200 E:0
A:149 A:61
PreStudy
E:200 E:0
A:131 A:50
Implementation
E:475
A:254
Report
E:125 E:50
A:94
A:80
Period sums
E:525 E:525
A:374 A:445
41-42
43-44
E:315
A:203
E:35
A:91
E:350
A:294
E:315
A:220
E:35
A:58
E:350
A:278
45-47
Activity
sums
E:200
A:210
E:200
A:181
E:1105
A:677
E:295 E:540
A:497 A:820
E:295 E:2045
A:497 A:1888
Table 2.1: Effort Registration Table
2.2
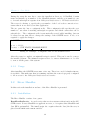
Risk Management
To every project and team there are risks. In this section we will identify, characterize
and assess situations that may occur during the project. The assessment is based on
previous group work experiences.
2.2.1
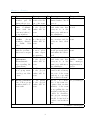
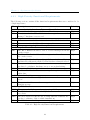
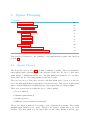
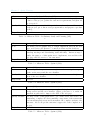
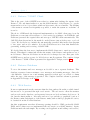
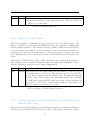
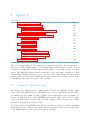
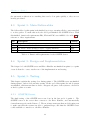
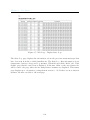
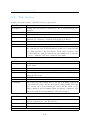
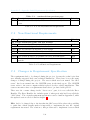
Risk Assessment
To assess the risks we evaluated their potential severity of impact and their probability of
occurrence. The consequences and probability (P) are said to be either low (L), medium
(M) or high (H).
8
Chapter 2. Planning
Id
R1
R2
R3
Case
Illness A group
member gets ill
during the project
Comm.
problems
Communication with the
customer/advisor/group members
Internal
team
conflict
Group
members disagree
or dislike each
other
Lack of experience Project introduces new concepts
Consequences P
M:
Increased M
workload for the
rest of the team
H: The quality M
of the project
results will decrease
Wrong priorities
One or more group
members fails to do
their tasks
L: The quality L
of the project
results will decrease
M: The qual- L
ity of the project
results will decrease
M: The project H
is more prone
to time expensive mistakes
R5 Incorrect
re- H: The quality M
quirements
of the project
Misunderstandresults will deings regarding the crease
requirements
R6 Dropouts One or H: The quality L
more group mem- of the project
bers drop out of the results will decourse
crease
R4
R7
9
Strategy
Reduce - Assign delimited tasks to the ill
person
Avoid - Double check
and make sure that
everyone is on the
same page with meeting summaries
Avoid - Do ice breaking exercises and let
everyone have their
say
Responsible
Project manager
Everyone
volved
in-
Everyone in the
team
Accept - Be thorough Everyone in the
in the pre-study phase team
and utilize the advisor
well
Avoid - Double check Design leader,
and make sure that quality
assureveryone is on the ance manager,
same page with meet- implementation
ing summaries
leader
Accept - Divide the Project manager
extra workload among
the rest of the team
and try to cope with
the reduction in staff
Avoid - If a mem- Project manager
ber of the team recognizes that another
member of the team
is not pulling his own
weight because his priorities lie elsewhere,
the project manager
should be involved in
order to resolve the issue
Continued on next page
Chapter 2. Planning
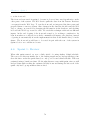
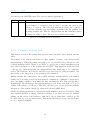
Table 2.2 – continued from previous page
Id Case
Consequences P Strategy
R8 Oversleeping
L: The team M Avoid - Tell the overOne or more group has to waste
sleeping team memmembers fail to their time by
bers that they have
attend a meet- updating
the
to pull themselves toing because they oversleeping
gether. If it continoverslept
team
memues, threaten to inbers after the
volve course staff
meeting
R9 Technical issues M: The qual- L
Accept - Try to get
Failure of technical ity of the project
hold of substitute
components
results will deequipment
crease
R10 Delayed deliver- H: The quality M Accept - Focus the
ies The delivery of the project
team’s efforts on acof necessary tools results will detivities that can be
and resources to crease
done without the dethe team is delayed
layed resources
Responsible
Project manager
Nobody
Nobody
Table 2.2: Risk Assessment
2.3
Project Organization
The success of a project relies heavily on its organization. A structured work and information flow increases productivity and motivates the group members to make a better
effort.
2.3.1
Roles
In order to get a structured work flow, roles are assigned to each group member. Each role
consists of related tasks that together creates a routine. In addition to the resposibilites
that comes with the specific roles, each one of us will contribute where we can, be it
coding or writing the report.
10
Chapter 2. Planning
Person
Sondre L. Sæter
Role
Project
Leader
Description
The project leader should resolve group
conflicts, be a common contact person
and make sure milestones are reached
in desired time. He will be the one who
checks and documents the group members’ work hours.
Eirik Stene
Document
manager
The document manager is responsible
for the general quality of the deliverable
documents.
Roar Bjurstrøm
Test
leader, Requirements
responsible,
Modelling
designer
Kato Stølen
Design
Leader
The making of a test plan and coordinating the testing of the system,
is the main responsibilities of the test
leader. The requirements responsible
makes sure that the requirements specification correspond to the customer’s
needs at all times.
The modelling manager is responsible
for the quality of the models and figures that are to be included in the documentation.
The responsibilities of the design leader
is to coordinate the design phase. This
person has the final say in decisions regarding the architecture of the system.
Continued on next page
11
Chapter 2. Planning
Table 2.3 – continued from previous page
Person
Role
Description
Robert Versvik Implement- The implementation leader makes sure
ation
that we follow the planned architecture
Leader
and design of the system, in addition to
ensure that we do not exceed the allotted time of the implementation.
Sonik Shrestha
Quality
Assurance
Manager
The quality assurance manager makes
sure we have identified the relevant
product qualities, and that the design
and implementation realize these.
Bjørnar Valle
Secretary
The secretary takes notes and writes
summaries from all the meetings, and
sees to that everyone included gets a
copy. He also organizes notes and questions ahead of the meetings. The secretary takes the lead in the project manager’s absence.
Table 2.3: Project Roles
12
Chapter 2. Planning
Kristin Gryteselv
Steering Comitee
Jo Skjermo
Customer Project
Manager
Reference Group
Sondre Løberg Sæter
Project Manager
Bjørnar Valle
Secretary &
Assistant Manager
Sonik Shrestha
QA Manager
Roar Bjurstrøm
Test Leader
Kato Stølen
Design Leader
Robert Versvik
Implementation Leader
Eirik Stene
Document & PR manager
Figure 2.2: Organization Chart for the Project
2.3.2
Weekly Schedule
A week consists of one meeting with the customer, one meeting with the group advisor
and five Scrum meetings. In addition to the five scheduled Scrum meetings, every team
member available should gather and work on the project every weekday.
Day
Monday
Tuesday
Wednesday
Thursday
Friday
Time
10:15 - 10:40
10:15 - 11:00
11:15 - 11:40
10:15 - 10:40
10:15 - 10:40
13:15 - 14:00
10:15 - 10:40
Location
P15, 4th floor
ITV-464
P15, 4th floor
P15, 4th floor
P15, 4th floor
iArbeid
P15, 4th floor
Description
daily Scrum meeting
Advisory meeting
daily Scrum meeting
daily Scrum meeting
daily Scrum meeting
Customer meeting
daily Scrum meeting
Attendees
Everyone available
All
Everyone available
Everyone available
Everyone available
All
Everyone available
Table 2.4: Weekly Meetings
2.4
Planning for Quality Assurance
In every project, quality assurance can help ensure a good result. Therefore we decided
to follow certain processes and routines, which will be introduced in this section.
13
Chapter 2. Planning
2.4.1
Internal Routines
To handle the internal work, we decided on some routines to give a good basis for group
communication and efficient work scheduling. The routines were as follows:
• Daily internal meetings will be used to distribute tasks and update each other on
what have been done since last time. More information can be found in the Meetings
section below.
• Everyone should work Monday to Friday from 10:15 to 15:15. If something prevents
this, the lost hours should be caught up on the spare time. This will ensure that
we get the estimated 25 work hours per person each week.
• To keep in touch with each other while working, Skype will be used as an instant
online messenger.
• E-mail will be used for sending out information for anything particularly important
or out of the ordinary.
• If someone is late, they will be contacted on their mobile phone.
2.4.2
Meetings
• Internal meeting
Every day at 10:15 we should have a short meeting. These meetings will be used
to distribute tasks and update each other on what have been done since last time.
Due to other meetings, we will have different meeting hours when we are to meet
up with our advisor or our customer.
• Advisor meeting
Each week we will have an advisor meeting. This meeting takes place every Tuesday
in room ITV-464 at 10:15. After this meeting we will have our daily internal
meeting.
• Customer meeting
Our customer meetings are usually scheduled for Thursdays. They will for the
most part take place in iArbeid at 13:15. After this meeting we will have our daily
internal meeting for Thursdays.
2.4.3
Templates
For regular documents we produced a set of templates. This was to ensure that they
contained all the necessary information, make it more efficient and to keep a certain
standard. The templates we used were:
14
Chapter 2. Planning
• Status Report
Every week we wrote a status report for our advisor. This was to give him a clearer
view of how the last week had been, describing positive and negative experiences,
and each person’s hours for the respective week. This was delivered to the advisor
together with a full updated version of the report and meeting agenda.
• Meeting Agenda
This was a document containing time and place for the meeting and information
about what should be discussed. Name and phone number of every attendant was
also added.
• Meeting Summary
This document contained the names of attendants, time and place and a summary
of the meeting.
• Worksheets
To keep track of the person hours for each week, we created a spread sheet template
where we could fill in our work hours.
The templates can be found in Appendix B: Templates.
2.4.4
File and Document Management
To ensure safe storage and easy use, we used some tools to handle our files. For our
report we used LaTeX and Dropbox. For our coding and implementation we used Apache
Subversion, and for the templates we used Google Docs. These technical tools will be
described in the Preliminary Study chapter, section 3.5.
2.4.5
Task Reviewing and Inspection
When a person has written a text, it can be quite difficult for him to go back and identify
parts of the text that should have been better. As humans we tend to have a hard time
identifying and acknowledging our own flaws or mistakes. This principle is true for a lot
of things in life. In order to deal with this problem and maintain a high level of quality
throughout our project work, we assigned reviewers to all work tasks that were delegated.
We decided that each piece of work of each group member should be inspected by another
group member. [13]
For each chapter in the report we picked one group member to be responsible for the
overall quality of the chapter. The tasks of the chapter responsibles will be to make
sure that everything is consistent and correct, and in the end to do a final review of the
chapter.
15
Chapter 2. Planning
2.4.6
Customer Interaction
In addition to the meeting, the customer interaction was done either through phone calls
or mail.
• Mail
– Meeting agenda
The day before each meeting, we sent the meeting agenda as an attachment.
– Meeting summary
The meeting summary was sent by mail as soon as it was written.
– Questions
Questions with no immediate need of an answer were sent by mail.
• Phone
– Questions
Questions that needed an immediate answer was taken over the phone.
2.4.7
Advisor Interaction
Our interaction with the advisor was mainly done during the meetings. Other than the
meetings, we had three ways of interaction with our advisor. They were:
• Mail
– Meeting agenda
The day before each meeting, we sent the meeting agenda as an attachment.
– Meeting summary
The meeting summary was sent by mail as soon as it was written.
– Questions
Questions with no immediate need of an answer were sent by mail.
• Visit the Advisor’s Office
During work hours, the advisor was usually at his office if we had any questions.
This option was used for extra reviews of the report, technical advice or other
sensitive questions.
• Phone
Questions that needed an immediate answer was taken over the phone.
16
3
Preliminary Study
Contents
3.1
3.2
Problem and Solution Space . . . . . . . . . . . . . . . . . . .
3.1.1
Original Situation . . . . . . . . . . . . . . . . . . . . . . . . .
16
3.1.2
System Expansion . . . . . . . . . . . . . . . . . . . . . . . . .
17
3.1.3
Solution Space . . . . . . . . . . . . . . . . . . . . . . . . . . .
19
3.1.4
Existing Solutions . . . . . . . . . . . . . . . . . . . . . . . . .
22
Field Excursion . . . . . . . . . . . . . . . . . . . . . . . . . . .
3.2.1
3.3
Extra Excursion . . . . . . . . . . . . . . . . . . . . . . . . . .
Testing . . . . . . . . . . . . . . . . . . . . . . . . . . . . . . . .
3.3.1
3.4
16
Test Methods Used During the Project . . . . . . . . . . . . . .
The Hardware . . . . . . . . . . . . . . . . . . . . . . . . . . .
22
25
26
26
27
3.4.1
Datarec 7 . . . . . . . . . . . . . . . . . . . . . . . . . . . . . .
27
3.4.2
Induction Loops . . . . . . . . . . . . . . . . . . . . . . . . . .
29
3.5
Technologies Used During the Project Period . . . . . . . .
29
3.6
Coding Conventions . . . . . . . . . . . . . . . . . . . . . . . .
36
3.6.1
Naming Conventions . . . . . . . . . . . . . . . . . . . . . . . .
37
3.7
Software Qualities . . . . . . . . . . . . . . . . . . . . . . . . .
37
3.8
Development Method . . . . . . . . . . . . . . . . . . . . . . .
39
3.9
3.8.1
Scrum . . . . . . . . . . . . . . . . . . . . . . . . . . . . . . . .
39
3.8.2
Waterfall . . . . . . . . . . . . . . . . . . . . . . . . . . . . . .
41
Conclusion Based on Preliminary Study . . . . . . . . . . . .
43
3.9.1
Table Properties . . . . . . . . . . . . . . . . . . . . . . . . . .
43
3.9.2
Product Backlog Table . . . . . . . . . . . . . . . . . . . . . . .
44
3.9.3
Choice of Development Method . . . . . . . . . . . . . . . . . .
44
In this chapter we will explicitly describe the problem that we are facing and the possible
solutions. Technologies that will be used during the project will also be presented.
3.1
Problem and Solution Space
In this section the problem and solution space are addressed in form of the current and
desired solution, together with the technological restrictions from the customer.
Chapter 3. Preliminary Study
3.1.1
Original Situation
This is a short description of the situation the NPRA was in when they came to us
with their problem. The original project description from the customer can be found
in section 1.2. The essence of their problem is that the important error messages that
describe failures and/or errors in their system is cumbersome to manually collect from the
“gathering installations”, and that a “lack of overview” over erring hardware is costing
them a lot of data. The hardware can have months of downtime, where it can give bogus
data for a long time before the error is discovered, making the data highly unreliable.
Below is a detailed illustration of their current system.
Services
Real time
information
Registration of
- Equipment
- Measuring station
Configuration of
equipment
Surveillance of
measure stations
Measure station register
and device register
NorTraf Pointdata
Computation
of:
-Point
-Distance
-Indexes
Data collection
Collecting
and quality
assurance of
traffic data
- Point
- Distance
Services historic
data/statistics
Distance data
Traffic & transport
Updating
of road
network
(Traffic
links)
NVDB
Central system
Toll plaza
Ferry data
Transport
models
Updating
of road
refrence
point
ATK
Collecting
and quality
assurance
and
computation
of ferry data
Ferry companies
Figure 3.1: Original System at the NPRA
3.1.2
System Expansion
This section contains a short high level description of the extensions that we are going
to make to their system. Our main objectives are to make the Datarec 7 hardware
automatically send the error messages to their systems so they do not have to manually
collect it, and to send automatic notifications about any errors that should occur.
Our customer asked for a real-time system that continuously checks the data from the
Datarec 7 for errors, because it is important to fix them as soon as possible to avoid
gathering bogus data. Datarec 7 offers an Ethernet connection, which makes the fetching
of real time data much faster. In our development period we will have access to one
roadside counting station, where we will place a server laptop. On this laptop we will
18
Chapter 3. Preliminary Study
implement a server that frequently pushes the gathered data to another computer, which
can be one of our own personal computers, or a computer at the NPRA’s offices. This
is where the data will be processed by an implementation that we have called the Error
Handler. The Error Handler should have the functionality to catch errors and insert a
new entry with all the relevant information into a database.
This is where our so-called Web Service comes into play. When a new entry is put into
the database, the Web Service pulls it out and feeds it to a web page. The web page
displays the current state of the roadside installations. A state log is displayed in a clear
interface. Since the history of an installation can be viewed in the state logs, the manual
pre-processing of the data is reduced. If the logs state no errors for a specific installation,
the data can be used straight out of the box, and in case of hardware errors the real-time
notification system reduces the downtime of installations. Installations with hardware
errors would be displayed on a map.
Together with the customer, we agreed upon the following dataflow model of the system
extensions:
Figure 3.2: Dataflow Model of the System Additions We Are Making
Overview of the system extensions
Actor:
Description:
Examples of
tions:
Datarec 7
Vehicle classifier used to register road traffic
ac- Fetching roadside data and sending it to the ONSITE
server
Table 3.1: Datarec 7
19
Chapter 3. Preliminary Study
Actor:
Description:
Examples of
tions:
ONSITE server
A server placed on-site
ac- Continuously reads the hardware status from Datarec
7’s SOAP interface and notifies if an error occur
Table 3.2: ONSITE Server
Actor
Description:
Examples
tions:
of
Error Handler
An Java-application installed on a server used to handling errors
ac- Create warnings on irregularities and peculiar data,
from Datarec 7
Table 3.3: Error Handler
Actor
Description:
Examples of
tions:
Datarec Database
A SQL database to store statuses and errors
ac- Store the errors fetched by the ONSITE Server
Table 3.4: Datarec Database
Actor
Description:
Examples of
tions:
Web Service
The access point to the system
ac- Access the errors from the database and send coordinates to the Web Page
Table 3.5: Web Service
20
Chapter 3. Preliminary Study
Actor
Description:
Examples of
tions:
Web Page
Displays web pages containing digital assets
ac- The user interface displaying unit state information and
map images from the Map Service
Table 3.6: Web Page
3.1.3
Solution Space
The customer gave us a number of requirements that were taken into consideration. This
was done so that the customer can integrate the solution into their systems. We were
expected to use Java or Java EE for the project, and all data communication should be
done with SOAP XML. In order to fit the student-made system into any existing systems,
we needed to make a web service. Another requirement the customer had, was that if
an error occurred on a roadside installation, the location of the installation should be
displayed on a map.
In a future system the roadside installations would all be connected through fiber or
Ethernet, but in today’s system most of them are connected to the 3G network, or even
modems. The 3G network, with its max capacity of 500 kbps, has limited bandwidth
and the time it takes to connect to a unit is considerably higher than through fiber or
Ethernet. To improve the performance the customer suggested that they could put a
mini-PC on-site, which would continuously read the status of the units and notify if
any hardware errors occur. This mini-PC would run a server pushing data to a client
that would parse it for database storage. The customer had originally requested that we
would implement this server in OPC-XML, but we discovered that OPC-XML did not
offer all the functionality that we needed. The server would instead be implemented with
functionalities that mimics OPC-XML.
21
Chapter 3. Preliminary Study
ONSITE
server
Error Handler
Datarec Database
Nortraf Database
Figure 3.3: Data Flow: Error Handler and ONSITE Server
A laptop PC hosting a server is placed on-site. This server continuously reads the hardware status through the Datarec 7’s SOAP interface and notifies if an error occurs. The
error handler listens for notifications from the on-site server and parses them for database
storage. To give access to the error notifications in the database, a web service needs to
be set up. The web service will be the access point of the system.
Error
Messages
SOAP
Interface
DB
Web Page
Warning
Messages
Datarec Database
Nortraf Database
Figure 3.4: Data Flow: Web Service
The map service will use the web service to display installations with hardware error on
a map.
22
Chapter 3. Preliminary Study
ONSITE
Server
Error
handler
Web
Service
Map
Service
Datarec Database
Services
Real time
information
Registration of
- Equipment
- Measuring station
Configuration of
equipment
Surveillance of
measure stations
Data collection
Measure station register
and device register
Nortraf Pointdata
Computation
of:
-Point
-Distance
-Indexes
Collecting
and quality
assurance of
traffic data
- Point
- Distance
Services historic
data/statistics
Distance data
Traffic & transport
Updating
of road
network
(Traffic
links)
NVDB
Central system
Toll plaza
ATK
Ferry data
Transport
models
Updating
of road
refrence
point
Collecting
and quality
assurance
and
computation
of ferry data
Ferry companies
Figure 3.5: The Future System with Our Extensions
3.1.4
Existing Solutions
Systems such as these are usually tailored to the customer’s existing systems. For the
Datarec, there to be an existing off-the-shelf solution to the entire problem, due to the
fact that NPRA asked us to make a proof-of-consept system. The solution consists of
several systems: one that checks the roadside installations for hardware errors, one that
acts as a web service providing access to the data from the error checking, and one that
uses the web service to display the information. The system that checks for hardware
errors might become obsolete if the hardware vendor decides to implement some kind
of self-diagnosis in the future. The rest of the systems can be modified to support the
changes.
The UK National Traffic Control Centre exposes some of their traffic data using a solution
based on the Datex II standard. Through this solution it is possible to get a list of current
and future roadworks, events, loop-based data and more. Users can also query data for
a specific location they are interested in.
23
Chapter 3. Preliminary Study
3.2
Field Excursion
We got an invitation to join Jo Skjermo and some technicians for a field trip to check out
the roadside equipment. They were going to install a Datarec 7, a server laptop and an
ICE-modem at their ”counting site” in Moholtlia. Usually their roadside installations do
not include server laptops and ICE-modems, but for the software that we will implement,
they were both necessary.
The Moholtlia site is usually not ”operational”. The NPRA only install their Datarec 7
hardware at this site for about four weeks every year to get a sufficient ”coverage” of this
road (Omkjøringsveien). However, for our testing purposes, the Datarec 7 was to remain
at the site for the rest of the year. Unfortunately, due to some technical problems we
had to go on another excursion in mid November to move the Datarec 7 from Moholtlia
to the graphics lab at NTNU.
Bjørnar and Sondre were the two students that joined to see where the installation site
was, how it looked and to take some pictures.
Figure 3.6: Excursion - Technicians and Jo Skjermo
24
Chapter 3. Preliminary Study
The excursion lasted for about two hours. When both the computer and the ICE-modem
were set up, student Bjørnar called the students whom were working at the school to test
the connection. Before everything was working properly, three tests were needed.
1. The first test was to make sure that the connection worked. For this test both
the computer and the modem were outside the roadside cabinet. The connection
worked fine, so the modem and computer were placed inside of the cabinet.
2. The second test was to see how the connection was affected by the cabinet. The
test did not go well. It showed a connection close to non-existing. We managed
to connect, but it was too slow to get anything done. The reason for this problem
was probably that the cabinet acted as a Faraday cage ??. As a solution to this
problem, the antennas of the modem were angled so that they physically touched
with the cabinet itself.
3. The third test went well. Since the cabinet was made of metal, it made it possible
to send and receive. Now we had a good connection, and the hardware was safely
in the cabinet.
The road monitored by the Datarec 7 in Moholtlia is Omkjøringsveien. It has four lanes,
which gives us readings from eight induction loops. It is also in a position that has
continuous traffic.
Figure 3.7: Excursion - Cabinet and Datarec 7
25
Chapter 3. Preliminary Study
Figure 3.8: Excursion - Cabinet, Datarec 7, Computer and Modem
3.2.1
Extra Excursion
During the last three weeks of our project we were unable to connect to the hardware
that we had installed in Moholtlia. After a week or so of no connection, customer representative Jo Skjermo drove up to the site to try and fix the problem. Unfortunately the
problem was not fixed, and we had to try again. Sondre Sæter met up with one of the
26
Chapter 3. Preliminary Study
technicians whom we met at the first excursion, and tried to fix the problem by adjusting
the modem antennas. We did not manage to get a good connection, and decided to bring
the hardware to the graphics lab at NTNU. After we had installed it in the lab, the
connection worked well, and we could finally test our system with errors from the real
Datarec, instead of the mockup.
3.3
Testing
The system needs to be extensively tested before it is delivered to the costumer. The
testing is to ensure the reliability of the software, and to ensure that the software fulfills
the requirements from the costumer.
3.3.1
Test Methods Used During the Project
Black Box Testing
Black box testing is a test method where inputs are
checked to see if they produce a valid output. This testInput
Output
ing method does not look into the internal structure of
Black
the program, but ensures that the external structure is
box
correct. The tester should not be required to have any
knowledge about the internal structure of the program. Figure 3.9: Black Box Testing
For this method to be effective, it is important to select
input at critical areas, such as the edges in the input domain. This method is effective
for testing the system against its requirements.
Test Driven Development
Test driven development (TDD) is a software development process where the developer
makes automated unit tests before writing any actual code. The unit tests are small,
and consist of valid input and output to a part of the program. The input and output
are tested against each other when a test is run. The developer produces the code which
passes the tests, and then starts making new tests and a new cycle starts. One drawback
with the process is that the developer has to write more code, but this process also often
helps the project use less time debugging. The code often is very modularized, since the
developer has to make each part of the program from small independent tests.
27
Chapter 3. Preliminary Study
3.4
The Hardware
As we introduced in chapter one, there are two important pieces of hardware in the
NPRA’s roadside installations. These are the Datarec 7s and the induction loops. The
prototype we are developing in this project is built around them. In this section we are
going to take a closer look at how they work.
3.4.1
Datarec 7
Datarec 7 Signature is the name of the hardware that is used by the NPRA to register
traffic. It both counts vehicles and processes error messages. The traffic registration is
based on an inductive loop technology that utilizes the inductive pattern recognition of a
vehicle’s electronic signature to identify which type of vehicle is driving by. The system
is based on a Windows CE operating system, and has a LAN interface that it can use to
communicate with other devices.
More explicitly, the information that you can gather with the Datarec 7 involves the
volume, velocity, length, occupancy (how much time it takes from the nose of the car
enters the first loop till the very back of the car has left the second loop), time headway
and time gap of the vehicles passing by. This data can be registered for one vehicle, or
for the average value over 5 minutes, 15 minutes or 1 hour.
The Datarec 7 can be accessed through its SOAP interface with a number of requests.
Below is a list which presents the different requests that Datarec 7 responds to, as well
as a short explanation of how we used them.
• LOOP CONNECT is used to check the status of the Datarec 7’s connection to its
loops. If the connection status is not as it should be, an error has to be raised.
• LOOP HITS returns a string with the number of ”loop hits”, meaning how many
vehicles have driven by the inductive loops that the Datarec 7 is connected to.
• LOOP FREQ returns a string with the frequencies of the loops that are connected
to the Datarec 7.
• START returns the start time of the Datarec 7 interface.
• BATTERY returns the battery voltage of the Datarec 7 in mV. This is checked
against a minimum and a maximum value. If the value is outside one of these, a
warning message is sent.
• TEMPERATURE returns the temperature of the Datarec 7 device in degrees Celcius. This is checked against a minimum and a maximum value. If the value is
outside one of these, a warning message is sent.
28
Chapter 3. Preliminary Study
• VEHICLE returns the data of the most recent vehicles detected by the loops. It
can return data for any number of vehicles from 0 up to 10.
• VEHICLE ACC returns accumulated number of vehicles and their mean speed
during a specified time interval.
Figure 3.10: Datarec 7 Signature
Version 4183
Version 4650
Dimensions
Hardware interface
Software interface
Sensors
Temperatures
Power
Current consumption
Environment
Display
Data styles
Data output
8 loops, up to 4 lanes
12 loops, up to 6 lanes
290x220x65mm
Ethernet 10Mbit, RS232
Web server, FTP server, SOAP
8 or 12 inductive loops
Full operation -40C to +85C
9-15V
12V/35mA average
IP65
2 lines, each 8 characters
Interval and/or vehicle by vehicle
Count, time gap and headway, occupancy, length,
vehicle type classification
Table 3.7: Technical Information
29
Chapter 3. Preliminary Study
3.4.2
Induction Loops
The Datarec 7 gets its data from a number of inductive loops which are installed under
the asphalt. For each lane in the road there are two loops, as illustrated below.
Figure 3.11: Datarec - Induction Loops
In addition to counting each vehicle that drives by, these loops also gather data about
velocity and more, as mentioned earlier. They register the times for when a vehicle
passes the first and the second loop, and then simply calculate its speed with the v =
d/t formula.
3.5
Technologies Used During the Project Period
The customer had some restrictions on what technologies we could use. Most of them
were known to us, but not all. In this section the technologies will be presented with a
short description. Some of the technologies turned out to be redundant midways in the
project.
30
Chapter 3. Preliminary Study
Organizational Tools
In this section the tools we used to organize our files used during the project period.
Google Docs
Google Docs is a web-based office suite. It is a free service offered by Google. With
Google Docs it is possible to collaborate on documents in real-time with other users. The
service supports the creation of normal text documents, spreadsheets and presentations.
We started using this because it would allow us to cooperate on documents. We also use
it to write down our work hours in a spreadsheet. [17]
LaTeX
LaTeX is a document markup language, a modern system for annotating a text in a way
that is syntactically distinguishable from that text. It is primarily used to translate XMLbased formats to PDF. LaTeX uses the TeX typesetting program, which is a multiplatform
typesetting system designed by Donald Knuth. Using LaTeX, the user is able to focus
on the content of what they are writing, instead of how it looks, since LaTeX takes care
of the visual presentation of structures like sections, tables, figures, etc. [18]
Dropbox
Dropbox is a Web-based file hosting service provided and operated by Dropbox, Inc. It
uses cloud computing technology which make users able to use file synchronization to
store and share content in repositories across the web. [20]
Subversion
Apache Subversion (SVN) is an open source cross-platform version control system founded
in 2000 by CollabNet, Inc. By using Subversion developers are able to work with current
and previous versions of files, mainly source code, web pages and documentation. Current
release is version 1.6.17, and language used to develop Subversion is C. [21]
Test Tools
31
Chapter 3. Preliminary Study
JUnit
Unit testing is a method of testing software, where a unit is tested by itself against
expected results. A unit in Java tends to be a class or interface. Unit testing helps keep
classes modifiable, facilitating refactoring without breaking the system through regression
testing. Developers are able to simply run the tests to see if their refactoring broke the
class, fixing the new bugs that appeared before committing the new code.
We opted to use the JUnit testing framework for unit testing in Java. It would be used
to test the changes made, and if the system works.
Mockito
”Mocking/Stubbing” is a way to simplify unit testing by making ”fake” versions of classes
that the class being tested depends on. The fake versions has the same interface as the
real thing, but will only return set values instead of doing any logic. This way the unit
being tested is isolated, and only the logic is of the unit under scrutiny. There are quite a
few mocking frameworks for Java that handle the creation of mocked classes, easing the
workload on the users.
We decided to use Mockito as a mocking framework. Mockito made it possible to test
parts of the program before it was finished, and it makes it possible for the program to
make function calls to functions which have not yet been implemented. This functionality
was the reason for our decision to use Mockito.
Technologies Used for Implementing
Java
Java is an object-oriented programming language designed by Sun Microsystems. Java
code compiles to Java byte code, which can be run on the JVM. This makes Java a
platform independent language. Java is used in a wide specter of applications, examples
include web-servers, databases, web-frameworks and more.
Java makes it possible to write a project that can be run on any platform due to the
Java Virtual Machine. This makes it very portable compared to using other languages
like C# that are competing in the same field as Java.
The customer specified Java as the preferred language for this project. Most of us had
previous experience with Java.
32
Chapter 3. Preliminary Study
Java EE is a set of libraries for Java to simplify making fault-tolerant, distributed
and tiered applications based on modular components running on an application server.
The libraries included in Java EE give an API for XML, JDBC, RMI, JMS, e-mail,
web-services, etc. and define how to coordinate between these.[14]
In this project it is applicable due to the libraries that simplifies the making of web
services that use for example SOAP. The SOAP-serving is handled through the JAX-WS
technology.
XML
XML is a markup language which makes it possible to structure data. The documents are
readable by humans due to it being a text instead of binary, but structured in a way that
is easy to read for a computer. The format is well-documented and widely used, ensuring
that most languages have a parser readily available either through the standard library
or through an easy to find download. The structure of the document is also well-suited
for expressing metadata without changing the way the document is parsed.[7]
We used XML mainly because of the requirements from the customer, where it says
that all files use XML to communicate. Some of us had experience with XML beforehand.
GlassFish
GlassFish is an open source application server project, and is intended for the Java EE
platform. The project was initially started by Sun Microsystems, but is now sponsored by
Oracle Corporation, and it is therefore also known as Oracle GlassFish Server. GlassFish
supports all the different Java EE API specifications, like JDBC, RMI, e-mail, JMS, web
services, XML and so on. This allows for creation of a portable and scalable application.
[30]
We used GlassFish because it handles SOAP-calls for us, converting the XML-messages
to a method call, and it is a tried technology. This saves us from having to implement
the XML-SOAP message to method call-logic, which can be error-prone and somewhat
complex, and it saves us from having to debug yet another component.
OpenLayers Library
OpenLayers is a JavaScript library that provides an API for including map services in
a web page. The library has support for many features on the map service. The most
33
Chapter 3. Preliminary Study
important features it offers for our project are support for web map service (WMS), navigation and markers. The OpenLayers API was chosen because it offered all the necessary
functionality that this project needed, and also the API is well documented.[11]
SOAP
Simple Object Access Protocol (SOAP) is a remote procedure call-protocol often used in
web services. It uses XML to communicate between server and client, defining a set of
rules for encoding data-types, procedure calls and responses. The protocol does not define
a method of delivery, but HTTP or SMTP are the two most commonly used.[24]
We were asked to use SOAP by the customer. Since it is the interface used by Datarec 7 to
give continuously status report to the OPC server. Members of the group had experience
with SOAP.
Redundant technologies
These are technologies that we went into the project thinking we would need, but later
discovered that they were redundant.
OPC
OPC is a foundation dedicated to creating open standards for automation - in their
own words: ”OPC is to automation what printer drivers were to Windows.” They have
released several standards for communication between entities.[9] For this project we will
be using OPC-XML Data Access, which was released as 1.0 in 2003. This standard uses
SOAP and XML for communicating back and forth, following a schema defined by the
OPC Foundation.[10]
The reason for using OPC came from the architecture described by the customer. The
Norwegian Road Administration has scheduled an installation of a OPC-server to communicate with Datarec 7, and requested that we would create a ’mock-up’ on a computer
on-site.
OPC was not used after all. This was due to the realization that the standard did not
offer functionality for pushing data, which was a must for this implementation.
SNMP
Simple Network Management Protocol is a protocol for managing devices that is connected to an IP network. The protocol consists of a set of data objects that are exposed
34
Chapter 3. Preliminary Study
in form of variables, which describes the system status and configuration. These variables
are just object identifiers (OIDs) mapped to a value. The information about the variables
and the structure of the management data is defined in management information bases
(MIBs). The variables can be read and set remotely. [22]
SNMP was not used after all.
RMON
Remote Monitoring is an extension to SNMP. RMON focuses on analyzing the unit’s
network traffic, and provides statistics that can be used in network analysis. The data is
presented in the same way as SNMP, as object identifiers mapped to a value. [23]
Initially we were going to use RMON to fetch data from the network traffic and detect irregularities from the roadside installation, by request from the customer. However,
this data is only available for Internet Service Providers, and as such we did not use
it.
Traffic6
Traffic6 is a software used to administer different measuring locations along the road and
terrain. It is used by the Norwegian Public Roads Administration to fetch data from
the Datarec 7 and Datarec 410 hardware. It also includes checking the equipment and
sensors, checking the clock in the equipment, control the data from Datarec 7 and Datarec
410, check if the data is registered correctly and storing logs. [1]
Technical Platforms
In this section we have created a matrix where we rate the importance of all the technical
tools that we have used during the project period. Tools that have been very important
to our project period are marked as high, while tools that could have been replaced
by something else or offered non-critical functionality have been marked as medium or
low.
Technologies
Student chosen software:
Apache Subversion
Importance
Comment
High
Unit testing
High
Coding would have been a nightmare
without this tool
Critical in the test-driven-development
process
Continued on next page
35
Chapter 3. Preliminary Study
Table 3.8 – continued from previous page
Technologies
Importance Comment
Oracle
High
A requirement from the customer
Java (EE)
High
A requirement from the customer
XML
High
An absolute requirement from the customer
SOAP
Medium
The customer preferred that we used
this
LaTeX
Medium
Using another tool would probably only
have impacted aesthetic aspects of the
report
Dropbox
Medium
Other (less practical) tools could have
replaced its functionality
NetBeans
Medium
Offered some nice functionality, but
could have been replaced
GlassFish
Medium
Comes with Java EE
Mockito
Low
Made our lives easier during implementation
MySQL
Low
Used to make our lives easier. Oracle
is used in the final delivery
Google Docs
Low
GDocs made administrating tasks easier
Microsoft Visio 2010
Low
Could have been replaced by another
tool
Gantt Project
Low
Could have been replaced by another
tool
Customer provided software:
Traffic Sp605 for Statens Vegvesen Low
Only important for the Dr410
Windows 7
Low
Having coded in Java, the software is
OS independent
Customer provided hardware:
Datarec 7
High
Performing tests on the Dr7 was absolutely critical for our success
On-site computer
High
Our solution would not have been possible without this
ICE mobile broadband
High
Connecting to the two tools above was
essential
Datarec 410
Low
Outdated,
and therefore downprioritized
Table 3.8: Technical Tools Matrix
36
Chapter 3. Preliminary Study
3.6
Coding Conventions
The system that is to be developed will not be maintained by us, and in order to improve the readability of the source code, we agreed upon some coding conventions. Since
we were required to use Java as programming language a good start would be to use
the coding conventions that comes with it. These coding conventions address many aspects of writing Java code, such as the declaration of classes, interfaces and functions,
the indentation and length of lines and naming conventions. It is common that integrated developer environments, such as NetBeans, encourages the use of the language
specific coding conventions by providing suggestions, indenting new lines automatically
and displaying warnings or errors when using the wrong naming conventions.
package no . v e g v e s e n .< a p p l i c a t i o n >.< l a y e r >;
import j a v a . u t i l . ∗ ;
/∗ ∗
∗ [ Des crip tion of the c l a s s ]
∗/
public c l a s s Example {
/∗ ∗ [ D e s c r i p t i o n o f t h e c o n s t a n t ] ∗/
public s t a t i c f i n a l S t r i n g A CONSTANT = ” c o n s t a n t ” ;
private S t r i n g v a r i a b l e ;
/∗ ∗
∗ [ Des crip tion of the c o n s t r u c t o r ]
∗ @param parameter [ D e s c r i p t i o n o f th e parameter ]
∗/
public Example ( S t r i n g parameter ) {
v a r i a b l e = parameter ;
}
/∗ ∗
∗ [ Des crip tion of the f u n c t i o n ]
∗ @return [ D e s c r i p t i o n o f t h e r e t u r n e d v a l u e ]
∗ @throws E xce pt ion [ D e s c r i p t i o n o f t h e e x c e p t i o n ]
∗/
public S t r i n g f u n c t i o n ( ) throws Ex ce pti on {
return v a r i a b l e ;
}
37
Chapter 3. Preliminary Study
}
Listing 3.1: Coding Conventions Example
3.6.1
Naming Conventions
The readability of the source code is also dependent on the naming conventions used.
Below is a list of naming conventions we will use during this project.
• Packages should use the format: no.vegvesen.<application>.<layer>
• Classes should be nouns with the first letter of each internal word capitalized:
MySqlDatabaseDriver
• Interfaces should follow the same rules as for classes, but beginning with a capital
’I’: IDatabaseConnection
• Methods should be verbs with the first letter lowercase and the first letter of each
internal word capitalized: getUnitStatus
• Variables should have meaningful rather than short names: int upTimeMinutes =
34; (Avoid: int i = (k + m) * width;)
3.7
Software Qualities
A system can have different qualities. Not all of these qualities can be combined fully,
which forces the developers and designers to make trade-offs and choose the most important qualities. The ISO/IEC 9126 gives an overview of the six main qualities, which each
consists of other, more specific qualities.
• Q1 - Functionality
Functionality is the attribute that focuses on giving the customer what he or she
wants. A system is supposed to satisfy the stated and implied needs of the customer,
which can be quite tricky. Functionality consists of the following qualities:
– Q1.1 - Accuracy The delivery of agreed effects or results.
– Q1.2 - Suitability The appropriateness of functions for specified tasks.
– Q1.3 - Interoperability The ability to interact with certain specified systems.
– Q1.4 - Compliance Characterizing the systems adherence to standards, conventions and laws.
38
Chapter 3. Preliminary Study
– Q1.5 - Security The ability to prevent unauthorized access to program or
data.
• Q2 - Reliability
Reliability is the software’s ability to continue working with the expected level
of performance under certain stated conditions and for a certain period of time.
Reliability consists of the following qualities:
– Q2.1 - Maturity The frequency of failure due to software faults.
– Q2.2 - Fault Tolerance The ability to keep a certain level of performance if
there should be a software failure.
– Q2.3 - Recoverability The ability to re-establish normal level of performance
and recover data directly affected by failure.
– Q2.4 - Availability Describes the systems ability to be operational when
needed.
• Q3 - Usability
Usability is the attribute describing the effort needed for use, and how the individual
experiences the usage, for certain stated or implied users. Usability consists of the
following qualities:
– Q3.1 - Understandability The ability describing how logical and applicable
the system is.
– Q3.2 - Learnability The ability describing how easy it is to learn.
– Q3.3 - Operability The ability that describes the effort needed for operation
and operation control of the system.
– Q3.4 - Attractiveness The degree of attractiveness, or likability, of the user
interface.
– Q3.5 - Usability compliance Characterizing the systems adherence to standards, conventions and laws relating to usability.
• Q4 - Efficiency
Efficiency is the describes the systems correlation between its level of performance
and the amount of resources needed. The conditions should be stated. Efficiency
consists of the following qualities:
– Q4.1 - Time behavior Describes response times for stated though-put.
– Q4.2 - Resource utilization Describes the amount of resources used.
– Q4.3 - Efficiency compliance Characterizing the systems adherence to standards, conventions and laws relating to efficiency.
39
Chapter 3. Preliminary Study
• Q5 - Maintainability
Maintainability is the attribute that describes the effort needed to make stated
alterations or modifications. Maintainability consists of the following qualities:
– Q5.1 - Analyzability Describes how easy it is to indentify the main cause
of a failure.
– Q5.2 - Changeability Describes the amount of effort needed to change the
system.
– Q5.3 - Stability The attribute that describes the systems sensitivity to
changes.
– Q5.4 - Testability Describes how easy the system is to test after a system
change.
– Q5.5 - Maintainability compliance Characterizing the systems adherence
to standards, conventions and laws relating to maintainability.
• Q6 - Portability
Portability is the attribute describing the ease of transfer between different environments. Portability consists of the following qualities:
– Q6.1 - Adaptability
– Q6.2 - Installability
– Q6.3 - Co-existence
– Q6.4 - Replaceability
– Q6.5 - Portability compliance Characterizing the systems adherence to
standards, conventions and laws relating to portability.
The definitions above are based on information from [33] and [2].
3.8
Development Method
Before a decision could be made on what kind of development method to use, there had
to be done some research.
3.8.1
Scrum
Scrum is one of many agile methods for software development. It was originally meant
for physical product development, but it has also been used much for management of
40
Chapter 3. Preliminary Study
software development. When working with Scrum, there are three core roles: Product
Owner, Team and Scrum Master.
• Product Owner
This role represents the customer, and must ensure that the project is delivering
something of value. The Product Owner often writes customer-centric items, like
user stories, and make sure these are added to the product backlog. Every Scrum
team should have a Product Owner. That role can be combined with being a normal
developer, but should not be combined with being Scrum Master.
• Team
In Scrum a team is often put together of 5-9 developers with cross-functional skills.
They are the ones who do the actual work; analyze, design, develop, test and so on.
Since the team is the ones doing the work, they are also responsible for delivering
the product.
• Scrum Master
The Scrum Master is not the team leader. He or she is supposed to be the buffer
that keeps disturbing influences away from the team and removes any obstacles
that can stop the team from being able to deliver the sprint goal. In addition to
this, the Scrum Master is the enforcer of rules and should ensure that the Scrum
process proceeds as planned.
Scrum is an iterative and incremental way of working. The main part of a Scrum process
is the Sprints, which is the unit of development. The duration of a sprint varies between
a week and a month. Before each sprint, there is a planning meeting, used to identify
tasks from the product backlog and estimate the work effort needed. This is put into the
sprint backlog. After a sprint, there should be a review meeting to find out what did not
go as planned and how to keep that from happening.
Each Sprint should end with a new deliverable of the product. The product backlog is
used to find out which features to focus on during the Sprint. It is not allowed to change
anything on the sprint backlog during a Sprint. If any requirements are not completed
during the Sprint, it is returned to the product backlog. When a Sprint is completed, the
team is often required to demonstrate the software.
41
Chapter 3. Preliminary Study
Figure 3.12: Scrum Model
In addition to the planning and review meetings, there is often a short daily Scrum status
meeting. These are often called daily stand-up meetings, since everyone stands upright
during the meetings. During these meetings every team member should answer three
standard questions:
• What have you done since the last meeting?
• What do you plan to do today?
• Have you encountered any problems that may prevent, or delay, you reaching your
goal?
Central in a Scrum project, there is a product backlog. This is a list of possible features
ordered by business value. It is open to anyone, and has rough estimates on what amount
of effort is needed for each feature. These estimates are used to find out which features
have the highest Return of Investment, and therefore which features to prioritize.
One of the main ideas for Scrum, and other agile development methods, is that the environment or the customer’s needs can change during the development. Therefore, Scrum
takes on an empirical approach. Just accept that new or changed requirements can come,
and focus on maximizing the probability of a quick delivery of the next increment.
[26]
3.8.2
Waterfall
The Waterfall method of development is to do the parts in sequence, and it is therefore
called a sequential design process. The model was in 1970 described formally for the first
time, though the term ”waterfall” was not used. This article, written by Winston W.
Royce, presented the model as flawed and non-working.
The model, as Royce described it, containes 7 phases:
42
Chapter 3. Preliminary Study
1. Requirements specification
In this phase, the specifications for the system that was going to be developed was
found, prioritized and sorted. This should contain the customers explicit needs.
Though very hard, it is important to cover the customers implicit needs as well.
2. Design
The design should reflect the requirements, and make sure that the end result have
the qualities that the customer wants in the system. The design includes :
• General design
This consists of the general architecture of the software. Different architectures
have different qualities, and the choice of architecture will therefore affect the
end result and the customer satisfaction.
• Detailed design
Often consists of class diagrams, use cases and BPMN to show the more specific
parts of the system.
3. Implementation
Implementation is the phase where the developers code the software. Also called
Construction.
4. Integration
Here the product is integrated with the existing system.
5. Testing and debugging
Here the software is tested. This is done to find errors and to verify that the software
does what the customer wanted. Also known as Validation or Verification.
6. Installation
In this phase the software is installed for the end users and ready for use.
7. Maintenance
This phase is the one where the end user gives feedback, often in the form of
complaints. This feedback is used to remove more of the errors and improve the
software further. This is a task often outsourced, since developers tend to dislike
working on the same project for a long time.
43
Chapter 3. Preliminary Study
Figure 3.13: Waterfall Model
With feedback, the Waterfall model can become an iterative development model. It still
consists of separate phases, but with feedback errors and opportunities for improvement
is found. Then the needed phases can be started anew. [27]
3.9
Conclusion Based on Preliminary Study
As a result of the preliminary study we ended up with the product backlog (Table 3.9)
and a choice of development method. The product backlog will act as a base for the
requirements specification.
3.9.1
Table Properties
The requirements are prioritized after their importance in the project. The backlog items
are rated with high, medium or low priority.
High priority indicates that the item is of high importance, and that the item is
necessary to make the system acceptable for the costumer. These functionalities must be
implemented, and will have the main focus during the sprints.
Medium priority indicates that the function is of some importance. Thes functions
add functionality that the customer wants, but it is not an absolute necessity to complete
the project.
44
Chapter 3. Preliminary Study
Low priority indicates that the function is of little importance to the product. This
means that the function will add some nice features to the system, but it is not crucial.
Because of this, any functions with low priority will have low focus in the sprints, and
will only be implemented if there is time left for it in the final sprint.
3.9.2
Product Backlog Table
The set of activities in the product backlog are listed in the table below.
ID Description
High Priority
1
Continuously fetch data from Datarec 7 installation
11 Set up on-site server
7
Make error handler
2
Save data in database
3
Set up web service
Medium Priority
4
Show location of roadside installations on a map
5
Display unit information
13 Create installation guide
14 Display state logs for units
Low Priority
9
Design web interface
6
Automatic notifications
Table 3.9: Product Backlog
3.9.3
Choice of Development Method
The decision of what development process to choose was discussed in detail within our
group. We were initially set on following the waterfall model. The reason for this was
that it is a quite simple way of working. With the waterfall model, the requirements
specifications are set at the start and do not change. This seemed to be a fitting model
since the needs of the NPRA does not change fast or often. So, from this, we had initially
decided that the waterfall model would be a good and stable choice.
The customer though, through representative Jo Skjermo, expressed the wishes of Scrum
as the model of development. The reason for this wish was the possibility of changes in the
requirements specification. We then decided that since the customer wanted this specific
model, we might as well agree to this. Gaining experience with the Scrum development
model was also a reason to let go of the Waterfall choice.
45
Chapter 3. Preliminary Study
Therefore the development method used in this project is Scrum. Since we decided to
go with Scrum, roles needed to be assigned for the Scrum meetings. Bjørnar Valle was
elected our Scrum Master, while Roar Bjurstrøm took the role of Product Owner. The
rest of our project group were assigned to the Team.
As for meetings in Scrum, the decision was to have daily Scrum meetings. These would
replace the internal meetings.
46
4
Requirements Specification
Contents
4.1
Table Properties . . . . . . . . . . . . . . . . . . . . . . . . . .
46
4.2
Functional Requirements . . . . . . . . . . . . . . . . . . . . .
46
4.2.1
High Priority Functional Requirements . . . . . . . . . . . . . .
46
4.2.2
Medium Priority Functional Requirements . . . . . . . . . . . .
47
4.2.3
Low Priority Functional Requirements . . . . . . . . . . . . . .
48
4.3
Non-Functional Requirements . . . . . . . . . . . . . . . . . .
48
4.4
Quality Assurance and Requirement Specification . . . . . .
49
This is the chapter where the various functional and non-functional requirements specifications are identified, discussed and explained. The customer came to us with a quite
concise description about what properties he wanted the system to have. These properties were summarized in a product backlog (section 3.9). In order to fulfill the properties
from the backlog, we defined a number of detailed system requirements, both functional
and non-functional. The following tables contain the items from the product backlog in
bold text, accompanied by the requirements specifications that have to be fulfilled for
each separate item to be implemented. The functional requirements define the functionality that the system should have and the non-functional requirements defines constraints
on how the functionality is supposed to be implemented. The requirements did evolve
during the project due to changes in the costumers preferences, and we have documented
these changes in appendix C.
4.1
Table Properties
The properties of the table concerning the requirement specification is identical to the
table properties concerning the product backlog. These properties can be found in section
3.9.1.
Identification of each requirement is done by giving a requirement the letters FR or
NFR, followed by a number. FR stands for Functional Requirement, and NFR stands for
Non-Functional Requirement.
4.2
Functional Requirements
This section includes the functional requirements.
Chapter 4. Requirements Specification
4.2.1
High Priority Functional Requirements
The following section contains all the functional requirements that were considered to be
of high importance.
ID
Description
1. Continuously fetch data from Datarec 7 installations
FR1 The system should support the Datarec 7 hardware
FR2 The system should use the SOAP interface to get the status of the
Datarec 7 hardware every second
11. Set up the on-site server
FR3 The server on-site should mimic a subset of the OPC functionality
FR4 The server on-site should be able to register listeners.
FR5 The server on-site should be able to push data.
12. Set up the Error Handler
FR7 The Error Handler should be able to receive messages from the
on-site servers.
FR8 The Error Handler should be able to register itself as a listener to
the on-site servers .
FR9 The Error Handler should get a list of all the roadside installations
and their IP-addresses from the NorTraf database abstraction level.
FR10 The system should use the data from on-site server to detect peculiar data, loop failures, hardware errors or wrong hard-wiring.
FR11 The errors should be separated from the regular data messages.
FR12 The Error Handler should create warnings on irregularities and peculiar data.
2. Save data in database
FR13 The system should use a SQL database to store the statuses and
errors.
FR14 The system should convert the messages from the on-site server for
database storage.
3. Set up Web Service
FR15 The system should have a web service using SOAP.
FR16 The Web Service should use the SQL database to offer status and
error data.
FR17 The Web Services hould use the NorTraf database abstraction to
get the coordinates of the roadside installations.
FR18 The Web Service should separate warnings and errors.
Table 4.1: High Priority Functional Requirements
48
Priority
High
High
High
High
High
High
High
High
High
High
High
High
High
High
High
High
High
Chapter 4. Requirements Specification
4.2.2
Medium Priority Functional Requirements
This table contains all the functional requirements that was considered to be of medium
importance.
ID
Description
4. Show location of roadside installations on a map
FR19 The system should use a map service to show the locations of the
roadside installations on a map.
5. Display unit information
FR20 The system should display the status of separate installations in a
web page.
14. Display state logs for units
FR24 The system should store the states of the separate installations in
a database.
Priority
Medium
Medium
Medium
Table 4.2: Medium Priority Functional Requirements
4.2.3
Low Priority Functional Requirements
This table contains all the functional requirements that was considered to be of low
importance.
ID
Description
15. Automatic notifications
FR25 The system should notify by SMS or email automatically if errors
occur.
Priority
Low
Table 4.3: Low Priority Functional Requirements
4.3
Non-Functional Requirements
In this section the non-functional requirements are presented.
ID
Description
13. Create installation guide and user manual
NFR1 The system should have a installation guide and user manual.
9. More extensive design of web interface
NFR2 The web interface should have a clear design.
NFR3 The web interface should use Ajax to enhance user experience.
Continued on
49
Priority
Medium
Low
Low
next page
Chapter 4. Requirements Specification
Table 4.4 – continued from previous page
Description
ID
Priority
Other
NFR4 The system should be programmed in Java/Java Enterprise.
High
NFR5 The system should be easy to integrate into the customer’s existing High
system.
Table 4.4: Non-Functional Requirements
4.4
Quality Assurance and Requirement Specification
For this system, there are a few software attributes that stand out as more important
than others. Because of the functinal requirements, the functionality of the system is one
very important attribute. It is considered to be the most important attribute for this
project. The non-functional requirements show that usability, portability and maintainability also are important. These attributes are coupled with non-functional requirements
in table 4.5.
ID
Non-Functional Requirement
NFR1 The system should have an installation guide and user manual.
NFR2 The web interface should have a
clear design.
NFR3 The web interface should use
Ajax to enhance user experience.
NFR4 The system should be programmed in Java/Java Enterprise.
NFR5 The system should be easy to integrate into the customer’s existing system.
Quality in Use
Q3. Usability
Sub-attributes Used
Q3.2 Learnability
Q3. Usability
Q3.3 Operability
Q3. Usability
Q3.4 Attractiveness
Q6. Portability
Q6.1 Adaptability
Q5. Maintainability
Q5.2 Changeability
Table 4.5: Mapping Non-Functional Requirement with Software Attributes
More information about each of these qualities and attributes can be found in section 3.7.
50
Part II
Sprints and Implementation
5
Sprint Planning
Contents
5.1
Sprint Phases . . . . . . . . . . . . . . . . . . . . . . . . . . . .
51
5.2
Quality Assurance . . . . . . . . . . . . . . . . . . . . . . . . .
52
5.2.1
5.3
5.4
Milestones . . . . . . . . . . . . . . . . . . . . . . . . . . . . . .
Product Backlog . . . . . . . . . . . . . . . . . . . . . . . . . .
52
55
5.3.1
Table . . . . . . . . . . . . . . . . . . . . . . . . . . . . . . . .
55
5.3.2
Sprint 1 . . . . . . . . . . . . . . . . . . . . . . . . . . . . . . .
56
5.3.3
Sprint 2 . . . . . . . . . . . . . . . . . . . . . . . . . . . . . . .
57
5.3.4
Sprint 3 . . . . . . . . . . . . . . . . . . . . . . . . . . . . . . .
57
Test Plan . . . . . . . . . . . . . . . . . . . . . . . . . . . . . .
58
5.4.1
The Testing Procedures . . . . . . . . . . . . . . . . . . . . . .
58
5.4.2
Overall Schedule of the Testing . . . . . . . . . . . . . . . . . .
59
This section is dedicated to the planning of the implementation phase introduced in
section 2.1.
5.1
Sprint Phases
The chosen life cycle model (3.9.3), Scrum, is built up of sprints. These are implementation phases with a presentation for the customer at the end. We chose to have three
sprint phases to implement this project. The first sprint was planned to be over three
weeks, while the two succeeding sprints should last 2 weeks.
The reason we chose to have three weeks for the first sprint was to get more work done
before the first implementation presentation for the customer. This way we would get the
time to actually implement a significant part of the system that is worth presenting.
There were several reasons behind the choice of three sprints.
• Project duration
• Minimal sprint duration
• Scrum experience
• Difference between scrum and waterfall
The project duration makes it a necessity to have relatively short sprints. The normal
minimal sprint duration is two weeks. Therefore the last two sprints have a two week
duration. The first sprint is a bit longer, three weeks. Three sprints would also give
Chapter 5. Sprint Planning
us experience with Scrum deliverables and presentations. This, of course, in addition to
the Scrum meetings, Scrum roles and Scrum planning. Another reason for having three
sprints was that it had to be different than the Waterfall model.
Figure 5.1: Gantt-Chart Diagram Describing the Sprints
5.2
Quality Assurance
This section will describe in detail what we agreed to do in order to ensure that its
product held a high level of quality. It will also briefly discuss the choice of Scrum as
development method in the perspective of quality assurance.
In quality assurance, the ultimate goal is to satisfy the customer. This fact advocates
the choice of Scrum as development method, as the customer’s needs may change at any
given time of the project. Some old requirements may not be required at all, whereas
some new requirements may come through. With Scrum, the group can incorporate
as many changes as the customer wants even during the implementation phase of the
project.
In the start of the implementation phase we appointed Bjørnar Valle and Roar Bjurstrøm
as “Scrum master” and “product owner”, respectively. The master lead the Scrum meetings, distributed work tasks, set deadlines and checked whether the team members did
their tasks. The product owner came with suggestions and thoughts that preserved the
customer’s interests. After every sprint, we held an evaluation meeting, where we thoroughly discussed internally in our group what was negative and what was positive.
5.2.1
Milestones
“Within the framework of project management, a milestone is the end of a stage that
marks the completion of a work package or phase, typically marked by a high level event
such as completion, endorsement or signing of a deliverable, document or a high level
review meeting.” [31]
We have defined our project milestones to be identical with with the deadlines set by the
53
Chapter 5. Sprint Planning
course coordinators, in addition to the ends of our project phases. Consequently, these
are our project milestones:
Tasks
T1 (Planning)
T2 (Pre-Study)
T3 (Sprint 1)
T4 (Sprint 2)
T5 (Sprint 3)
T6 (Report)
T7 (Presentation Preparation)
Duration (# work days)
14
14
15
10
10
60
3
Dependencies
T1 and T2 (M1)
T3 (M2)
T4 (M3)
T5,T6 (M4 and M5)
Table 5.1: Task, Duration and Dependencies
The different tasks are IDed by T1-7, and the different milestones are IDed by M1-5.
Figure 5.2: Activity Network Chart
54
Chapter 5. Sprint Planning
Milestone
Goal
Preliminary Study and Planning (M1)
The main goals of this period was to get an overview of the problem and
solution of the project, gather the customer’s requirements, and plan our
project period.
Quality Measure The most important task of this period was to learn the overall overview
of the project, get to know every group member, and prepare a product
backlog.
Target Date:
16.09.11
Table 5.2: Milestone Table - Preliminary Study and Planning (M1)
s
Milestone
Goal:
Sprint 1 (M2)
The main goals for sprint1 were to design, implement and test the web
page, web service, the Datarec 7 connection client and the database.
Quality Measure The first task of this milestone was to implement good routines for daily
stand-up meetings and distributing tasks efficiently. But most importantly, the purpose of this sprint was to implement, test and show the
web page and web service to the customerl.
Target Date
07.10.11
Table 5.3: Milestone Table - Sprint 1 (M2)
Milestone
Goal
Sprint 2 (M3)
The main goals for sprint 2 were to implement the most significant parts
of the on-site server and the error handler.
Quality Measure The main task of this sprint was to set up an on-site server and implement
most of the error handler.
Target Date
21.10.11
Table 5.4: Milestone Table - Sprint 2 (M3)
Milestone
Goal
Sprint 3 (M4)
The main goals for sprint 3 were to complete the implementations of the
on-site server and the error handler. Other goals were to to make an
installation guide and to improve the GUI of the web page.
Quality Measure The major task of this sprint was to get on-site server and client communicating, complete all other remaining components of the system and
perform an integration test and demonstrate the complete system to the
customer. Above all get the customer’s approval for the completion of
project.
Target Date
04.11.11
Table 5.5: Milestone Table - Sprint 3 (M4)
55
Chapter 5. Sprint Planning
Milestone
Goal:
Report (M5)
The final report has to include all the necessary chapters and should not
be of more than 200 pages.
Quality Measure The final draft of the report should be complete within the target date
for the final approval of the advisor.
Target Date
18.11.11
Table 5.6: Milestone Table - Report (M5)
Milestone
Goal
Presentation (M6)
The final presentation should be prepared and completed at least one
day before the deadline.
Quality Measure Microsoft PowerPoint should be used for the presentation. The application should run and work with the device as it is expected to (consider
MS office versions). All the members of our team must be involved in the
presentation. The presentation should be given in front of the advisor,
the customers, the examiner and others who are invited.
Target Date
The project should be presented on 24th November, 2011 at 0915 in
ITV-354.
Table 5.7: Milestone Tentation (M6)
As shown in Figure 5.2, we have planned for a total of five milestones. We decided that
each “deliverable” will replace the need for a milestone report. At each milestone, we have
to make a deliverable to either the costumer (M2, M3, and M4) or the course coordinator
(M5), except in the case of M1. M1 did not require a milestone report as it was purely
a deadline we set for ourselves to finish our preliminary study and planning by.
Detailed planning of T3 (Sprint1), T4 (Sprint 2) and T5 (Sprint 3) has been explained
in its respective sections (see section 6,7 and 8).
5.3
Product Backlog
This section contains the plan for which parts of the product backlog that were the
conclusion of the preliminary study, the backlog can be found in section 3.9.
5.3.1
Table
This updated product backlog table describes the total effort estimate for each sprint and
parts of the sprints, as well as which functional requirements (FR) or non-functional re56
Chapter 5. Sprint Planning
quirements (NFR) fulfilled with each task. For more information about the requirements,
refer chapter 4 - Requirements Specification.
ID Description
1
11
7
2
3
4
5
13
14
9
6
High Priority
Continuously fetch data
from Datarec 7 installation
Set up on-site server
Make errorhadler
Save data in database
Set up web service
Medium Priority
Show location of roadside
installations on a map
Display unit information
Create installation guide
Display state logs for units
Low Priority
Design web interface
Automatic notifications
Sum Hours
Total
Effort
Estimate
Sprint 1 Sprint 2 Sprint 3 Req.
70
70
0
0
FR2
315
275
70
135
0
65
70
135
165
150
0
0
150
60
0
0
FR3-5
FR7-12
FR13-14
FR15-18
55
55
0
0
FR19
30
40
50
30
0
50
0
0
0
0
40
0
FR20
NFR1
FR24
20
45
1105
0
0
475
0
0
315
20
45
315
NFR2-3
FR25
Table 5.8: Product Backlog
5.3.2
Sprint 1
Sprint 1 mainly consists of implementing the database, web service, map service and the
display of unit information. This was much due to the fact that we did not have access to
the Datarec hardware in sprint 1. The database is not dependent on any other services
for working properly. The web service, map service and web page get all the information
they need from the database. Therefore by choosing to implement these parts first, we
reduced the damage of the delay that threatened the project.
The implementations of unit information and map service were done in the web page;
this also made it natural to implement them together. The database is a high priority
service because it is where all the error messages are stored. The storage of error messages
makes it possible to show errors after they occur, which is a crucial functionality. The
web service is a high priority service, because it made the information in the database
useful. It connects the errors with their location, and the data would be pretty useless if
57
Chapter 5. Sprint Planning
the location was not stated. The functionality on the web page is important, because it
makes the information visible to the user. But it is only of medium priority because the
system does not depend heavily on it, and it would be enough to make a rather simple
presentation of the data.
We also wanted to implement the SOAP client on the on-site server which makes it
possible to continuously fetch data from the Datarec 7 early in the project. The reason
for this was to ensure that any critical hardware issues were discovered early in the
project, so that we had time to recover from them. Since we got access to the hardware
rather late, we also added some time for this in sprint 2. The fetching from the Datarec 7
is a high priority functionality, because without it, it would be impossible to get data to
the system, since almost all the information comes from the Datarec 7 hardware.
5.3.3
Sprint 2
The important functionality that needed to be implemented in sprint 2 was the error
handler and the on-site server. The initial plan was to implement an OPC client and add
a service that fetched network statistics. This was abandoned due to reasons explained
in chapter C.3. It was important to implement the error handler and the on-site server
in sprint 2, because with this part done, we actually would have a working system quite
early in the project period. With a running system, it would be easier to test and to get a
better view if anything else needed to be implemented. The error handler should initially
have been done by the end of sprint 2, but since we added much more complexity into
the error handler, we thought it would be a good idea to add time for finishing it during
sprint 3. The on-site server is probably the most complex part of our project, and also
needed to be extended into sprint 3. This means that it was not probable that anything
was completely done during sprint 2.
The error handler is a high priority functionality, because it is this service that caches
the errors. The on-site server is high priority because the customer wanted a system
which pushes data. The Datarec 7 is not able to push data, but in the future the
functionality of the on-site server should be offered by the roadside hardware. Therefore
since we are making a prototype of the system, it is important that the system has this
functionality.
5.3.4
Sprint 3
The on-site server and the error handler had to be finished during sprint 3, and with these
parts complete, the system should be able to run. But in sprint 3, we also planned to
implement support for automatic notifications via mail or sms, design the web interface
in a more advanced way, create a user manual and add support for the Datarec 410. The
plan was to finish the on-site server and the error handler, and then add functionality that
58
Chapter 5. Sprint Planning
is not as critical for the project, but makes the system better. These additions would be
added if there was time for it. The installation guide is needed to make the system usable
for new users. This had medium priority in sprint 3. The support for Datarec 410 is a
feature that will be added in sprint 3, and is a good feature for the system since most of
the current hardware is of this sort, but since all new equipment is of the Datarec 7 type,
it would not be a critical if it was not implemented. Therefore this had medium priority.
Later in the project it was considered to be unnecessary to implement this feature, and it
was therefore removed from the backlog. The initial backlog planned at the beginning of
the project can be found in Appendix C. If we had enough time we wanted to implement
an advanced GUI for the project. This was not so important because we were mainly
working with a proof-of-concept, but it would make the usability of the system better.
Therefore we made this low priority. The system should also offer automatic notification
by sms and email when errors occur. This was a small addition and was only considered
a small priority.
5.4
Test Plan
This section presents the test plan for the testing of the implementations that were
planned in the sprints.
5.4.1
The Testing Procedures
We decided that we were going to try to implement the system using a Test-DrivenDevelopment model(3.3.1). But since we were inexperienced with the model, it would
not be possible to implement the entire system using the TDD model. The TDD model
would also make the coding more time-consuming for inexperienced users, which meant
that we had to take some shortcuts to be able to finish in time. The unit tests are written
using the JUnit framework.
We decided that we should also use a tool called Mockito(3.5) to make the system testable
before the entire system was complete. Mockito offers the possibility to mock up Java
classes that are yet to be implemented. This makes the testing of a half-implemented
system easier.
Each component goes through four testing phases.
1. The component is tested using unit testing.
2. The component functionality is tested using black-box testing.
3. The component is integrated into a part of the system, and the interaction between
the components is tested. Since the system has a clear distinction between front-end
and back-end, they will be tested as two separate units before they are integrated.
59
Chapter 5. Sprint Planning
4. The testing of the entire integrated system.
The black box tests have been produced during the sprints, and are a part of Appendix
A.
The front-end is in considered to be the Datarec Database, the Web Service and the
Web Page. The back-end is considered to be the ONSITE server, the Error Handler and
the Datarec Database. The reason for testing the front-end and the back-end separate
from each other is that the front and back-end can be working standalone and have no
dependencies on each other. This makes it possible to start testing of the Web Service
and Web Page early.
Due to the fact that we are developing the system purely as a proof of concept, the
testing does not have to be as extensive as it would be for a system that is developed
for actual use. This means that the customer will not be performing an acceptance test,
since the customer’s main interest in the result of our project is our experience with and
recommendation of implementing the system.
Type
Unit Test
Description
Tests the low level code for expected output
with unit tests. Helps to ensure that each
part of the code works as expected.
Integration Test
After completion of a module, it needs to be
integrated with the rest of the system. After this procedure, the integration tests make
sure the system works as it should.
Functionality Test
Tests the functionality of the module against
the requirement specification.
Complete System Test Tests all of the components integrated to
work together as one.
Responsibility
Programmer
Test leader
Test leader
Test leader
Table 5.9: Test Overview
5.4.2
Overall Schedule of the Testing
The project is implemented in the three sprints discussed above. The components that
were finished in each sprint had to go through testing before they could be considered
finished.
Sprint 1
By the end of Sprint 1 the following components had to be thoroughly tested:
60
Chapter 5. Sprint Planning
• Web Page: The Web Page consists of three functionalities that have to be tested
separately and together. These three are displaying unit information, displaying
state logs for units, and marking error locations on a map.
• Web Service: The Web Service’s communication with the database and the Web
Page has to be tested.
• Database: It has to be tested whether storing and getting the data messages we
operate with works as it should.
• Datarec 7 SOAP Client: The SOAP Client’s communication with the Datarec
7 has to be tested.
• Front End: Since the entire front end is implemented during sprint 1, the integration of the front end should be tested.
Sprint 2
By the end of Sprint 2 the following components had to be thoroughly tested:
• Error Handler: Its communication with the database and the ONSITE server has
to be tested, as well as its ability to recognize and convey errors.
Sprint 3
By the end of Sprint 3 the following components had to be thoroughly tested:
• The ONSITE server: The ONSITE server’s communication with the Datarec 7
and the Error Handler has to be tested.
• Complete System Test: After all the components from the sprints have been
integrated with each other, we have to test if they can work together as one.
61
6
Sprint 1
Contents
6.1
Sprint 1: Sprint Goals
. . . . . . . . . . . . . . . . . . . . . .
61
6.2
Sprint 1: Sprint Backlog . . . . . . . . . . . . . . . . . . . . .
61
6.2.1
Sprint 1 Backlog Table . . . . . . . . . . . . . . . . . . . . . . .
61
6.2.2
Comments on the Sprint 1 Backlog . . . . . . . . . . . . . . . .
63
6.3
Sprint 1: Main Deliverables . . . . . . . . . . . . . . . . . . .
63
6.4
Sprint 1: Design and Implementation . . . . . . . . . . . . .
65
6.5
6.6
6.7
6.4.1
Datarec 7 SOAP Client . . . . . . . . . . . . . . . . . . . . . .
65
6.4.2
Datarec Database . . . . . . . . . . . . . . . . . . . . . . . . .
65
6.4.3
Web Service . . . . . . . . . . . . . . . . . . . . . . . . . . . . .
65
6.4.4
Web Page . . . . . . . . . . . . . . . . . . . . . . . . . . . . . .
66
6.4.5
Error Handler . . . . . . . . . . . . . . . . . . . . . . . . . . . .
67
Sprint 1: Testing . . . . . . . . . . . . . . . . . . . . . . . . .
68
6.5.1
Web Page . . . . . . . . . . . . . . . . . . . . . . . . . . . . . .
68
6.5.2
Web Service . . . . . . . . . . . . . . . . . . . . . . . . . . . . .
69
6.5.3
Database . . . . . . . . . . . . . . . . . . . . . . . . . . . . . .
70
6.5.4
Datarec 7 SOAP Client . . . . . . . . . . . . . . . . . . . . . .
71
6.5.5
Testing the Integration of the Database, the Web Service and
the Web Page . . . . . . . . . . . . . . . . . . . . . . . . . . . .
71
Sprint 1: Review . . . . . . . . . . . . . . . . . . . . . . . . . .
72
6.6.1
Sprint 1: Positive Experiences . . . . . . . . . . . . . . . . . . .
73
6.6.2
Sprint 1: Negative Experiences . . . . . . . . . . . . . . . . . .
73
6.6.3
Sprint 1: Planned Actions . . . . . . . . . . . . . . . . . . . . .
74
Sprint 1: Feedback . . . . . . . . . . . . . . . . . . . . . . . . .
74
The first sprint started in the fourth week of the project period, which was week 38.
At the first sprint meeting we started the sprint planning. We soon realized that the
product backlog had to be modified and slightly reorganized in order to get a clear sense
of progress for each sprint. The first sprint was designed with the main focus of setting
up and finishing the web service and the database. In addition to this, there should be
put a substantial effort into making the SOAP interface continuously fetch data from
the Datarec 7, and make the system detect errors. As sprint 1 was a week longer than
other two planned sprints, we thought they should also put some effort into some of the
lower prioritized items during the sprint. Thus we agreed that setting up the map service
and making the web service display unit information and state logs for units should be
finished during sprint 1.
Chapter 6. Sprint 1
6.1
Sprint 1: Sprint Goals
We found that it would be useful to identify a set of sprint goals for each sprint which
they would aim to satisfy. As none of our team members had any previous experience
working with agile development, a considerable goal was to successfully carry into effect
the knowledge about Scrum that they had acquired through preliminary study and the
Scrum lecture the 13th of September. This would mean implementing good routines for
daily stand-up meetings and distributing tasks efficiently.
In addition to this we designed a sprint backlog specifically for sprint 1. This sprint
backlog consisted of carefully chosen items from the product backlog that would form
a basis for the subsequent sprints to build on. The main goals for sprint1 are to design, implement and test the web page, web service, the Datarec 7 connection client and
the database. The web page, web service and the database part should be successfully
presented to the costumer at Thursday the 13th of October 2011.
6.2
Sprint 1: Sprint Backlog
This section presents the backlog with documentation for sprint 1.
6.2.1
Sprint 1 Backlog Table
The numbers in the backlog table represents the number of hours that we have planned
to spend on each item in the list.
ID Task
1
Fetch
data
Design
Test
plan
Code
Test
M
Week 1
T W T
10
10
5
F
M
Week 2
T W T
F
M
Week 3
T W T
P
F
20
10
5
8
2
8
2
63
8
2
4
1
4
1
32
8
Continued on next page
Chapter 6. Sprint 1
ID Task
M
7
2
3
4
5
14
Error
Handler
Design
10
Test
plan
Database
Schema
Design
Test
plan
Code
Test
Web
service
Design
Test
plan
Code
Test
Map
Design
10
Test
plan
Code
Test
Unit
info
Design
Test
plan
Code
Test
State
logs
Design
Table 6.1 – continued from previous page
Week 1
Week 2
Week 3
T W T F M T W T F M T W T
15 20
5
5
P
F
50
15
10
10
15 10
5
5
4
1
10
10
25
10
4
1
4
1
2
3
5
10 5
5 10
25
15
5
8
2
8
2
8
2
8
2
8
2
8
2
5 5 58
10 10 32
5
8
14
11
15
10
2
10
10
5
20
10
5
10
10
5
5
10
5
5
64
10
5
10
15
Continued on next page
Chapter 6. Sprint 1
ID Task
M
Test
plan
Code
Test
SUM
Table 6.1 – continued from previous page
Week 1
Week 2
Week 3
T W T F M T W T F M T W T
5 5
5
30
30 38
27
40 25
40 35
30 25 25
30
35
P
F
15
20
5 5
35 30 475
Table 6.1: Sprint 1 Backlog
6.2.2
Comments on the Sprint 1 Backlog
All of the implemented components goes through a four step cycle. The four phases is
designing, the making of a test plan, implementation and testing. This model is closely
related to the waterfall model, so that even though the project is based on scrum, the
components are implemented with waterfall.
We decided to start the sprint with design of the data fetcher and error handler. The
main reason for doing it in this order was that we wanted to know early what kind of
error messages the system was able to catch and what kind of format they would have.
Since our group consists of seven people, and not all of us were working on the data and
error system, we also started with the map service during the first days of the sprint.
When the design process was finished, we decided to start working on the Web service,
which was the most extensive part of sprint 1. The web service is dependent on a working
database, and the implementation of the database was therefore done in parallel with the
web service. We decided to postpone the Unit information and state log part to the end
of the sprint. This was due to the fact that the components were not crucial for the
presentation of sprint 1.
6.3
Sprint 1: Main Deliverables
The deliverables for the first sprint was mainly to implement the web page, web service,
database and Datarec 7 SOAP client. Because of the inaccessibility of the Datarec hardware, a mockup of Datarec 7 was created to simulate connection with the SOAP client.
This answers the high priority requirements (Table 6.2) FR1 , FR2, FR13, FR14, FR15,
FR16, FR17, FR18.
ID
Description
1. Continuously fetch data from Datarec7 installations
65
10
Priority
Chapter 6. Sprint 1
ID
FR1
FR2
Description
The system should support the Datarec7 hardware
The system should use the SOAP interface to get the status of the
Datarec7 hardware every second
2. Save data in database
FR13 The system should use a SQL database to store the statuses and
errors.
FR14 The system should convert the messages from the on-site server for
database storage.
3. Set up web service
FR15 The system should have a web service using SOAP.
FR16 The web service should use the SQL database to offer status and
error data.
FR17 The web service should use the NorTraf database abstraction to get
the coordinates of the roadside installations.
FR18 The web service should separate warnings and errors.
Priority
High
High
High
High
High
High
High
High
Table 6.2: High Priority Functional Requirements Sprint 1
The medium priority requirements FR19, FR20, FR24 were also fulfilled:
ID
Description
4. Show location of roadside installations on a map
FR19 The system should use a map service to show the locations of the
roadside installations on a map.
5. Display unit information
FR20 The system should display the status of separate installations in a
web page.
14. Display state logs for units
FR24 The system should store the states of the separate installations in
a database.
Priority
Medium
Medium
Medium
Table 6.3: Medium Priority Functional Requirements Sprint 1
6.4
Sprint 1: Design and Implementation
This section presents the design and implementation of the Datarec 7 SOAP Client,
Datarec Database, Web Service and Web Page. It will also present the design of the
Error Handler.
66
Chapter 6. Sprint 1
6.4.1
Datarec 7 SOAP Client
This is the part of the ONSITE server that is continuously fetching the status of the
Datarec 7. Its only functionality is to use the SOAP interface of the Datarec 7 to get the
status and store it as object classes, which are later sent to the error handler. The fetching
of the status is executed as frequently as possible, to make the system as “real-time” as
it can be.
The choice of IDE made the design and implementation of a SOAP client easy for us. In
NetBeans you can just add a reference to a web service by pointing to its WSDL file, and
NetBeans generates the required files and sets up a JAX-WS client automatically. The
JAX-WS client lets us invoke the methods on the Datarec just as if they were on a local
object. We decided not to include the automatically generated files in the class diagram
to save space and avoid confusion. It is the Dr7Communicator class that handles the
generating, sending and receiving of SOAP XML.
We decided that the best way to implement the SOAP client was to run it as a separate
thread. This thread continuously fetches the status of the Datarec and updates a set of
model classes. These model classes are monitored for changes by some other part of the
ONSITE server, and are a part of a Model-view-controller pattern. The complete design
of the Datarec 7 SOAP Client is presented in Appendix D: Design, section D.6.
6.4.2
Datarec Database
To store the statuses and error messages we decided to use a separate database. This
database separates between statuses, error messages and warning messages. Since the
only difference between error and warning messages is their type, we added a column
where the type of the message is specified. The complete database scheme is presented
in Appendix D: Design, section D.5.
6.4.3
Web Service
It was a requirement from the customer that the data gathered from the roadside installations was to be presented through a web service. The web service offers the statuses
and errors from the database, and separates between resolved and unresolved errors. It
also has the functionality to offer state and error logs, and the geographical location of
the Datarec units. Information of the Datarec units, such as their geographical location,
is obtained from the NorTraf database.
Another requirement was that all message passing should be XML, preferably SOAP
XML, and for this reason we implemented the web service as a SOAP interface. Again,
NetBeans made the task simple. By creating a web application and adding a web service,
67
Chapter 6. Sprint 1
all we had to do was declare the functions that were to be available through the SOAP
interface. This is the RequestHandler class and it has four methods:
getUnresolvedErrors() This function returns an object containing a list of the unresolved errors and a list of their geographical location.
getRecentStatuses(int drId, int offset, int count) This function returns an object
containing a list of the recent statuses of the specified Datarec unit and the Datarec unit’s
geographical location. The offset and count parameter is used to get subsets of the
statuses. Setting offset to 0 and count to 1, causes the method to return only the most
recent status, while setting count to -1 causes it to return all the statuses.
getRecentErrors(int drId, int offset, int count) This function returns an object
containing a list of the recent errors of the specified Datarec unit and the Datarec unit’s geographical location. The parameters works in the same fashion as described above.
getAllDataRecUnits() This function returns an object containing a list of all the
Datarec units in the Nortraf database.
In order to increase portability of the web service, the support for different database
drivers were added. The customer uses Oracle database, but since a MySQL database
was more familiar and accessible we decided to create drivers for both Oracle and MySQL.
In this way we could use MySQL while testing and the customer could set up the system
to use their Oracle database. The complete design of the Web Service is presented in
Appendix D: Design, section D.3.
6.4.4
Web Page
The customer requested that the data gathered from the roadside installations should
be presented on a web page. The web page includes a map where the locations of the
errors are marked. The web page also has the functionality to show state and error logs.
The information required for implementing this functionality is given on demand from
the Web Service.
The Web Service offers four methods to the Web Page, more information about them can
be found in section 6.4.3. When the page is loaded, it uses these methods to get information about errors, warnings and locations. The customer required that the connection
between the Web Page and the Web Service should communicate using XML(3.5), the
connection was therefore implemented using SOAP-XML(3.5). Using NetBeans as the
IDE made it easy to implement the SOAP Client, because the generated WSDL file from
the Web Service makes NetBeans able to set up a JAX-WS client automatically. This
makes the methods that the web service offer act as if they were on a local object.
The Web Page, including its logic, is implemented using Java(3.5), Java Server pages,
JavaScript and HTML. It runs on a GlassFish server, which is a server-software from
68
Chapter 6. Sprint 1
Oracle implementing the Java6 Enterprise Edition platform. This makes it easy to hide
some of the logic from the web page itself, and let the Web Page only handle the presentation. The map is implemented with map data from Statens Kartverk, as suggested by
the customer. The map is presented using the OpenLayers library, which makes it easy to
add maps to web pages, and also offers easy access to features like markers and zooming.
The implementation design of the Web Page component can be found in Appendix D:
Design, section D.2 and screenshots of the page can be found in section ??.
6.4.5
Error Handler
The Error Handler had to consist of four parts. A part that:
• communicates with the ONSITE server – subscribing to status events and receiving
status notifications.
• converts the incoming status notifications to a recognized format.
• detects errors.
• inserts statuses and errors into the database.
The customer wanted us to mimic an OPC server’s behavior by mocking up a subset of its
functionality. For this reason the part that communicates with the ONSITE server had
to be an OPC client. At this point we did not know how to actually implement an OPC
client, so we just added a class that would encapsulate the functionality of communicating
with the OPC server. The implementation of the Error Handler was scheduled for sprint
2, hence we still had some time to figure out the details.
When the OPC client receives a status notification it uses a converter to transform the
notification to a recognized format, before passing the notification to the error handler.
The error handler uses several status checkers to determine if there are any errors, before
inserting the status and possible errors into the database. The complete design of the
Error Handler is presented in Appendix D: Design, section D.4.
6.5
Sprint 1: Testing
This section describes the testing of each of the components that were finished during
Sprint 1. The components that were finished were the Datarec Database, the Web Service,
the datafetcher from Datarec 7 and the Web Page. The Web Page, Web Service and the
database were located at different computers at the time of the testing, to ensure that
the system also is capable of working with the components being set up at different
locations.
69
Chapter 6. Sprint 1
6.5.1
Web Page
While developing the Web Page, it was tested using Mockito to mock up the Web Service.
It was needed to mock up the Web Service, since the Web Service was not created by
the time we started implementing the Web Page. The testing of the Web Page differs
a bit from the rest of the system, due to the fact that unit tests were not significantly
used. This means that the testing had to be done more comprehensively, to ensure that
the Web Page was error free. The fact that unit testing was not used significantly, made
it crucial to find another way to test the smaller parts of the system. The testing of the
Web Page was done by trying to make it fail, by giving it what was considered to be
potential harmful input.
Input
Select a unit
Jump to location
Open Datarec information of a unit not
shown on the map
Move map with mouse
Result
Passed
Passed
Passed
Comment
Worked properly
Worked properly
This test failed first time(NullPointerException) it was
run, but passed after some debugging
Passed Worked properly
Table 6.4: Tests Performed on the Web Page
During the testing, the test person found a NullPointerException error in the Web Page
when referring to an ID which was not contained in the database. That needed to be
fixed before the test could be retaken. The fixed Web Page passed the test, and was
ready for module tests. The Web Page was supposed to fulfill the requirements that
involved:
• Display unit information
• Show location of roadside installations on a map
• Display state logs for units
Therefore they had to be tested with T01, T02 and T03. The full description of the test
can be found in appendix A.
70
Chapter 6. Sprint 1
Test Id Result Comment
T01
Passed The test went without any irregularities. The test is passed because the
expected output matches the real output. The Web Page was slow during
the test with the system integrated.
T02
Passed The Web Page behaved like it was supposed to. In this test the Web
Page also was slow, but that is documented in T01
T03
Passed The test went without any irregularities. The Web Page was slow during
the test with the system integrated
Table 6.5: Web Page Test Cases
After the Web Page was accepted as a component, we integrated the Web Page with the
database and the Web Service. Then it had to be tested if the integration had affected
the behavior of the system, and all the tests needed to be redone. The tests confirmed
that the integration had been successful. But the Web Page was rather slow after the
integration. We suspected that this was because of the database, which was at that
moment located at a rather slow connection in USA.
6.5.2
Web Service
The Web Service was developed using a TDD-model. This implies that the functions in
the Web Service have been tested a lot.
This table contains module testing for the Web Service, that tests whether the Web
Service fulfills its requirements. More detailed information about the tests can be found
in the appendix A A.4.
71
Chapter 6. Sprint 1
Test Id Result Comment
T04
Passed The coordinates were placed in our database, which means that the connection to the Nortraf database would not be tested in this test. This
was due to the fact that we did not have access to the Nortraf database.
But the system was successfully able to give the correct coordinates, and
was considered successful.
T05
Passed The tester was successfully able to set up a working connection between
the Web Page and the Web Service using SOAP. The tests were carried
out both by running the server and the client on one single computer,
and by running them on separate computers. The test went without any
irregularities, and was accepted.
T06
Passed The system was able to get the status messages and the error messages
successfully. This implies that the communication between the database
and the Web Service worked appropriate, and the test was successful.
T07
Passed The errors and warnings are separated in the database by a flag. The
Web Service gets this flags and sets it “w” for warning and “e” for errors.
The system was successful in this task, and it was possible to distinguish
between errors and warnings.
Table 6.6: Web Service Test Cases
The Web Service has also been tested with extensive use; the Web Service was running
during testing of the Web Page. Even though we were not looking for any specific
problems, these tests thoroughly tested whether the Web Service contains errors that
we did not plan for. During these tests, it was found that the Web Service handled the
database being empty in a poor manner, and that had to be fixed.
6.5.3
Database
This section includes documentation of the testing process of the database. The database
was mostly tested by simply using it. We never encountered any problems with the
database we set up. The database was the first component we implemented fully, and
there have been calls to the database since. The database is part of FR13 and FR14, and
T08 found in Appendix A, is testing whether the database fulfills the requirements.
72
Chapter 6. Sprint 1
Test Id Result Comment
T08
Passed The Database was working correctly. It is possible to store and get
data from the database in the appropriate way. The test is therefore
considered to be successful.
Table 6.7: Database Test Cases
6.5.4
Datarec 7 SOAP Client
This section includes documentation of the testing process of the SOAP client. The
Datarec 7 SOAP is located at the ONSITE server and is the only part communicating
directly with the Datarec 7. The client was developed using a TDD-model, and is therefore tested during development. At the early phases of the development, the Datarec 7
was mocked-up, because it was important to isolate the problems to being on the client
itself. During testing of the component, it became clear that the Datarec 7 responds very
slowly.
The Datarec 7 SOAP Client is part of FR1 and FR2 in the requirement specification.
The following tests were applied to make sure that the requirements are fulfilled. A more
detailed description of the test can be found in Appendix A.
Test Id Result Comment
T09
Passed The system gets the right result from the Datarec 7, but the process
of fetching data is a bit slow. The hardware uses 3-5 seconds when
it responds to requests from the SOAP client. We think this happens
because of the overhead that comes with using SOAP. The converting
to XML and setting up HTTP takes some time, and the hardware in
the Datarec 7 is slow. We considered the problem to be unsolvable, and
therefore simply accepted the poor result.
Table 6.8: Datarec 7 SOAP Client Test Cases
6.5.5
Testing the Integration of the Database, the Web Service
and the Web Page
This section describes the testing process involving the integration of the Datarec Database,
the Web Service and the Web Page. From now, these components combined are referred
73
Chapter 6. Sprint 1
to as the front end.
The front end was tested in sprint 1, because it does not have any dependencies on the
other parts of the system. The Web Service pulls the data from the Datarec Database
on request from the Web Page. To test the front end, we integrated the three parts and
prepared them to run as a system. Since changes in the database should cause the Web
Page to change, we tested it by changing the information in the database, and checking
how well the Web Page reacted to this. We tried this technique with various different
inputs. At the end of sprint 1, the front end seemed to be working to satisfaction. At
least from what we could tell, as we had to manually add input to the database, instead
of getting it automatically from the implementations that would handle this job in the
future. The front end would have to be tested in pair with the rest of the system in
Sprint 3 before we could know for sure.
6.6
Sprint 1: Review
When this sprint started, we were a little afraid of coming further behind schedule.
The reason for this was mainly due to the lacking man-hours we had up till that point.
Over the three weeks the sprint lasted, we only got 25 hours behind schedule. This was
estimated using a burndown chart. We thought this was a successful sprint, since we still
had problems with reaching the estimated weekly hours and during the last week of the
sprint only had 5 group members that worked.
74
Chapter 6. Sprint 1
Sprint 1 burndown chart
500
450
400
350
H
o
u
r
s
300
Remaining hours
250
Ideal path
200
150
100
50
0
0
1
2
3
4
5
6
7
8
9
10
11
12
13
14
15
Days
Figure 6.1: Sprint 1 Burndown Chart
As the burndown chart shows, the work started off at a slow start in sprint 1. During the
last period of the sprint, the level of efficiency increased. This was partly because of a
clearer delegation of tasks and members working from home. In this case, working from
home improved our efficiency since less of the work time was used for idle chatting.
One of the reasons this burndown chart does not show a straighter line is that we try to
avoid working in the weekends. On the end it was also partly affected by a delivery in
another course for some of our group members.
6.6.1
Sprint 1: Positive Experiences
• Got close to everything done
• The implementation parts were done effectively
Even with our person-hours problem we got very close to everything done. That was
good, since the hours lost would have to be placed into sprint 2.
6.6.2
Sprint 1: Negative Experiences
• Not very effective work on the report
75
Chapter 6. Sprint 1
• Should have delegated work better
• Some people did not participate as much as expected
• Lack of person-hours
The work on the report was slow and ineffective because the tasks that were focused on
were to try to fill out parts already written. This is tedious work, and often leads to it
being ineffective.
The delegation of work should have been better. And also the ability to come up with
new tasks or sections to write about in the report. This would have made this sprint
more effective and productive.
Some group members did not participate in the project as much as they should have. As
the continuously low weekly man-hours suggest, we have a seemingly permanent problem
with a couple of group members that are not working enough, and the last week of sprint
1 went by with five working members.
The lack of person-hours was our biggest problem in sprint 1. This increased the workload
for other group members, and also brought with it some irritation. Other than that there
were no big issues during the first sprint.
6.6.3
Sprint 1: Planned Actions
• A better delegation of work
• Delegate tasks to specialized group members
We realized that we had to be better at delegating tasks. We decided that we would find
out what every group member is good at, and pick who does what based on that. Also,
by improving our delegation of tasks, we hoped that the group members that did not
work enough would start doing what they are supposed to if we would just force some
work tasks on them. This would hopefully improve the efficiency of the group in general
and lead to more work being done.
6.7
Sprint 1: Feedback
Friday October 14th we presented the results from sprint 1 for the customer. The customer representative on this meeting was Jo Skjermo, the usual representative.
At the meeting, the customer representative expressed that the project so far looked
good. He had some feedback for the Web Page and the graphical user interface there. He
wanted to introduce different frames to the user interface. The reason for these different
frames was to make the map’s position static, while the information about the Datarec
76
Chapter 6. Sprint 1
unit can be scrolled through at will. Other than that the customer representative came
with some suggestions on how to make the errors easier to recognize and make it easier
to read the information.
77
7
Sprint 2
Contents
7.1
Sprint 2: Sprint Goals
. . . . . . . . . . . . . . . . . . . . . .
76
7.2
Sprint 2: Sprint Backlog . . . . . . . . . . . . . . . . . . . . .
76
7.2.1
Sprint 2 Backlog Table . . . . . . . . . . . . . . . . . . . . . . .
76
7.2.2
Comments on the Sprint 2 Backlog Table . . . . . . . . . . . .
77
7.3
Sprint 2: Main Deliverables . . . . . . . . . . . . . . . . . . .
77
7.4
Sprint 2: Design and Implementation . . . . . . . . . . . . .
78
7.5
7.4.1
ONSITE Server . . . . . . . . . . . . . . . . . . . . . . . . . . .
78
7.4.2
Error Handler . . . . . . . . . . . . . . . . . . . . . . . . . . . .
78
Sprint 2: Testing . . . . . . . . . . . . . . . . . . . . . . . . . .
7.5.1
7.6
7.7
Error Handler . . . . . . . . . . . . . . . . . . . . . . . . . . . .
Sprint 2: Review . . . . . . . . . . . . . . . . . . . . . . . . . .
79
79
80
7.6.1
Sprint 2: Positive Experiences . . . . . . . . . . . . . . . . . . .
81
7.6.2
Sprint 2: Negative Experiences . . . . . . . . . . . . . . . . . .
82
7.6.3
Sprint 2: Planned Actions . . . . . . . . . . . . . . . . . . . . .
82
Sprint 2: Feedback . . . . . . . . . . . . . . . . . . . . . . . . .
83
The second sprint phase in the Scrum period started in week 41, and was planned to
last for two weeks. During sprint 1 we had implemented functionality for saving data in
a database, continuously fetching data from the Datarec 7, showing location on a map
service, and displaying unit information and state logs for said units. In addition to this
we had finished setting up the web service. In other words, all the planned items from the
sprint 1 backlog had been successfully implemented, except for the ”Detect errors”-item.
Consequently, this item was carried over to sprint 2.
7.1
Sprint 2: Sprint Goals
The main goals for sprint 2 were to implement most of the error handler and the on-site
server. When the sprint started we thought we were going to implement an OPC server,
but midway into the sprint, we had to change some requirements, and our sprint goal
became to implement most of the ONSITE server instead. Since sprint 1 was not quite
done, some parts had to be moved into the start of sprint 2. The new plan was to finish
the part from sprint 1 as fast as possible.
We predicted that the ONSITE server and error handler would be very time consuming,
especially the server. That is reflected through the fact that we have allocated more time
to the implementation of the server than the error handler.
Chapter 7. Sprint 2
7.2
Sprint 2: Sprint Backlog
This section presents the backlog with documentation for sprint 2.
7.2.1
Sprint 2 Backlog Table
The numbers in the backlog table represents person hours that we have planned to spend
on each item in the list.
Story Story / Task
ID
11
11
On-site server
Design
Test plan
Code
Test
Error handler
Code
Test
SUM
Week 1
M
T
20
20 20
10
12
3
35
W
7 5
1 0
28 35
Week 2
T
F
M T
W
T
5
9
1
8
2
17
3
17
3
16
4
9
1
7
1
28
12
3
35
7
1
28
15 23
3 5
28 28
15 21
5 4
35 35
F
Table 7.1: Sprint 2 Backlog
7.2.2
Comments on the Sprint 2 Backlog Table
The ONSITE server is the most extensive part of the whole project. And it is also
the main goal for this sprint, even though we did not plan to finalize it in this sprint.
The reason for putting 60 hours into the design of the ONSITE server, is that the server
should offer some advanced features and therefore needs a carefully chosen design to work
appropriately. The Error Handler and the ONSITE server should communicate with each
other, and this feature was planned to be implemented by the first week.
7.3
Sprint 2: Main Deliverables
The main deliverable for sprint 2 was the implementation of the Error Handler. More
explicitly, the deliverable parts of the Error Handler were to make it able to receive error
79
Chapter 7. Sprint 2
messages from the on-site servers, get a list of all the roadside installations from the
NorTraf database and create warnings on errors and distinctive data. table 7.2 shows the
functional requirements (FR7, FR8, FR9, FR10, FR11 and FR12) this implementation
fulfilled.
ID
Description
12. Set up the Error handler
FR7 The Error Handler should be able to receive messages from the
on-site servers.
FR8 The Error Handler should be able to register itself as a listener to
the on-site servers .
FR9 The Error Handler should get a list of all the roadside installations
and their IP addresses from the NorTraf database abstraction level.
FR10 The system should use the data from on-site server to detect peculiar data, loop failures, hardware errors or wrong hard-wiring.
FR11 The errors should be separated from the regular data messages.
FR12 The Error Handler should create warnings on irregularities and peculiar data.
Priority
High
High
High
High
High
High
Table 7.2: Functional Requirements Sprint 2
7.4
Sprint 2: Design and Implementation
This section presents the design and implementation of the ONSITE Server and Error
Handler.
7.4.1
ONSITE Server
For the implementation we decided to go with GlassFish server, a server-software from
Oracle implementing the Java6 Enterprise Edition platform, and normal java desktop
programs running on the same computer. The server runs the web service used for
communicating over SOAP. This allows us to handle SOAP-calls fairly transparently,
enabling us to use SOAP-calls like normal Java methods. The downside of using a server
like GlassFish is that web services lack a main method like Java desktop applications
have. This meant that we could not have a loop continuously pulling data from the
Datarec hardware, which the customer required. To get around this we made a normal
desktop application running a loop that pulls statuses from the hardware, then calls a
SOAP-method for every client that is registered with the server. Clients register through
the Web Service, which then sends the info needed to the desktop application through
sockets. The complete design of the ONSITE server is presented in Appendix D: Design,
80
Chapter 7. Sprint 2
section D.6
7.4.2
Error Handler
The schedule for sprint 2 was to implement the design created in sprint 1, but after some
suggestions of changes from the customer, we redesigned parts of the Error Handler. The
new design was more complex than the initial design, but the new suggestions can only
be partly blamed for this. While redesigning, we added parts that were thought to make
the Error Handler more useful.
What we called OpcClient in the initial design is now separated into two parts:
Subscriber is a JAX-WS SOAP client that handles the subscribing to and unsubscribing from status events on the ONSITE servers.
ErrorHandlerService is a JAX-WS web service that is used to receive status notifications from the ONSITE servers. When it receives a notification it uses the converter
to transform the notification into a recognized format, before sending the notification to
the Error Handler through a local socket connection.
The reason we did this is that we needed to mimic an OPC server’s ability to push
notifications, and since the customer wanted us to use SOAP XML as message passing
we decided to use web services. While a web service would solve the task of receiving
status notifications, checking for errors and inserting them into the database, it would
not be able to subscribe to the events. At this point we had decided that it would be
best if the user of the system could manually specify which units to subscribe to, and for
this we needed a GUI.
The Error Handler is now a standalone application with a GUI. It has a SOAP client that
handles subscribing to events, and a socket server that listens for incoming connections
from which to receive status notifications from the Error Handler Service. In order to list
all the available Datarec units to subscribe to, we had to create a database connection
to the NorTraf database. While doing this, we decided to adapt the support for different
database drivers, as we did with the Web Service implemented in sprint 1.
The complete design of the Error Handler and ErrorHandlerService is presented in Appendix D: Design, section D.4.
7.5
Sprint 2: Testing
The Error Handler was the only component which was supposed to be finalized during
sprint 2. Even though the test plan for the ONSITE server was constructed during sprint
81
Chapter 7. Sprint 2
2, the documentation of the testing is included in the testing chapter in sprint 3 (section
8.5).
7.5.1
Error Handler
It was initially planned to test the Error Handler during sprint 2. But due to delays in the
implementations, the actual testing was not completed before sprint 3. The Error Handler
was developed using the TDD technique, which means that it had gone through testing
during the development phase. The Error Handler had three major parts that needed
testing; the connection to the ONSITE servers, the detection of errors and inserting errors
and warnings into the database. These features correspond to the requirement identified
in chapter 4.
T10,T11 and T12 tested these features. The tests can be found in Appendix A.
Test Id Result Comment
T10
Passed The setup with the ONSITE server worked satisfactorily, and the connection was successfully set up. The Error Handler successfully received
the message from the ONSITE server. The testing of whether the Error
Handler was able to get the IP address from the NorTraf database was
hard to check in a satisfactory way, because the database we got from the
costumer only had telephone numbers stored. We added the IP address
manually to make it possible to test, and then it was successful. Another
issue is that we did not have access to the real NorTraf database during
the project, so the costumer needs to test this feature themselves with
access to the database. The error handler is equipped with Oracle drivers
(the NorTraf database is an Oracle database), so this should be working properly. Since this feature was fully functional on our prototype, it
should be working on their system as well, and is therefore considered
successful.
T11
Passed The error handler successfully recognized the errors and added them into
the database. The test is therefore considered successful.
T12
Passed After the test was completed, the only data that was added in the
database was the error and warning messages. This implies that the
test was successful, and had passed. The error handler shows the correct
behavior.
Table 7.3: Error Handler Test Cases
82
Chapter 7. Sprint 2
7.6
Sprint 2: Review
At the start of second sprint, we were in quite good spirits, even with the problems we
had with lazy evasive group members and the slight lag in schedule. Sprint 2 did not
go quite as smoothly as we had hoped, however. At the end of week 41, which was the
first week of the sprint, the group and the customer came to the conclusion that a major
requirement had to be changed. The server that was to run on the on-site laptop was
supposed to be using OPC. Sadly OPC could not push, which mean that we had to figure
out something else. This was a major set back.
Because of this, we would need to have a server and a client on each side, both in the
ONSITE server and at the Error Handler. This meant that the requirements would take
longer to implement than planned, and resulted in an even more delayed finish of the
second sprint.
Sprint 2 burndown chart
350
300
250
H
o
u
r
s
200
Remaining hours
150
Ideal Path
100
50
0
0
1
2
3
4
5
6
7
8
9
10
Days
Figure 7.1: Sprint 2 Burndown Chart
As the burndown chart shows, the level of efficiency was good. Due to the OPC and server
problems, and the major setback, we got about 80 hours behind schedule. Hopefully this
will be finished during the first week of sprint 3, but will probably make it necessary to
drop some of the lesser requirements for the system.
83
Chapter 7. Sprint 2
7.6.1
Sprint 2: Positive Experiences
• More commitment from certain group members
• The delegation of tasks was better during this sprint
• The daily Scrum meetings
• Customer happy with Sprint 1
• The amount of person hours have increased
The persons that have not worked enough earlier are now starting to contribute a bit
more. This means that the group at last is starting to get closer to the estimated amount
of person hours each week.
A better delegation of tasks, together with more hours, made this a more successful sprint
in form of management.
The daily Scrum meetings started to pay off. We got a better overview of what was being
done, what needed to be done and the rate of work done. It was also helpful in delegation
of work and setting deadlines.
The customer seemed happy with what had been done in sprint 1. He had some feedback,
but was overall happy with the result.
The amount of person hours increased during the second sprint. The last week we
combined worked for 145 hours, which is much better than what has been done previously.
7.6.2
Sprint 2: Negative Experiences
• Still struggling with reaching estimated person hours
• The first week - low amount of person hours
• Trouble with the OPC
The estimated amount is still out of our reach, even though we are getting closer.
The first week had a low amount of person hours. With under 100 hours worked, we
lacked nearly half the estimated workload. The reasons for this was that some of the
students did not put in enough work, and several students were ill.
We could not use the OPC standard quite as planned. Instead we had to make our own
kind of server which mimics the OPC standard. The reason for this was that OPC is
unable to push data. This set us back a bit, and made the sprint harder and more time
consuming.
84
Chapter 7. Sprint 2
7.6.3
Sprint 2: Planned Actions
• Even better at task delegation
• Increase the total amount of hours worked even more
There is always room for improvement, and this group is no different. With a better and
more even delegation of tasks, the progress should get better and more steady. There
is also room for improvement with regard to the hours worked each week. Our hope is
to get everyone at least over 20 hours for the next week. This should also increase the
amount of actual work done, which makes us able to catch up a bit to the plan.
7.7
Sprint 2: Feedback
The first customer meeting after the sprint 2 period was Friday 28th of October. Consequently this was the meeting where we presented the implementations from sprint 2 for
customer representative Jo Skjermo.
Due to the changes in the requirements that happened midway through the sprint, we did
not quite manage to finish the implementations that we had planned for. The separate
parts of the system were all finished, but they had not yet been integrated with each other.
It had turned out to be slightly harder than expected. We explained how the servers and
clients would communicate with each other, and the customer was very understanding
of the situation that we were in, and seemed content with what he was shown. It was
agreed that we would present the complete ONSITE server/client and Error Handler
implementations a week later.
85
8
Sprint 3
Contents
8.1
Sprint 3: Goals . . . . . . . . . . . . . . . . . . . . . . . . . . .
84
8.2
Sprint 3: Sprint Backlog . . . . . . . . . . . . . . . . . . . . .
84
8.2.1
Sprint 3 Backlog Table . . . . . . . . . . . . . . . . . . . . . . .
84
8.2.2
Comments on the Sprint 3 Backlog Table . . . . . . . . . . . .
85
8.3
Sprint 3: Main Deliverables . . . . . . . . . . . . . . . . . . .
85
8.4
Sprint 3: Design and Implementation . . . . . . . . . . . . .
86
8.5
Sprint 3: Testing . . . . . . . . . . . . . . . . . . . . . . . . . .
86
8.6
8.7
8.5.1
ONSITE Server . . . . . . . . . . . . . . . . . . . . . . . . . . .
86
8.5.2
Complete System Test . . . . . . . . . . . . . . . . . . . . . . .
87
Sprint 3: Review . . . . . . . . . . . . . . . . . . . . . . . . . .
87
8.6.1
Sprint 3: Positive Experiences . . . . . . . . . . . . . . . . . . .
88
8.6.2
Sprint 3: Negative Experiences . . . . . . . . . . . . . . . . . .
89
8.6.3
Sprint 3: Planned Actions . . . . . . . . . . . . . . . . . . . . .
90
Sprint 3: Feedback . . . . . . . . . . . . . . . . . . . . . . . . .
90
The third and last sprint phase in the project period started in week 43. The planned
duration for this sprint was two weeks. Sprint 2 was designated to make the on-site server
and client. The second sprint was, due to some complications, behind schedule. This
made us skip some of the lesser requirements for sprint 3 to be sure we would finish the
most important parts of the project in time. The requirements that in the revised plan
were to be done in sprint 3 were the ONSITE server and client, installation guide, design
of web interface and the automatic notification by sms and mail.
8.1
Sprint 3: Goals
The main goals for sprint 3 were to finish the implementation of the ONSITE server and
client, which is the most important part of our system implementation. The installation guide, the web interface design and the automatic notification comes in addition to
this.
With the problems in sprint 2, the server and client part turned out to be very time
consuming. This can also be seen in the backlog, where the server and error handler,
which is a part of the client, has been prioritized with about 55 percent of the allocated
time in the backlog.
Chapter 8. Sprint 3
8.2
Sprint 3: Sprint Backlog
This section presents the backlog with documentation for sprint three.
8.2.1
Sprint 3 Backlog Table
The numbers in the backlog table represents person hours that we have planned to spend
on each item in the list.
Story Story / Task
ID
11
13
9
6
Week 1
Set up the ONSITE server
Code
Test
Error Handler
Code
Test
Create installation guide
Write
Design web interface
Design
Code
Test
Automatic notification
Design
Code
Test
SUM
Week 2
M
T
W
T
F
M
T
12
3
12 12
3 3
12
3
25 25
5 5
30
12
3
12 10
3 5
15
W
T
20
20
F
10
5
5
30
30 30
30
30 30
30 40
5
13 20
2 5
40 25
Table 8.1: Sprint 3 Backlog
8.2.2
Comments on the Sprint 3 Backlog Table
The server is again the main part. This is due to its importance in the overall function
of the prototype. The second most important part of the third sprint is the creation of
the installation guide, since this will take some time. The design of web interface and
87
Chapter 8. Sprint 3
the automatic notification is something that can be done quite quickly, so they are not
heavily prioritized.
8.3
Sprint 3: Main Deliverables
The deliverables for this sprint is the finished prototype, meaning all the components had
to work together. To make this work, the developers finished the ONSITE server. With
this finished, functional requirements FR3, FR4 and FR5 were fulfilled. See table 8.2 for
reference to these requirements.
ID
Description
11. Set up the on-site server
FR3 The server on-site should mimic a subset of the OPC functionality
FR4 The server on-site should be able to register listeners.
FR5 The server on-site should be able to push data.
Priority
High
High
High
Table 8.2: Functional Requirements for the ONSITE Server
8.4
Sprint 3: Design and Implementation
The design for both ONSITE server and Error Handler was finished in sprint 2, so sprint
3 was dedicated to carry out the rest of the implementation and testing.
8.5
Sprint 3: Testing
This chapter explains the testing done during sprint 3. The ONSITE server was finished
during sprint 3, and needed extensive testing. In the end of this sprint, the whole system
was finished, which means that we had to integrate all parts of the system to check if it
worked together as a unit.
8.5.1
ONSITE Server
The final testing of the ONSITE server was done in the last week of sprint 3. The
ONSITE server is the server that connects to the Error Handler, and automatically
forwards messages from the Datarec 7. The most important part that needed testing was
to make sure that the system was able to push messages, and that the ONSITE server
could establish a connection to the Error Handler.
88
Chapter 8. Sprint 3
T13 involves the ONSITE server, T13 can be found in Appendix A.
Test Id Result Comment
T13
Passed The reason for using a mocked up Datarec 7 SOAP client instead of
a real Datarec 7, is that we had no way to produce the error at the
Datarec 7 location. The test went without problems, the connection
to the Error Handler was successfully established and the pushing was
working satisfactorily. This also suggests that the Error Handlers part is
working according to plan. The test was considered successful.
Table 8.3: ONSITE Server Test Cases
8.5.2
Complete System Test
This section describes the testing that was performed when the entire system was finished.
The testing of the system was delayed to after sprint 3, because of the delays in the
implementation. When the testing was supposed to be performed, the connection to the
roadside hardware failed. Therefore we had to go and get the roadside installation from
its location, and place it on the graphics lab at NTNU. This happened in the last week
of the project, which meant that the system did not have much time to be completely
tested. The Database, Web Service and Web Page were tested together in sprint 1, but
the testing of the integration of the system had been limited.
During the time the connection to the roadside hardware was unavailable, some limited
testing was done using a mock up that included a simulation of multiple roadside hardware, and using a black-box test where the user was using the Web Page and the Error
Handler GUI. The mock-up produced status messages every 10 seconds, with a 25% probability of the status to be an error. This led to the discovery of some problems with the
integration of the system, but the problems were all successfully fixed.
Ideally, the testing should have been performed with multiple real pieces of hardware (that
were actually installed roadside), with the possibility to produce errors by for instance
pulling out the cables of the hardware. But due to the problems that occurred, we did
not have time for a proper final testing. This means that the prototype developed may
not be completely faultless.
89
Chapter 8. Sprint 3
8.6
Sprint 3: Review
The third, and last, sprint contained the rest of the second sprint, and some lesser requirements. The ONSITE server, which was what did not get completed in sprint 2, was
the most important part of the third sprint. The lesser requirements that were included
in sprint 3:
• Design web interface
• Create installation guide
• Automatic notification
Due to the delay from sprint 2, some of the lesser requirements were not included in the
backlog for sprint 3.
Sprint 3 burndown chart
350
300
250
H
o 200
u
r 150
s
Remaining hours
Ideal Path
100
50
0
0
1
2
3
4
5
6
7
8
9
10
Days
Figure 8.1: Sprint 3 Burndown Chart
As the burndown chart shows, the sprint was a bit behind schedule. When this sprint was
at an end, it was closer to the plan than the second sprint. Due to the ONSITE server we
had to skip some lesser requirements, and that includes the Automatic notification, which
was in the sprint backlog. Since the Automatic notification and installation guide was not
90
Chapter 8. Sprint 3
completed, the sprint ended with about 50 hours left. The installation guide is something
that will have to be done during the last two weeks before the presentation.
8.6.1
Sprint 3: Positive Experiences
• Specific deadlines
• Better delegation
• Delegated chapters
• Increase of work hours
We have started with specific deadlines for all tasks. This made it easier to see the
progression of the work and also put pressure on the students that have not involved
themselves in the project. Due to this, the effect is that the efficiency of the work is
increased a bit.
The delegation has been improved again. It is partly due to the deadlines, which makes it
easier to assess when someone would need new work and have finished their tasks.
We started to delegate chapters in the report, to have people that are responsible to
control the overall flow of the chapter and check the correctness of the text written.
There was an increase in the total work hours.
8.6.2
Sprint 3: Negative Experiences
• Replanning of sprint 3
• The implementation of the ONSITE server
• Fake hours
• Leftovers
• Customer presentation
• OPC problems - no push
• Wrong priorities
We had to replan the third sprint due to the delays in the server-client part of sprint
2.
The ONSITE server took much more time than expected.
From the work done and the hours written, and explained in mail, there seems to be
quite a few “fake” person hours.
91
Chapter 8. Sprint 3
There were some leftovers from this sprint. This includes Oracle database drivers for the
Web Service, timeout error check, installation guide and to bundle stuff together.
Sadly the presentation for the customer was not as it should have been, due to the fact
that we had to use a mock-up of the Datarec and that the computer which was showing
the web page was partially damaged.
As explained in the sprint 2 chapter, the OPC did not have the ability to push. Therefore
we decided to make a server and client on both sides. This set us back quite a bit, and
lead to the third sprint having to cover work tasks that were planned for the second
sprint.
There are still a couple of students in our group that are not involving themselves enough
in our project. This affects the group as a whole. It affects both our team spirit and
increases the workload for the rest of the group.
8.6.3
Sprint 3: Planned Actions
This is the last sprint, so the planned actions are for the last weeks of the project and
good ideas to take to other projects.
• Continue with deadlines
• Continue to increase hours worked
• Increase productivity in the report
Since the deadlines have had such a good effect, we are going to continue with this.
As the project is getting closer to the end, and there is still a lot to do, the amount of
hours will have to increase even more.
At this point in our project process we decided to make a new ”chapter delegation system”
that is further described in section 2.4.5. We hope to increase the productivity in the
report writing, since certain parts of our report is still quite lacking.
8.7
Sprint 3: Feedback
The customer was very understanding when the reason for the delays and missing requirements was explained. He seemed to be satisfied with what he was shown. The customer
were shown the system working with a mock-up of the Datarec. The design of the Web
Page was also shown, but due to a partly damaged screen on the laptop that we used
to show the Web Page to the customer, it was not easy for him to see anything. We
promised the customer that for the next meeting, we would show him the Web Page on
a computer with a working screen.
92
9
User Guide
Contents
9.1
9.2
9.3
9.4
ONSITE Server . . . . . . . . . . . . . . . . . . . . . . . . . .
91
9.1.1
Installation . . . . . . . . . . . . . . . . . . . . . . . . . . . . .
91
9.1.2
Usage . . . . . . . . . . . . . . . . . . . . . . . . . . . . . . . .
92
Error Handler . . . . . . . . . . . . . . . . . . . . . . . . . . .
92
9.2.1
Installation . . . . . . . . . . . . . . . . . . . . . . . . . . . . .
92
9.2.2
Usage . . . . . . . . . . . . . . . . . . . . . . . . . . . . . . . .
94
Web Service . . . . . . . . . . . . . . . . . . . . . . . . . . . . .
96
9.3.1
Installation . . . . . . . . . . . . . . . . . . . . . . . . . . . . .
96
9.3.2
Usage . . . . . . . . . . . . . . . . . . . . . . . . . . . . . . . .
97
Web Page . . . . . . . . . . . . . . . . . . . . . . . . . . . . . .
97
9.4.1
Installation . . . . . . . . . . . . . . . . . . . . . . . . . . . . .
97
9.4.2
Usage of the Web Page . . . . . . . . . . . . . . . . . . . . . .
98
In this section the installation and use of each part of the system is presented. The
delivered system has installation scripts for all the separate parts.
9.1
ONSITE Server
In this section the installation and use of the ONSITE server is presented.
9.1.1
Installation
The ONSITE server consists of two parts:
DrRegisterNotifications is a web service that handles subscription requests. It uses
GlassFish as application server, so it requires that GlassFish and Java EE is preinstalled.
The install script also requires that the Java/bin directory is placed in the PATH environment variable.
DrNotificationPusher is a standalone Java application that receives subscription
requests from DrRegisterNotifications while continuously fetching the status from the
Datarec unit and pushing notifications of changes to the subscribers. The DrNotificationPusher requires that Java is preinstalled.
Both these parts are configured and installed by running the belonging install script
setup.bat. The scripts needs to be run as Administrator to be able to complete the setup.
Chapter 9. User Guide
During the setup the user has to enter the installation directory of GlassFish, domain
name and instance port number of the GlassFish instance and the port number to use
to forward subscription requests from DrRegisterNotifications to DrNotificationPusher.
The reason for having to specify the port number of the local socket connection is to
ensure that it is not used by another application.
The two parts also has a configuration file. This configuration file specifies the port
number to use when forwarding subscription requests and which events that can be
subscribed to. The configuration file is automatically created while installing, but can
be altered at any time later to change the settings of the ONSITE server. A reboot is
required to apply the changes.
# ONSITE S e r v e r c o n f i g
p o r t = 11111
e v e n t s = UNIT STATUS CHANGED EVENT
Listing 9.1: Example - Configuration file for the ONSITE server
After the setup is complete, an uninstall script is created. This can be used to remove
the installed system. The uninstall scripts needs to be run as Administrator to be able
to remove all the parts of the system.
9.1.2
Usage
After installing, the ONSITE server runs on its own. There is no need for further interaction with it. Just make sure that it is running and that the router is properly configured
to allow access to the DrRegisterNotifications web service.
9.2
Error Handler
In this section the installation and use of the Error Handler is presented.
9.2.1
Installation
The Error Handler consists of two parts:
ErrorHandlerService is a web service that receives status notifications from the ONSITE servers. It uses GlassFish as application server, so it requires that GlassFish and
Java EE is preinstalled. The install script also requires that the Java/bin directory is
placed in the PATH environment variable.
94
Chapter 9. User Guide
ErrorHandler is a standalone java application that receives status notifications from
the ErrorHandlerService, checks if there are any errors and inserts the statuses and
possible errors into the Datarec database. It also has the functionality to subscribe to
and unsubscribe from status events on Datarec units. The DrNotificationPusher requires
that the Java runtime is preinstalled.
Both of these parts are configured and installed by running the belonging install script
setup.bat. The script needs to be run as Administrator to be able to complete the setup.
During the setup the user has to enter the installation directory of GlassFish, domain
name and instance port number of the GlassFish instance and the port number to use
to forward status notifications from the ErrorHandlerService to the ErrorHandler. The
user also has to enter the configurations of both the Datarec and Nortraf database.
During the setup, two configuration files are generated. These configuration files contain
the information entered by the user, and can be used to change the settings of the Error
Handler at any time. A reboot is required to apply the changes.
#E r r o r H a n d l e r S e r v i c e C o n f i g
e r r o r H a n d l e r H o s t=l o c a l h o s t
e r r o r H a n d l e r P o r t =44446
Listing 9.2: Example - Configuration file for the ErrorHandlerService
The configuration file of the ErrorHandlerService consists of the host name / IP and port
number of the ErrorHandler.
#E r r o r H a n d l e r C o n f i g
d r d a t a b a s e H o s t=l o c a l h o s t
d r d a t a b a s e P a s s w o r d=password
d r d a t a b a s e P o r t =3306
d r d a t a b a s e S e r v i c e=d a t a r e c
d r d a t a b a s e S o f t w a r e=MYSQL
d r d a t a b a s e U s e r=username
n t d a t a b a s e H o s t=l o c a l h o s t
n t d a t a b a s e P a s s w o r d=password
n t d a t a b a s e P o r t =1521
n t d a t a b a s e S e r v i c e=n o r t r a f
n t d a t a b a s e S o f t w a r e=ORACLE
n t d a t a b a s e U s e r=username
l o c a l P o r t =44446
s e r v i c e P o r t =44444
s u b s c r i p t i o n T i m e o u t =600
mi nBat teryVoltage =10000
Listing 9.3: Example - Configuration file for the ErrorHandler
95
Chapter 9. User Guide
The configuration file for the ErrorHandler consists of:
• the configuration of the Datarec database
• the configuration of the Nortraf database
• the port number it should listen for incoming status notifications (localPort)
• the port number of the ErrorHandlerService
• the time number of seconds before a subscription is marked as “timed out”
• the minimum battery voltage before an error is triggered
After the setup is complete, an uninstall script is created. This can be used to remove
the installed system. The uninstall scripts needs to be run as Administrator to be able
to remove all the parts of the system.
9.2.2
Usage
After the installation is complete, a GUI will appear. This is the Error Handler, and it
has to run for the system to be able to detect errors and store errors and statuses in the
database.
Figure 9.1: Error Handler - Subscriptions
The GUI is tab based, and the first tab contains the list of subscriptions. Here you can
add and remove subscriptions. Clicking “Add Subscription” brings up a dialog.
96
Chapter 9. User Guide
Figure 9.2: Error Handler - Add Subscription
When opening this dialog, the Error Handler populates a drop down menu with all the
Datarecs available in the Nortraf database. If the Datarec unit you want to subscribe to
is not in the list, you can choose to create a custom subscription. The only thing is that
you have to specify the Datarec ID of a Datarec unit that is in the database, otherwise
the Web Service will not be able to map the statuses and errors to a Datarec unit.
The Error Handler fetches the IP of the router, that the Datarec is connected to, from
the Nortraf database. If the IP is not present, you need to specify a host name or IP
address before subscribing. You also have to specify the port number of the DrRegisterNotifications service as shown in figure 9.2, if it uses any other than the default HTTP
port 80.
Figure 9.3: Error Handler - Database Configuration
97
Chapter 9. User Guide
The next two tabs are for modifying the configuration of the databases. You can modify
all the different fields. After modifying the configuration, you have to click “Save Settings”
to save the settings.
Figure 9.4: Error Handler - Error Log
The last tab contains a text area. This text area contains detected errors and exception messages if any exceptions are caught. If the error log contains exception messages,
it means that something has gone wrong while checking for errors and inserting them
into the database. The error has to be fixed for the Error Handler to be working properly.
9.3
Web Service
In this section the installation and use of the Web Service is presented.
9.3.1
Installation
The Web Service uses GlassFish as application server, so it requires that Java EE and
GlassFish is preinstalled.
Installing the Web Service is done by running its install script setup.bat. The script
needs to be run as Administrator to be able to complete the setup. During the setup the
user has to enter the installation directory of GlassFish, domain name and instance port
98
Chapter 9. User Guide
number of the GlassFish instance and the configuration of both the Datarec and Nortraf
database.
During the setup, a configuration file is generated. This configuration file contains the
configuration of both the Datarec and Nortraf database, and can be modified at any time
to change the settings of the Web Service. A reboot is required to apply the changes.
#Web S e r v i c e C o n f i g
d r d a t a b a s e H o s t=l o c a l h o s t
d r d a t a b a s e P a s s w o r d=password
d r d a t a b a s e P o r t =3306
d r d a t a b a s e S e r v i c e=d a t a r e c
d r d a t a b a s e S o f t w a r e=MYSQL
d r d a t a b a s e U s e r=username
n t d a t a b a s e H o s t=l o c a l h o s t
n t d a t a b a s e P a s s w o r d=password
n t d a t a b a s e P o r t =1521
n t d a t a b a s e S e r v i c e=n o r t r a f
n t d a t a b a s e S o f t w a r e=ORACLE
n t d a t a b a s e U s e r=username
Listing 9.4: Example - Configuration file for the Web Service
After the setup is complete, an uninstall script is created. This can be used to remove
the installed system. The uninstall scripts needs to be run as Administrator to be able
to remove all the parts of the system.
9.3.2
Usage
After installing, the Web Service runs on its own. There is no need for further interaction
with it. Just make sure that it is running and that the router is properly configured to
allow access to it.
9.4
Web Page
In this section the installation and use of the Web Page is presented.
9.4.1
Installation
The Web Page uses GlassFish as application server, so it requires that Java EE and
GlassFish is pre-installed.
99
Chapter 9. User Guide
Installing the Web Page is done by running its install script setup.bat. The script needs
to be run as Administrator to be able to complete the setup. During the setup the
user has to enter the installation directory of GlassFish, domain name and instance port
number of the GlassFish instance, as well as the host name / IP and port number of the
Web Service from which it gets its data.
During the setup, a configuration file is generated. This configuration file contains the
host name / IP and port number of the Web Service, and can be modified at any time
to change the settings of the Web Page. A reboot is required to apply the changes.
#Web Page C o n f i g
h o s t=l o c a l h o s t
p o r t =44445
Listing 9.5: Example - Configuration file for the Web Page
After the setup is complete, an uninstall script is created. This can be used to remove
the installed system. The uninstall scripts needs to be run as Administrator to be able
to remove every part of the Web Page from your system.
9.4.2
Usage of the Web Page
After the installation is complete, the Web Page is deployed on the GlassFish server it was
installed on. The site will then be possible to access from http://[IP]:[Port]/WebPage.
The Web Page is responsible for the presentation of the error data stored in the Datarec
error database.
100
Chapter 9. User Guide
Figure 9.5: Web Page - Front Page
The site contains a map that displays the roadside installations with a marker. The
marker should be marked red if there is an error on the roadside installation, yellow if
there is a warning and green if the roadside installation is running appropriately. When
the “jump to location” button is clicked, the map should move to a local view, where the
marker is placed.
When the user clicks on the marker or the name of the Datarec under the “Unresolved
errors” list, the page opens the unit status page for the Datarec. If the user wants
information about a Datarec which does not have an error, it is possible to get to the
unit status page by using the drop down list, called “List of DataRec units”, and press
submit.
101
Chapter 9. User Guide
Figure 9.6: Web Page - Display Unit Status
When the user opens the Unit Status page, the information about the current status and
its location should be displayed as illustrated in the example above. The user can either
click “back”, which will open the front page, or click “Display Statelogs”, which will open
a new page that displays the state log of the roadside hardware.
102
Chapter 9. User Guide
Figure 9.7: Web Page - Display State Logs
The State Log page displays the information about the previous status messages that
have been sent from the roadside installations. The State Log offers information about
temperature, battery voltage and loop statuses. When the user clicks “Back”, the “Unit
Status” page that he came from is displayed. If the user clicks on the arrow-button he
will be sent to the page where the incoming Datarec statuses are displayed. This status
page displays up to 30 statuses, sorting them from new to old. If there are more than 30
statuses, the user can click to the next page.
103
10
Discussion of the Implementation
Contents
10.1 ONSITE Server . . . . . . . . . . . . . . . . . . . . . . . . . .
101
10.1.1 Rationale . . . . . . . . . . . . . . . . . . . . . . . . . . . . . . 101
10.1.2 Details of the Protocol . . . . . . . . . . . . . . . . . . . . . . . 101
10.1.3 Discussion . . . . . . . . . . . . . . . . . . . . . . . . . . . . . . 102
10.2 Error Handler . . . . . . . . . . . . . . . . . . . . . . . . . . .
104
10.3 Web Service . . . . . . . . . . . . . . . . . . . . . . . . . . . . .
105
10.4 Web Page . . . . . . . . . . . . . . . . . . . . . . . . . . . . . .
105
10.4.1 Exception Handling . . . . . . . . . . . . . . . . . . . . . . . . 105
10.4.2 Improvements . . . . . . . . . . . . . . . . . . . . . . . . . . . . 105
In this section the discussion of the implementation is presented.
10.1
ONSITE Server
In this section the implementation of the ONSITE Server is discussed.
10.1.1
Rationale
RegisterNotifications
- SubscribeToEvent()
- UnsubscribeFromEvent()
Calls functions to register for
Stores statuses and errors
Database
notificaitons
DrNotificationPusher
DataRec 7
- getTraffic()
- getServer()
Whenever the unit’s status
changes, send a notification to
all listeners
ErrorHandlerService
ErrorHandler
- eventCallback()
Figure 10.1: Flow Chart
In sprint 2 the we that the OPC-XML protocol had no push-notification method defined.
The customer wanted the system to push a status message whenever the hardware detects
a change of status, while OPC-XML is a pull-based protocol where the client has to get
any updates from last time it connected.
On-Site
Server
Converter
Error
Handler
Database
Figure 10.2: ONSITE Server in the System
Chapter 10. Discussion of the Implementation
Due to this we had to come up with a solution for pushing updates from the hardware
to the converter.
10.1.2
Details of the Protocol
The protocol pushes status change-events from the hardware to clients subscribed to the
events. This means that the protocol follows the publish/subscribe pattern[29], allowing
clients to register as an observer of an event and getting notified when it occurs.
Clients use SOAP-calls to subscribe/unsubscribe to an event, returning a unique ID for
the client to identify itself to the server.
The calls implemented by us:
• String SubscribeToEvent(String eventName, String callbackPath, String port);
• void UnsubscribeFromEvent(String id);
SubscribeToEvent() allows a client to subscribe to an event if the server knows of
the event given. If the call is successful it will give the client an ID to use for identifying
itself to the server. Each call to SubscribeToEvent() will generate a new ID.
UnsubscribeFromEvent() allows a client to stop receiving notifications. The client
will use the ID given by the server to unsubscribe from said event. Since each ID is bound
to a specific event, it is possible to unsubscribe from one event while keeping the rest as
is.
10.1.3
Discussion
In this section the discussion of push vs. pull-based protocols and improvements to the
implementation is presented.
Push- vs. Pull-based Protocols
A push-based protocol is by design more complex and error-prone than a pull-based
protocol. A pull-based protocol can mostly ignore client-side routing issues like NAT,
port forwarding, and client changing IP, simplifying the design drastically.
A push-based protocol needs to be able to connect to the client like it was another server,
which necessitates punching through routers and firewalls. It also needs know the IP
of the client, which often changes over time, unlike most servers. Opening ports to the
105
Chapter 10. Discussion of the Implementation
outside world will also cause a network security concern, enabling another vector-ofattack for hackers. This can be unacceptable in an organization or business, which makes
pushing data to the client much more error-prone and complex.
The advantages of a push-based protocol is that clients are notified the moment an event
happens on the server. It also makes it easier to make the server only send new events,
removing duplicate events by simply checking against the last event pushed. This is
because the server can assume that every client got the last event pushed by the server,
while a pull-based protocol would have to store the last event each client pulled.
The advantages can be alleviated by using a couple of tricks with a pull-based protocol.
Setting the interval a client polls the server for its status to a lower value will ensure that
the client gets each event in a timely manner. When it comes to checking for duplicate
events the server can simply ignore it all-together and send the current status each time
a client polls. This would put the burden of filtering duplicates on the clients, which is a
trivial feature to implement there.
Other Standards
The Datex II v.2.0 standard was brought to our attention near the end of the project. It
is backed by the European Commission Directorate General for Transport and Energy,
and seems to be specifically aimed at traffic-management and road-side data gathering. It
features, among other things, both pushing and pulling of data, a platform-independent
data model, and location-based alerts. We think this is a better option for deployment
since it has a lot of features that are useful for the NPRA and it is an open standard backed
by the EU. It is also reasonable to assume that Datex II will be used by other public
road administrations in European countries, which the NPRA might want to cooperate
with.
Extending the Protocol
The protocol could be extended with a heartbeat-call, enabling the server to more effectively handle disconnected clients. As of now the server will keep waiting for a timeout
when a client is not available anymore, which can take a bit of time. A heartbeat could
also be useful for detecting if a client has changed IP-address, and update it locally on
the server to ensure a more robust protocol. It is especially useful with mobile clients, as
these have a tendency to change addresses more than desktop clients.
106
Chapter 10. Discussion of the Implementation
Improvements to the Current Implementation
The implementation suffers from having too many points of failure as it is now. The web
service runs completely independently of the desktop app, and the server requires both
applications to run to work at all. An improvement to this would be to integrate the
web service and desktop app into one application that is both server and client at once.
This would enable a more robust and elegant method of sharing data, by simply having
a shared, thread-safe area of memory both can access. The downside of this approach
is that we would have had to implement the SOAP middleware themselves, converting
XML-data into a SOAP method call.
The current implementation also calls each client synchronously when a change in status
is detected. This means that if a client is unresponsive the server will wait for it to time
out before sending the status to the next client. This is not acceptable if the server will
serve many clients at once, but can be fairly easily fixed by making each call to a client run
in its own thread. It is also possible to use a worker thread pool, allowing multiple calls
to clients to be handled simultaneously without the overhead of thread-creation.
Another improvement might be to use another interface for fetching the data off the
hardware. The hardware supports other protocols, like ftp, which might be faster than
the SOAP-interface. This would alleviate the bottleneck of accessing the status of the
hardware, which is fairly slow in the current implementation.
Speed Issues with Datarec
The onsite server tries to pull data from the datarec using its SOAP-interface continuously. We measured that it took from 3s to 5s for the server to fetch a status from the
datarec, which puts a bottleneck on the server. By implementing the on-site server on
the hardware itself it might be possible to avoid this bottleneck.
10.2
Error Handler
The Error Handler turned out to be the most complex component of the system, and
since we had the impression that the developed system would be useful to the customer,
we decided to implement every single bit of it, even though it was very time-consuming.
If it would have been clearer for us that the research done during the implementation of
the ONSITE server was the most interesting part of the project, we would have dedicated
more hours to that instead of the Error Handler.
The Error Handler has checks for detecting if:
• a loop has a short circuit
107
Chapter 10. Discussion of the Implementation
• the current frequency is outside the bounds
• the battery voltage is below a predefined minimum
• the connection with the Datarec unit has timed out
These error checks only detect some of the possible errors. A suggestion would be to also
implement checks that detect if:
• the temperature of the Datarec unit is outside the bounds
• the average speed of the counted vehicles is negative (suggests that the loops has
been installed wrong)
• the average speed of the counted vehicles is way higher than the speed limit (suggests
that the loops has been installed wrong)
• a connected loop suddenly “disappears” from the Datarec unit (suggests that the
loop has “died”)
This would widen the search for errors and make the data from the Datarec units more
reliable.
10.3
Web Service
There is not so much to discuss when it comes to the Web Service. It is a very simple web
service that gives access to the data in the Datarec database, and can easily be extended
to obtain desired functionality. The only thing worth mentioning is that it has no way
of suppressing or deleting errors from the database. If a Datarec unit has an unresolved
error when removed from the system, the Web Service would always report that error
as unresolved and there would be no other way of deleting the error than to manually
deleting it from the database. A simple extension of the Web Service would solve this
problem.
10.4
Web Page
This section describes the details about the implementation of the web page part of the
system.
10.4.1
Exception Handling
The Web Page is responsible for handling the SOAPException Exception that is thrown
from the Web Service, and the error caused when the Web Page is unable to connect to
108
Chapter 10. Discussion of the Implementation
the Web Service. This is handled by displaying an error page instead of the usual Web
Page when the error is thrown. The error page is implemented using a test that checks
whether the Web Page is able to successfully gather the necessary information to load
the page (using the Java try/catch statement). The error web page displays a clean web
interface, informing that an error has occurred and displaying the error message involving
the exception.
10.4.2
Improvements
Since this is developed as a proof-of-concept, the Web Page functionality and its graphical
user interface have not been prioritized as highly as it would have been in a further
developed system. The designing of a web page is a time-consuming task, and we simply
could not spare the time for it.
After using our Web Page a while we have had some ideas that could increase the usability
of the Web Page. These improvements are presented and explained below.
Functional Improvements
This list is a suggestion of functional improvements on the web page.
• The web page should be able to auto-update the information about the roadside
hardware statuses without having to refresh the entire page.
• The web page should be able to load the information faster than it actually does
in the current implementation. In order to achieve this, the access to the database
has to be faster, and the web service should limit its interaction with the database
more. It would also be a good idea to have a cache that keeps the images that are
loaded most often, since the loading of images in the map is quite time consuming.
• The errors that occur in the error-reporting system should all be displayed on the
Web Page; this would make the error-reporting system more reliable, since the user
will have easier access to information about system failures.
Graphical Improvements
This list is a suggestion of graphical improvements on the web page.
• When the user is looking at a unit with an error, a graphic illustration should show
exactly which piece of hardware internally in the unit that has an error. An example
would be that when a loop has failed, the Web Page would display all the loops
and mark which one of them that has failed.
109
Chapter 10. Discussion of the Implementation
• When the user clicks on the marker of the hardware unit, a pop-up message describing its status message should appear.
• The state logs should involve more information. It should also display a graph that
displays the evolution of the unit state. This would help to identify the nature of
warnings. Here is an example with the temperature: The temperature can be high
during a small amount of time, which is not critical, but if the temperature is rising
during a long period of time, it could indicate an error in the cooling system of the
hardware.
• The overall design of the Web Page should match the design of the internal system
to the customer, because this would increase the usability of the page.
• The GUI of the Error Handler should be extended into the Web Page to make it
easier for the user to connect to the on-site servers.
110
Part III
In Retrospect
11
Project Evaluation
Contents
11.1 Cultural Differences between the Students . . . . . . . . . .
108
11.2 Becoming a Team . . . . . . . . . . . . . . . . . . . . . . . . .
108
11.3 Inefficiency and Internal Information Flow . . . . . . . . . .
109
11.4 Contact with the Customer . . . . . . . . . . . . . . . . . . .
110
11.5 Utilizing the Advisor . . . . . . . . . . . . . . . . . . . . . . .
110
11.6 Risks that Became Problems . . . . . . . . . . . . . . . . . .
110
11.7 Changes in Requirements
. . . . . . . . . . . . . . . . . . . .
112
11.8 Initial Backlog . . . . . . . . . . . . . . . . . . . . . . . . . . .
112
This section contains the evaluation of the project as a whole and of the different parts
of the project.
11.1
Cultural Differences between the Students
Our student group consisted of seven students, six of whom were Norwegian. The seventh
group member was an international Masters degree student from Nepal. This resulted in
English as the main language for communication throughout the project.
Although most of us mastered English to an acceptable level, some were better than
others. Most of us were not used to speaking English, which initially made the oral
communication rather stuttering and poor. It would actually appear to be a surprisingly
big problem for communication at the first few meetings.
The broken English presumably made several group members act more shyly than they
usually would. Consequently the internal ice-breaking in our group got off to a worryingly slow start. After two weeks we got together in our spare time to have a meal
together, socialize and get to know each other. This social meeting and the first lecture on
group dynamics made us more comfortable with each other, and lead to communication
gradually going more smoothly.
11.2
Becoming a Team
Some of us knew each other a bit from before, and some did not know anyone. This is a
typical start on the project for a group that was randomly put together. Using Tuckman’s
theory for team development, there were four possible stages.
Chapter 11. Project Evaluation
1. Forming
Getting to know each other
2. Storming
Challenging each other
3. Norming
Working together
4. Performing
Working as one
The first phase is the Forming phase. Here the team members try to get to know each
other. The language barrier made this phase a little problematic for us, but the transition
to phase two still went very fast for most of us. A reason for this might be that some of
us knew each other from before.
The second phase did not last long, and there have been few big confrontations or loud
arguments. The transition to phase three came fast for most members of our team.
Third phase is the phase where people work together, help each other out and are supportive. This is the stage most of us were on for the main duration of the project.
Phase four is the last, and the optimal, state to be in. Our team did not enter this state.
The main reason for this is the duration of the project. Normally, in small projects like
this one, groups do not enter this phase due to the lack of time. [15]
Figure 11.1: Tuckman’s Theory
113
Chapter 11. Project Evaluation
11.3
Inefficiency and Internal Information Flow
Information flow internally in our group was somewhat messy in the start, and we did
not manage to be as elaborate in distributing work tasks as we should have been. This is
especially noticeable in the report, which did not have the progress that it was expected
to have.
It took about two weeks before we finally got around to define and assign roles among us.
At this point the low productivity of our group was starting to be slightly concerning,
and the advisor told us that we had to assign roles and distribute work tasks to try and
increase our efficiency. In the process of defining roles we came up with a practically
redundant role called ”PR-manager”. Most of the contact between the customer/advisor
and the group has gone through the secretary, and nearly all meetings were agreed to
be held weekly. Consequently the PR-manager role has not had any practical use at
all.
11.4
Contact with the Customer
The customer was represented through Jo Skjermo and Kristin Gryteselv. Gryteselv was
the originator of the project, and Skjermo acted as the main customer representative.
We met with Skjermo once a week at our regular meetings.
We had a very pleasant tone with Skjermo in our meetings, and there were never any
arguments or strained atmospheres.
11.5
Utilizing the Advisor
In previous years the student groups have been assigned two advisors. This year however,
the teams were assigned only one advisor. The advisor’s responsibility to the student
group is to oversee that the project process has the right progress, and that the students
maintain sufficient contact with the customer.
Throughout the project period the team and the advisor held weekly meetings where
the advisor gave us much needed feedback on the project documentation, as well as
suggestions on how to best handle the situation they were in. These meetings lasted for
about an hour every week. In addition to these meetings the advisor was available for
questions in his office and by mail every work day.
114
Chapter 11. Project Evaluation
11.6
Risks that Became Problems
In the planning phase of the project we identified a number of risks that may decrease the
quality of the end product if such a risk should occur. The following items from the risk
assessment section have come true: Illness, communication problems, lack of experience,
wrong priorities, technical issues and delayed deliveries.
Wrong Priorities One of the risks that was assessed in the report was the risk of
group members that do not prioritize the project as highly as expected. Unfortunately
this was the case for some of the members of our group. As a consequence of this we have
struggled with reaching the expected amount of person hours every week, and in the end
we had to drop some of the requirements with low priority.
Sickness Another foreseen risk was sickness. Since autumn is a time of year where the
weather takes a turn for the worse, it was no big surprise that several group members
became sick and needed some days off to recover. After this it would seem that we
had underestimated the risk assessment for sickness in the initial planning phase of the
project. They decided to upgrade the probability of this risk, as it had affected the
amount of person hours in a more negative way than expected.
Customer Delays In the start of the project, the customer had problems with setting
up the equipment necessary for us to start testing. An important database dump and
a connection to the Datarec hardware were the two biggest and most important delays.
They were both delivered in the start of October. This resulted in a late start for us,
after a period of time where work tasks were limited.
Communication Problems As the section about language explained, we experienced
a language barrier. Because several of our group members were uncomfortable with
expressing themselves in English, the discussions at meetings did not always have a
very good flow. The communication problems hit an all time low when we visited the
Norwegian Public Roads Administration’s office for a lecture with their experts. The
experts had not been made aware that their presentation should have been in English.
Consequently they showed up with Norwegian PowerPoint slides and were completely
caught off guard, as they struggled with expressing themselves in English.
Lack of Experience The distribution of work tasks, the planning and the report
writing were all aspects of the project that were characterized by the fact that we were
not very experienced with such big projects. In the beginning of the project, the way that
we distributed tasks was kind of unorganized. Most of the time we just “found something
115
Chapter 11. Project Evaluation
to do” on our own initiative. This way of working can be very inefficient. Luckily we got
much better at this after a while, and increased our productivity.
When we made the project plan, we assumed that every student would manage to work
25 hours every week throughout the whole semester. This was much too optimistic.
After three weeks we realized that we were already behind schedule, which was quite
disappointing. Luckily, once our group started producing code in the first sprint, they
were able to finish several important implementations in significantly less person hours
than what was planned for. This made up for much of the lost time.
None of us had any significant experience with producing such elaborate technical documentation that is required for the Customer Driven Project. This has made the project
report very time consuming, and we soon realized that we might have underestimated
the time it would take to write the report.
Technical Issues We lost about three days worth of testing due to a bug with the
Datarec 7 hardware, which was that the Datarec reset its own IP address whenever we
tried to connect to it through remote desktop. When the Datarec and the server laptop
was installed on-site three work days later, the bug was fixed.
Four weeks before our final presentation, the ICE modem in Moholtlia stopped working.
It was not fixed until three weeks had passed. Because of this we did not get to show the
customer how our system would work with their actual hardware installations, instead of
just with out mocked up version of it.
11.7
Changes in Requirements
Changes of the requirements are common when having an agile development method. We
lost a lot of time in sprint 2 when our biggest requirement had to be reworked. We were
already deep into implementing an OPC server, when we found out that had to scrap
it and start over with a new server implementation. The changes of our requirements
specification are presented in Appendix C: Requirements Specification.
11.8
Initial Backlog
As the Scrum phase came close, we realized that the product backlog which we had
designed should have been much different. Therefore we redesigned it so that every sprint
would produce separate parts of the final system. This design makes for a clearer sense
of progress and gives us finalized implementations that we can show to the customer. In
retrospect, we are wondering if the best way to design the sprints would have been to
116
Chapter 11. Project Evaluation
aim to implement a minimum of the highly prioritized requirements to make a functional
system in sprint 1, and then further extend the system in the following sprints.
117
Part IV
Appendices
A
Appendix: Testing
Contents
A.1 Display Unit Information . . . . . . . . . . . . . . . . . . . . .
114
A.2 Display State Logs for Units . . . . . . . . . . . . . . . . . . .
114
A.3 Map Service . . . . . . . . . . . . . . . . . . . . . . . . . . . . .
115
A.4 Web Service . . . . . . . . . . . . . . . . . . . . . . . . . . . . .
115
A.5 Datarec Database . . . . . . . . . . . . . . . . . . . . . . . . .
117
A.6 Datarec 7 SOAP Client . . . . . . . . . . . . . . . . . . . . . .
118
A.7 Error Handler . . . . . . . . . . . . . . . . . . . . . . . . . . .
119
A.8 ONSITE Server . . . . . . . . . . . . . . . . . . . . . . . . . .
121
This section includes a more detailed elaboration on the requirement tests.
A.1
Display Unit Information
In this section the testing of displaying unit information is presented.
Test ID
Description
Requirement ID
Test criteria
T01
Test if the Web Page’s unit part is working as intended.
FR20
The Web Service must be functional and have information about
the hardware units available.
Task
1. Open Web Page
2. Select a hardware unit
3. Open unit information
Expected output
Result
Comments
A.2
The Web Page should display an overview of all the information
relevant to the selected unit’s status.
Passed
The test went without any irregularities. The test is passed because
the expected output matches the real output. The Web Page was
slow during the test with the system integrated.
Display State Logs for Units
Appendix A. Appendix: Testing
Test ID
Description
Requirement ID
Test criteria
T02
Test if the Web Page’s log part is working as intended.
FR24
The Web Service must be functional and and have information
about the hardware units available.
Task
1. Open Web Page
2. Select a hardware unit
3. Open unit log
Expected output
Result
Comments
A.3
The Web Page should display on overview of all the previous logged
incidents with any relevant information.
Passed
The Web Page behaved like it was supposed to. The Web Page was
quite slow, but that is documented in T01.
Map Service
Test ID
Description
Requirement ID
Test criteria
T03
Test if the Web Page’s map service is working as intended.
FR19
The Web Service must be functional and and have information
about the hardware units available.
Task
1. Open Web Page
2. Jump to Datarec 7 unit
Expected output
1. The Web Page should open and show a map with the hardware that has errors displayed with a red marker and working
hardware displayed with a green marker.
2. The map should be placed zoomed with the selected hardware
in the center.
Result
Comments
Passed
The test went without any irregularities. The Web Page was slow
during the test with the system integrated.
120
Appendix A. Appendix: Testing
A.4
Web Service
In this section the testing of the Web Service is presented.
Test ID
Description
Requirement ID
Test criteria
Task
Expected output
Result
Comments
Test ID
Description
Requirement ID
Test criteria
Task
Expected output
Result
Comments
Test ID
Description
Requirement ID
Test criteria
T04
Testing the Web Service connection to the NorTraf database abstraction.
FR17
Working NorTraf database abstraction connection.
Send a request to the Web Service for coordinates to the NorTraf
database for a Datarec 7 with ID 10718(placed at Klett).
The coordinates should be (265665.6,7030217.5).
Passed
The coordinates were placed in our database, which means that
the connection to the NorTraf database would not be tested in this
test. This was due to the fact that we did not have accsess to the
NorTraf database. But the system was successfully able to give the
correct coordinates, and was considered successful.
T05
Test whether the Web Service is able to accept connections from a
SOAP client.
FR15
The tester must have access to a SOAP-client.
Try to set up a connection to the SOAP interface to the Web Service
using the Web Page.
The Web Service should accept the connection from the Web Page.
Passed
The tester was successfully able to set up a working connection
between the Web Page and the Web Service using SOAP. The tests
were carried out both by running the server and the client on one
single computer, and by running them on separate computers. The
test went without any irregularities, and was accepted.
T06
Test to confirm that the Datarec database is able to offer status
and errors messages to the Web Service.
FR16
The system should have a Web Service and a Datarec database.
Continued on next page
121
Appendix A. Appendix: Testing
Table A.6 – continued from previous page
Task
1. Set up a connection between the database and the Web Service.
2. The tester should make the Web Service get two status messages from the database.
3. The tester should make the Web Service get two error messages from the database.
Expected output
1. The connection should be established.
2. The Web Service should receive the status messages.
3. The Web Service should receive the error messages.
Result
Comments
Passed
The system was able to get the status messages and the error messages successfully. This implies that the communication between
the database and the Web Service worked appropriately, and the
test was successful.
Test ID
Description
T07
A test which confirms that the Web Service is enable to separate
warnings and errors
FR18
The system should be able to produce warnings and errors messages.
Requirement ID
Test criteria
Task
1. Input a warning message to the Web Service
2. Input a error message to the Web Service
Expected output
1. The error and warning messages should be distinguished.
Result
Comments
Passed
The errors and warnings are separated in the database by a flag.
The Web Service gets this flags and sets it “w” for warning and
“e” for errors. The system was successful in this task, and it was
possible to distinguish between errors and warnings.
122
Appendix A. Appendix: Testing
A.5
Datarec Database
In this section the testing of the database is presented.
Test ID
Description
Requirement IDs
Test criteria
Task
T08
This test is supposed to confirm that the database is able to store
the error messages and warnings.
FR13 and FR14
Have the database running.
1. Add a warning message stating that it is to high temperature
on the Datarec with ID 9410.
2. Add an error message saying that there is an error in loop 1
on the Datarec with ID 9725.
Expected output
Result
Comments
A.6
The warning message and the error message should be added in the
database.
Passed
The database was working correctly. It is possible to store and get
data from the database in the approriate way. The test is therefore
considered to be successful.
Datarec 7 SOAP Client
In this section the testing of the Datarec 7 SOAP Client is presented.
Test ID
Description
Requirement IDs
Test criteria
T09
This test should make sure that requirement FR1 and FR2 is implemented in the system. This means that it should test if the
connection using the SOAP interface is working properly.
FR1 and FR2
This test needs a working Datarec 7 connected to an Ethernet connection and a working SOAP client to access the interface.
Continued on next page
123
Appendix A. Appendix: Testing
Table A.9 – continued from previous page
The SOAP client should access the following information on the
Datarec 7 hardware using the SOAP client:
1. The loop connection status.
2. The loop hits.
3. The loop frequency status.
4. The start time.
5. Battery voltage.
6. Temperature.
7. Most recent vehicle information.
8. The accumulated number of vehicles and their speed.
Task
Expected output
Result
Comments
A.7
When checking the result against the information listed using the
HTTP service of the Datarec 7, the information should match.
Passed
The system gets the right result from the Datarec 7, but the process of fetching data is a bit slow. The hardware uses 3-5 seconds
when it responds to requests from the SOAP client. We think this
happens because of the overhead that comes with using SOAP. The
converting to XML and setting up HTTP takes some time, and the
hardware in the Datarec 7 is slow. We considered the problem to
be unsolvable, and therefore simply accepted the poor result.
Error Handler
In this section the testing of the Error Handler is presented.
Test ID
Description
Requirement ID
Test criteria
T10
This test is constructed mainly to test whether the connection between the ONSITE server and the Error Handler is working correctly. But it also tests the connection between the Error Handler
and the NorTraf database, to check that it is successfully able to
get IP addresses from the database.
FR7, FR8 and FR9
There should exist at least one working ONSITE server.
Continued on next page
124
Appendix A. Appendix: Testing
Table A.10 – continued from previous page
Task
1. The Error Handler should connect to the ONSITE server using the Error Handler’s GUI and the IP address of the ONSITE server.
2. The on-site server should add the error handler as a listener.
3. The ONSITE server should send a error message to the Error
Handler, using the connection that was set up.
Expected output
1. The GUI should show the IP address of the ONSITE server
in the list of IP addresses.
2. The connection should be successfully set up, and the ONSITE server should now be able to send messages to the Error
Handler.
3. The Error Handler should receive the error message.
Result
Comments
Passed
The setup with the ONSITE server worked satisfactorily, and the
connection was successfully set up. The Error Handler successfully received the message from the ONSITE server. The testing of
whether the Error Handler was able to get the IP address from the
NorTraf database was hard to check in a satisfactory way, because
the database we got from the costumer only had telephone numbers
stored. We added the IP address manually to make it possible to
test, and then it was successful. Another issue is that we did not
have access to the real NorTraf database during the project, so the
costumer needs to test this feature themselves with access to the
database. The Error Handler is equipped with Oracle drivers (the
NorTraf database is an Oracle database), so this should be working
properly. Since this feature was fully functional on our prototype,
it should be working on their system as well, and is therefore considered successful.
Test ID
Description
T11
This is a test constructed to test if the Error Handler i capable of
handling all planned errors.
FR10
Continued on next page
Requirement ID
125
Appendix A. Appendix: Testing
Test criteria
Table A.11 – continued from previous page
A mock up of the ONSITE server, which is capable of sending data
containing all the necessary errors. The connection between the
ONSITE server and the error handler should be set up.
Task
1. The ONSITE server should send a message containing information stating that there has been a short circuit.
2. The ONSITE server should disconnect the network connection.
Expected output
1. The messages should be added in the database.
2. The Error Handler should catch the timeout, and add a timeout warning in the database.
Result
Comments
Passed
The Error Handler successfully recognized the errors and added
them into the database. The test is therefore considered successful.
Test ID
Description
T12
This test will make sure that the Error Handler is capable of handling errors and warnings, while there also is data which do not
provides any information about errors.
FR11 and FR12
Atleast one on-site server should be set up and running. It should be
able to send errors, warnings and traffic data to the Error Handler.
The Database should be running, so the Error Handler could store
the data.
Requirement ID
Test criteria
Task
1. Mock up 10 error free data messages in the on-site server, and
send them to the error handler.
2. Send a warning about frequencies being to high.
3. Send a new message without error.
4. Send a message containing information about a short circuit.
Continued on next page
126
Appendix A. Appendix: Testing
Table A.12 – continued from previous page
Expected output
1. The warning message should be added in the database, containing a flag W, informing that it is a warning.
2. The error message should be added in the database, containing a flag E, informing that it is an error.
3. All the other data messages should be rejected.
Result
Comments
A.8
Passed
After the test was completed, the only data that was added in the
database was the error and warning messages. This implies that
the test was successful, and had passed. Since the error handler
shows the correct behavior.
ONSITE Server
In this section the testing of the ONSITE Server is presented.
Test ID
Description
Requirement ID
Test criteria
T13
This is a test that should confirm that the ONSITE server is able
to automatically push data and to register the Error Handler as its
listener.
FR4 and FR5
A mock up of the Datarec 7 SOAP client needs to be running to
produce the errors and the Error Handler must be running and able
to send request to register itself as a listener.
Task
1. The Error Handler should connect to the ONSITE server,
using the on-site servers IP address.
2. The mocked up SOAP client should produce an error.
Expected output
1. The ONSITE server should accept the connection, and send
an accept message to the Error Handler.
2. The ONSITE server should automatically push the error message to the Error Handler.
Result
Passed
Continued on next page
127
Appendix A. Appendix: Testing
Comments
Table A.13 – continued from previous page
The reason for using a mocked up Datarec 7 SOAP client instead
of a real Datarec 7, is that we had no way to produce the error
at the Datarec 7 location. The test went without problems, the
connection to the Error Handler was successfully established and
the pushing was working satisfactorily. This also suggests that the
Error Handler’s part is working according to plan. Therefore, the
test was considered successful.
128
B
Appendix: Templates
Contents
B.1 Advisory Meeting Summary Template . . . . . . . . . . . . .
123
B.2 Customer Meeting Summary Template . . . . . . . . . . . .
123
B.3 Meeting Agenda Template . . . . . . . . . . . . . . . . . . . .
125
B.4 Status Report Template . . . . . . . . . . . . . . . . . . . . .
126
B.5 Work Sheet Template . . . . . . . . . . . . . . . . . . . . . . .
127
B.6 Test Table Template . . . . . . . . . . . . . . . . . . . . . . . .
127
In this section the different templates used during the project are presented.
B.1
Advisory Meeting Summary Template
In this section the template for advisory meetings is presented.
TDT4290
Group 10
Advisory meeting summary
Date:
Time:
Location:
Attendees:
Students:
Kato Stølen
Sonik Shrestha
Roar Bjurstrøm
Sondre Løberg Sæter
Bjørnar Valle
Robert Versvik
Eirik Stene
Advisor:
Reidar Conradi
Meeting Agenda:
1.
2.
3.
Meeting Summary:
Figure B.1: Advisory Meeting Summary Template
Appendix B. Appendix: Templates
B.2
Customer Meeting Summary Template
In this section the template for customer meetings is presented.
TDT4290
Group 10
Customer meeting summary
Norwegian Public Roads Administration
Hardware Fault Monitoring and Notification for Roadside Infrastructure
Date:
Time:
Location:
Attendees:
Students:
Kato Stølen
Sonik Shrestha
Roar Bjurstrøm
Sondre Løberg Sæter
Bjørnar Valle
Robert Versvik
Eirik Stene
Customer Representatives:
Kristin Gryteselv
Jo Skjermo
Advisor:
Reidar Conradi
Meeting Agenda:
1.
2.
3.
Meeting Summary:
Figure B.2: Customer Meeting Summary Template
130
Appendix B. Appendix: Templates
B.3
Meeting Agenda Template
In this section the template for meeting agendas is presented.
TDT4290
Group 10
meeting agenda, *date*
Time: 08:15-15:00
Location:
Attendees:
Students:
Kato Stølen
Sonik Shrestha
Roar Bjurstrøm
Sondre Løberg Sæter
Bjørnar Valle
Robert Versvik
Eirik Stene
Advisor:
Reidar Conradi
Meeting Agenda:
1.
2.
3.
Figure B.3: Meeting Agenda Template
131
Appendix B. Appendix: Templates
B.4
Status Report Template
In this section the template for status reports is presented.
TDT4290
Group 10
Status report Group 10, week
Meetings and summary for this week:
What was good?
What was bad?
What must be improved?
Person hours
Roar
Bjørnar Kato
Sondre
Robert
Sonik Eirik
Sum
Planning
Pre-study
Sprint1
Sprint2
Sprint3
Report
Sum
Figure B.4: Status Report Template
132
Appendix B. Appendix: Templates
B.5
Work Sheet Template
In this section the template for work sheets is presented.
Robert
Monday
Tuesday
Sondre
Week #
Wednesday
Thursday
Friday
Monday
8
9
10
11
12
13
14
15
16
17
18
19+
Tuesday
Week #
Wednesday
Thursday
Friday
8
9
10
11
12
13
14
15
16
17
18
19+
0
0
Roar
Monday
Tuesday
Kato
Week #
Wednesday
Thursday
Friday
Monday
8
9
10
11
12
13
14
15
16
17
18
19+
Tuesday
Week #
Wednesday
Thursday
Friday
8
9
10
11
12
13
14
15
16
17
18
19+
0
0
Bjørnar
Monday
Tuesday
Sonik
Week #
Wednesday
Thursday
Friday
Monday
8
9
10
11
12
13
14
15
16
17
18
19+
Tuesday
Week #
Wednesday
Thursday
Friday
8
9
10
11
12
13
14
15
16
17
18
19+
0
0
Eirik
Monday
Tuesday
Week #
Wednesday
Thursday
Friday
8
9
10
11
12
13
14
15
16
17
18
19+
Figure B.5: Work Sheet Template
B.6
Test Table Template
In this section the template for test tables is presented.
Test ID
Description
Requirement ID
Test criteria
Task
Expected output
Result
Comments
Identification of each test.
Description of the test’s purpose.
Maps each test to an item in the requirements specification.
Criteria for the test to be able to complete dependencies of other modules.
List of tasks to perform during the test.
States the expected results by running the test.
States whether the test succeeded.
Notes on the test.
Table B.1: Template for Functionality Tests
133
C
Appendix: Initial Requirement Specification
Contents
C.1 Functional Requirements . . . . . . . . . . . . . . . . . . . . .
128
C.2 Non-Functional Requirements . . . . . . . . . . . . . . . . . .
130
C.3 Changes in Requirement Specification . . . . . . . . . . . . .
130
C.4 Inital Product Backlog . . . . . . . . . . . . . . . . . . . . . .
132
This section shows how our requirement specification was at the beginning of the project.
C.1
Functional Requirements
ID
Description
1. Continuously fetch data from Datarec 7 installations
FR1 The system should support the Datarec 7 hardware.
FR2 The system should use the SOAP interface to get the status of the
Datarec 7 hardware every second.
11. Set up OPC server
FR3 The server OPC server should offer a mock-up of a subset of the
OPC functionality.
FR4 The server OPC server should be able to register listeners.
FR5 The OPC server should be able to push data.
10. Fetch network statistics
FR6 The system should use RMON to fetch statistics describing network
traffic.
12. Set up OPC client
FR7 The OPC client should be able to receive messages from the OPC
server.
FR8 The OPC client should be able to register itself as a listener to the
OPC servers.
FR9 The OPC client should get a list of all the roadside installations and
their IP-addresses from the NorTraf database abstraction level.
7. Detect errors and faults
FR10 The system should use the data from the network monitor and
OPC server to detect network irregularities, peculiar data, loop
faults, hardware faults or wrong hard-wiring.
Continued on
Priority
High
High
High
High
High
High
High
High
High
High
next page
Appendix C. Appendix: Initial Requirement Specification
Table C.1 – continued from previous page
ID
Description
FR11 The errors should be separated from the regular data messages.
FR12 The error handler should create warnings on irregularities and peculiar data.
2. Save data in database
FR13 The system should use a SQL database to store the statuses and
errors.
FR14 The system should convert the messages from the OPC server and
network monitor for database storage.
3. Set up web service
FR15 The system should have a web service using SOAP.
FR16 The web service should use the SQL database to offer status and
error data.
FR17 The web service should use the NorTraf database abstraction to get
the coordinates of the roadside installations.
FR18 The web service should separate warnings and errors.
Priority
High
High
High
High
High
High
High
High
Table C.1: High Priority Functional Requirements
ID
Description
4. Show location of roadside installations on a map
FR19 The system should use a map service to show the locations of the
roadside installations on a map.
5. Display unit information
FR20 The system should display the status of separate installations in a
web page.
8. Add support for Datarec 410
FR21 The system should support the Datarec 410 hardware.
FR22 The server on-site should run Traffic6 to get data from the DataRec
410.
FR23 The OPC server should parse and offer the data from Traffic6.
14. Display state logs for units
FR24 The system should store the states of the separate installations in
a database.
Priority
Medium
Medium
Medium
Medium
Medium
Medium
Table C.2: Medium Priority Functional Requirements
ID
Description
15. Automatic notifications
Priority
Continued on next page
135
Appendix C. Appendix: Initial Requirement Specification
Table C.3 – continued from previous page
ID
Description
FR25 The system should notify by SMS or email automatically if errors
occur.
Priority
Low
Table C.3: Low Priority Functional Requirements
C.2
Non-Functional Requirements
ID
Description
13. Create installation guide and user manual
NFR1 The system should have a installation guide and user manual.
9. More extensive design of web interface
NFR2 The web interface should have a clear design.
NFR3 The web interface should use Ajax to enhance user experience.
Other
NFR4 The system should be programmed in Java/Java Enterprise.
NFR5 The system should be easy to integrate into the customer’s existing
system.
Priority
Medium
Low
Low
High
High
Table C.4: Non-Functional Requirements
C.3
Changes in Requirement Specification
The requirements had to be changed during the project, because the technologies that
were initially suggested had some technical limitations. There have been some name
changes of things during the project. The server which was been named ”the OPC
server” has been renamed into the ONSITE server in the final report. The ONSITE
server refers to the server computer which is placed by the roadside installations. This
causes some minor fixes on requirements that refers to product backlog ID 11.
There was also a name change in the ”detect error” part, it is now called the Error
Handler. The Error Handler also includes parts of what previously had been called the
”OPC client”. The original requirement specification can be found in Appendix C, while
the updated version can be found in chapter 4.
FR3 had to be changed due to the fact that the OPC server did not have the possibility
to push data, which actually makes it impossible to implement the way the original
requirement was stated. The solution to this problem was to implement a server which
136
Appendix C. Appendix: Initial Requirement Specification
mimics the OPC functionality, but also includes the possibility to add other features.
The priority remained the same after the change.
FR5 had to be changed since it at the beginning required it to be the OPC server
that pushes the data. Since OPC did not support the feature, we had to change the
requirement as well, since it could not be based on OPC.
FR6 had to be removed completely, since our system operates through the Internet.
Initially the Error Handler was supposed to fetch statistics using RMON from the routers
along the connection path and report connection errors. Since the information we needed
from the routers along this path are not assessable by others than the Internet service
providers, it would be impossible to implement. We had the option to implement the
RMON protocol on the local network that the servers are installed on, but this was not
seen as a useful enough tool.
FR14 The database was initially able to handle storage of network statistics as well as
the other errors and warning messages. But since the fetching of the network statistics was
removed from the project, there were no longer any network statistic to store. Therefore
we removed this feature from the database.
FR 21,FR22 and FR23 were removed because the support for Datarec 410 was not
an important part of the project. Since this is a proof of concept, the support to Datarec
410 is not crucial. Another issue is that the Datarec 410 is independent from the Traffic6,
which does not support real time data. The customer wishes to have a product which
is not dependent on Traffic6. All new hardware installed is Datarec 7, so the necessity
to support Datarec 410 will disappear in the future. This causes all of the requirements
related to the Datarec 410 to disappear.
137
Appendix C. Appendix: Initial Requirement Specification
C.4
Inital Product Backlog
In this section the initial product backlog is presented.
ID Description
1
11
10
12
7
2
3
4
5
8
13
14
9
6
Total Effort Sprint 1 Sprint 2 Sprint 3
Estimate
High Priority
Continuously fetch data from
Datarec 7 installation
Set up OPC server
Fetch network statistics
Set up OPC client
Detect errors
Save data in database
Set up web service
Medium Priority
Show location of roadside installations on a map
Display unit information
Add support for Datarec 410
Create installation guide
Display state logs for units
Low Priority
Design web interface
Automatic notifications
Sum Hours
105
70
35
0
190
80
85
110
70
135
0
0
0
65
70
135
130
80
25
45
0
0
60
0
60
0
0
0
55
55
0
0
30
90
40
50
30
0
0
50
0
0
0
0
0
90
40
0
20
45
1105
0
0
475
0
0
315
20
45
315
Table C.5: Product Backlog
138
D
Appendix: Design
Contents
D.1 Common Library . . . . . . . . . . . . . . . . . . . . . . . . . .
134
D.2 Web Page . . . . . . . . . . . . . . . . . . . . . . . . . . . . . .
135
D.3 Web Service . . . . . . . . . . . . . . . . . . . . . . . . . . . . .
136
D.4 Error Handler . . . . . . . . . . . . . . . . . . . . . . . . . . .
140
D.4.1 Initial Design . . . . . . . . . . . . . . . . . . . . . . . . . . . . 140
D.4.2 Final Design . . . . . . . . . . . . . . . . . . . . . . . . . . . . 141
D.5 Database . . . . . . . . . . . . . . . . . . . . . . . . . . . . . . .
147
D.6 ONSITE server . . . . . . . . . . . . . . . . . . . . . . . . . . .
148
In this section the design of the system is presented.
Appendix D. Appendix: Design
D.1
Common Library
In this section the design of the common library is presented.
no.vegvesen
debug
helpers
debug::Debug
helpers::ArrayHelper
+dump(in o : object) : void
+logSevere(in ex : Exception) : void
+logWarning(in ex : Exception) : void
+logInfo(in logEntry : string) : void
-getLogEntry(in ex : Exception) : string
+implode(in inputArray : object[], in glueString : string) : string
+implode(in inputArray : int[], in glueString : string) : string
db
db::DatabaseConfig
db::DatabaseSoftware
db::DatabaseDriver
#dbConnection
#config : DatabaseConfig
+JDBC_MYSQL_URL_FORMAT : string
+JDBC_ORACLE_URL_FORMAT : string
+connect() : void
+close() : void
#getDriverClassName() : string
#getConnectionUrl() : string
+getConnection() : Connection
+MYSQL
+ORACLE
-databaseSoftware : DatabaseSoftware
-databaseHost : string
-databasePort : int
-databaseUser : string
-databasePassword : string
-databaseService : string
+getProperties(in prefix : string) : Map<String, String>
+load(in properties : Map<String, String>, in prefix : string) : DatabaseConfig
net
io
net::SocketConnection
io::PropertyIO
+store(in fieldValues : Map<String, String>, in fileName : string) : void
+load(in fileName : string) : Map<String, String>
io::SortedProperties
+keys() : Enumeration
-listener : ServerSocket
-socket : Socket
-objectOutStream : ObjectOutputStream
-objectInStream : ObjectInputStream
+sendObject(in object : object) : void
+receiveObject() : object
+close() : void
+connect(in hostName : string, in port : int) : SocketConnection
+startListen(in port : int) : void
+stopListen() : void
+acceptConnection(in timeout : int) : SocketConnection
Figure D.1: Overview Class Diagram of the Common Library
140
Appendix D. Appendix: Design
D.2
Web Page
In this section the design of the Web Page is presented.
no.vegvesen.webpage
«utility»
index.jsp
«utility»
unitstatus.jsp
bal
Config
«utility»
statelogs.jsp
-host : string
-port : int
+store(in fileName : string) : void+load(in fileName : string) : Config
WebLogic
+isError(in drId : int, in errorresponse : ErrorResponse) : char
+getDescription(in drId : int, in errorresponse : ErrorResponse, in type : char) : string
soap
soap::ServiceCommunicator
+getAllDataRecUnits(in config : Config) : ListResponse+getRecentErrors(in drId : int, in offset : int, in count : int, in config : Config) : ErrorResponse
+getRecentStatuses(in drId : int, in offset : int, in count : int, in config : Config) : StatusResponse
+getUnresolvedErrors(in config : Config) : ErrorResponse
soap::WebClient
-config : Config
+getAllDataRecUnits() : ListResponse+getRecentErrors(in drId : int, in offset : int, in count : int) : ErrorResponse
+getRecentStatuses(in drId : int, in offset : int, in count : int) : StatusResponse
+getUnresolvedErrors() : ErrorResponse
Figure D.2: Overview Class Diagram of the WebPage
141
Appendix D. Appendix: Design
Web Service
D.3
In this section the design of the Web Service is presented.
no.vegvesen.webservice
dr
dal
dal::Error
dal::Status
dal::ListResponse
db
db::DrDbConnection
db::DrDbMySqlDriver
db::DrDbConstants
db::DrDbDriver
dal::DataRecUnit
dal
nt
«interface»db::IDrDbConnection
dal::StatusResponse
db::DrDbOracleDriver
bal
bal::ResponseFactory
dal
db::NtDbConstants
dal::Config
db::NtDbConnection
db::NtDbDriver
db
db::NtDbOracleDriver
142
dal::LoopStatus
soap
dal
dal::ErrorResponse
soap::RequestHandler
db::NtDbMySqlDriver
«interface»db::INtDbConnection
Figure D.3: Overview Class Diagram of the WebService
Appendix D. Appendix: Design
no.vegvesen.webservice.bal
ResponseFactory
-drDbConnection : IDrDbConnection
-INtDbConnection : INtDbConnection
+getRecentStatuses(in drId : int, in offset : int, in count : int) : StatusResponse
+getRecentErrors(in drId : int, in offset : int, in count : int) : ErrorResponse
+getUnresolvedErrors() : ErrorResponse
+getAllDataRecUnits() : ListResponse
Figure D.4: Class Diagram: no.vegvesen.webservice.bal
no.vegvesen.webservice.dal
Config
-drDbConfig : DatabaseConfig
-ntDbConfig : DatabaseConfig
+store(in fileName : string) : void
+load(in fileName : string) : Config
Figure D.5: Class Diagram: no.vegvesen.webservice.dal
no.vegvesen.webservice.soap
RequestHandler
-responseFactory : ResponseFactory
+getRecentStatuses(in drId : int, in offset : int, in count : int) : StatusResponse
+getRecentErrors(in drId : int, in offset : int, in count : int) : ErrorResponse
+getUnresolvedErrors() : ErrorResponse
+getAllDataRecUnits() : ListResponse
dal
ErrorResponse
StatusResponse
-errors : Error[]
-dataRecUnits : DatarecUnit[]
-statuses : Status[]
-dataRecUnit : DataRecUnit
ListResponse
-dataRecUnits : DatarecUnit[]
Figure D.6: Class Diagram: no.vegvesen.webservice.soap
143
Appendix D. Appendix: Design
no.vegvesen.webservice.dr
db
DrDbOracleDriver
DrDbConstants
+getRecentStatusesQuery(in offset : int, in count : int) : string
+getRecentErrorsQuery(in offset : int, in count : int) : string
+getUnresolvedErrorsQuery() : string
+getStatusQuery() : string
+getLoopStatusesQuery() : string
#getDriverClassName() : string
#getConnectionUrl() : string
DrDbOracleDriver
+getRecentStatusesQuery(in offset : int, in count : int) : string
+getRecentErrorsQuery(in offset : int, in count : int) : string
+getUnresolvedErrorsQuery() : string
+getStatusQuery() : string
+getLoopStatusesQuery() : string
#getDriverClassName() : string
#getConnectionUrl() : string
+COLUMN_DR_ID : string
+COLUMN_STATUS_ID : string
+COLUMN_START_TIME : string
+COLUMN_TEMPERATURE : string
+COLUMN_BATTERY_VOLTAGE : string
+COLUMN_TIMESTAMP : string
+COLUMN_LOOP_ID : string
+COLUMN_STATUS_CHARACTER : string
+COLUMN_DESCRIPTION : string
+COLUMN_ERROR_ID : string
+COLUMN_ERROR_CODE : string
+COLUMN_RESOLVED : string
+COLUMN_TYPE : string
+COLUMN_HITS : string
+COLUMN_MIN_FREQUENCY : string
+COLUMN_CURRENT_FREQUENCY : string
+COLUMN_MAX_FREQUENCY : string
+TABLE_STATUS : string
+TABLE_LOOP_STATUS : string
+TABLE_ERROR : string
DrDbDriver
+getRecentStatusesQuery(in offset : int, in count : int) : string
+getRecentErrorsQuery(in offset : int, in count : int) : string
+getUnresolvedErrorsQuery() : string
+getStatusQuery() : string
+getLoopStatusesQuery() : string
DrDbMySqlDriver
+getRecentStatusesQuery(in offset : int, in count : int) : string
+getRecentErrorsQuery(in offset : int, in count : int) : string
+getUnresolvedErrorsQuery() : string
+getStatusQuery() : string
+getLoopStatusesQuery() : string
#getDriverClassName() : string
#getConnectionUrl() : string
DrDbConnection
-dbDriver : DrDbDriver
+getRecentStatuses(in drId : int, in offset : int, in count : int) : Status[]
+getRecentErrors(in drId : int, in offset : int, in count : int) : Error[]
+getUnresolvedErrors() : Error[]
+connect() : void
+close() : void
-getStatus(in statusId : int) : Status
-getLoopStatuses(in statusId : int) : LoopStatus[]
-extractStatuses() : Status[]
-extractErrors(in errorResult : ResultSet) : Error[]
«interface»
IDrDbConnection
+getRecentStatuses(in drId : int, in offset : int, in count : int) : Status[]
+getRecentErrors(in drId : int, in offset : int, in count : int) : Error[]
+getUnresolvedErrors() : Error[]
+connect() : void
+close() : void
dal
Error
LoopStatus
Status
-errorId : int
-drId : int
-statusId : int
-errorCode : int
-description : string
-timestamp : string
-resolved : bool
-type : char
-status : Status
+toString() : string
-loopId : int
-statusId : int
-statusCharacter : string
-description : string
-hits : int
-minFrequency : int
-currentFrequency : int
-maxFrequency : int
+toString() : string
-statusId : int
-drId : int
-startTime : string
-temperature : double
-batteryVoltage : int
-timestamp : string
-loopStatuses : LoopStatus[]
+toString() : string
Figure D.7: Class Diagram: no.vegvesen.webservice.dr
144
Appendix D. Appendix: Design
no.vegvesen.webservice.nt
db
NtDbConstants
NtDbConnection
-dbDriver : NtDbDriver
+connect() : void
+close() : void
+getDataRecUnits(in drIds : int[]) : DatarecUnit[]
+getAllDataRecUnits() : DatarecUnit[]
#extractDataRecUnits(in query : string) : DatarecUnit[]
#sortDataRecUnits(in units : DatarecUnit[], in drIds : int[]) : DatarecUnit[]
NtDbDriver
+getSelectAllDataRecsQuery() : string
+getSelectDataRecs(in drIds : int[]) : string
+getDriver(in config : DatabaseConfig) : NtDbDriver
«interface»
INtDbConnection
+connect() : void
+close() : void
+getDataRecUnits(in drIds : int[]) : DatarecUnit[]
+getAllDataRecUnits() : DatarecUnit[]
+COLUMN_COORD_NORTH : string
+COLUMN_COORD_EAST : string
+COLUMN_COORD_ELEVATION : string
+COLUMN_ID : string
+COLUMN_STATION_NAME : string
+COLUMN_DESCRIPTION : string
+COLUMN_LOCATION_ID : string
+COLUMN_STATUS_ID : string
+COLUMN_STATUS_NAME : string
+TABLE_OBJECT_LOCATION : string
+TABLE_STATION_DATA : string
+TABLE_STATION_STATUS : string
NtDbMySqlDriver
+getSelectAllDataRecsQuery() : string
+getSelectDataRecs(in drIds : int[]) : string
#getDriverClassName() : string
#getConnectionUrl() : string
dal
DataRecUnit
-drId : int
-name : string
-description : string
-status : string
-coordinateNorth : double
-coordinateEast : double
-coordinateElevation : double
+toString() : string
Figure D.8: Class Diagram: no.vegvesen.webservice.nt
145
Appendix D. Appendix: Design
D.4
Error Handler
In this section the design of the Error Handler is presented as ER and class diagrams. In
order to save space the class diagrams does not contain getter and setter methods.
D.4.1
Initial Design
In this section the initial design of the Error Handler is presented. This design was
modified after changes to the requirements.
opc::OpcClient
«uses»
«uses»
dr.dal::LoopStatus
Converter
«uses»
dr.dal::Error
«uses»
«uses»
«interface»
dr.db::IDrDbConnection
statuscheck::LoopChecker
«interface»
statuscheck::IStatusChecker
+checkStatus(in status)
ErrorHandler
statuscheck::AccumulatedAverageCheck
«uses»
«uses»
dr.dal::Status
dr.db::DrDbOracleConnection
dr.db::DrDbMySqlConnection
Figure D.9: Initial ER diagram of the Error Handler
146
Appendix D. Appendix: Design
D.4.2
Final Design
In this section the final design of the Error Handler and ErrorHandlerService is presented.
ErrorHandlerService
StatusNotification
-forwarder : Forwarder
-status : Status
-subscriptionId : string
+eventCallback(in unitStatus : UnitStatus, in subscriptionId : UUID)
«uses»
«uses»
«uses»
Forwarder
Converter
-config : Config
+forward(in unitStatus : UnitStatus, in subscriptionId : string)
«uses»
+convert(in unitStatus : UnitStatus) : Status
«uses»
Config
-host : string
-port : int
+store(in fileName : string)
+load(in fileName : string) : Config
SocketConnection
-listener : ServerSocket
-socket : Socket
-objectOutStream : ObjectOutputStream
-objectInStream : ObjectInputStream
+sendObject(in object : object) : void
+receiveObject() : object
+close() : void
+connect(in hostName : string, in port : int)
+startListen(in port : int) : void
+stopListen() : void
+acceptConnection(in timeout : int)
Figure D.10: ER Diagram of the ErrorHandlerService
147
Appendix D. Appendix: Design
Program
no.vegvesen.errorhandler
ErrorHandler
«interface»
IGlobalConstants
dr
dr.dal::Status
dal
dal::Config
dal::ErrorHandlerModel
«interface»
dr.db::IDrDbConstants
dal::Subscription
dr.db::DrDbDriver
«interface»
dr.db::IDrDbConnection
errorcheck
«interface»
errorcheck::IStatusChecker
errorcheck::LoopChecker
«interface»
nt.db::INtDbConstants
soap
soap::Subscriber
nt.db::NtDbMySqlDriver
nt.db::NtDbDriver
errorcheck::FrequencyChecker errorcheck::TimeoutChecker
nt
dal
nt.dal::DataRecHost
«interface»
nt.db::INtDbConnection
nt.db::NtDbOracleDriver
db
nt.db::NtDbConnection
service
dal
service.dal::StatusNotification
net
gui::AddSubscriptionDialog
net::ConnectionManager net::ConnectionHandler
gui
gui::MainFrame
148
dal
dr.dal::Error
dr.dal::LoopStatus
db
dr.db::DrDbConnection
dr.db::DrDbMySqlDriver
dr.db::DrDbOracleDriver
Figure D.11: Overview Class Diagram of the Error Handler
Appendix D. Appendix: Design
no.vegvesen.errorhandler
Program
ErrorHandler
-connectionManager : ConnectionManager
-dataRecDbConnection : DrDbConnection
-gui : MainFrame
-model : ErrorHandlerModel
-nortrafDbConnection : NtDbConnection
-statusCheckers : IStatusChecker
-timeoutChecker : TimeoutChecker
+ErrorHandler(in gui : MainFrame) : ErrorHandler
+checkStatus(in status : Status)
+exit()
+getDataRecHosts() : DataRecHost
+getGui() : MainFrame
+getModel() : ErrorHandlerModel
+handleNotification(in notification : StatusNotification)
+insertError(in error : Error)
+main(in args : string)
IGlobalConstants
+EXCEPTION_GENERAL_FORMAT : string
+FILE_CONFIG : string
+FILE_SUBSCRIPTIONS : string
+SUBSCRIPTION_STATUS_EVENT : string
Figure D.12: Class Diagram: no.vegvesen.errorhandler
no.vegvesen.errorhandler.dal
Config
ErrorHandlerModel
-drDbConfig : DatabaseConfig
-localPort : int
-ntDbConfig : DatabaseConfig
-servicePort : int
-subscriptionTimeout : int
+Config() : Config
+load(in fileName : string) : Config
+store(in fileName : string)
+PROPERTY_CONFIG : string
+PROPERTY_ERROR_LOG : string
+PROPERTY_SUBSCRIPTIONS : string
-config : Config
-errorLog : string
-subscriptions : Subscription
+ErrorHandlerModel() : ErrorHandlerModel
+addSubscription(in subscription : Subscription)
+removeSubscription(in subscription : Subscription)
+addErrorLogLine(in line : string)
Subscription
-drId : int
-host : string
-name : string
-subscriptionId : string
+Subscription() : Subscription
+Subscription(in drId : int, in subscriptionId : string, in name : string, in host : string) : Subscription
+load(in fileName : string)
+store(in subscriptions : Subscription, in fileName : string)
Figure D.13: Class Diagram: no.vegvesen.errorhandler.dal
149
Appendix D. Appendix: Design
no.vegvesen.errorhandler.dr.db
«interface»
IDrDbConnection
DrDbConnection
-dbDriver : DrDbDriver
+DrDbConnection(in config : DatabaseConfig) : DrDbConnection
-insertLoopStatuses(in loopStatuses : LoopStatus, in statusId : int)
IDrDbConstants
DrDbDriver
+DrDbDriver(in config : DatabaseConfig) : DrDbDriver
+getDriver(in config : DatabaseConfig) : DrDbDriver
+getInsertErrorQuery() : string
+getInsertLoopStatusQuery() : string
+getInsertStatusQuery() : string
+getSelectUnresolvedErrorsQuery() : string
+getUpdateErrorResolvedQuery() : string
#getConnectionUrl() : string
#getDriverClassName() : string
DrDbOracleDriver
+close()
+connect()
+getUnresolvedErrors(in drId : int) : Error
+insertError(in error : Error) : int
+insertStatus(in status : Status) : int
+setErrorResolved(in drId : int, in errorId : int)
DrDbMySqlDriver
+COLUMN_BATTERY_VOLTAGE : string
+COLUMN_CURRENT_FREQUENCY : string
+COLUMN_DESCRIPTION : string
+COLUMN_DR_ID : string
+COLUMN_ERROR_CODE : string
+COLUMN_ERROR_ID : string
+COLUMN_HITS : string
+COLUMN_LOOP_ID : string
+COLUMN_MAX_FREQUENCY : string
+COLUMN_MIN_FREQUENCY : string
+COLUMN_RESOLVED : string
+COLUMN_START_TIME : string
+COLUMN_STATUS_CHARACTER : string
+COLUMN_STATUS_ID : string
+COLUMN_TEMPERATURE : string
+COLUMN_TIMESTAMP : string
+COLUMN_TYPE : string
+TABLE_ERROR : string
+TABLE_LOOP_STATUS : string
+TABLE_STATUS : string
Figure D.14: Class Diagram: no.vegvesen.errorhandler.dr.db
no.vegvesen.errorhandler.service.dal
StatusNotification
-subscriptionId : string
-unitStatus : Status
+StatusNotification(in subscriptionId : string, in unitStatus : Status) : StatusNotification
Figure D.15: Class Diagram: no.vegvesen.errorhandler.service.dal
150
Appendix D. Appendix: Design
no.vegvesen.errorhandler.errorcheck
LoopChecker
+ERROR_CODE : int
+LoopChecker() : LoopChecker
«interface»
IStatusChecker
+checkStatus(in status : Status) : Error
FrequencyChecker
+ERROR_CODE : int
+FrequencyChecker() : FrequencyChecker
TimeoutChecker
+ERROR_CODE : int
-collectionLock : object
-controller : ErrorHandler
-running : bool
-timeout : long
-timestamps
+TimeoutChecker(in controller : ErrorHandler) : TimeoutChecker
+run()
+setRunning(in running : bool)
+updateTimestamp(in subscriptionId : string)
-checkTimestamps()
-triggerError(in subscriptionID : string)
Figure D.16: Class Diagram: no.vegvesen.errorhandler.errorcheck
no.vegvesen.errorhandler.net
ConnectionHandler
-connection : SocketConnection
-controller : ErrorHandler
+ConnectionHandler(in controller : ErrorHandler, in connection : SocketConnection) : ConnectionHandler
+run()
ConnectionManager
-controller : ErrorHandler
-running : bool
+ConnectionManager(in controller : ErrorHandler) : ConnectionManager
+run()
+isRunning() : bool
+setRunning(in running : bool)
Figure D.17: Class Diagram: no.vegvesen.errorhandler.net
151
Appendix D. Appendix: Design
no.vegvesen.errorhandler.nt.dal
DataRecHost
-host : string
-id : int
-name : string
+DataRecHost(in id : int, in name : string, in host : string) : DataRecHost
Figure D.18: Class Diagram: no.vegvesen.errorhandler.nt.dal
no.vegvesen.errorhandler.nt.db
NtDbConnection
«interface»
INtDbConnection
+NtDbConnection(in config : DatabaseConfig) : NtDbConnection
+close()
+connect()
+getDataRecHosts() : DataRecHost
-dbDriver : NtDbDriver
NtDbDriver
INrDbConstants
+NtDbDriver(in config : DatabaseConfig) : NtDbDriver
#getConnectionUrl() : string
#getDriverClassName() : string
+getSelectDataRecsQuery() : string
+getDriver() : NtDbDriver
NtDbOracleDriver
+COLUMN_ID : string
+COLUMN_IP : string
+COLUMN_NAME : string
NtDbMySqlDriver
Figure D.19: Class Diagram: no.vegvesen.errorhandler.nt.db
no.vegvesen.errorhandler.soap
Subscriber
+subscribeToEvent(in host : string, in eventName : string, in port : int) : string
+unsubscribeFromEvent(in host : string, in subscriptionId : string) : bool
Figure D.20: Class Diagram: no.vegvesen.errorhandler.soap
152
Appendix D. Appendix: Design
D.5
Database
In this section the database scheme is presented.
LoopStatus
Status
PK
PK
PK,FK1
PK
drId
statusId
statusId
loopId
status
description
hits
minFrequency
currentFrequency
maxFrequency
startTime
temperature
battery
time
Error
PK,FK1
PK
drId
messageId
FK1
statusId
errorCode
description
time
resolved
type
Figure D.21: Database Scheme of the Datarec Database
153
Appendix D. Appendix: Design
D.6
ONSITE server
In this section the design of the ONSITE Server is presented.
no.vegvesen.datarec.fetcher
fetcher::Dr7Client
fetcher::Dr7Communicator
-unitStatusHelpers : UnitStatusHelpers
-TrafficStatusHelpers : TrafficStatusHelpers
+Dr7Client()
+Dr7Client()
+trafficStatusHelpers()
+getUnitStatus()
+getTrafficStatus()
-getTrafficPort : GetTrafficPortType
-getServerPort : GetServerPortType
+Dr7Communicator()
+getTraffic()
+getServer()
fetcher::GetStatusException
+GetStatusException()
+GetStatusException()
+GetStatusException()
+GetStatusException()
no.vegvesen.datarec.fetcher.trafficstatus
trafficstatus::LaneAccumulatedData
trafficstatus::TrafficStatusHelpers
trafficstatus::VehicleStatus
-timestamp : Date
-laneId : int
-numberOfVehicles : int
-meanSpeed : int
+LaneAccumulatedData()
-com : Dr7Communicator
-timestamp : Date
-laneId : int
-speed : int
-length : int
-gap : int
-vehicleClass : int
-sequenceNumber : long
+VehicleStatus()
+fromString()
+TrafficStatusHelpers()
+getRecentVehicles()
+getAccumulatedData()
+getStartTime()
+getServerMessage()
trafficstatus::TrafficStatus
-recentVehicles : VehicleStatus[]
-laneAccumulatedDatas : LaneAccumulatedData[]
-startTime : Date
+TrafficStatus()
no.vegvesen.datarec.fetcher.unitstatus
unitstatus::UnitStatus
unitstatus::UnitStatusHelpers
-numLoops : int
-loopStatuses : String[]
-hits : int[]
-freqs : int[]
-startTime : Date
-battery : int
-temperature : int
+UnitStatus()
+UnitStatus()
+isEqual()
-com : Dr7Communicator
+UnitStatusHelpers()
+getTemperature()
+getBattery()
+getStartTime()
+getFrequencies()
+getHits()
+getLoopConnectionStatus()
+getTrafficMessage()
«enumeration»
unitstatus::LoopConnectionStatus
+Connected
+Open
+ShortCircuit
+BicycleLoop
+NA
+fromChar()
+fromString()
Figure D.22: Class Diagram of DrRegusterNotificationPusher
154
Appendix D. Appendix: Design
no.vegvesen.datarec.notifications
no.vegvesen.datarec.notifications.server
no.vegvesen.datarec.notifications.common
no.vegvesen.datarec.notificaions.common::CallbackInfo
no.vegvesen.datarec.notifications.server::RegisterNotifications
-callbackPath : string
-eventName : string
-address : string
-port : string
-id : UUID
+CallbackInfo()
+getRelativeCallbackPath()
+getEventName()
+getAddress()
+getPort()
+getAbsoluteCallbackPath()
+getId()
+toString()
+equals()
-events : List<String>
-port : int
-clientAddress : string
-context : WebServiceContext
+RegisterNotifications()
+registerNotification()
+unsubscribeFromEvent()
«interface»
no.vegvesen.datarec.notificaions.common::IDr7NotificationPusher
+addCallback()+removeCallback()
Figure D.23: Class Diagram of DrRegisterNotifications
155
E
Appendix: Further Use of Traffic Data
Contents
The Norwegian Public Roads Administration is at some point going to make parts of the
information that they gather public. This opens up for some new interesting ideas. Some
of these ideas need cooperation with other markets and business brands.
Cafeterias, gas stations and hotels A future use of the information could be to
notify roadside cafeterias, gas stations and hotels. If the counting of cars passing is
somehow coupled with GPS technology, it could tell roadside service installations if they,
statistically, would get new customers. This could be calculated from how long the
vehicles have been driving and in which direction they are traveling.
Traffic Jam Assessment The information can also be used to assess if it is a traffic
jam. If there is a traffic jam, information of this can be given to incoming vehicles through
signs informing them that they might want to take another route to their destination.
This could be for vehicles approaching on the same road and vehicles that are coming
onto this road.
Police, Ambulance and Firefighters The data could be sent to the vehicles used
by the police, ambulances and the firefighters. This information could then be used to
calculate the most efficient route to their destination.
Lottery There could be created a Vehicle Lottery. The lottery could either be based
on pure statistical use of the data, or with some kind of chip that is recognized as a
“lottery chip” to grant the vehicle the ability to participate. This method could also
be used to draw some people away from the more trafficated roads. A downside of this
is that it might take concentration away from driving, and increase the probability of
accidents.
Traffic Lights Real time traffic data could be used to control the traffic lights. With
real time control of the traffic flow, the vehicle pollution in the bigger cities might be
reduced.
Bibliography
Contents
[1] Aanderaa Data Instruments AS (AADI). (2007). Traffic6. Available: http:
//www.aadi.no/Datarec/Document%20Library/1/Technical%20Notes%20and%
20User%20Manuals/Traffic6.%20Users%20guide,%20version%206.516.pdf.
Last accessed 2011.09.15.
[2] Centre of Software Engineering. (1991). ISO 9126: The Standard of Reference
Available: http://www.cse.dcu.ie/essiscope/sm2/9126ref.html Last accessed
2011.11.19
[3] Conradi, Reidar. (2011). Mini-glossary of software quality terms, with emphasis on
safety. Available: http://www.idi.ntnu.no/grupper/su/publ/ese/index.html.
Pages: 1-6 Last accessed 2011.10.31.
[4] Fitzpatrick, Ronan. (1996). Software Quality:Definitions and Strategic Issues. Available: http://www.comp.dit.ie/rfitzpatrick/papers/quality01.pdf. Last accessed 2011.10.31.
[5] IEEE Computer Society. (2009). IEEE Standard for a Software Quality Metrics Methodology Available: http://ieeexplore.ieee.org/stamp/stamp.jsp?tp=
&arnumber=749159. Last accessed 2011.11.11.
[6] Microsoft. (2009). Recoverability. Available: http://technet.microsoft.com/
en-us/library/bb418967.aspx. Last accessed 2011.10.31.
[7] Norman Walsh. (1998). A Technical Introduction to XML. Available: http://www.
xml.com/pub/a/98/10/guide0.html?page=2. Last accessed 2011.09.05.
[8] NTNU - IDI Faculty. (2011). Compendium: Introduction to course TDT4290 Customer Driven Project, Autumn 2011. Available: http://www.idi.ntnu.no/emner/
tdt4290/docs/TDT4290-compendium-2011.pdf. Last accessed 2011.09.12.
[9] OPC Foundation. (2011). About OPC - What is the OPC Foundation?. Available:
http://opcfoundation.org/Default.aspx/01_about/01_whatis.asp?MID=
AboutOPC. Last accessed 2011.09.12.
[10] OPC Foundation. (2010). OPC XML-DA. Available: http://www.opcconnect.
com/xml.php. Last accessed 2011.09.12.
[11] OpenLayers (2011). OpenLayers Available: http://trac.osgeo.org/openlayers/
Last accessed 2011.11.17
[12] Oracle. (2011). What is Java?. Available: http://java.com/en/download/faq/
whatis_java.xml. Last accessed 2011.09.05.
157
Bibliography
[13] Software Engineering - An Object-oriented Approch. (2011). The Quality Assurance
Process Available: ISBN 978-0-471 - 32208-5 Page: 40 Last accessed 2011.11.22
[14] Sun Microsystems, Inc. (2003). Java 2 Platform, Enterprise Edition (J2EE)
Overview. Available: http://java.sun.com/j2ee/overview.html. Last accessed
2011.09.12.
[15] Tuckman’s Theory (2011). Tuckman’s team development theory. Available: Tuckman, B. Developmental sequence in small groups. Last accessed 2011.10.31
[16] Vegvesenet. (2011). På veg for et bedre samfunn. Available: http://www.vegvesen.
no/Om+Statens+vegvesen/Om+Statens+vegvesen/Om+organisasjonen. Last accessed 2011.09.01.
[17] Wikipedia. (2011). Google Docs. Available:
GoogleDocs. Last accessed 2011.09.14.
http://en.wikipedia.org/wiki/
[18] Wikipedia. (2011). LATEX. Available: http://en.wikipedia.org/wiki/LaTeX. Last
accessed 2011.09.14.
[19] Wikipedia. (2011). Quality Assurance Available: http://en.wikipedia.org/wiki/
Quality_assurance Last accessed 2011.11.19
[20] Wikipedia. (2011). Dropbox. Available: http://en.wikipedia.org/wiki/Dropbox_
(service). Last accessed 2011.09.12.
[21] Wikipedia. (2011). Subversion. Available: http://en.wikipedia.org/wiki/
Apache_Subversion). Last accessed 2011.09.15.
[22] Wikipedia. (2011). Simple Network Management Protocol. Available: http://
en.wikipedia.org/wiki/Simple_Network_Management_Protocol. Last accessed
2011.09.16.
[23] Wikipedia. (2011). RMON. Available: http://en.wikipedia.org/wiki/RMON. Last
accessed 2011.09.16.
[24] Wikipedia. (2011). SOAP. Available: http://en.wikipedia.org/wiki/SOAP. Last
accessed 2011.09.16.
[25] Wikipedia. (2011). Statens vegvesen. Available: http://no.wikipedia.org/wiki/
Statens_vegvesen. Last accessed 2011.09.19.
[26] Wikipedia. (2011). Scrum (development). Available: http://en.wikipedia.org/
wiki/Scrum_(development). Last accessed 2011.09.22.
[27] Wikipedia. (2011). Waterfall model. Available: http://en.wikipedia.org/wiki/
Waterfall_model. Last accessed 2011.09.22.
[28] Wikipedia. (2011). ISO/IEC 9126. Available: http://en.wikipedia.org/wiki/
ISO/IEC_9126. Last accessed 2011.10.31.
158
Bibliography
[29] Wikipedia. (2011). Publish/Subscribe Available: http://en.wikipedia.org/wiki/
Publish/subscribe. Last accessed 2011.11.10.
[30] Wikipedia. (2011). GlassFish Available:
GlassFish. Last accessed 2011.11.11.
http://en.wikipedia.org/wiki/
[31] Wikipedia. (2011). Milestones Available:
http://en.wikipedia.org/wiki/
Milestone_(project_management) Last accessed 2011.11.14
[32] Wikipedia. (2011). Faraday cage Available:
Faraday_cage Last accessed 2011.11.18
http://en.wikipedia.org/wiki/
[33] Wikipedia. (2011). IEC 9126 Available: http://en.wikipedia.org/wiki/ISO/
IEC_9126 Last accessed 2011.11.19
159
Bibliography
160