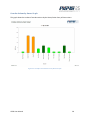
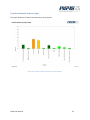
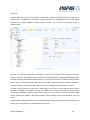
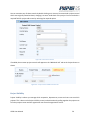
Actions Closed by Priority per Month Graph
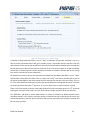
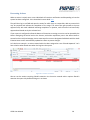
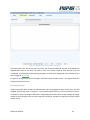
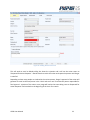
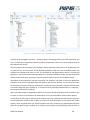
This graph shows the number of closed actions in each month of a selected year by their priority.
Figure 47 - Example “Actions Closed By Priority per Month Graph”
ATMS User Manual
42