1
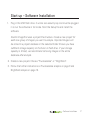
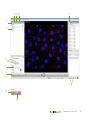
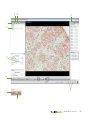
USER MANUAL
is an image analysis
software that objectively quantifies PLA signals
and cell nuclei.
Table of Contents
Product Information ................................................................................. 5
Image Aquisition ....................................................................................... 6
Start up – Software Installation .............................................................. 7
Fluorescence Analysis ............................................................................. 8
Brightfeld Analysis .................................................................................... 12
Support Information .................................................................................. 16
4
- Table of Contents
Product Information
USB FLASH DRIVE
The USB flash drive contains the installation file for Duolink ImageTool.
The USB flash drive has a 16 GB storage capacity to facilitate image transfer
or storage of analyzed projects.
NOTE! The USB flash drive works as a software protection key. All files and
folders on the device at delivery are therefore vital. The USB flash drive
must be plugged into the computer to run the software in full mode.
IMAGE IMPORT
The import function allows direct image import from four well-known
microscope brands: Zeiss (.zvi), Leica (.lif), Olympus (.oif) and Nikon (.ics).
It is also possible to import jpg and tiff images (grayscale and color).
SOFTWARE UPDATE
The software automatically checks monthly for new updates. Manual
checks can also be done under the “Help menu”.
REQUIREMENTS
Duolink ImageTool can be installed and used on computers with the
following 32-bit or 64-bit operating systems: Windows XP, Windows Vista
or Windows 7.
- Product Information
5
Image Acquisition
The PLA signal is recognized as a spot; an individual signal is of submicrometer size. The result from a Duolink experiment is typically a number
of discrete PLA signals in various locations of the studied cell- or tissue
samples.
If images are acquired in a single focal plane, several signals can be either
above or below the current focus. To detect all PLA signals it is thus
necessary to acquire images at several focal planes through the thickness
of the sample. However, you may acquire images with a single focal plane
as long as all images to be compared are acquired with similar focus within
the sample.
If the primary antibodies are not properly titrated, the density of signals
may be so high that the signals merge. Duolink ImageTool can not quantify
regions of merged signals; only separable signals can be counted. For
images taken with fluorescence microscopy, a quality control function
displays a warning if signals are merged.
If nuclei are densely packed or tissue sections are thick, single cell
measurements may be inaccurate. Cell detection is easily verified by visual
inspection of the cell outlines.
6
- Image Aquisition
Start up – Software Installation
1. Plug in the USB flash drive. It works as a security key and must be plugged
in to run the software in full mode. Start the Setup file and install the
software.
Duolink ImageTool uses a project file structure. Create a new project for
each new group of images you want to analyze. Imported images will
be stored in a project database in the selected folder. Ensure you have
sufficient storage capacity on the hard- or flash drive. If your storage
capacity is limited, we recommend removing images or the entire
database after analysis.
2. Create a new project. Choose “Fluorescence” or “Brightfield”.
3. Follow the further instructions on Fluorescence analysis on page 8 and
Brightfield analysis on page 12.
- Software Installation
7
Fluorescence analysis
A. Start by importing the images to be analyzed. Import the original
microscope file formats if available; .zvi (Zeiss), .lif (Leica), .oif (Olympus),
or .ics (Nikon) (1). Merged .tiff and .jpg color images, containing both the
signal and nuclei channel, are also imported with this function. Image data
where different channels and z-slices are stored in separate tiff-files can be
imported with the Special TIFF import (2).
Follow the import progress on the progress bars (3).
B. A project database is created and all images imported to the database are
listed (4).
C. Change the channel properties for the signal- and nuclei channels if they are
not correctly defined (5).
D. Check image quality (6). This function checks for merged signals. Images
containing merged signal regions will be marked by an “X”. These images
should be visually verified for analytical quality. Duolink ImageTool can not
correctly quantify regions of merged signals, only separable signals are
quantified. Images marked with “OK” do not contain merged signals.
E. Select one of the images in the database and push the Preview button (7).
8
- Flourescent Analysis
2 6 12
11
1
4
8
5
7
3
9
10
- Fluorescent Analysis
9
Now start optimizing the Cell- and Signal properties (8) to quantify the
number of PLA signals and nuclei in your selected image. There are a
number of tools and functions to help you. The complete list of functions
can be found in the Help file under the Help menu.
F.
G. Each time a setting is changed that is not automatically visualized on the
computer screen the Preview- and Analyze buttons will be highlighted in
pink. Push Preview (9) to refresh and get a new correct preview of the
result overlay.
H. PLA signals marked with white circles and nuclei outlined in yellow are
quantified at analysis. The green outlines represent the user defined
cytoplasm size. When the outlines and white circles correspond well to the
content of the original microscope image, push Analyze (10). All images in
the project database will be analyzed with the selected settings.
Follow the progress of the analysis on the progress bars (3).
Click the Export result button to export the analyzed data into text files that
can be opened and further analyzed with Excel (11).
I.
The number of detected PLA signals and nuclei is exported into two text
files. The Single_cell_results file contains the total number of signals per
cell, and the Summary_of_results file contains the total number of signals
and nuclei for each analyzed image.
Images can be exported with split color channels or as RGB images.
Furthermore, the results overlay can be added to the exported images (12).
10
- Flourescent Analysis
2 6 12
11
1
4
8
5
7
3
9
10
- Fluorescent Analysis
11
Brightfield analysis
A. Start by importing the images to be analyzed (1). Import the original
microscope file formats if available; .zvi (Zeiss), .lif (Leica), .oif (Olympus),
or .ics(Nikon). Merged .tiff and .jpg color images, containing both the
signal and nuclei channel, are also imported with this function. Image data
where different channels and z-slices are stored in separate tiff-files can be
imported with the Special TIFF import (2).
Follow the import progress on the progress bars (3).
B. A project database is created and all images imported to the database are
listed (4).
C. Select one of the images in the database and push the Preview button (5).
D. Now start optimizing the Cell- and Signal properties (6) to quantify the
number of PLA signals and nuclei in your selected image. There are a
number of tools and functions to help you. The complete list of functions
can be found in the Help file under the Help menu.
E. Each time a setting is changed that is not automatically visualized on the
computer screen the Preview- and Analyze buttons will be highlighted in
pink. Push Preview (7) to refresh and get a new correct preview of the
result overlay.
12
- Brightfeld Analysis
2 10
9
1
4
6
5
3
7
8
- Brightfeld Analysis
13
PLA signals marked with red circles and nuclei outlined in yellow are
quantified at analysis. The green outlines represent the user defined
cytoplasm size. When the outlines and red circles correspond well to the
content of the original microscope image, push Analyze (8). All images in
the project database will be analyzed with the selected settings.
F.
Follow the progress of the analysis on the progress bars (3).
The result overlay will be available for all the images after analysis. Verify the
results by comparing the result overlay with the microscope images.
G. Click the Export result button to export the analyzed data into text files that
can be opened and further analyzed with Excel (9).
The number of detected PLA signals and nuclei is exported into two text
files. The Single_cell_results file contains the total number of signals per
cell, and the Summary_of_results file contains the total number of signals
and nuclei for each analyzed image.
Images can be exported with split color channels or as RGB images.
Furthermore, the results overlay can be added to the exported images (10).
14
- Brightfeld Analysis
2 10
9
1
4
6
5
3
7
8
- Brightfeld Analysis
15
For Technical Support, please contact us at:
[email protected]
This product is for research use only. Not for use in human diagnostic or therapeutic procedures.
This product includes a licence for non-commercial use of the Duolink product. Commercial users will require additional
licenses. Please contact Olink AB for details.
There are no warranties, expressed or implied, witch extend beyond this description. Olink AB is not liable for property
damage, personel injury, or economic loss caused by this product.
The following trademarks are owned by Olink AB: Olink®, Olink Bioscience, Duolink® and PLA®.
Olink Bioscience, Dag Hammarskjölds v. 54A
SE-751 83 Uppsala, Sweden
www.olink.com
0660, v. 1.1, 2010-11-11
Duolink® ImageTool is developed by Izolde Image Intellegence.