1
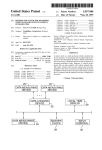
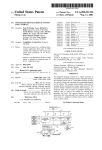
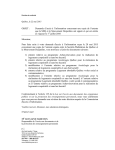
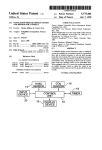
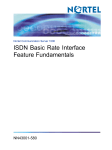
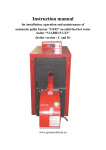
US006092021A
Ulllted States Patent [19]
[11] Patent Number:
Ehlbeck et al.
[45]
[54]
6,092,021
Date of Patent:
Jul. 18, 2000
FUEL USE EFFICIENCY SYSTEM FOR A
4,747,301
5/1988 Bellanger ............................. .. 73/117.3
VEHICLE FOR ASSISTING THE DRIVER T0
4,845,630
7/1989
IMPROVE FUEL ECONOMY
4,945,759
8/1990 Krofchalk et a1
5,017,916
5/1991
.
5,074,144
12/1991
[75] Inventors‘ JGaéleltezs lgi'n?grlbgcslgiigagnéeé?gish"
5,148,702
.
dA P
Jare
-
’H_ Chg, ’ h
"We >
L
“Stop er
r“,
5,303,163
5,652,378
5,693,876
[73] Assignee: Freightliner Corporation, Portland,
0mg
Londt et a1. ...... ..
73/117.3
340/87013
Krofchalk et a1. ................... .. 73/117.3
9/1992 Gulick, Jr. .............................. .. 73/114
4/1994 Ebaugh et a1. ..
701/35
. 340/439
7/1997 Dussault .... ..
73/114
12/1997 Ghitea, Jr. ............................... .. 73/114
Cadec, Celect RoadRelayTM, User’s Guide, Cadec Systems,
Inc., Londonderry, NH, Cummins Electric, 1993.
_
Flyer, Detroit Diesel, ProDriverTM, User Manual, 1994.
Flled'
Dec' 1’ 1997
Operating and Error Codes, Series 925/205, FloScan Instru
[51]
Int. Cl.7 .............................. .. G06G 7/70; G01L 3/26
[52]
US. Cl. ............................. .. 701/123; 701/29; 73/113;
73/114; 73/1173; 73/115
[58]
. . . .. 701/123
OTHER PUBLICATIONS
[21] Appl- NO-I 08/982,117
.
........
5,173,856 12/1992 Purnell e161. ..
-
both of Portland, Oreg-
[22]
Stephens
Field Of Search .............................. .. 701/30 29 123
701/32; 73/113, 114, 112, 116, 115, i173:
119 A; 340/439, 325.06, 462, 870.16, 436,
870~13> 461; 123/478> 480; 477/100> 42>
43> 107
_
[56]
Inent Company, Inc, S9a?19,WA, 4/93'
C_at9rp_i11ar©, Owner’s Manual, Caterpillar Driver Informa
Hon D1sp1ay,F9b-, 1995
J01"” SAE/TMC Electronic Dam Interchange Between
Microcomputer Systems in Heavy—Duty Vehicle Applica
"0% 1988
Primary Examiner—Jacques H. Louis-Jacques
Attorney, Agent, or Firm—Klarquist Sparkman Campbell
Leigh & Whinston, LLP
References Cited
57
U.S. PATENT DOCUMENTS
[ 1
_
ABSTRACT
Afuel ef?ciency monitoring and display system for a vehicle
""""""""""""""" "
dynamically evaluates vehicle performance parameters to
4’157’030
6/1979 Keely _______ _____ _
73/113
detect conditions that cause excessive fuel consumption.
4:247:757
4,258,421
1/1981 Crump’ 1L
3/1981 JuhasZ et a1,
73/114
701/35
The conditions include increased aerodynamic drag due to
excessive speed, high RPM, braking and accelerating,
4,384,479
5/1983
Handtmann . . . . . .
. . . . .. 73/114
excessive idling, and rapid throttle movements. The system
4,400,779 8/1983 Kosuge et a1
4,475,380 10/1984 colovas et a1~ ~~
701/123
dynamically estimates gross vehicle Weight, roadWay grade
(sgnifer """
a
’
'''''
73/114
''''
to man“ 6 a‘ "
to the driver When inefficient fuel use is detected. For
glicslflilgeettagi """ "
4’57O’226
2/1986 Aussedat
4,663,718
4,706,083
example, it displays a measure of excess fuel consumed and
"""701/123
4j630:027 12/1986 Muhlberger et a1_
5/1987 Augello et a1. .... ..
and drag factor from monitored parameters and uses these
estimates to detect inef?cient fuel use. The system indicates
701/30
messages indicating actions that can be taken to improve
fuel economy in response to detecting inefficient fuel use.
.. 73/114
11/1987 BaatZ et a1. ............................. .. 73/113
54 Claims, 13 Drawing Sheets
INPUT
MODULE
180
l 1
128
6
122
5
SELECTED
MGIDPLIJELE
l
VEHICLE
PERFORMANCE
PARAMETERS
EXCESS
\\
f MODULE
124
l
F—-—
DISPLAY
DR‘VER
MODULE
182
THROTTLE f192
DRIVER
P’ MESSAGE
CENTER
126
@184
_. PARAMETER W186
(CRUISE)
U.S. Patent
Jul. 18,2000
FIG. 1
22
ENGINE
J
ECU
ECU
J
LINsTRuMENTATION
CONTROL UNIT
DATA
PORTW
26
30
FIG-2 56 1
RPM
THROTTLE.
SPEED
FUEL
CONTROL
POSITION
A
52
CRuIsE
STATUS
>8
6,092,021
28 24
2 ECU
2°
W
I
Sheet 1 0f 13
INJECTOR 7
L
A
50
48
46
MEMORY l‘" "
"/1,
‘
=CPU
V
10
PORT
4g
INTERFACE 44
A
S
V
(
20J
FIG_ 3
’
DISPLAY
II
MEMORY
II
S2
6Q
66
ROM
J
67 =
RAM
,
,
,
CPU
J
68
EEPROMJ
II
PORT
W
INTERFACE 64
A
V
20-1
U.S. Patent
Jul. 18,2000
FIG. 4
Sheet 2 0f 13
6,092,021
104
,/
100
(NORMAL DRIVING MESSAGE) J
8.4 MPG
191321.? MI
106
108
F G. 5
110
112
,/
f
,
102
0.6 MPGAIN J
(PROMPTING MESSAGE)
114
SER'AL
INPUT
J
0201 —~
I +
/
128
VPE
f MODULE
122
l
INPUT
DATA
EXCESS
f MODULE
124
1
1
‘
DISPLAY
K DR'VER
126
DRIvER
_ MESSAGE
V CENTER
U.S. Patent
Jul. 18,2000
Sheet 3 0f 13
6,092,021
START
VPE
II
CONVERT MONITORED
PERFORMANCE DATA
V0=VCURRENT
II
I
CALCULATE V,
TORQUE, HP,
AND BRAKE STATUS
RESET
n
FSum
V’\2 Sum
%GR, VSUm
II
N=N+1
I
COMPUTE AVERAGE
ACCELERATION
I
COMPUTE CURRENT
TRACTIVE FORCE, F
‘I
UPDATE
FSum
VSUm
VAZSUm
_/156
COMPUTE DIFFERENCE
BETWEEN ACTUAL AND
ESTIMATED VELOCITY
0
FIG. 7A
U.S. Patent
Jul. 18,2000
Sheet 4 0f 13
6,092,021
160
IS
VEHICLE
SUSTAINING HIGH
ACCELERATION
NO
SET GAIN
TO ZERO _)
SET GAIN FOR VEHICLE
WEIGHT ESTIMATE
BASED ON V
ESTIMATE
_/ 'I 66
GROSS WEIGHT
II
ESTIMATE
ROADWAY GRADE
_/168
‘I
SMOOTH
VARIATIONS f17o
IN GRADE
CALC.
II
UPDATE THE _/172
DRAG FACTOR
I
RETURN
|:|G_ 75
U.S. Patent
Jul. 18,2000
Sheet 5 0f 13
6,092,021
FIG. 8
F180
SELECTED
‘1| r184
E PARAMETER W186
VEHICLE
MODULE
PERFORMANCE
~ PERCENT _/188
PARAMETERS
THROTTLE
L SPECIFIC FUEL _/190
K182
CONSUMPTION
, THROTTLE _/192
(CRUISE)
200
VEHICLE
NOT BEING
RETARDED
& HP EXCEEDS
THRESHOLD
'
I
204
MAINTAIN
YES r202
J
CURRENT Sa
UPDATE SHORT TERM
AVERAGE SPEED, Sa
‘7
FIG. 9A
YES
(-208
SET TO
PREDETERMINED
VALUE
V
I
U.S. Patent
Jul. 18,2000
Sheet 6 0f 13
6,092,021
208
DIFFERENCE
BETWEEN CURRENT
SPEED AND S8.
EXCEED
LIIXIIT
YES (-210
INCREMENT/ DECREMENT
CURRENT SPEED LIMIT
FIG. 9B
YES 214
SET SLim 7/
I
CALCULATE INCREMENTAL
216
HORSEPOWER REQUIRED J
TO OPERATE VEHICLE AT
SPEEDS EXCEEDING SLlm
COMPUTE EXCESS
FUELguoEmTsgmo
INCREASED DRAG
4
II
RETURN
2'26
EXCESS
FUEL : FP,
II
J
v /
EXCESS
FUEL=O
U.S. Patent
Jul. 18,2000
Sheet 7 0f 13
6,092,021
START
RPM
II
240
COMPUTE CURRENT J
ENGINE SPEED LIMIT, ESL
II
CALCULATE AND COMPARE
CURRENT RATIO OF VEHICLE
242
SPEED TO ENGINE SPEED /
WITH PREVIOUS RATIo
FIG. 10
244
RATIOS
WITHIN LIMIT &
MPH < L_SLlm
(TP > mIn OR
TC=1)
'7
248
SET RATIO
STATUS
SET RSI
_/246
TO ZERO
IND_II%A;I'OR
II
CALCULATE
INEFFICIENT
FUELUSED
FoR EXCESS RPM
II
RETURN
f
250
__J
U.S. Patent
Jul. 18,2000
Sheet 8 0f 13
IDLEIE‘EIILC '
SETIDLING 272
PARAMETER .J
6,092,021
FIG. 11
NOTIDLING
276
CURRENT
IDLE TIMER >
I LIM
ADD CURRENT INCREMENT
.J
OF FUEL TO THE
INEFFICIENT FUEL CONSUMED
v
INCREMENT CUMULATIVE 580
AND CURRENT IDLE TIMERS
<
V
RETURN
‘'
54
U.S. Patent
Jul. 18,2000
Sheet 11 0f 13
NO
BRAKES &
6,092,021
354
BRAKE : BAI &
TP <9Tmin
l RAt = o
_
358
‘
CALC. MODIFIED BRAKE
360
RELEASE SPEED
/
376
/
0 /
|BRSC=MPHI |BRSC=O|
j 382
FIG. 12C
U.S. Patent
Jul. 18,2000
IS
CURRENT
Sheet 12 0f 13
F400
6,092,021
FIG. 13
NO
SFC > SFCa*REFERENCE
& MP_H >
LSLIm
’)
‘YES
CALCULATE INCREASE IN
SPECIFIC FUEL CONSUMPTION
II
CALCULATE RATE OF
406
_.J
CHANGE IN THROTTLE
TRATE >
TLim OR PREVIOUSLY
EXCESSIVE
NO
‘7
YES
CALCULATE INEFFICIENT _)
FUEL CONSUMED
II
RETURN
'
U.S. Patent
Jul. 18,2000
Sheet 13 0f 13
6,092,021
FIG. 14 @
ACCUMULATE ACTUAL /-42()
FUEL CONSUMED
I
ACCUMULATE EXCESS FUEL f422
DURING CURRENT INTERVAL
I
UPDATE TOTAL [424
EXCESS FUEL
I
ACCUMULATE EXCESS FUEL f426
CONSUMED FOR EACH SOURCE
II
FIG. 15
440
NO
DISABLE
DISPLAY IIPAESSAGE
FIG. 16
4 YES
|
4
REsET PARAMETER
442
P
®
UPDATE FILTERED
‘
DETERMINE WHICH DRIVING 344
TYIPA%§T%>D(NCSE%I§H§SETLHE
v
ASSIGN DISPLAY $46
VARIABLE
460
j
EXCESS FUEL
I
462
| UPDATE FILTERED FUEL I)
I
464
UPDATE FILTERED J
THROTTLE POSITION
‘
‘I
RETURN
UPDATE AVERAGE
SPECIFIC FUEL CONSUMED
II
466
6,092,021
1
2
This embodiment includes an output device, namely a
FUEL USE EFFICIENCY SYSTEM FOR A
VEHICLE FOR ASSISTING THE DRIVER TO
IMPROVE FUEL ECONOMY
display device, to indicate a measure of the excess fuel
consumed due to a detected condition that has caused the
vehicle to consume excess fuel. It also uses the output device
to provide the driver With prompting messages indicating the
TECHNICAL FIELD
cause of the excess fuel consumption and a driver action that
can be taken to reduce excess fuel consumption. For
The invention relates to a fuel ef?ciency indicator in a
vehicle, and more speci?cally relates to a system for
example, in response to detecting excess fuel consumption
dynamically detecting inefficient driving actions and indi
cating information about excess fuel consumption to the
driver.
due to braking and accelerating, the display prompts the
10
Other types of output devices can be used to convey this
information to the driver such as an audio speaker to provide
BACKGROUND OF THE INVENTION
With rising fuel costs, an important design goal of vehicle
information systems is to provide drivers, and especially
drivers of long-haul trucks, With information about fuel
economy during operation of the vehicle. Many vehicles
the information aurally.
15
BRIEF DESCRIPTION OF THE DRAWINGS
FIG. 1 is a block diagram illustrating the system archi
in miles per gallon. While this information is helpful, it does
not give the driver speci?c feedback on hoW speci?c driving
actions impact fuel economy. In addition, it fails to provide
tecture in a truck for one embodiment of the invention.
a measure of excess fuel consumption due to speci?c types
25
Modern motor vehicles are typically equipped With a
variety of onboard computers for measuring and recording
vehicle performance and diagnostic data. These devices
provide a great deal of information about the performance of
the vehicle during operation. The problem is not lack of
information, but rather, evaluating it and conveying it to the
compute and display information about inef?cient driving
indicator that uses this data to assist the driver to operate the
vehicle more ef?ciently and take actions that avoid excess
35
SUMMARY OF THE INVENTION
The invention provides a fuel ef?ciency system and
related method that indicate When the driver is operating the
vehicle inef?ciently. This system provides feedback to the
driver When the vehicle is consuming excess fuel due to
implementation of the Vehicle Parameter Estimation Mod
ule of FIG. 6.
FIG. 8 is a block diagram depicting a parameter sub
module in the excess module shoWn in FIG. 6.
FIGS. 9A and 9B are a How diagram of speed sub-module
in the excess module for detecting inef?cient fuel use due to
speeding.
FIG. 10 is a How diagram of an RPM sub-module in the
excess module for detecting inef?cient fuel use due to
inef?cient driving actions. It monitors vehicle performance
data and dynamically analyZes the data to determine When
the driver’s actions result in inef?cient fuel use. When the
FIG. 2 is a block diagram illustrating the engine electronic
control unit (ECU) in more detail.
FIG. 3 is a functional block diagram illustrating the
architecture of the instrumentation control unit (ICU).
FIG. 4 is a diagram of a display format generated by the
ICU in FIG. 3 to display normal driving messages.
FIG. 5 is another diagram of a display format generated
by the ICU to indicate inef?cient driving conditions and
suggest an action to improve fuel efficiency.
FIG. 6 is a How diagram illustrating modules used to
conditions in one embodiment of the invention.
FIGS. 7A and 7B are a flow diagram illustrating an
driver in a useful fashion. There is a need for a fuel ef?ciency
fuel consumption.
Further advantages and features of the invention Will
become apparent With reference to the folloWing detailed
description and accompanying draWings.
display a measure of fuel economy such as the gas mileage
of driving actions. Drivers are less likely to get information
that can help them improve fuel economy from these fuel
economy measures, and thus, are more likely to ignore them.
driver With a text message stating, “Drive Steady Speed.”
45
operating the vehicle at a high RPM.
FIG. 11 is a How diagram of an idling sub-module in the
system detects a condition that cause the vehicle to consume
excess module for detecting inef?cient fuel use due to
excess fuel, it indicates the presence of the condition to the
driver.
In one embodiment of the invention, the fuel ef?ciency
excessive idling.
FIGS. 12A—C are a ?oW diagram of a braking/
accelerating sub-module in the excess module for detecting
inef?cient fuel use due to frequent braking and accelerating
conditions (i.e., fuel lost due to changes in kinetic energy of
system displays a message indicating that fuel inef?cient
driving has been detected. In addition, the system also
the vehicle).
provides the cause of excess fuel use and suggests an action
that the driver can take to fuel economy. This embodiment
also computes the amount of excess fuel consumed due to
inef?cient driving and displays a measure of it to the driver.
FIG. 13 is a How diagram of a throttle sub-module in the
excess module for detecting inef?cient fuel use due to rapid
55 throttle movement.
In this embodiment, the system monitors several inef?
FIG. 14 is a How diagram of a total sub-module in the
cient driving conditions, including excessive speed leading
to increased aerodynamic drag, high engine RPM, excessive
idling, frequent braking and accelerating, and rapid throttle
excess module for accumulating fuel consumption values.
FIG. 15 is a How diagram of a display sub-module in the
excess module for determining Whether to display a message
regarding inef?cient fuel use for an inef?cient driving action
evaluated in the excess module.
FIG. 16 is a How diagram of an average sub-module in the
excess module for ?ltering selected variables.
movement. During operation of the vehicle, the system
dynamically determines Whether these inef?cient driving
conditions are present. In evaluating the vehicle perfor
mance data, the system evaluates performance parameters to
distinguish betWeen inefficient and normal driving actions.
When inef?cient driving is detected, the system computes a
measure of excess fuel consumed due to the inef?cient
driving action.
65
DETAILED DESCRIPTION
One embodiment of the invention is a fuel ef?ciency
monitoring and display system implemented using elec
6,092,021
3
4
tronic control units onboard a truck. In particular, this
embodiment includes an instrumentation control unit for
detecting and displaying information about inef?cient driv
speed control 50 senses the speed of rotation of the tail shaft
of the transmission and converts it into road speed. A
magnetic sensor located on the tail shaft generates an analog
ing conditions, and one or more control units or discrete
signal comprised of a series of pulses representing the
sensors for monitoring vehicle performance data. The next
section describes the system architecture of the electronic
rotation rate of the tail shaft or drive shaft. This analog signal
is converted into a digital signal. The engine ECU is
programmed to read this digital signal and derive the instan
taneous vehicle speed in miles per hour.
The engine ECU is responsible for monitoring a variety of
control units onboard a vehicle in this embodiment. Later
sections describe an implementation of the fuel ef?ciency
system and related methods in more detail.
The System Architecture
FIG. 1 is a block diagram illustrating the system archi
10
vehicle performance data in an embodiment of the inven
tion. The system architecture includes a number of elec
tronic control units (ECU) interconnected via a data link 20.
In particular, the system shoWn in FIG. 1 includes an engine
ECU 22, located at the engine, and an instrumentation
control unit 24, located at the dash of the truck. As shoWn,
other optional ECUs 26, 28 can be connected to the data link
20. Finally, the system includes an optional data port 30, for
coupling external data processing equipment to the ECUs on
and turbo boost pressure. These parameters are transferred to
the instrumentation control unit over the data link.
The Instrumentation Control Unit
20
FIG. 3 is a functional block diagram illustrating the
architecture of an instrumentation control unit (ICU) used to
detect inefficient fuel/use and control a driver display in one
implementation of the invention. The instrumentation con
trol unit comprises a CPU 60, memory 62 and a port
interface 64 for connecting the unit to the data link 20. The
25
RAM 67 and permanent ROM 68. The routines for control
ling the ICU are stored in ROM 68, While re-con?gurable
data is stored in the EEPROM 68.
In one speci?c implementation, the ICU includes a
15
memory 62 includes programmable ROM (EEPROM) 66,
board the truck. This data port enables an external computer,
for example, to receive and transmit messages on the data
link. It also enables an external computer to doWnload data
or a ?le to an ECU and to receive data or a ?le from an ECU.
The Engine Control Unit
FIG. 2 is a block diagram illustrating the engine ECU
used to collect vehicle performance data in the system
shoWn in FIG. 1. The engine ECU includes memory 40, a
CPU 42, and a port interface 44 connected via a bus structure
46. The CPU 42 executes routines stored in the memory 40
other vehicle performance parameters, including RPM, and
throttle position. It derives engine torque from the fuel rate,
tecture of electronic control units in a truck used to monitor
68HC11 microprocessor from Motorola Corporation, and its
memory 62 comprises EEPROM, ROM, and RAM. This
speci?c ICU has 8 KB of external EEPROM, 128K of ROM
to control and monitor engine performance. The port inter
and 2K of RAM. The internal memory of the CPU comprises
256 Bytes of RAM and 512 bytes of EEPROM. This is only
one speci?c implementation of the ICU. A variety of con
face 44 serves as a link betWeen the CPU 42 and a serial
ventional processors and memory systems can be used to
30
communication path called the data link 20.
implement the functionality of the instrumentation control
The engine ECU also includes a variety of sensors and
controls used to monitor and control the engine. In this
unit.
Preferably, the processor used in the ICU should be a 16
bit processor. The processor used in the current implemen
tation Was selected to have suf?cient speed and memory to
be able to evaluate ?ve different fuel inef?cient driving
35
implementation, the engine ECU controls the fuel rate by
issuing control signals to a fuel injector 48 that controls the
How of fuel to the engine’s cylinders. This implementation
of the ECU includes several sensors that monitor vehicle
performance, including a speed sensor 50, an RPM sensor
conditions every 200 ms. This is not an absolute
40
requirement, hoWever, since the number of inefficient driv
Some vehicle performance parameters are computed from
ing conditions that are monitored and the response time can
vary.
measured data. For example, the engine torque is computed
The ICU also preferably includes an input device 70 and
52, a throttle position sensor 56 and a cruise status sensor 58.
a display device 72. In one implementation, the input device
as a function of measured parameters, including fuel rate and
45 is a ten key keypad 70, but the speci?c design of the input
turbo boost pressure.
The engine ECU controls the fuel rate and serves as a fuel
device can vary. The design of the input device can vary. The
rate measuring device for the system. It compares the
throttle position to the percent engine load. If their is a
display device 72 provides a textual and graphical output to
the driver display. In one speci?c implementation, the dis
difference, then the engine ECU changes the dWell time of
the fuel injector (increases or decreases the fuel injected into
the cylinder). Before the engine ECU applies the dWell to the
play device comprises a tWo line by 20 character vacuum
fuel injector, it processes the dWell time further to limit
emissions. The emission control computation can modify
factured by Joseph Pollak of Boston, Mass. for Freightliner
Corporation. The instrumentation control unit is presently
the injection timing and dWell.
In this implementation, the engine ECU determines the
amount of fuel supplied to the cylinders in the engine by
controlling the solenoid valves that inject fuel to the engine
cylinders. The rate of fuel How is directly related to the
amount of time that the solenoid valve is closed. This time
period determines the volume of fuel injected into a cylinder
per revolution. By determining the amount of time that the
solenoid valves are closed, the engine ECU computes the
amount of fuel consumed by the engine. The engine ECU
calculates the fuel ?oW rate from the dWell of the injection
pulse and the engine speed.
The engine ECU in this embodiment is also responsible
for measuring and computing the vehicle’s road speed. The
?uorescent display.
The particular ICU used in this implementation is manu
55
available as a replacement part from Freightliner Corpora
tion.
The Data Link
The data link 20, in this implementation, is a serial
communication path connecting the ECUs together. This
60
particular data link is designed according to SAE J 1708, a
standard for serial data communication betWeen microcom
puter systems in heavy duty vehicle applications. While this
speci?c embodiment is based on the J 1708 standard, it is not
critical that the invention be implemented in this speci?c
manner. One possible alternative is to use a data link
65
constructed according to SAE J 1939. The communication
link need not be a shared communication path. It is also
possible to connect vehicle parameter sensors (i.e., for road
6,092,021
5
6
speed, fuel rate, RPM, torque, throttle position, etc.) directly
In some cases tWo or more transmitters may attempt to
to the ICU via discrete Wiring.
In the embodiment shoWn in FIG. 1, the data link 40 is
comprised of a tWisted pair cable operating at 9600 baud.
Designed according to the SAE 11708 standard, the data link
broadcast a message at one time, giving rise to a collision.
To resolve a con?ict among transmitters, messages have a
priority according to their message identi?ers. The MIDs of
higher priority transmitters have a greater number of bits set
forms a communication channel among the electronic con
at a logic level one. When more than one message is
broadcast at a time, the more dominant message takes
trol units coupled to it. Electronic control units generate a
digital signal on the data link by applying a voltage differ
ential betWeen the tWo Wires in the cable. A voltage differ
ential above a speci?ed threshold represents a logic high
value, While a voltage threshold beloW a speci?ed threshold
represents a logic loW value. This type of data link is
priority over lesser dominant messages. Since a loWer pri
ority message is blocked by a higher priority message, the
10
particularly advantageous for hostile environments because
the signal is more robust and impervious to signal degrada
tion. HoWever, other alternative communication media
could be used in place of the 11708 cable.
15
The ECUs connected on the netWork communicate With
each other according to protocols de?ned in SAE 11708 and
SAE 11587. The SAE 11587 standard is entitled “1oint
SAE/TMC Electronic Data Interchange BetWeen Micro
computer Systems and Heavy Duty Vehicle Applications.”
transmitter of the loWer priority message must Wait and
retransmit the message after another lull. An ECU on the
data link Will continue to attempt to send a message until it
20
is successfully broadcast to the data link.
As introduced above, the ICU obtains vehicle performance
data from the data link and uses selected parameters to detect
inef?cient driving conditions and compute eXcess fuel con
sumed. Table 1 beloW summariZes the selected parameters
from the data link that the ICU uses to monitor fuel
ef?ciency.
This standard de?nes one format for data and messages
communicated among microprocessors connected to a
TABLE 1
shared data link, and is speci?cally adapted for use With
PID 84
Speed
SAE 11708.
According to SAE 11708/11587, the ECUs on the data link 25
PID 85
Throttle or Cruise/Service Brakes
PID 89
Power Take Off (Bit 8)
PID 91
Throttle Position
Engine Torque
communicate by passing messages to each other. The ECUs
PID 93
can be either receivers, or receivers and transmitters. In this
PID 121
Engine Retarder Status
particular implementation, the instrumentation control unit
PID 183
PID 190
Fuel Rate
RPM
and the engine ECU are both transmitters and receivers. For
the purpose of monitoring vehicle performance data, the
30
engine ECU acts as a transmitter, sending messages to the
Fuel Ef?ciency Monitoring and Display System
ICU regarding road speed, fuel rate, engine torque, RPM,
throttle position, engine status, etc.
In this format, a message includes the folloWing: 1) a
module ID (MID), 2) one or more parameters (the message
data), and 3) a checksum. The number of parameters in a
message is limited by the total message length de?ned in the
SAE 11708 standard. The message identi?cation numbers
are assigned to transmitter categories as identi?ed in SAE
11587. The MID portion of a message speci?es the origin or
transmitter of the message. In the majority of cases, mes
35
40
sages are broadcast on the data link Without specifying a
receiver. HoWever, the message format can be eXtended to
include the MID of a receiver after the MID of the trans
mitter for special applications.
The messages passed among the ECUs convey information
45
about one or more parameters contained Within the mes
sages. According to the SAE 11587 standard, the ?rst
character of every parameter is a parameter identi?cation
folloWs the PID. The SAE 11587 supports different data
formats including a single character, a double data character
or more than tWo data characters representing the parameter
data. Several parameters can be packed into a message,
limited by the maXimum message siZe as noted above.
each other over the data link according to the SAE standard
55
11708. The standard describes methods for accessing the
data link and constructing messages for transfer over it. It
ers only act on a message if programmed to do so.
eXcess fuel. The display in FIG. 5 replaces the one in FIG.
4 When the system detects a condition Where the vehicle is
consuming eXcess fuel.
The fuel ef?ciency messages tell the driver When the
vehicle is consuming eXcess fuel, the cause of excessive fuel
can take to save fuel. The fuel ef?ciency values are numeri
60
cal representations of fuel ef?ciency. There are a variety of
different display formats that can be used to convey fuel
ef?ciency messages and values to the driver, and FIGS. 4
and 5 represent only one eXample. In the eXample shoWn in
particular implementation, the length of the lull is 200
milliseconds. After detecting this lull, the ECU attempts to
transmit its message. The transmitter broadcasts its message
onto the data link. Each of the ECUs that operate as receivers
on the data link Will receive the message. HoWever, receiv
the driver. During normal driving conditions, the message
display provides normal driving messages. When the system
detects fuel inef?cient driving, it changes the display to
consumption, and messages indicating actions that the driver
also de?nes a method for resource contention among the
ECUs on the data link.
An ECU Wishing to transmit data on the data link ?rst Waits
for a lull in transmission of data on the data link. In this
messages to prompt the driver When it detects that eXcess
fuel is being consumed and suggests a driving action that
Will improve fuel economy.
FIGS. 4 and 5 illustrate eXamples of a message display
used to provide vehicle performance messages and values to
indicate that the vehicle is consuming eXcess fuel and
suggests an action that Will improve fuel ef?ciency. FIG. 4
is an eXample of a display 100 used to display normal
driving messages, While FIG. 5 is an eXample of a display
102 informing the driver that the vehicle is consuming
character (PID). The parameter identi?ed by the PID directly
Again, in this implementation, the ECUs communicate With
The system architecture described above is used to imple
ment a fuel efficiency monitoring and display system. The
system monitors vehicle performance parameters and deter
mines When the vehicle is consuming eXcess fuel. It displays
a combination of graphical and numerical quantities repre
senting fuel efficiency and the eXcess fuel consumed due to
a fuel inef?cient driving action. In addition, it displays
65
FIG. 4, the display 100 shoWs “normal driving” messages
104, the current fuel economy in miles per gallon 106, and
an odometer reading 108. Alist of some eXamples of normal
driving messages are in Table 2 provided beloW.
6,092,021
8
7
The Vehicle Parameter Estimation Module
The VPE module 122 estimates the vehicles Weight
TABLE 2
(GCW), aerodynamic drag factor (Beta) and the gradient
NORMAL DRIVING MESSAGES
(Grade) of the roadWay. These estimates are derived from
information available from electronically controlled engines
plus an analog signal from the engine fan clutch (analog
MPG Bargraph
OUTSIDE TEMP xxx F
COOLANT TEMP xxx F
OIL PRESSURE xxx PSI
ENGINE OIL TEMP xxx F
FUEL TEMP xxx F
BATTERY xx.x VOLTS
FUEL xx.xx GAL/HR
TURBO BOOST xx PSI
10
TUE JUN 24 11:21 AM
In an alternative implementation, the display shows other
fuel efficiency information during normal driving conditions
(i.e., When inef?cient driving is not detected). For example,
15
input 130). The estimated values are updated once per
second and recorded in memory for use by the other mod
ules.
The Excess module
The Excess module 124 determines the incremental por
tion of the fuel being consumed to operate the vehicle (if
any) attributable to each of the fuel inef?cient driving types.
Once this is determined, the folloWing information is
updated and logged in memory of the ICU:
1) driving type consuming the largest increment of fuel
inef?ciently;
one alternative display format shoWs the fuel required to
2) inef?cient fuel consumed (start of trip to current point);
3) trip fuel (start of trip to current point);
4) short term inef?cient fuel (geometric averaged); and
ef?ciently operate the vehicle divided by the actual fuel
consumed. It also displays the miles per gallon (current fuel
consumption) and an odometer reading. The ICU continu
ally updates fuel ef?ciency data and presents messages and
5) short term trip fuel (geometric averaged).
values to the driver in real time.
The short term inef?cient and trip fuel are used to calcu
late the numeric value of “FUEL EFFICIENCY” Which is
Whenever the ICU detects fuel inef?cient driving, it
changes the format of the display in FIG. 4 to another format
such as the one shoWn in FIG. 5. The display 102 in FIG. 5 25
shoWs a bargraph 110 and a numerical value 112 depicting
displayed to the driver.
The Display Driver Module
could be gained by taking the action suggested by the text
The Display Driver module 126 reads the analog inputs
from the dash mounted driver operated keypad (Analog
input 130) to select preprogrammed messages available for
message 114 displayed beloW it.
display in the driver message center. Current numeric values
the magnitude of the improvement in fuel economy that
(if needed) are inserted into the message displayed. One of
the options available to the driver is the display 100 shoWn
TABLE 3
in FIG. 4.
Driving Type
Prompting Message
Speeding
DRIVE XX — MPH
Gain x.x MPG
High Engine RPM
SHIFT TO NEXT GEAR
Excessive Idling
* * *END IDLING" * *
Braking/Accelerating
DRIVE STEADY SPEED
Rapid Throttle
MOVE THROTTLE SLOWER
SoftWare Description
35
Gain x.x MPG
SAVE x.xx GAL/Hr
The logic employed in each of these softWare modules is
described in the folloWing sections.
The Input Module
The Input module 120 employs a parser to select, parse
and record into the array (called the PID array) all messages
from the engine ECU. The ICU receives vehicle perfor
mance data from the data link in a serial data stream. As
noted above, messages on the data link include an ID,
Gain x.x MPG
Movement
folloWed by one or more parameters, and a checksum. The
Gain x.x MPG
One implementation of the fuel ef?ciency system com
prises four softWare modules executing from memory on the
ICU. FIG. 6 is a block diagram illustrating these modules.
The folloWing four modules are executed repetitively to
compute fuel ef?ciency data and update the display on the
parser, executing in the ICU, uses the ID to identify the
message and the siZe of the parameters in the message
45
is valid, it updates the PID array With the parameters from
the message.
dash of the vehicle: 1) INPUT 120, 2) VEHICLE PARAM
ETER ESTIMATION 122, 3) EXCESS 124, and 4) DIS
At poWer on, all values in the PID array are set to Zero.
This module is executed as frequently as possible to insure
that the most current information from the engine control
unit is available for use by the other softWare modules. Flags
PLAY DRIVER 126.—It is important to emphasiZe that
these modules represent one implementation of the inven
tion and that the implementation can vary depending on a
number of factors, such as the type and architecture of the
performance monitoring devices in the vehicle, the type of
vehicle (long haul tractor trailer truck, business class truck,
car, etc.) the speci?c inef?cient driving conditions that are
monitored, etc.
The Input Module
The input module 120 converts serial input data 128 from
(single byte or multi-byte data), and temporarily stores the
parameters in memory of the ICU. The parser then veri?es
that the data is valid by evaluating the checksum. If the data
55
are set Whenever updated engine torque (PID 93 once per
second), fuel rate (PID 183 ?ve times per second) or RPM
(PID 190 ten times per second) messages are received.
The Vehicle Parameter Estimation Model
The VPE module 122 utiliZes the information generated
by the INPUT module to estimates the vehicle’s Weight
(GCW), aerodynamic drag factor (Beta) and the gradient
(Grade) of the roadWay. Unless otherWise stated, informa
the serial data bus into an array of asynchronous numeric
tion from the prior iterations is read from memory as an
values Which are updated as neW messages are received.
input at poWer on, and updated and stored in memory When
the system is poWered doWn. This module is executed once
Receipt of selected messages from the engine control unit is
used to indicate 100 millisecond, 200 millisecond and one
per second When the engine torque (PID 93) information is
second time intervals. These time intervals are used to signal 65 updated and recorded in memory for use by the other
the arrival of neW data and clock several of the subsequent
modules. VPE utiliZes the folloWing inputs de?ned in Table
modules.
4:
6,092,021
9
10
Otherwise, it sets Case=0
Part 2 of the VPE Module
Part 2 has two cases. If Case (from Part 1) equals Zero,
then the variables n, FSum, VA2Sum, % Gr and VSum are set
equal to Zero (146) and the value of the variable Vo equal to
TABLE 4
VARIABLE
DEFINITION
% GR
the gradient of the roadway which is iteratively
estimated and updated by the VPE module. The initial
the current vehicle velocity (148).
startup value of % Gr is Zero.
Beta
the aerodynamic drag factor which is iteratively
DTeff
estimated and updated by the VPE module. The initial
startup value of Beta is 0.085.
the mechanical efficiency of the drivetrain. It is stored
If Case equals one, then the VPE module increments the
counter n by one; i.e.,
10
as a constant in memory.
FSum
the sum of the longitudinal force driving the vehicle
during each of the n iterations. The initial startup value
GCW
the estimated gross weight of the vehicle.
hpL
the average parasitic engine horsepower loss excluding
n=n+1(step 150)
It then computes the average acceleration (a) (152) using
the equation
of FSum is Zero.
a=(V—V0)/n/32.2
15
the engine cooling fan. “hpL” is stored as a constant
in memory.
n
and the current tractive force
a counter which records the number of iterations
F=550*HP*DTeff/V
(seconds) of summing and updating of data. Its initial
PID
startup value is Zero.
a 256 element data array which contains the most
recent information from the 11587/1708 data bus for
(154) using the equation
Next, the VPE module updates the sums used for esti
20
mating the parameters as follows (156):
MID 128 (Engine). PID is updated by the INPUT
module.
the rolling resistance coef?cient of the vehicle. It is
r
stored as a constant in memory.
VA 2Sum
VSum
Vo
the sum of the squares of the vehicles velocity during
each of the n iterations. The initial startup value of
VA2Sum is Zero.
the sum of the vehicles velocity during each of the n
iterations The initial startup value of VSum is Zero.
25
From this information, the difference between the actual
and the estimated vehicle velocity (e) is computed using the
following equation (158):
the vehicles velocity at the start of the summing
process. The initial startup value of V0 is Zero.
30
Vehicle Parameter Estimation or VPE includes two parts.
If the vehicle is sustaining a high acceleration and torque
The ?rst part (Part 1) uses information from the PID array
(n>5 & a>0.011 & Torque>500)(decision step 160), then it
selects the gain (p) for the vehicle’s weight estimate update
to determine if the operating conditions are correct for
updating the parameter estimates. The second part (Part 2)
performs the necessary calculations and updates the param
35
eter estimates if the necessary conditions are met. FIGS. 7A
and 7B are a How diagram illustrating the operation of both
of these parts of the VPE module 122. The reference
numbers associated with the steps in the How diagrams are
set forth in parentheses next to the corresponding description
in the text below.
Part 1 of the VPE Module
The ?rst part of the VPE module converts the data from
selected elements in the PID array to the information used
throughout VPE as shown in step 140 (FIG. 7A). In addition,
p=100000.
40
Otherwise, it sets the gain to Zero, p=0 (164). The esti
mated gross weight is calculated using the following equa
tion (166):
45
In this implementation, the gross weight is computed
incrementally based on the previous value of the gross
Part 1 assigns the value of Zero or one to the variable Case
weight, the gain factor (which depends on whether the
vehicle is sustaining high acceleration and torque), the
estimated velocity, and the rolling resistance.
Next, the estimated percent roadway grade (gr) is calcu
which is used as the basis for updating the parameter
estimates. First, it calculates the value of the following
variables as de?ned below (also see step 142, FIG. 7A).
Part 1 of the VPE module sets a parameter, Brake, equal
to one if either the brakes are applied (bit six of PID 85 is
equal to one) or the engine retarder is operating (bit 8 of PID
121 is equal to one).
The VPE module computes the vehicle velocity, engine
torque and horsepower from selected PID values stored in
as follows (162).
If the vehicle’s velocity is less than 70 (V<70), the VPE
module sets p=500000.
If the vehicle’s velocity is not less than 70, it sets
lated using the following equation (168):
The variations in the estimated value of the roadway
55
grade are smoothed using the following equation (170):
the PID array.
V (vehicle velocity)=PID 84*07335
Torque (engine torque)=PID 93*20
HP (horsepower)=Torque*PID 190/21009-hpL
60
Finally, the VPE module updates the drag factor as shown
in step 172. If the absolute value of the variation in the
vehicle’s velocity is greater than 0.5 [abs(V—VSum/n)>0.5],
The last step of Part 1 is to set Case=1 if all of the
then the VPE module uses the following equation to deter
mine if the estimated grade increased or decreased:
following are met (decision step 144 of FIG. 7A):
HP is greater than Zero,
V is greater than 15,
Brake=0, and
n is less than 250.
Dg=sign(Gr-gr), otherwise set Dg=0.
65
The sign function returns the value +1, 0 or —1 if the value
of the argument (Gr-gr) is greater than, equal to or less than
6,092,021
11
12
zero, respectively. If the vehicle is operating at a sustained
velocity greater than 70 with a low acceleration [V>70 &
abs(a)<0.011], then the VPE module uses the following
equation to determine if the vehicles velocity is increasing or
TABLE 5-continued
DTeff
the mechanical e?iciency of the drivetrain. DTeff is
Et
the time in seconds since the brakes were last released. Et
is initialized to zero when a new trip is inaugurated. The
initial startup value of Et is zero.
FPI
the fuel per iteration. It is updated each iteration by
stored as a constant in memory.
decreasing:
DV=sign(V—VSum/n), otherwise set DV=0.
dividing the fuel rate (PID 183) by 1152000 which
The VPE module then estimates the drag factor using the
equation:
provides the gallons of fuel consumed for each 200 ms
interval.
the estimated gross vehicle weight, an input from the
10
VPE module.
IFuel
Note that the drag factor is computed incrementally based
on its previous value and whether the vehicle speed and
grade are increasing or decreasing.
The Excess Module
One implementation of the Excess Module is composed
of nine sub-modules which operate iteratively to identify
the idle time limit. IFuel is initialized to zero when a new
trip is inaugurated. The initial startup value of IFuel is
15
zero.
ILim
20
memory as an input at power on, updated by one or more of
updated—?ve times per second. The sub-modules within the
a new trip is inaugurated. The initial startup value of
ITime is zero
25 LSLim
the minimum speed necessary before ine?icient fuel use
is computed. Below this speed ine?icient fuel use is not
MFuel
the accumulated fuel (in gallons) used from the start of
the trip due to rapid throttle movement. MFuel is
computed. LSLim is stored as a constant in memory.
TABLE 5
BAI
BASc
the accumulated fuel (in gallons) used from the start of
the trip due to operating the vehicle at speeds above a
predetermined speed, SLim. AFuel is initialized to zero
when a new trip is inaugurated. The initial startup value
of AFuel is zero.
a brake application indicator which is set equal to one to
show that an initial braked speed has been recorded. BAI
initialized to zero when a new trip is inaugurated. The
initial startup value of MFuel is zero.
30
Over
35 PID
PID’s 0 through 253 from the J1587/1708 data bus for
initialized to zero when a new trip is inaugurated. The
initial startup value of BAI is zero.
MID 128 (Engine). This array is updated by the INPUT
the con?rmed brake application speed. It is calculated
such that the difference in the vehicle’s kinetic energies
between BASc and BRSc (see below) represents the
accumulated braked change in the vehicle’s kinetic
PTO
40
energy. BASc is updated by the Braking/Accelerating
the time between release of the throttle and application of
the brakes or release of the brakes and application of the
sub-module and initialized to zero when a new trip is
throttle. RAt is initialized to zero when a new trip is
the vehicle speed (in mph) when the brakes are applied.
RFuel
45
new trip is inaugurated. The initial startup value of RFuel
is zero.
RLim
fuel. RLim is stored as a constant in memory. To
accommodate various engine speed ratings, its value
50
should be initialized based on information from the
engine ECU at power on.
the vehicle speed (in mph) when the brakes are released.
The Braking/Accelerating sub-module updates BRSp,
Sa
inaugurated. The initial startup value of BRSp is zero.
initial start up value of Sa is 55.
55 SFCa
VPE module.
BFuel
the accumulated fuel (in gallons) used from the start of
the trip due to unnecessary braking/accelerating. BFuel is
indicates when the vehicle is being retarded (Brake = 1)
by either the service brakes or engine retarder. It is
inaugurated. The initial startup value of SFCa is 0.05.
SLim
TBt
ICU sets Cruise to one.
an input which can be varied as the program is operating.
the maximum time in seconds between release of the
brakes and application of the throttle or release of the
throttle and application of the brakes for these release
status of service brakes (bit 6 of PID 85) and the engine
retarder (bit 8 of PID 121).
indicates when the vehicle is operating in cruise control
(Cruise = 1). It is updated each iteration based of the
value of bit 8 of PID 85. If bit 8 is set to one, then the
the maximum speed in MPH which the vehicle can be
operated before it is considered to be speeding. SLim is
60
updated each iteration by combining (logical OR) the
Cruise
the geometric average (or initial) speci?c fuel
consumption of the engine in gallons per horsepower
hour. SFCa is initialized to 0.05 when a new trip is
initialized to zero when a new trip is inaugurated. The
initial startup value of BFuel is zero.
B rake
the short term average vehicle speed in miles per hour for
vehicle speeds greater than 55 and less than 75 mph. The
which is initialized to zero when a new trip is
the estimated aerodynamic drag factor, an input from
the minimum engine speed in RPM above which
increased engine speed is considered as ine?icient use of
Braking/Accelerating sub-module updates BRSc which is
initialized to zero when a new trip is inaugurated. The
initial startup value of BRSc is zero.
inaugurated. The initial startup value of RAt is zero.
the accumulated fuel (in gallons) used from the start of
the trip due to operating the engine at speeds greater than
the engine speed limit. RFuel is initialized to zero when a
inaugurated. The initial startup value of BASp is zero.
represents the speed at which the vehicle’s brakes were
last released which produced a con?rmed loss of kinetic
energy — modi?ed by the speed/time criteria. The
Beta
module.
indicates if the power take off is operating (PTO = 1). It
is updated each iteration based of the value of bit 8 of
PID 89.
RAt
BASp is updated by the Braking/Accelerating sub
BRSp
Consumption SFCa which is allowed before excess or
ine?icient fuel is accumulated. Over is stored as a
constant in memory.
an array which contains the most recent information for
is updated by a Braking/Accelerating sub-module and
module and initialized to zero when a new trip is
BRSc
the maximum value of the ratio of current Speci?c Fuel
consumption SFC divided by average Speci?c Fuel
inaugurated. The initial startup value of BASp is zero.
BASp
the time in seconds which the engine has been idling for
the current idling event. ITime is initialized to zero when
Excess module utilize the following inputs:
AFuel
the accumulated time in seconds which the engine has
been idling from the start of the trip. ITime is initialized
to zero when a new trip is inaugurated. The initial startup
value of ITime is zero.
Itime
the sub-modules and stored in memory when the system is
powered down. Execution of all of these sub-modules is
triggered when the fuel rate (PID 183) information is
the maximum time in seconds which the engine can idle
before engine idling is considered as ine?icient use of
fuel. ILim is stored as a constant in memory.
ITime
unnecessary or inef?cient fuel use—if any. Unless otherwise
stated, information from the prior iterations is read from
the accumulated fuel (in gallons) used from the start of
the trip due to idling the vehicle for periods longer than
applications to be considered as ine?icient use of fuel.
TBt is stored as a constant in memory.
TFuel
65
the total fuel (in gallons) used from the start of the trip.
T'Fuel is initialized to zero when a new trip is
inaugurated. The initial startup value of TFuel is zero.