1
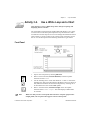
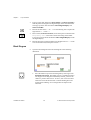
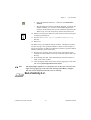
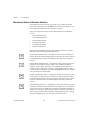
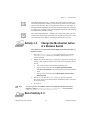
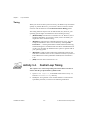
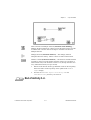
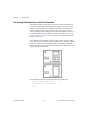
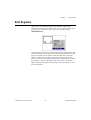
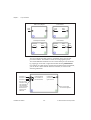
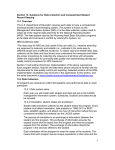
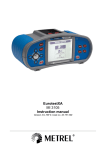
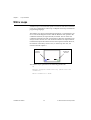
Chapter 3
Loops and Charts
While Loops
A While Loop is a structure that repeats a section of code until a condition
is met. It is comparable to a Do Loop or a Repeat-Until Loop in traditional
programming language.
The While Loop, shown in the following illustration, is a resizable box you
use to execute the diagram inside it until the Boolean value passed to the
conditional terminal (an input terminal) is FALSE. The VI checks the
conditional terminal at the end of each iteration; therefore, the While Loop
always executes at least once. The iteration terminal is an output numeric
terminal that outputs the number of times the loop has executed. However,
the iteration count always starts at zero, so if the loop runs once, the
iteration terminal outputs 0.
Conditional
Terminal
Iteration
Terminal
The While Loop is equivalent to the following pseudocode:
Do
Execute Diagram Inside the Loop (which sets the
condition)
While Condition is TRUE
LabVIEW User Manual
3-4
© National Instruments Corporation
Chapter 3
Activity 3-2.
Loops and Charts
Use a While Loop and a Chart
Your objective is to use a While Loop and a chart for acquiring and
displaying data in real time.
You will build a VI that generates random data and displays it on a chart.
A knob control on the front panel adjusts the loop rate between 0 and 2
seconds and a switch stops the VI. You will change the mechanical action
of the switch so you do not have to turn on the switch each time you run
the VI. Use the front panel in the following illustration to get started.
Front Panel
Note
1.
Open a new front panel by selecting File»New.
2.
Place a Vertical Switch (Controls»Boolean) on the front panel.
Label the switch Enable.
3.
Use the Labeling tool to create free labels for ON and OFF. Select the
Labeling tool, and type in the label text. With the Color tool, shown at
left, make the border of the free label transparent by selecting the T
in the bottom left corner of the Color palette.
4.
Place a waveform chart (Controls»Graph) on the front panel.
Label the chart Random Signal. The chart displays random data
in real time.
Make sure that you select a waveform chart and not a waveform graph. In the
Graph palette, the waveform chart appears closest to the left side.
© National Instruments Corporation
3-5
LabVIEW User Manual
Chapter 3
Loops and Charts
5.
Pop up on the chart and choose Show»Palette, and Show»Legend to
hide the palette and legend. The digital display shows the latest value.
Then pop up on the chart and choose Show»Digital Display and
Show»Scroll Bar.
6.
Rescale the chart from 0.0 to 1.0. Use the Labeling tool to replace the
high limit of 10.0 with 1.0.
7.
Place a knob (Controls»Numeric) on the front panel. Label the knob
Loop Delay (sec). This knob controls the timing of the While
Loop. Pop up on the knob and deselect Show»Digital Display to hide
the digital display.
8.
Rescale the knob. Using the Labeling tool, double-click on 10.0 in the
scale around the knob, and replace it with 2.0.
9.
Open the block diagram and create the diagram in the following
illustration.
Block Diagram
a.
LabVIEW User Manual
Place the While Loop in the block diagram by selecting it from
Functions»Structures. The While Loop is a resizable box that is
not dropped on the diagram immediately. Instead, you have the
chance to position and resize it. To do so, click in an area above
and to the left of all the terminals. Continue holding down the
mouse button and drag out a rectangle that encompasses the
terminals.
3-6
© National Instruments Corporation
Chapter 3
Loops and Charts
b.
Select the Random Number (0–1) function from Functions»
Numeric.
c.
Wire the diagram as shown in the Block Diagram, connecting the
Random Number (0–1) function to the Random Signal chart
terminal, and the Enable switch to the conditional terminal of the
While Loop. Leave the Loop Delay terminal unwired for now.
10. Return to the front panel and turn on the vertical switch by clicking on
it with the Operating tool.
11. Save the VI as Random Signal.vi in the LabVIEW\Activity
directory.
12. Run the VI.
The While Loop is an indefinite looping structure. The diagram within it
executes as long as the specified condition is TRUE. In this example, as
long as the switch is on (TRUE), the diagram continues to generate random
numbers and display them on the chart.
13. Stop the VI by clicking on the vertical switch. Turning the switch
off sends the value FALSE to the loop conditional terminal and stops
the loop.
14. Scroll through the chart. Click and hold down the mouse button on
either arrow in the scrollbar.
15. Clear the display buffer and reset the chart by popping up on the chart
and choosing Data Operations»Clear Chart.
Note
The display buffer default size is 1,024 points. You can increase or decrease this
buffer size by popping up on the chart and choosing Chart History Length….
You only can use this feature when the VI is not running.
End of Activity 3-2.
© National Instruments Corporation
3-7
LabVIEW User Manual
Chapter 3
Loops and Charts
Mechanical Action of Boolean Switches
You might notice that each time you run the VI, you must turn on the
vertical switch and then click the Run button in the toolbar. With G, you
can modify the mechanical action of Boolean controls.
There are six possible choices for the mechanical action of a Boolean
control:
•
Switch When Pressed
•
Switch When Released
•
Switch Until Released
•
Latch When Pressed
•
Latch When Released
•
Latch Until Released
Below are figures depicting each of these boolean switches, as well as a
description of each of these mechanical actions.
Switch When Pressed action—Changes the control value each time you
click on the control with the Operating tool. The action is similar to that of
a ceiling light switch, and is not affected by how often the VI reads the
control.
Switch When Released action—Changes the control value only after you
release the mouse button, during a mouse click, within the graphical
boundary of the control. The action is not affected by how often the VI
reads the control. This action is similar to what happens when you click on
a check mark in a dialog box; it becomes highlighted but does not change
until you release the mouse button.
Switch Until Released action —Changes the control value when you click
on the control. It retains the new value until you release the mouse button,
at which time the control reverts to its original value. The action is similar
to that of a doorbell, and is not affected by how often the VI reads the
control.
Latch When Pressed action—Changes the control value when you click on
the control. It retains the new value until the VI reads it once, at which point
the control reverts to its default value. (This action happens regardless of
whether you continue to press the mouse button.) This action is similar to
that of a circuit breaker and is useful for stopping While Loops or having
the VI do something only once each time you set the control.
LabVIEW User Manual
3-8
© National Instruments Corporation
Chapter 3
Loops and Charts
Latch When Released action—Changes the control value only after you
release the mouse button. When your VI reads the value once, the control
reverts to the old value. This action guarantees at least one new value. As
with Switch When Released, this action is similar to the behavior of buttons
in a dialog box; clicking on this action highlights the button, and releasing
the mouse button latches a reading.
Latch Until Released action —Changes the control value when you click
on the control. It retains the value until your VI reads the value once or until
you release the mouse button, depending on which one occurs last.
Activity 3-3.
Change the Mechanical Action
of a Boolean Switch
Your objective is to experiment with the different mechanical actions of
Boolean switches.
Note
1.
Open the Random Signal.vi, as saved in Activity 3-2, from the
LabVIEW\Activity directory. The default value of the Enable
switch is FALSE.
2.
Modify the vertical switch so it is used only to stop the VI. Change the
switch so that you do not need to turn on the switch each time you run
the VI.
a.
Turn on the vertical switch with the Operating tool.
b.
Pop up on the switch and choose Data Operations»Make
Current Value Default. This makes the ON position the default
value.
c.
Pop up on the switch and choose Mechanical Action»Latch
When Pressed.
3.
Run the VI. Click on the Enable switch to stop the acquisition.
The switch moves to the OFF position momentarily and is reset back
to the ON position.
4.
Save the VI.
For your reference, LabVIEW contains an example that demonstrates these
behaviors, called Mechanical Action of Booleans.vi. It is located in
Examples\General\Controls\booleans.llb.
End of Activity 3-3.
© National Instruments Corporation
3-9
LabVIEW User Manual
Chapter 3
Loops and Charts
Timing
When you ran the VI in the previous activity, the While Loop executed as
quickly as possible. However, you can slow it down to iterate at certain
intervals with the functions in the Functions»Time & Dialog palette.
The timing functions express time in milliseconds (ms), however, your
operating system might not maintain this level of timing accuracy.
•
(Windows 95/NT) The timer has a resolution of 1 ms. However, this is
hardware-dependent, so on slower systems, such as an 80386, you
might have lower resolution timing.
•
(Windows 3.1) The timer has a default resolution of 55 ms. You can
configure LabVIEW to have 1 ms resolution by selecting Edit»
Preferences…, selecting Performance and Disk from the Paths ring,
and unchecking the Use Default Timer checkbox. LabVIEW does not
use the 1 ms resolution by default because it places a greater load on
your operating system.
•
(Macintosh) For 68K systems without the QuickTime extension, the
timer has a resolution of 16 2/3 ms (1/60th of a second). If you have a
Power Macintosh or have QuickTime installed, timer resolution is
1 ms.
•
(UNIX) The timer has a resolution of 1 ms.
Activity 3-4.
Control Loop Timing
Your objective is to control loop timing and ensure that no iteration is
shorter than the specified number of milliseconds.
LabVIEW User Manual
1.
Open Random Signal.vi, as modified and saved in Activity 3-3,
from the LabVIEW\Activity directory.
2.
Modify the VI to generate a new random number at a time interval
specified by the knob, as shown in the following illustration.
3-10
© National Instruments Corporation
Chapter 3
Loops and Charts
Wait Until Next ms Multiple function (Functions»Time & Dialog)—
Multiply the knob terminal by 1,000 to convert the knob value in seconds
to milliseconds. Use this value as the input to the Wait Until Next ms
Multiple function.
Multiply function (Functions»Numeric)—The multiply function
multiplies the knob value by 1000 to convert seconds to milliseconds.
Numeric constant (Functions»Numeric)—The numeric constant holds the
constant by which you must multiply the knob value to get a quantity in
milliseconds. Thus, if the knob has a value of 1.0, the loop executes once
every 1000 milliseconds (once per second).
3.
Run the VI. Rotate the knob to get different values for the loop delay.
Notice the effects of the loop delay on the update of the Random
Signal display.
4.
Save the VI as Random Signal with Delay.vi in the
LabVIEW\Activity directory. Close the VI.
End of Activity 3-4.
© National Instruments Corporation
3-11
LabVIEW User Manual
Chapter 3
Loops and Charts
Preventing Code Execution in the First Iteration
The While Loop always executes at least once, because G performs the
loop test for continuation after the diagram executes. You can construct
a While Loop that pretests its conditional terminal by including a Case
structure inside the loop. Wire a Boolean input to the Case structure
selector terminal so the subdiagram for the FALSE condition executes if
the code in the While Loop should not execute. See Chapter 4, Case and
Sequence Structures and the Formula Node for more information about
using Case structures.
The subdiagram for the TRUE condition contains the work of the While
Loop. The test for continuation occurs outside the Case structure, and the
results are wired to the conditional terminal of the While Loop and the
selector terminal of the Case structure. In the following illustration, labels
represent the pretest condition.
This example has the same result as the following pseudocode:
While (pretest condition)
Do actual work of While Loop
Loop
LabVIEW User Manual
3-12
© National Instruments Corporation
Chapter 3
Loops and Charts
Shift Registers
Shift registers (available for While Loops and For Loops) transfer
values from one loop iteration to the next. You can create a shift register
by popping up on the left or right border of a loop and selecting
Add Shift Register.
The shift register contains a pair of terminals directly opposite each other
on the vertical sides of the loop border. The right terminal stores the data
upon the completion of an iteration. That data shifts at the end of the
iteration and appears in the left terminal at the beginning of the next
iteration, as shown in the following illustration. A shift register can hold
any data type—numeric, Boolean, string, array, and so on. The shift
register automatically adapts to the data type of the first object you wire
to the shift register.
© National Instruments Corporation
3-13
LabVIEW User Manual
Chapter 3
Loops and Charts
Before Loop Begins
First Iteration
Inital
Value
Inital
Value
Subsequent Iterations
Previous
Value
New
Value
New
Value
Last Iteration
Previous
Value
New
Value
New
Value
You can configure the shift register to remember values from several
previous iterations. This feature is useful for averaging data points.
You create additional terminals to access values from previous iterations
by popping up on the left or right terminal and choosing Add Element.
For example, if a shift register contains three elements in the left terminal,
you can access values from the last three iterations, as shown in the
following illustration.
Contains i–1
Contains i–2
Contains i–3
Previous values
are available at
the left terminal.
Pop up on left
terminal to add
new elements or
use Positioning
tool to resize the
left terminal to
expose more
elements.
LabVIEW User Manual
Latest value
passes to the
right terminal.
Pop up on border
for new shift register.
3-14
© National Instruments Corporation