1
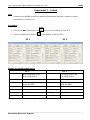
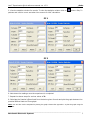
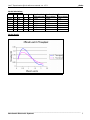
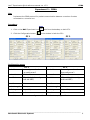
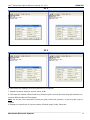
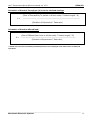
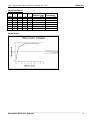
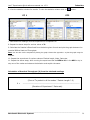
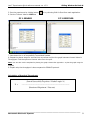
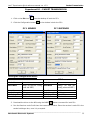
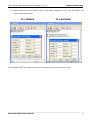
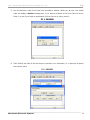
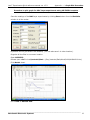
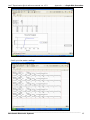
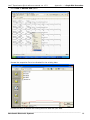
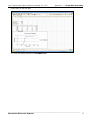
Contents
1. Aloha………………………………………………………………………….....
1
2. CSMA…………………………………………………………………………….
6
3. CSMA/CD……………………………………………………………...……......
11
4. Token Bus……………………………………………………………………….
16
5. Token Ring……………………………………………………………..............
21
6. Stop and Wait…………………………………………………………………..
25
7. Stop and Wait with BER………………………………………………………
28
8. Sliding Window Go Back N…………………………………………………..
30
9. Sliding Window Go Back N with BER……………………………………...
33
10. Packet Transmission………………………………………………………….
35
11. File transfer …………………….……………………………………………
38
12. Appendix 1 Graph plot procedure………………………………………….
41
13. Appendix 2 Configuration menu details…………………………………..
48
14. Appendix 3 Developing Lan-T application………………………………..
50
Lan-T Experiments Quick reference manual ver 1.3.3
_Aloha
Experiment 1 – ALOHA
Aim:
Implement the ALOHA protocol for packet communication between a number of nodes
connected to a common bus
Procedure:
twice from the desktop on both PC’s.
1. Click on the MAC Experiment icon
2. Click the Configuration button
in the window in both the PC’s.
PC 1
PC 2
Setting the Configuration menu:
PC 1
Node id
0 on config menu 1 and
1 on config menu 2
PC 2
Node id
0 on config menu 1 and
1 on config menu 2
Protocol
ALOHA
Protocol
ALOHA
Baud Rate
8Kbps (At both the config
menu and NEU)
Baud Rate
8Kbps (At both the config
menu and NEU)
Duration
100s
Duration
100s
Packet Length
100 bytes
Packet Length
100 bytes
Bit Delay
0(at NEU)
Bit Delay
0(at NEU)
Direction
Sender
Direction
Sender
Note: All the nodes have to be configured as ‘Senders’. Set the topology as ‘Bus’.
__________________________________________________________________________________
Benchmark Electronic Systems
1
Lan-T Experiments Quick reference manual ver 1.3.3
_Aloha
N*P
G = ------C * ta
G is the generated load in the network.
N is the number of nodes participating in the network. For example, let us say that 4 nodes
(using 2 computers)
P is the packet length expressed in bits; say 100 bytes (800 bits).
C is the data rate normally set as 8kbs, which is selected in the NEU.
ta is the inter packet delay expressed in seconds; the time interval between two consecutive
packets generated.
So, lets assume ta= 40 milliseconds and substitute the above mentioned parameters in the
Equation A which leads to G = 10. Like wise assume various values for ta to generate offer
loads in the range of 0.1 to 10. Substitute the value of ta in the configuration menu.
3. Click OK button and Download the driver to the NIU using the BOOT button
command.
Booting from any one of the applications is enough.
PC 1
4. Run the experiment by clicking button
PC 2
or by choosing RUN Start from each application.
__________________________________________________________________________________
Benchmark Electronic Systems
2
Lan-T Experiments Quick reference manual ver 1.3.3
5. View the statistics window for results. To view the statistics window click on
_Aloha
button. Only Tx
packets and collision count are taken into account for MAC calculation.
PC 1
PC 2
6. Note down the readings once the experiment is completed.
7. Repeat the above steps for various values of ta.
8. Calculate the Practical offered load from the below given formula and plot the graph between the
practical Offered load and Throughput.
Note: You can also use the template for plotting the graph. Please refer Appendix-1 to plot the graph using the
template.
__________________________________________________________________________________
Benchmark Electronic Systems
3
Lan-T Experiments Quick reference manual ver 1.3.3
_Aloha
9. Repeat the experiment for various values of Packet length, Node, Data rate.
Calculation of Practical Throughput (X) from the obtained readings:
Successfully transmitted packet by a node = Tx Packets - Collision Count
(Sum of Successfully Tx packet in all the nodes * Packet Length * 8)
X = --------------------------------------------------------------------------(Duration of Experiment * Data rate)
Calculation of Theoretical Throughput:
-2G
X = Ge
Calculation of Practical Offered load:
(Sum of Transmitted packets in all the nodes * Packet Length * 8)
G=
-------------------------------------------------------------------------(Duration of Experiment * Data rate)
__________________________________________________________________________________
Benchmark Electronic Systems
4
Lan-T Experiments Quick reference manual ver 1.3.3
_Aloha
Model tabulation:
IPD
Tx1
Tx 2
Tx 3
Tx 4
4000
2000
800
400
200
100
40
23
36
54
52
18
10
4
19
35
48
41
26
1
0
25
38
43
39
11
4
0
16
33
60
45
19
10
6
G – Practical
Offered Load
0.101
0.2
0.444
0.766
1.293
1.82
2.484
X – Practical
Throughput
0.083
0.142
0.205
0.177
0.074
0.025
0.01
Theoretical
Throughput
0.08
0.13
0.18
0.14
0.04
0.00
0.00
Model Graph:
__________________________________________________________________________________
Benchmark Electronic Systems
5
Lan-T Experiments Quick reference manual ver 1.3.3
CSMA
Experiment 2 – CSMA
Aim:
Implement the CSMA protocol for packet communication between a number of nodes
connected to a common bus
Procedure:
1. Click on the MAC Experiment icon
2. Click the Configuration button
twice from the desktop on both PC’s.
in the window in both the PC’s.
PC 1
PC 2
Configuration menu:
PC 1
Node id
0 on config menu 1 and
1 on config menu 2
PC 2
Node id
0 on config menu 1 and
1 on config menu 2
Protocol
CSMA
Protocol
CSMA
Baud Rate
8Kbps (At both the config
menu and NEU)
Baud Rate
8Kbps (At both the config
menu and NEU)
Duration
100s
Duration
100s
Packet Length
100 bytes
Packet Length
100 bytes
Bit Delay
10 (at NEU)
Bit Delay
10 (at NEU)
Direction
Sender
Direction
Sender
Note: All the nodes have to be configured as ‘Senders’. Set the topology as ‘Bus’.
__________________________________________________________________________________
Benchmark Electronic Systems
6
Lan-T Experiments Quick reference manual ver 1.3.3
CSMA
N*P
G = -----C * ta
G is the generated load in the network.
N is the number of nodes participating in the network. For example, let us say that 4 nodes
(using 2 computers)
P is the packet length expressed in bits; say 100 bytes (800 bits).
C is the data rate normally set as 8kbs, which is selected in the NEU.
ta is the inter packet delay expressed in seconds; the time interval between two consecutive
packets generated.
So, lets assume ta= 40 milliseconds and substitute the above mentioned parameters in the
Equation A which leads to G = 10. Like wise assume various values of ta to generate offer
loads in the range of 0.1 to 10. Substitute the ta in the configuration menu.
3. Click OK button and Download the driver to the NIU using the BOOT button
command.
Booting from any one of the applications is enough.
PC 1
4. Run the experiment by clicking button
PC 2
or by choosing RUN Start from each application.
5. View the statistics window for results. To view the statistics window click on
button. Only Tx
packets and collision count are taken into account for MAC calculation.
__________________________________________________________________________________
Benchmark Electronic Systems
7
Lan-T Experiments Quick reference manual ver 1.3.3
CSMA
PC 1
PC 2
6. Note down the readings once the experiment is completed.
7. Repeat the above steps for various values of ta.
8. Calculate the Practical offered load from the below given formula and plot the graph between the
practical Offered load and Throughput.
Note: You can also use the template for plotting the graph. Please refer Appendix-1 to plot the graph using the
template.
9. Repeat the experiments for various values of Packet length, Node, Data rate and Bit delay.
__________________________________________________________________________________
Benchmark Electronic Systems
8
Lan-T Experiments Quick reference manual ver 1.3.3
CSMA
Calculation of Practical Throughput (X) from the obtained readings:
Successfully transmitted packet by a node = Tx Packets - Collision Count
(Sum of Successfully Tx packet in all the nodes * Packet Length * 8)
X=
----------------------------------------------------------------------------(Duration of Experiment * Data rate)
Calculation of Theoretical Throughput:
G(1+G+aG(1+G+aG/2))e-G(1+2a)
X = -----------------------------------G (1+2a)-(1-e-aG)+(1+aG)e-G(1+a)
a = (end to end bit delay in bits) / (Packet length in bits) = (bit delay*N) / (P)
Calculation of Practical Offered load:
(Sum of Transmitted packets in all the nodes * Packet Length * 8)
G=
-------------------------------------------------------------------------(Duration of Experiment * Data rate)
__________________________________________________________________________________
Benchmark Electronic Systems
9
Lan-T Experiments Quick reference manual ver 1.3.3
CSMA
Model tabulation:
For bit delay = 1
IPD
Tx1
Tx 2
Tx 3
Tx 4
4000
2000
800
400
200
100
40
29
49
107
151
166
137
12
28
50
93
124
156
103
12
29
49
99
134
155
126
7
28
49
101
144
165
116
37
G – Practical
Offered Load
0.116
0.197
0.436
0.725
1.076
1.388
1.824
X – Practical
Throughput
0.114
0.197
0.400
0.553
0.642
0.482
0.068
Theoretical
Throughput
0.11
0.19
0.37
0.49
0.53
0.52
0.48
Model Graph:
__________________________________________________________________________________
Benchmark Electronic Systems
10
Lan-T Experiments Quick reference manual ver 1.3.3
CSMA/CD
Experiment 3 – CSMA/CD
Aim:
Implement the CSMA/CD protocol for packet communication between a number of nodes
connected to a common bus
Procedure:
1. Click on the MAC Experiment icon
2. Click the Configuration button
twice from the desktop on both PC’s.
in the window in both the PC’s.
PC 1
PC 2
Configuration menu:
PC 1
Node id
Protocol
Baud Rate
0 on config menu 1 and
1 on config menu 2
CSMA/CD
8Kbps (At both the config menu
and NEU)
PC 2
Node id
Protocol
Baud Rate
0 on config menu 1 and
1 on config menu 2
CSMA/CD
8Kbps (At both the config menu
and NEU)
Duration
100s
Duration
100s
Packet
1000 bytes
Packet
1000 bytes
Length
Length
Bit
Delay
0(at NEU)
Bit Delay
0(at NEU)
Direction
Direction
Sender
Sender
Note: All the nodes have to be configured as ‘Senders’. Set the topology as ‘Bus’.
__________________________________________________________________________________
Benchmark Electronic Systems
11
Lan-T Experiments Quick reference manual ver 1.3.3
CSMA/CD
N*P
G = -----C * ta
G is the generated load in the network.
N is the number of nodes participating in the network. For example, let us say that 4 nodes
(using 2 computers)
P is the packet length expressed in bits; say 100 bytes (800 bits).
C is the data rate normally set as 8kbs, which is selected in the NEU.
ta is the inter packet delay expressed in seconds; the time interval between two consecutive
packets generated.
So, lets assume ta= 40 milliseconds and substitute the above mentioned parameters in the
Equation A which leads to G = 10. Like wise assume various values of ta to generate offer
loads in the range of 0.1 to 10. Substitute the value of ta in the configuration menu.
3. Click OK button and Download the driver to the NIU using the BOOT button
command.
Booting from any one of the applications is enough.
PC 1
4. Run the experiment by clicking button
PC 2
or by choosing RUN Start from each application.
5. View the statistics window for results. To view the statistics window click on
button. Only Tx
packets and successfully transmitted packets are taken into account for CSMA/CD calculation.
__________________________________________________________________________________
Benchmark Electronic Systems
12
Lan-T Experiments Quick reference manual ver 1.3.3
CSMA/CD
PC 1
PC 2
6. Note down the readings once the experiment is completed.
7. Repeat the above steps for various values of ta.
8. Calculate the Practical offered load from the below given formula and plot the graph between the
practical Offered load and Throughput.
Note: You can also use the template for plotting the graph. Please refer Appendix-1 to plot the graph using the
template.
9. Repeat the experiment for various values of Packet length, Node, Data rate.
__________________________________________________________________________________
Benchmark Electronic Systems
13
Lan-T Experiments Quick reference manual ver 1.3.3
CSMA/CD
Calculation of Practical Throughput (X) from the obtained readings:
(Sum of Successfully Tx packet in all the nodes * Packet Length * 8)
X=
----------------------------------------------------------------------------(Duration of Experiment * Data rate)
Calculation of Practical Offered load:
(Sum of Offered load count in all the nodes * Packet Length * 8)
G=
-------------------------------------------------------------------------(Duration of Experiment * Data rate)
* offered load count and successfully transmitted packet count is displayed in the main window of CSMA/CD
experiment.
__________________________________________________________________________________
Benchmark Electronic Systems
14
Lan-T Experiments Quick reference manual ver 1.3.3
CSMA/CD
Model tabulation:
IPD
Tx1
Tx 2
Tx 3
Tx 4
4000
2000
800
400
200
100
40
27
49
118
187
117
472
466
25
49
116
189
133
463
458
24
49
119
191
290
13
20
24
49
116
191
300
18
28
G – Practical
Offered Load
0.101
0.208
0.5
0.976
1.904
3.555
7.687
X – Practical
Throughput
0.1
0.196
0.469
0.758
0.84
0.966
0.972
Model Graph:
__________________________________________________________________________________
Benchmark Electronic Systems
15
Lan-T Experiments Quick reference manual ver 1.3.3
Token Bus
Experiment 4 - TOKEN BUS
Aim:
To implement the token passing access in BUS-LAN
Procedure:
1. Click on the Token Bus icon
2. Click the Configuration
twice from the desktop.
button in the window in both the PC’s.
PC 1 – Sender
PC – 2 Sender
Setting the configuration menu:
PC 1
PC 2
Node id
0 on config menu 1 and
1 on config menu 2
Node id
0 on config menu 1 and
1 on config menu 2
Protocol
Baud Rate
ALOHA
Protocol
Baud Rate
ALOHA
Duration
Packet Length
My Address
Bit Delay
Direction
Notes
8Kbps (At both the config
menu and NEU)
100s
100 bytes
0 on config menu 1 and
1 on menu 2
0(at NEU)
Sender
Duration
Packet Length
My Address
Bit Delay
Direction
8Kbps (At both the config menu
and NEU)
100s
100 bytes
2 on config menu 1 and
3 on menu 2
0(at NEU)
Sender
1: If you connect two PC’s and configured four nodes then set the My Address as 0 to 3 in all four
nodes, if you connect three PCs and configured six nodes then set the My Address as 0 to 5 in all
six nodes.
2: Start running the experiment from the lowest priority node (i.e., from My Address 3 in case of
four nodes and 5 in the case of six nodes)
3: No of Nodes has to be set as 4 when two PCs are connected and 6 when three PCs are connected.
_________________________________________________________________________________
Benchmark Electronic Systems
16
Lan-T Experiments Quick reference manual ver 1.3.3
Token Bus
N*P
G = -----C * ta
G is the generated load in the network.
N is the number of nodes participating in the network. For example, let us say that 4 nodes
(using 2 computers)
P is the packet length expressed in bits; say 100 bytes (800 bits).
C is the data rate normally set as 8kbs, which is selected in the NEU.
ta is the inter packet delay expressed in seconds; the time interval between two consecutive
packets generated.
So, lets assume ta= 40 milliseconds and substitute the above mentioned parameters in the
Equation A which leads to G = 10. Like wise assume various values of ta to generate offer
loads in the range of 0.1 to 10. Substitute the value of ta in the configuration menu.
3. Click OK button and Download the driver to the NIU using the BOOT button
command.
Booting from any one of the applications is enough.
4. Run the experiment by clicking button
or by choosing RUN Start from each application.
Run the all the experiments at the same time.
5. Set the Token Holding Time (THT) (say 10000 ms).
PC 1
PC 2
Note: While you do this THT window pops up, enter the THT time in all nodes and press the OK
button first in the node, which has highest value of My Address.
_________________________________________________________________________________
Benchmark Electronic Systems
17
Lan-T Experiments Quick reference manual ver 1.3.3
Token Bus
6. View the statistics window for results. To view the statistics window click on
PC 1
button.
PC2
7. Note down the readings once the experiment is completed. sw
8. Repeat the above steps for various values of ta.
9. Calculate the Practical offered load from the below given formula and plot the graph between the
practical Offered load and Throughput.
Note: You can also use the template for plotting the graph. Please refer Appendix-1 to plot the graph using the
template.
10. Repeat the experiment for various values of Packet length, Node, Data rate.
11. Repeat the above steps, while running the experiment set the BER to 10-2 in the NEU or try to
stop one of the nodes and observe the behavior and explain the same.
Calculation of Practical Throughput (X) from the obtained readings:
(Sum of Tx packet in all the nodes * Packet Length * 8)
X=
----------------------------------------------------------------------------(Duration of Experiment * Data rate)
_________________________________________________________________________________
Benchmark Electronic Systems
18
Lan-T Experiments Quick reference manual ver 1.3.3
Token Bus
Calculation of the Offered load:
N*P
G = -----C * ta
G – Offered load
N – Number of nodes
P – Packet length in bits
C – Data rate in bits/sec
ta – Inter packet delay in millisecs.
Model Tabulation:
IPD
16000
8000
4000
2000
1000
Tx 1
7
11
18
24
20
Tx 2
7
11
21
20
18
Tx 3
9
11
26
21
30
Tx 4
5
13
19
24
20
G - Offered
Load
0.25
0.5
1
2
4
X –Practical
Throughput
0.28
0.46
0.84
0.89
0.88
Avg Delay
12205.5
7787.75
11265
28604.75
38216
Model Graph
_________________________________________________________________________________
Benchmark Electronic Systems
19
Lan-T Experiments Quick reference manual ver 1.3.3
Token Ring
Experiment 5 - TOKEN RING
Aim:
To implement the token passing access in RING-LAN
Procedure:
1. Click on the Token Bus icon
twice from the desktop.
button in the window in both the PC’s.
2. Click the Configuration
PC-1
PC–2
Setting the configuration menu:
PC 1
Node id
Protocol
Baud Rate
Duration
Packet Length
Bit Delay
Direction
0 on config menu 1 and
1 on config menu 2
RING
8Kbps (At both the config
menu and NEU)
100s
1000 bytes
0(at NEU)
Sender
PC 2
Node id
Protocol
Baud Rate
Duration
Packet Length
Bit Delay
Direction
0 on config menu 1 and
1 on config menu 2
RING
8Kbps (At both the config
menu and NEU)
100s
1000 bytes
0(at NEU)
Sender
.
__________________________________________________________________________________
Benchmark Electronic Systems
21
Lan-T Experiments Quick reference manual ver 1.3.3
Token Ring
N*P
G = -----C * ta
G is the generated load in the network.
N is the number of nodes participating in the network. For example, let us say that 4 nodes
(using 2 computers)
P is the packet length expressed in bits; say 100 bytes (800 bits).
C is the data rate normally set as 8kbs, which is selected in the NEU.
ta is the inter packet delay expressed in seconds; the time interval between two consecutive
packets generated.
So, lets assume ta= 40 milliseconds and substitute the above mentioned parameters in the
Equation A which leads to G = 10. Like wise assume various values of ta to generate offer
loads in the range of 0.1 to 10. Substitute the value of ta in the configuration menu.
3. Click OK button and Download the driver to the NIU using the BOOT button
command.
Booting from any one of the applications is enough.
4. Run the experiment by clicking button
or by choosing RUN Start from each application.
Run the all the experiments at the same time.
5. Set the Token Holding Time (THT) (say 10000 ms).
6. View the statistics window for results. To view the statistics window click on
PC 1
button.
PC2
7. Note down the readings once the experiment is completed.
8. Repeat the above steps for various values of ta.
__________________________________________________________________________________
Benchmark Electronic Systems
22
Lan-T Experiments Quick reference manual ver 1.3.3
Token Ring
9. Calculate the Practical offered load from the below given formula and plot the graph between the
practical Offered load and Throughput.
Note: You can also use the template for plotting the graph. Please refer Appendix-1 to plot the graph using the
template.
10. Repeat the experiments for various values of Packet length, Node, Data rate.
11. Repeat the above steps, while running the experiment set the BER to 10-2 in the NEU or try to
stop one of the nodes and observe the behavior and explain the same.
Calculation of Practical Throughput (X) from the obtained readings:
(Sum of Tx packet in all the nodes * Packet Length * 8)
X=
----------------------------------------------------------------------------(Duration of Experiment * Data rate)
Calculation of the Offered load:
N*P
G = -----C * ta
G – Offered load
N – Number of nodes
P – Packet length in bits
C – Data rate in bits/sec
ta – Inter packet delay in millisecs.
__________________________________________________________________________________
Benchmark Electronic Systems
23
Lan-T Experiments Quick reference manual ver 1.3.3
Token Ring
Model Tabulation:
Tx
Tx
Tx
Tx
G - Offered
X-
Avg
Node1
Node2
Node3
Node4
Load
Throughput
Delay
16000
6
6
6
6
0.25
0.24
3779.75
8000
12
13
14
14
0.5
0.53
3708.25
4000
19
19
28
28
1
0.94
3658.5
2000
22
22
30
25
2
0.99
28270.75
1000
30
27
21
21
4
0.99
37720.25
IPD
Model Graph
Avg Delay
G Vs X
Avg Delay
40000
0.8
30000
0.6
G Vs
X
0.4
Delay
Throughput
1
20000
10000
0.2
0
0
0
1
2
3
Offered Load
4
5
0
0.2
0.4
0.6
Throughput
0.8
1
__________________________________________________________________________________
Benchmark Electronic Systems
24
Lan-T Experiments Quick reference manual ver 1.3.3
Stop and Wait
Experiment 6 – STOP & WAIT
Aim:
Provide reliable data transfer between two nodes over an unreliable network using the stopand-wait protocol
Procedure:
1. Click on the Stop & Wait icon
2. Click the Configuration
from the desktop on both PCs.
button in the window in both the Pc’s.
PC 1 SENDER
PC 2 RECEIVER
Setting the configuration menu:
PC 1
Node id
Protocol
Baud Rate
Duration
Packet Length
Bit Delay
Direction
0
CSMA/CD
8Kbps (At both the
config menu and NEU)
100s
1000 bytes
0(at NEU)
Sender
PC 2
Node id
Protocol
Baud Rate
Duration
Packet Length
Bit Delay
Direction
0
CSMA/CD
8Kbps (At both the config menu
and NEU)
100s
1000 bytes
0(at NEU)
Receiver
_____________________________________________________________________
Benchmark Electronic Systems
25
Lan-T Experiments Quick reference manual ver 1.3.3
Stop and Wait
3. Set the Inter Packet Delay to 400msecs
4. Click OK button and Download the driver to the NIU using the BOOT button
command.
Booting from any one of the applications is enough.
5. Run the experiment by clicking button
or by choosing RUN Start from each application.
6. Set the Timeout Value to 1500 ms
PC 1 SENDER
PC 2 RECEIVER
7. Note down the no of successfully Transmitted Packets.
8. Repeat the above steps for various time out values and plot the graph between timeout Value &
Throughput. Find the optimum timeout value from the plot.
Note: You can also use the template for plotting the graph. Please refer Appendix-1 to plot the graph using the
template
9. Explain why the throughput is less compared to CSMACD protocol.
Calculation of Practical Throughput:
(Sum of Successfully Tx packets * Packet Length * 8)
X =
--------------------------------------------------------------------------------(Duration of Experiment * Data rate)
_____________________________________________________________________
Benchmark Electronic Systems
26
Lan-T Experiments Quick reference manual ver 1.3.3
Stop and Wait
Model Tabulation:
Time out value in ms
1000
1500
2000
3000
4000
Successfully Tx packets
1
2
52
52
52
Practical Throughput
0.01
0.02
0.52
0.52
0.52
Model Graph:
Time out Vs Throughput
Throughput
0.6
0.4
X - Throughput
0.2
0
0
1000
2000
3000
4000
5000
Time Out
_____________________________________________________________________
Benchmark Electronic Systems
27
Lan-T Experiments Quick reference manual ver 1.3.3
Stop and Wait with BER
Experiment 7 – STOP & WAIT WITH BER
Aim:
Provide reliable data transfer between two nodes over an error network using the stop-andwait protocol
Procedure:
1. Set the error rate to 10-2 in the NEU.
2. Follow the Stop and Wait Experiment procedure for running the experiment.
3. Set the time out value as 3000 ms in the sender window.
PC 1 SENDER
PC 2 RECEIVER
4. From the Statistics window note down the number of successfully transmitted packets and
calculate the throughput. (Calculation of throughput is same as explained in the previous
expt.)
5. Repeat the Experiment by setting different BER in the NEU.
6. Use the values to plot the graph between BER Vs Throughput
Note: You can also use the template for plotting the graph. Please refer Appendix-1 to plot the graph using
the template
__________________________________________________________________________________
Benchmark Electronic Systems
28
Lan-T Experiments Quick reference manual ver 1.3.3
Stop and Wait with BER
Model Tabulation:
BER
Successfully
Tx packets
53
52
9
40
0
10-6
10-5
10-4
10-3
10-2
Theoretical
Throughput
0.53
0.52
0.49
0.39
0
Practical
Throughput
0.53
0.5232
0.4675
0.1787
0
Model Graph:
BER Vs Throughput
0.6
Throughput
0.5
0.4
X - Throughput
0.3
Actual X
0.2
0.1
0
0
2
4
6
8
BER
__________________________________________________________________________________
Benchmark Electronic Systems
29
Lan-T Experiments Quick reference manual ver 1.3.3
Sliding Window Go Back N
Experiment 8 – SLIDING WINDOW GO BACK N
Aim:
Provide reliable data transfer between two nodes over an unreliable network using the sliding
window go back N protocol
Procedure:
1. Click on the Sliding Window GBN icon
2. Click the Configuration
from the desktop on both PCs.
button in the window in both the Pc’s.
PC 1 SENDER
PC 2 RECEIVER
Setting the configuration menu:
PC 1
Node id
Protocol
Baud Rate
0
CSMA/CD
8Kbps (At both the
config menu and NEU)
Duration
100s
Packet Length
1000 bytes
Bit Delay
0(at NEU)
Direction
Sender
No of packets
4
Note: The No of Packets parameter defines
PC 2
Node id
Protocol
Baud Rate
Duration
Packet Length
Bit Delay
Direction
No of packets
the window size.
0
CSMA/CD
8Kbps (At both the
config menu and NEU)
100s
1000 bytes
0(at NEU)
Receiver
4
3. Set the Inter Packet Delay to 400msecs
4. Click OK button and Download the driver to the NIU using the BOOT button
Booting from any one of the applications is enough.
command.
_____________________________________________________________________
Benchmark Electronic Systems
30
Lan-T Experiments Quick reference manual ver 1.3.3
5. Run the experiment by clicking button
6. Set the Timeout Value to 1500 ms
Sliding Window Go Back N
or by choosing RUN Start from each application.
PC 1 SENDER
PC 2 RECEIVER
7. Note down the no of successfully Transmitted Packets.
8. Repeat the above steps for various time out values and plot the graph between timeout Value &
Throughput. Find the optimum timeout value from the plot.
Note: You can also use the template for plotting the graph. Please refer Appendix-1 to plot the graph using the
template
9. Explain why the throughput is less compared to CSMACD protocol.
Calculation of Practical Throughput:
(Sum of Successfully Tx packets * Packet Length * 8)
X =
--------------------------------------------------------------------------------(Duration of Experiment * Data rate)
_____________________________________________________________________
Benchmark Electronic Systems
31
Lan-T Experiments Quick reference manual ver 1.3.3
Sliding Window Go Back N
Model Tabulation:
Time out
value in ms
1000
1500
2000
3000
4000
Successfully
Tx packets
0
33
65
66
67
Practical
Throughput
0
0.33
0.65
0.66
0.67
Model Graph:
Time out Vs Throughput
Throughput
0.8
0.6
0.4
X - Throughput
0.2
0
0
1000
2000
3000
4000
5000
Time Out
_____________________________________________________________________
Benchmark Electronic Systems
32
Lan-T Experiments Quick reference manual ver 1.3.3
Sliding Window Go Back N with BER
Experiment 9 – SLIDING WINDOW GO BACK N WITH BER
Aim:
Provide reliable data transfer between two nodes over an error network using the sliding
window GBN protocol
Procedure:
1. Set the error rate to 10-2 in the NEU.
2. Follow the Sliding Window GBN experiment procedure for running the experiment.
3. Set the time out value as 3000 ms in the sender window.
PC 1 SENDER
PC 2 RECEIVER
4. From the Statistics window note down the number of successfully transmitted packets and
calculate the throughput. (Calculation of throughput is same as explained in the previous
expt.)
5. Repeat the Experiment by setting different BER in the NEU.
6. Use the values to plot the graph between BER Vs Throughput
Note: You can also use the template for plotting the graph. Please refer Appendix-1 to plot the graph using
the template
_____________________________________________________________________
Benchmark Electronic Systems
33
Lan-T Experiments Quick reference manual ver 1.3.3
Sliding Window Go Back N with BER
Model Tabulation:
BER
10-6
10-5
10-4
10-3
10-2
Successfully
Tx packets
53
52
9
40
0
Theoretical
Throughput
0.63
0.55
0.18
0
0
Practical
Throughput
0.67
0.16
0.01
0
0
Model Graph:
BER Vs Throughput
0.8
Throughput
0.7
0.6
0.5
0.4
X - Throughput
0.3
Actual X
0.2
0.1
0
0
2
4
6
8
BER
_____________________________________________________________________
Benchmark Electronic Systems
34
Lan-T Experiments Quick reference manual ver 1.3.3
Packet Transmission
Experiment 10 – PACKET TRANSMISSION
1. Click on the Pkt icon
from the desktop of both the PC’s.
2. Click the Configuration button
in the window in both the PC’s.
PC 1 SENDER
PC 2 RECEIVER
Setting the configuration menu:
PC 1
Node id
Baud Rate
Duration
Packet Length
Bit Delay
Direction
PC 2
Node id
0
8Kbps (At both the Config Baud Rate
menu and NEU)
0
8Kbps (At both the
config menu and NEU)
100s
100 bytes
0(at NEU)
100s
100 bytes
0(at NEU)
Sender
Duration
Packet Length
Bit Delay
Direction
3. Download the driver to the NIU using the BOOT
Receiver
button command for both PCs.
4. Run the Receiver node first & then the transmitter window. Enter the receiver’s node ID in the
sender’s dialogue box, once it is prompted.
__________________________________________________________________________________
Benchmark Electronic Systems
35
Lan-T Experiments Quick reference manual ver 1.3.3
Packet Transmission
PC 1 SENDER
5. After this the sender will display another Get String dialogue box, here you can key in your
string using the keyboard & press the ok button.
PC 1 SENDER
__________________________________________________________________________________
Benchmark Electronic Systems
36
Lan-T Experiments Quick reference manual ver 1.3.3
Packet Transmission
6. Observe the text in the receiver node. If an empty message is sent, both the sender and
receiver should terminate.
PC 1 SENDER
Set the BER to 10
-4
PC 2 RECEIVER
and repeat the above-mentioned steps and observe the results.
__________________________________________________________________________________
Benchmark Electronic Systems
37
Lan-T Experiments Quick reference manual ver 1.3.3
FTP
Experiment 11 – FTP
1. Click on the FTP icon
from the desktop on both PCs.
2. Click the Configuration button
in the window in both the PC’s.
PC 1 SENDER
PC 2 RECEIVER
Setting the configuration menu:
PC 1
Node id
Baud Rate
Duration
Packet
Length
Bit
Delay
Direction
PC 2
0
8Kbps (At both the
config menu and
NEU)
Node id
100s
100 bytes
0(at NEU)
Duration
Packet
Length
Bit
Delay
Direction
Sender
Baud Rate
0
8Kbps (At both the
config menu and
NEU)
100s
100 bytes
0(at NEU)
Receiver
3. Set the IPD as 40 ms.
4. Download the driver to the NIU using the BOOT button command for both PCs.
__________________________________________________________________________________
Benchmark Electronic Systems
38
Lan-T Experiments Quick reference manual ver 1.3.3
FTP
5. Run the Receiver node first & then the transmitter window. While you do this, the sender
node will display a GetInt message box, if you want to transmit a file from Client to server,
Enter 1 or else if you want to download a file from Server to client, press 2.
PC 1 SENDER
6. Then Specify the Path of the file either to transmit or to download (i.e. c:\test.txt) & specify
the timeout value.
PC 1 SENDER
__________________________________________________________________________________
Benchmark Electronic Systems
39
Lan-T Experiments Quick reference manual ver 1.3.3
FTP
7. At the end of transmission, the file will be stored in the server node’s desktop.
PC 1 SENDER
PC 2 RECEIVER
__________________________________________________________________________________
Benchmark Electronic Systems
40
Lan-T Experiments Quick reference manual ver 1.3.3
Appendix – 1 Graph Plot Procedure
Procedure to plot graph for MAC Layer experiments using MS EXCEL template
Save the readings of the MAC layer experiments by clicking Save button from the Statistics
window in all the nodes.
By default the file get saved in the Desktop. (You can also save it in other location).
Organise all the files in a common location.
Open MS EXCEL.
Browse open .xls file in c:\Lantrain\Stat…. (Say:\Lantrain\Stat\Aloha\P100\ALOHAP100.xls).
Click Node1 sheet.
Go to Data Refresh data.
__________________________________________________________________________________
Benchmark Electronic Systems
41
Lan-T Experiments Quick reference manual ver 1.3.3
Appendix – 1 Graph Plot Procedure
Browse the respective file to be replaced with existing data for Node1.
Repeat the above step for all the four nodes.
Now click the RESULT USING 4 nodes sheet to view the graph.
__________________________________________________________________________________
Benchmark Electronic Systems
42
Lan-T Experiments Quick reference manual ver 1.3.3
Appendix – 1 Graph Plot Procedure
Note: Save exact seven readings for MAC experiments while using this template. Shortage or
excess number of readings may produce errors.
__________________________________________________________________________________
Benchmark Electronic Systems
43
Lan-T Experiments Quick reference manual ver 1.3.3
Appendix – 1 Graph Plot Procedure
Procedure to plot graph for MAC Layer experiments using MS EXCEL template
Save the readings of the LLC layer experiments by clicking Save button from the Statistics
window from the sender and receiver nodes.
By default the file get saved in the Desktop. (You can also save it in other location).
Organise all the files in a common location.
Open MS EXCEL.
Browse open .xls file in c:\Lantrain\Stat…. (Say:\Lantrain\Stat\Stop and Wait\P1000\Stop and
wait P1000.xls).
Click Timeout Vs X sheet.
__________________________________________________________________________________
Benchmark Electronic Systems
44
Lan-T Experiments Quick reference manual ver 1.3.3
Appendix – 1 Graph Plot Procedure
Scroll up to the sender readings.
__________________________________________________________________________________
Benchmark Electronic Systems
45
Lan-T Experiments Quick reference manual ver 1.3.3
Appendix – 1 Graph Plot Procedure
Go to Data Refresh data option.
Browse the respective file to be refreshed for the existing data.
Repeat the same to refresh the existing Receiver data with your data.
__________________________________________________________________________________
Benchmark Electronic Systems
46
Lan-T Experiments Quick reference manual ver 1.3.3
Appendix – 1 Graph Plot Procedure
Scroll down to see the plot
9. Follow the same procedure to Plot BER vs X.
__________________________________________________________________________________
Benchmark Electronic Systems
47
Lan-T Experiments Quick reference manual ver 1.3.3 ____Appendix 2 Configuration menu details
Config View displays the configuration dialog box where all the parameter values are displayed.
Node Id
- Specify that that particular application/experiment window should be as node 0 or 1.
This is the one that differentiates the two applications in the same PC.
Protocol
- Specify the MAC Protocol that NIU has to emulate. By default, it is set to Aloha
Baud Rate
- Specify the data rate between 8Kbps and 1Mbps. (Only for CSMA/CD and Ring
mode, this needs to be set both in the Application window and the NEU. For Aloha and CSMA,
settings in NEU are sufficient.)
No of Nodes - Specify the number of nodes in the network that are used to do Token Ring
experiment. This field may be used for other purposes while writing codes for suggested
experiments in exercise also.
Duration
- Specify the duration of the experiment in seconds.
Packet Length - Specify the length of packets that are used in the experiment. Can be set to a
maximum of 1000 bytes.
__________________________________________________________________________________
Benchmark Electronic Systems
48
Lan-T Experiments Quick reference manual ver 1.3.3 ____Appendix 2 Configuration menu details
Inter Packet Delay - Specify the inter packet delay (that is equivalent to the inter packet arrival
time) based on the calculation suggested in the experiments. This has to be in milliseconds.
Number of Packets - Specify number of packets in a window for Sliding Window experiment. This
field may be used for other purposes while writing codes for suggested experiments in exercise, say
for example, to specify number of packets to be transmitted or received in a MAC experiment instead
of following time.
My Address - Specify the address of each node (between 1 and 6) in top layers. For example, the
server uses this field in FTP to identify the client for sending and receiving files.
Rx Mode
- Specify Promiscous or Non-Promiscous mode of packet reception. By default all the
stand-alone experiments use promiscuous mode of reception (receives all the packet). Altering this
field will not have effect in the stand-alone experiments. Refer programmer’s manual for using
various types while writing codes for exercises.
I/O Mode
- Fixes the types of transmit and receive modes. In majority of the stand-alone
experiments, blocking transmit and receive is used and the other types are left for the user to
implement wherever necessary as suggested in exercises. Altering this field will not have effect in
the stand-alone experiments. Refer programmer’s manual for using various types while writing codes
for exercises.
Token Release Mode
- Specify the type of token release mode to be followed in token ring.
Manual token release is used in token ring experiment. Altering this field will not have effect in this
stand-alone experiment. Refer programmer’s manual for using various types while writing codes for
exercises.
Direction
- Specify which direction to be followed by each node. In MAC experiments, Sender
will only transmit data packets and Receiver will only receive. In DLL experiments, Sender will
transmit data packets and receive acknowledgement packets while Receiver will receive them and
transmit acknowledgement packets. In FTP Sender is the client and Receiver is the server.
Boot File Name - Name and path of the NIU driver file. This is for future use. The default file and
location is C:\Lantrain\bin\LantV13.exe. It may be left to this default name.
__________________________________________________________________________________
Benchmark Electronic Systems
49
Lan-T Experiments Quick reference manual ver 1.3.3
Appendix 3 Developing Lan-T applications
Developing LAN Trainer Applications
The LAN Trainer API is a Windows DLL (Dynamic Link Library) written in C. Microsoft Visual
C++ compiler that comes under Microsoft Visual Studio is used for the Shell and the experiments.
Microsoft Visual Studio provides a development environment for Visual C++. This integrated set of
tools runs under Windows 95, 98, Windows NT or Windows 2000 or other operating systems as
recommended by Microsoft. The Developer Studio user-interface consists of an integrated set of
windows, tools, menus, toolbars, directories, and other elements that allow you to create, test, and
refine your application in one place.
This Appendix describes the organization of the source code into workspaces and projects and
how you can use the LAN Trainer to write network software. You can modify the source code of the
experiments supplied with the LAN Trainer or implement different protocols and projects by creating
them as new experiments. Finally, if you wish, you can customize the LAN Trainer shell.
Organisation of LAN Trainer Source Code
LAN-T software uses a single workspace for all the experiments and therefore all experiment
projects are created under the workspace called Expts.dsw that will be in C:\Lantrain\Src directory.
A workspace is the one that contains one or more projects. A project is the one that
generates the executable file (ex: MAC.exe). In LAN-T software, Expts.dsw is the workspace and the
experiments are the projects namely, MAC (for ALOHA, CSMA, CSMA/CD), TknBus, TknRing, Pkt,
SlWinGBN, StopWait, FTP.
Modifying an Existing Experiment
MAC experiment is taken here as an example to list the steps involved in modifying an existing
experiment. Each experiment is a project under the workspace discussed above.
•
Open experiment workspace from the following path C:\Lantain\Src\Expts.dsw in VC++
•
Make the project that you want to modify, say MAC, active using the option Set Active Project
from the Project menu.
•
Open MAC.cpp from the Source folder and do the necessary coding.
•
Save workspace using Save Workspace menu option under File menu and Build the project (Build
is the process of compilation and linking that creates the *.exe file that is ready to run) using the
key F7. Once the Build result is successful run the experiment by pressing the keys Ctrl+F5.
Please refer Microsoft VC++ User Manual for more options in compiling and linking a project file.
__________________________________________________________________________________
Benchmark Electronic Systems
50
Lan-T Experiments Quick reference manual ver 1.3.3
Appendix 3 Developing Lan-T applications
Creating a New Experiment
Open experiment workspace from the following path C:\Lantrain\Src\Expts.dsw in
VC++
Create a new project by clicking New in the File menu.
Choose a project name (say Test) and choose MFC Appwizard (EXE) as project
type. Check the option Add to current workspace and finally click the OK button.
Select Single document and click Finish button. Now the wizard will create a Project
Workspace (Test) with three directories namely Source Files (containing *.cpp
files), Header Files (containing *.h files) and Resource Files (containing resource
files) under it.
This project will now be the active project as far as VC++
workspace is concerned.
Delete all the files from this project workspace i.e. from Source Files, Header Files
and Resource Files directory. [To delete a file from workspace click that file and
press Del key.]
Open
Windows
Explorer
and
delete
all
files
from
the
working
directory
(C:\Lantrain\Src\Test\) including the Res directory except the *.dsp file – in our
example it is Test.dsp file.
Copy the following files from C:\Lantrain\Src\ShellVxy\ to the current project
directory C:\Lantrain\Src\Test\
•
Res directory.
•
stdAfx.cpp and stdAfx.h
•
resource.h and resource.hm
•
lanT.rc and lanT.aps
•
A sample mac.cpp file
•
Rename this mac.cpp file as Test.cpp
•
Note: The directory and filename Shellxy represents the LAN-T Shell with Version specified by x
and y. For example SHellV13 denotes LAN-T Shell Ver1.3
Above said files have to be added in the project workspace under the appropriate
folder names. To add, click the folder name (say Source Files) and right click the
mouse button and select Add files to Folder. This will open up the File Open dialog
box through which you can add files that are listed below in their appropriate
folders.
__________________________________________________________________________________
Benchmark Electronic Systems
51
Lan-T Experiments Quick reference manual ver 1.3.3
•
•
Appendix 3 Developing Lan-T applications
Select Source Files folder and add the following
lanT.rc
stdAfx.cpp
Test.cpp file
Select Header Files folder and add the following
resource.h
resource.hm
stdAfx.h
•
Select Resource Files folder and add all the files in the Res directory.
•
Now save the entire workspace.
Under Projects menu select Settings and do the following:
•
Select General tab and choose Use MFC in a static library.
•
Select Link tab and link the libraries by writing Shellvxy.lib Lantrn.lib in the Object/Library
modules field.
•
Select C\C++ tab and select the category as Precompiled headers and select the Automatic use
of precompiled headers option.
•
Click OK button.
•
Under Tools menu select Options and select directories tab.
Pull down Show directories for and select include files. Write C:\Latrain\Include as the last entry
in the Directories field that lists already other required files.
•
Pull down Show directories for and select library files. Write C:\Lantrain\lib as the last entry in
the Directories field that lists already other required files.
•
Save the entire workspace and the project is ready for coding and compilation.
•
Choose the Test.cpp file and do the necessary coding and Build it by pressing the key F7 and run
it by pressing Ctrl+F5.
__________________________________________________________________________________
Benchmark Electronic Systems
52
Lan-T Experiments Quick reference manual ver 1.3.3
Appendix 3 Developing Lan-T applications
Customising the Shell
The user-interface for all LAN Trainer experiments is provided by a collection of functions
referred to as the Shell. This method is followed to focus the topic of interest in the algorithm or the
method followed in implementing a protocol than on the user-interface part.
Even though it is
recommended to concentrate on the protocols and its implementation the complete source code for
the Shell is given in C:\Lantrain\Src\ShellVxy directory for the user to customize according to their
requirements. The last two alphabets in the filename represent the version number. For example
ShellV13 file is the Shell file of version number 1.3. If you wish to customize the Shell, follow the
steps given below:
Open experiment workspace from the following path C:\Lantrain\Src\Expts.dsw in
VC++
Create a new project by clicking New in the File menu.
Choose a project name (say ShellTest) and choose Win32 Static Library as project
type. Check the option Add to current workspace and finally click the OK button.
Click Finish button. Now wizard will create a project with two directories namely
Source Files and Header Files. Add a new folder called Resource Files by clicking
the right button of mouse on the project name (here ShellTest files) and selecting
New Folder. This will open up a dialog box with Name of the Folder field and File
extensions field. In the first field give the name as Resource Files and in the second
field give *. * as file extensions.
Open windows explorer and copy all the files from C:\Lantrain\Src\ShellVxy\
directory to the current project directory C:\Lantrain\Src\ShellTest\.
This current
project directory would have been created in the hard disk as soon as the project is
added in the workspace as said in the above step.
Above said files have to be added in the project workspace under the appropriate
folder names. To add, click a folder name (say Source Files) and right click the
mouse button and select Add files to Folder. This will open up the File Open dialog
box through which you can add files that are listed below in their appropriate
folders.
•
Select Source Files folder and add the following
all cpp files (*.cpp)
lanT.rc
__________________________________________________________________________________
Benchmark Electronic Systems
53
Lan-T Experiments Quick reference manual ver 1.3.3
•
•
Appendix 3 Developing Lan-T applications
Select Header Files folder and add the following
all header files (*.h)
resource.hm
Select Resource Files folder and add all the files in the Res directory.
Under Projects menu select Settings and do the following:
•
Select General tab and choose Use MFC in a static library.
•
Select C\C++ tab and select the category as Precompiled headers and select the Automatic use
of precompiled headers option.
•
Click OK button.
•
Under Tools menu select Options and select directories tab.
Pull down Show directories for and select include files. Write C:\Latrain\Include as the last entry
in the Directories field that lists already other required files.
•
Pull down Show directories for and select library files. Write C:\Lantrain\lib as the last entry in
the Directories field that lists already other required files.
•
Save the entire workspace and the project is ready for coding and compilation.
Shell has all *.cpp files appropriate for the dialogs used in the user-interface and
mainframe.cpp for tool bar and menu. You may modify them or add or remove
dialogs as you wish and save them.
After finishing the coding, Build it by pressing the key F7 and it will create a lib file
(here ShellTest.lib) in the debug directory. Copy this lib file from the debug
directory to C:\Lantrain\Lib directory and copy Ltulib.h from the shell working
directory (here C:\Lantrain\ShellTest\) to C:\Lantrain\Include directory.
Linking the new Shell library with experiments
__________________________________________________________________________________
Benchmark Electronic Systems
54
Lan-T Experiments Quick reference manual ver 1.3.3
1. 1.
Appendix 3 Developing Lan-T applications
Copy the following files from the working directory of the newly created library (here
C:\Lantrain\Src\ShellTest\) to the experiment project directory (say C:\Lantrain\Src\MAC\) - the
one you wish to use with the new user-interface:
a. a.
Res directory.
b. b.
stdAfx.cpp and stdAfx.h
c. c.
resource.h and resource.hm
d. d.
lanT.rc and lanT.aps
2) 2)
Under Projects menu select Settings and select Link tab and link the library by changing
the old library name to new library name alone (say ShellV13.lib to ShellTest.lib) in the
Object/Library modules field. Leave the Lantrn.lib as unchanged in that field.
3) 3)
Select RebulidAll from the Project menu to compile the experiment. Now the experiment is
ready to run with the new user-interface.
__________________________________________________________________________________
Benchmark Electronic Systems
55