1
Designing microwave
cookers
Sunday, January 26, 2003
Harold Thimbleby
UCLIC, UCL Interaction Centre
LONDON
WC1H 0AP
http://www.uclic.uck.mdx.ac.uk/harold
Lecture notes
A substantial part of the product development cycle of interactive devices can be combined into a single, coordinated approach. Much can be derived automatically from a suitable specification of the interactive
device, and it can all be derived automatically.
A microwave cooker is used as a real example. However, these notes provide full and unabridged details of
everything it discusses by using Mathematica as a rapid prototyping environment. Any similar device can be
analysed in the same way, directly from the notes.
Introduction
The definition of a device, its simulation, its usability analysis, and its user manuals in any language (and
interactive help, if required), can all be worked on directly and efficiently in a suitable design environment. If
part of the design process suggests improvements, say that the user manual has an obscurity, then it can be
changed directly by modifying the specification; and the new specification will update all other parts of the
product, the analysis, the simulation, and so on. Importantly, the approach only has one definition of the
device; thus changes — as occur during iterative design and product revision — immediately and
automatically affect all parts of the development process: the analysis, the simulation, the help (and even the
hardware). Specification-led design is so efficient that it is effectively concurrent engineering.
The importance of the approach is that many components of a product are derived efficiently and
automatically, almost at once. In normal design methods, there is a sequential (and costly) progression from
specification, through fabrication, to manual writing, and finally usage. If any errors are detected, one usually
requires the whole process to be started again, or when that is too expensive, or would cause too much delay,
one chooses to live with the errors. In particular, only at later stages can usability problems be identified —
but by then, the product is already fabricated, and many of the usability insights would be very hard to take
back to the specification, even it was still available.
Specification-led design
To illustrate our approach we have used the symbolic mathematical system, Mathematica (Wolfram, 1996).
Many popular system development environments, especially those aimed at providing visual realism, would
have been inappropriate because they never explicitly 'know' what the device specification is, and none of the
automatic benefits discussed here could have been be obtained. These notes were developed and printed
entirely within Mathematica: all the examples are genuine, and have not been re-keyed or fudged in any way.
Stylistically, this does have the disadvantage that explaining the ideas is interleaved with some distracting
explanation of the Mathematica code. If desired the approach could be packaged for designers in such a way
that none of these technical details would be visible to a designer. However, I felt that being able to see that
the method really works, and giving completely open details to any reader was more important.
As a running example, we shall use the definition of a microwave cooker, as given in Jonathan Sharp's PhD
thesis (Sharp, 1998). As a deliberate decision, we used Sharp's exact definition, to try and emphasise the
generality of the approach.
Preliminaries
Since this is a Mathematica definition, it has to start with some Mathematica preliminaries. This section can be
skipped on first reading — though it also provides some examples of Mathematica being used, to explain the
formatting conventions this paper uses.
We start by loading the standard Mathematica package for combinatorics (to load a shortest path function,
which we will need for calculating the designer's optimal transition matrix), and a basic utility routine.
<< DiscreteMath`Combinatorica` ;
vector_ ’ element_ := Position@vector, elementDP1, 1T
The function ’ (pronounced 'such that,' defined above) gives the numerical index into a vector such that the
element would be selected. Here is how it is used:
exampleVector = 8firstElement, secondElement, thirdElement<;
exampleVector ’ secondElement
2
Here we see an example of Mathematica output: secondElement is to be found at position 2 in the example
vector.
Device definition
Mathematica shows how easy reusable development is to do. By making minor changes to the definitions
here, other devices can be developed in the same way.
Here is Jonathan Sharp's definition of his microwave cooker. Because we decided to use exactly his definition
(for reasons given above), the function ’ (defined above) is used frequently to convert between names and
numbers; had Sharp defined his device directly in terms of state numbers this would not have been
2
Specification-led desi
necessary. (Instead, we might have defined each button and state as a numerical constant; but the approach
we have used makes the device definition easier to read and less error-prone.)
device = 8
8"Clock",
8"Clock",
8"Clock",
8"Clock",
8"Clock",
8"Clock",
"Quick
"Quick
"Quick
"Quick
"Quick
"Quick
defrost",
defrost",
defrost",
defrost",
defrost",
defrost",
"Timer
"Timer
"Timer
"Timer
"Timer
"Timer
1",
1",
2",
1",
2",
1",
"Clock",
"Clock",
"Clock",
"Clock",
"Clock",
"Clock",
"Clock"<,
"Quick defrost"<,
"Power 1"<,
"Power 2"<,
"Power 1"<,
"Power 2"<<;
buttonNames =
8"@ClockD", "@Quick defrostD", "@TimeD", "@ClearD", "@PowerD"<;
stateNames = 8"Clock", "Quick defrost",
"Timer 1", "Timer 2", "Power 1", "Power 2"<;
numberOfStates = Length stateNames;
numberOfButtons = Length buttonNames;
We need the name of the Time button later — and we define it here, in case we decide to change its name.
timeButton = "@TimeD";
The five parts of the device specification, here represented by five variables (buttonNames,
numberOfButtons, etc.), can be encapsulated into a single structure, and for actual development work this
would have been preferable, rather than proliferating five variables per design. Mathematica provides various
ways to do this (packages, object-oriented programming, etc.), but for such a brief paper as this, to do so
would introduce unnecessary technical detail.
Sharp didn't write his specification in Mathematica! Mathematica can, however, print the specification above
quite closely to the style that Sharp used; in fact, Mathematica provides an extensible user interface to make
the entry of tabular data as easy as using a spreadsheet.
We define a function neatTable to make a reasonably neat tabular presentation of any device. It is probably
clear from the intricacy of this code that almost any typographical details can be accommodated.
Specification-led design
neatTable@title_, device_, stateNames_, buttonNames_D :=
With@8heading = StyleBox@#, FontFamily fi "Helvetica",
FontSize fi 10, FontWeight fi "Bold"D &,
subHeading = StyleBox@#, FontWeight fi "Bold"D &<,
StyleBox@GridBox@88FrameBox GridBox@
88GridBox@Transpose 8Join@8heading@"States"D, ""<,
subHeading
stateNamesD<, ColumnAlignments fi
RightD, GridBox@ 88heading@"— Buttons —"D<,
8GridBox@Join@8subHeading
buttonNames<, deviceD,
ColumnLines fi True, RowLines fi 8True, False<D<<D<<,
ColumnLines fi TrueD<, 8heading@titleD<<D,
FontFamily fi "Palatino", FontSize fi 12,
FontWeight fi "Plain"D
DisplayFormD;
neatTable@"Sharp's Microwave cooker",
device, stateNames, buttonNamesD
— Buttons —
States
@ClockD @Quick defrostD @TimeD @ClearD
@PowerD
Clock
Clock
Quick defrost
Timer 1
Clock
Clock
Quick defrost
Clock
Quick defrost
Timer 1
Clock
Quick defrost
Timer 1
Clock
Quick defrost
Timer 2
Clock
Power 1
Timer 2
Clock
Quick defrost
Timer 1
Clock
Power 2
Power 1
Clock
Quick defrost
Timer 2
Clock
Power 1
Power 2
Clock
Quick defrost
Timer 1
Clock
Power 2
Sharp' s Microwave cooker
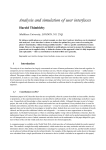
The table is read as follows: choose the column according to the current state of the device, then read off the
next state of the device from the row corresponding to the button pressed.
If we hadn't wanted all the typographical details just so, Mathematica could have printed the specification in a
basic form, just with TableForm[device].
4
Specification-led desi
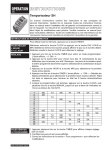
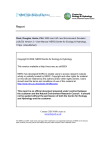
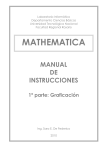
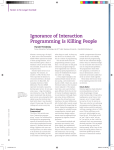
ShowLabeledGraph@FromAdjacencyMatrix@
Table@If@MemberQ@device@@iDD, stateNames@@jDDD, 1, 0D,
8i, numberOfStates<, 8j, numberOfStates<D,
Type fi DirectedD, stateNamesD;
Quick defrost
Clock
Timer 1
P
Timer 2
Power 1
Simulating the user interface
To simulate the device, we use a global variable to keep track of the changing state of the device as buttons
are pressed. We will start the device in state 1, which happens to be clock. Arguably, a device definition
should specify its initial state — the state a device is in as soon as it is used: for many devices, this state will
be its being off.
state = stateNamesP1T
Clock
The definitions given in this section merely show the name of the current state in the display. It is possible to
display anything, not just plain text, but to do so would take us beyond the scope of this paper.
When a button on the simulation is pressed, Mathematica will arrange for the function press to be called,
with the button as a parameter.
Specification-led design
press@theButton_D := Module@8nb = ButtonNotebook@D<,
collectStatistics@theButton, stateD;
state =
devicePstateNames ’ state, buttonNames ’ theButtonT;
NotebookFind@ nb, "display", All, CellTagsD;
SelectionMove@nb, All, CellContentsD;
NotebookWrite@nb, Cell@ToString stateDD
D
After collecting any useful statistics, this function uses the device specification to determine the next state.
The next few lines of the function locate the device's display cell in the current Mathematica notebook
(Mathematica can have several notebooks — that is, windows — running together, which is why the variable
nb is required); the text displayed in that cell is selected and replaced with the name of the new state.
By defining collectStatistics, we make press collect empirical statistics as the simulation is used. For
simplicity, we will just collect state transition counts:
statistics = Table@0, 8numberOfButtons<, 8numberOfStates<D;
collectStatistics@theButton_, state_D :=
++statisticsPbuttonNames ’ theButton, stateNames ’ stateT
The following code is the definition of a row of buttons to control the device.
CellPrint@
Cell@BoxData@RowBox@Map@ButtonBox@#, ButtonFunction ƒ press@#D,
ButtonEvaluator fi AutomaticD &, buttonNamesDDD,
Active fi True, TextAlignment fi CenterDD
@ClockD @Quick defrostD @TimeD @ClearD @PowerD
The device's simulated display is a simple Mathematica 'cell' (shown below) with an appropriate name so that
the press function can locate it. In its simplest form it could be just Cell["", CellTags fi "display"].
If desired, Mathematica allows cells and buttons to contain further 'typographical' details, such as their font,
size and colour. For example, the device's display can easily be made to look more like a typical LED display
of green text on a black background, by providing options (such as, FontFamily fi "Courier",
FontColor fi RGBColor[0, 1, 0], Background fi GrayLevel[0], and its correct dimensions) in
the definition of the cell:
Power 2
In a running Mathematica session, pressing the buttons makes this display work, as well as collect data on the
users' behaviour with the simulation.
Mathematica can itself generate button definitions from any device specification, and one can extend the
definition to include explicit sizes, positions and so forth. (We will give an example below.) Thus, the user
interface itself can be defined by the same device specification. This is very important to make the analysis —
6
Specification-led desi
both mathematical and empirical — use consistent specifications; they can be edited easily and only in one
place.
Analysis and graph drawing
We will analyse the user task of getting from state power1 to state power2. To consider a particular task, we
do need to know the appropriate state names. Alternatively, it is possible to analyse all pairs of states (hence,
all tasks the device supports) and obtain statistics, which would typically be weighted by the relevance or
importance of the tasks to users. However, for the purposes of this paper, analysing just one task is sufficient.
start = stateNames ’ "Power 1";
goal = stateNames ’ "Power 2";
Getting gnomes in on the action
Gnome@start_, goal_, limit_D :=
Module@8g, s, n, total<,
total = 0;
For@i = 1, i £ limit, i ++,
s = start;
For@n = 0, s „ goal, n ++,
g = Random@Integer, 81, numberOfButtons<D;
s = stateNames ’ devicePs, gT;
D;
total += n;
D;
Return@N@total limitDD;
D
We want to know how hard it is to get from Power 1 to Power 2, which we've called the start and the goal.
Rather than go to the trouble of getting a human user (and wondering what sort of human, how familiar they
are with microwaves and so on) let's use a gnome:
Print@"Average = ", Gnome@start, goal, 1DD;
Average = 169.
This gnome takes 169 steps (or maybe not, depending on whether this Mathematica document has been re-run
and used a different gnome!
Was this gnome lucky, and found it easy; or was the gnome a bad one, and got us an answer seemingly too
hard? We should try more gnomes and at least average the results. We'll now try some serious experiments
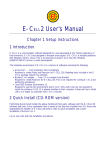
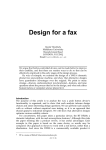
hiring 10 gnomes at a time; we'll run 500 trials with each gnome, and plot the results to see what we can learn:
Specification-led design
Module@8results = 8<, i, total = 0,
expts = 500, h, combined = 8<, m, maxm = 0<,
For@h = 1, h £ 10, h ++,
results = 8<;
total = 0;
For@i = 1, i £ expts, i ++,
total += Gnome@start, goal, 1D;
results = AppendTo@results, 8i, total i<D
D;
m = Max@results . 8_, y_< fi yD;
If@m > maxm, maxm = mD;
combined = AppendTo@combined, ListPlot@results,
PlotJoined fi True, AxesLabel fi 8"Trials", "Average"<,
PlotRange fi 880, expts<, 80, m<<, AspectRatio fi .75,
PlotStyle fi Hue@N@h 10DD, PlotLabel fi "Gnome " <> ToString@hDDD
D
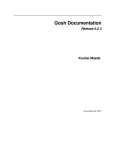
Show@combined, PlotLabel fi "Summary",
PlotRange fi 880, expts<, 80, maxm<<D;
D
Average
Summary
500
400
300
200
100
100
200
300
400
Trials
500
If gnomes were expensive or slow to study a user interface, we would have to engage in some interesting
statistics. How many gnomes do we need to get decent results? Our simple graphs drawn above make it look
like once we have 200 gnomes, getting more won't tell us much more than we already know. For a more
complex device than our microwave cooker, 200 may be too small. Before we try other approaches, let's go for
broke, and employ 10,000 gnomes to do some work:
Print@"Average = ", Gnome@start, goal, 10000DD;
Average = 120.038
8
Specification-led desi
Doing the analysis by maths
Gnomes might be hard to get hold of in the real world, but they are easy to program and do things with
inside design tools. In fact — in case you hadn't guessed — all the results above were actually done by
computers. No gnomes were used in preparing the figures. If we built a design tool to help people make
interactive systems, it could have a 'gnome' button that tried pressing buttons at random, to see how hard the
device was, and whether it would break down under persistent, mindless testing.
We can use people, gnomes, computers, or is there another way? It turns out that Markov did a lot of work on
random processes, and Markov's techniques lend themselves to mathematical treatment. The details are quite
tricky, but that doesn't matter, because we can ask someone else to do the maths (or write a program for us);
we can use the results.
We now do a Markov analysis of the microwave cooker, and we will see it is a good way of estimating how a
user, making random errors, would perform using the device. It should be noted that this approach is a
'keystroke level model' but which allows for errors — which most analytic techniques don't manage to do.
We will be able to draw a graph of a user's task performance against how accurately (how error-free) or how
well they know how to do the task perfectly.
First, we must convert Sharp's definition into a stochastic matrix, which we'll call gnome in honour of the
creatures we are putting out of business:
gnome = Table@0, 8numberOfStates<, 8numberOfStates<D;
Do@gnomePi, stateNames ’ devicePi, bTT += 1 numberOfButtons,
8b, numberOfButtons<, 8i, numberOfStates<D;
Here is the gnome matrix displayed in traditional mathematical notation:
gnome
i
j
j
j
j
j
j
j
j
j
j
j
j
j
j
j
j
j
j
j
j
j
j
j
j
j
j
j
j
j
j
j
j
j
j
j
j
k
TraditionalForm
3
5
2
5
2
5
1
5
2
5
1
5
1
5
1
5
0
0
0
0
0
1
5
1
5
2
5
1
5
1
5
0
0
2
5
1
5
0
1
5
1
5
2
5
1
5
1
5
0
0
0y
z
z
z
z
z
z
0z
z
z
z
z
z
z
z
0z
z
z
z
z
1 z
z
z
z
5 z
z
z
z
z
0z
z
z
z
z
z
z
1 z
5 {
Each row gives the probability that the user — or gnome! — will change the state of the microwave cooker;
thus, if the device is in state 1, the gnome will change it to state 2 with probability 1/5 (i.e., first row, second
column).
This matrix will be used for our analysis. For now, the assumption is that each button on the device is pressed
with equal probability. (There are five buttons, so all the probabilities are so-many fifths.) The user interface
simulation can give empirically-based probabilities, and we will use them later.
Specification-led design
Here we give the definition of the mean first passage time in its most direct form (our associated paper gives
a full derivation of the relevant formula). The mean first passage time represents a user's difficulty with
performing a task.
ZeroRowCol@matrix_, rc_D :=
Table@If@ i == rc ¨¨ j == rc, 0, matrixPi, jTD,
8i, Length matrix<, 8j, Length matrix<D;
Unit = Table@1, 8numberOfStates<D;
Id = IdentityMatrix@numberOfStatesD;
meanFirstPassage@matrix_, start_, goal_D :=
HInverse@Id - ZeroRowCol@matrix, goalDD. UnitLPstartT;
This might look mysterious, but all it does it tell you what a gnome would do. Here is how the function can
be used:
meanFirstPassage@gnome, start, goalD
120
Thus, the expected time to perform the task, to get from the start state (power1) to the goal state (power2), is
120 button presses. Of course, like a gnome, the Markov model doesn't "know" how to use the microwave,
which is why the numbers still seem so high.
Unlike gnomes, we expect that the designers of devices should know how to use them! We now create a
designer's matrix, which represents optimal use for any task, based on the optimal route from the start to the
goal states. (The gnome, random user, matrix is converted to a Graph type to find shortest paths; it can be
done conveniently — and correctly! — from the gnome matrix, since exactly its non-zero elements are device
transitions.)
MakeUnits@m_D := Map@If@#
0, 0, 1D &, m, 82<D
designer = Table@0, 8numberOfStates<, 8numberOfStates<D;
Do@Module@8p = ShortestPath@FromAdjacencyMatrix@
MakeUnits@gnomeD, Type fi DirectedD, i, goalD<,
designerPi, If@ Length@pD > 1, pP2T, iDT = 1D,
8i, numberOfStates<D;
We should check that this designer knows how to do the task!
meanFirstPassage@designer, start, goalD
2
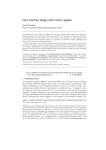
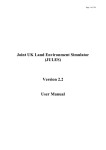
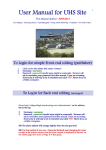
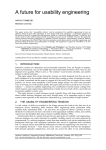
Evidently, the more knowledge the easier the device is to use. A graph of difficulty of use against knowledge
can be plotted:
10
Specification-led desi
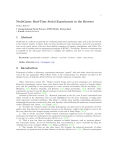
Plot@meanFirstPassage@Hx 100L * designer + H1 - x 100L gnome, start,
goalD, 8x, 0, 100<, AxesLabel fi 8"Knowledge %", "Cost"<D;
Cost
120
100
80
60
40
20
20
40
60
80
100
Knowle
This shows that as a user learns more about the device (the larger x), until they know as much about it as the
designer (knowledge=100%), their performance improves. In particular, if the user doesn't know much
(where the graph is steep), then even a little help can have a dramatic improvement on their performance. We
don't have enough space to do this sort of graph justice, except to point out different device designs (which
can easily be explored) have different shaped curves, and hence this approach gives useful insight into design
trade-offs.
Many other sorts of analysis are possible. See Thimbleby (1994), a general approach, and Thimbleby (1997),
the analysis of a particular device, for further examples. Below, we shall show that it is possible to generate
user manuals from specifications: the structure of manuals can be analysed (without anyone ever having to
see them) — for example, to identify the hardest (e.g., most lengthy) parts of them, and then to redesign the
device so that awkward parts are simplified. Thimbleby & Addison (1994) show how to use flow analysis,
arguing that user manual design should follow program design best practice.
Looking at empirical statistics of use
The statistics of use collected could be used directly in link analysis and with other conventional design
techniques (Stanton, 1998), but we shall continue with the Markov analysis. We could use the function
neatTable, defined above, to print out the statistics in a neat form.
The actual statistics data used to calculate the information in this section is shown below. (In fact, the
numbers here were originally printed by asking Mathematica for the value of statistics during a session.)
The Mathematica code below can be run to initialised the variable statistics (e.g., during a live
demonstration of this paper).
Specification-led design
1
statistics = 882, 5, 8, 4, 6<, 84, 2, 3, 2, 1<,
81, 1, 6, 2, 2<, 81, 2, 0, 2, 1<, 80, 1, 0, 1, 0<, 80, 0, 1, 0, 0<<;
neatTable@"Button presses in each state",
statistics, stateNames, buttonNamesD
— Buttons —
States
@ClockD @QuickdefrostD @TimeD @ClearD @PowerD
Clock
2
5
8
4
6
Quick defrost
4
2
3
2
1
Timer 1
2
1
6
2
2
Timer 2
2
2
0
2
1
Power 1
1
1
0
1
0
Power 2
0
0
1
0
0
Button presses in each state
Which is the most popular button?
With@8b = Map@Apply@Plus, #D &, Transpose statisticsD<,
buttonNamesPPosition@b, Max@bDDP1, 1TTD
@TimeD
We will explore alternative designs below, and in particular we shall look at the significance of the time
button to usability.
We can ask how well the users of the simulation performed the task. The statistics matrix counts button
presses in each state; we now convert it to a transition matrix; each row of it has to be divided by the total
number of transitions out of the corresponding state, to convert the matrix to a stochastic matrix (each row
adds to a probability of 1):
statsMatrix = Table@0, 8numberOfStates<, 8numberOfStates<D;
Do@statsMatrixPi, stateNames ’ devicePi, bTT += statisticsPi, bT,
8b, numberOfButtons<, 8i, numberOfStates<D;
NumberForm@N@statsMatrix =
statsMatrix Map@Apply@Plus, #D &, Transpose statsMatrixD,
2D, 2D
TraditionalForm
0.48
i
j
j
j
j
0.5
j
j
j
j
j
0.25
j
j
j
j
j
j 0.5
j
j
j
j
0.5
j
j
j
k 0.
12
0.2
0.25
0.083
0.33
0.5
0.
0.32
0.25
0.
0.
0.
1.
0.
0.
0.5
0.
0.
0.
0.
0.
0.17
0.
0.
0.
0. y
z
z
z
0. z
z
z
z
z
0. z
z
z
z
z
0.17 z
z
z
z
z
0. z
z
z
z
0. {
Specification-led desi
N@meanFirstPassage@statsMatrix, start, goalD, 2D
61.3966
Since this is better than ignorance (120 steps), but worse than the designer's optimal, it is likely that this user
(or collection of users) sometimes did the required task, or almost did it, but whatever they did was not as
random as knowing nothing!
We can determine how thoroughly the user interface simulation has been tested; perhaps some transitions
have not been tried out by any user so far? We could use Mathematica to summarise the as-yet untested
transitions. It may be that by getting users to try these transitions out that we discover some obscure
behaviour in the device. Perhaps some of the transitions the device supports are counter-intuitive? The
following simplistic code tells us what buttons users have not yet been tried (it doesn't try to produce good
English!).
Do@If@statisticsPs, bT == 0, Print@"Nobody tried to press ",
buttonNamesPbT, " when in state ", stateNamesPsTDD,
8b, numberOfButtons<, 8s, numberOfStates<D
Nobody tried to press @ClockD when in state Power 2
Nobody tried to press @Quick defrostD when in state Power 2
Nobody tried to press @TimeD when in state Timer 2
Nobody tried to press @TimeD when in state Power 1
Nobody tried to press @ClearD when in state Power 2
Nobody tried to press @PowerD when in state Power 1
Nobody tried to press @PowerD when in state Power 2
What transitions did the users try, but which the device isn't designed to support?
Do@If@statisticsPs, bT „ 0 && devicePs, bT === stateNamesPsT,
Print@buttonNamesPbT, " was pressed in state ",
stateNamesPsT, " but did nothing"DD,
8b, numberOfButtons<, 8s, numberOfStates<D
@ClockD was pressed in state Clock but did nothing
@Quick defrostD was pressed in state
Quick defrost but did nothing
@ClearD was pressed in state Clock but did nothing
@PowerD was pressed in state Clock but did nothing
@PowerD was pressed in state Quick defrost but did nothing
More sophisticated analysis would likely use a log of the users' button presses, whereas the statistics collected
in the function press only counted state changes — this throws away the information about which button is
pressed, and it also loses information relating to tasks that take more than one button press.
Specification-led design
1
Exploring alternative designs
Specification-led design is ideal to explore trade-offs for alternative designs. Obvious alternatives for
Jonathan Sharp's device would be to explore designs that have one button per state (so buttons change the
state of the device predictably), or to have a single button that cycles through all states. Both of these
alternative designs are simple, but are only appropriate for a device with a small number of states. This
section of the paper shows how we can explore some alternative design ideas that would also be appropriate
for devices with much larger number of states. For clarity, we will not introduce new device specifications,
just different ways of interacting with the original device.
The mean first passage time says how many button presses a user takes. From the graph, it is clear that an
ignorant user, one behaving quite randomly, is very inefficient, taking 120 button presses — to do a task that
a knowledgeable user can do in just 2 presses. Can we modify the design so that 'ignorant' users are more
efficient? Much of their inefficiency comes about because they press buttons that do nothing. Let us modify
the design so that users are discouraged from pressing pointless buttons. We could imagine that each button
can be lit up, perhaps so that its name is only visible when its light is on. (If the device was like a video
recorder, it would most often be used in the dark anyway, so lights on buttons would have a dramatic effect
on users' behaviour.)
To analyse this new design, we construct a new matrix, litButton, that represents the (random) behaviour
of users who only press buttons that do something. The matrix can be calculated from the random pressing
matrix (used above), by zeroing the diagonal (presses that do not change state) and renormalising:
litButton = Table@If@i „ j, gnomePi, jT, 0D,
8i, numberOfStates<, 8j, numberOfStates<D;
litButton = Table@litButtonPiT Plus
litButtonPiT,
8i, numberOfStates<D;
N meanFirstPassage@litButton, start, goalD
70.8
This is an improvement on 120, which suggests we should do some empirical experiments with users. To do
so, we can revise the Mathematica simulation and arrange for buttons to change colour depending on whether
they actually do anything in the current state.
We define newInterface to be an expression that Mathematica can render as a row of coloured buttons, but
for the time being we don't choose any particular colours. Instead, RGBPlaces records the 'slots' where the
colour specifications are needed, so the colours can be updated every time a button is pressed.
14
Specification-led desi
newInterface = Cell@BoxData@RowBox@
Map@ButtonBox@#,
ButtonFunction ƒ newPress@#D,
ButtonEvaluator fi Automatic,
Background fi RGBColor@1, 1, 1DD &,
buttonNamesD
DD, Active fi True, TextAlignment fi Center,
FontColor fi RGBColor@0, .1, 0D,
FontFamily fi "Courier", FontSize fi 20, FontWeight fi "Bold",
CellTags fi "newButtons"D;
RGBPlaces = Position@newInterface, RGBColor@__DD;
colourButtons@D :=
Do@newInterface =
ReplacePart@newInterface,
If@state === devicePstateNames ’ state, iT,
[email protected], 0.3, 0.3D,
RGBColor@1, .2, .1D
D,
RGBPlacesPiTD, 8i, numberOfButtons<D;
colourButtons@D;
The new buttons use a new press function (otherwise they'd control the user interface simulation shown
earlier in this paper!). The code is much as before, except that a loop assigns colours to each button: red for
buttons that change state, and light gray if they do not change state.
newPress@theButton_D :=
Module@8nb = ButtonNotebook@D, s2<,
s2 = devicePstateNames ’ state, buttonNames ’ theButtonT;
If@s2 „ state,
state = s2;
NotebookFind@nb, "newButtons", All, CellTagsD;
colourButtons@D;
NotebookWrite@nb, newInterfaceD;
NotebookFind@nb, "newDisplay", All, CellTagsD;
SelectionMove@nb, All, CellContentsD;
NotebookWrite@nb, Cell@ToString stateD
D
D
D
It is possible that the user interface simulation described above has been used (which can only happen if this
paper is run in a Mathematica session, rather than just being read on paper), so at this point we don't know
what the actual state of the device should be, and so we don't know what colour the buttons should be. The
Specification-led design
1
easiest thing is to press any button manually, so the code will update the state and set the button colours
correctly.
CellPrint@newInterfaceD;
@ClockD @Quick defrostD
@TimeD @ClearD @PowerD
Quick defrost
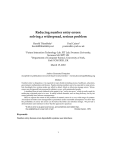
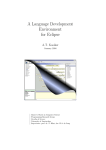
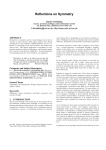
We hope that the highlighting of a button affects whether a button is pressed; a button should be pressed
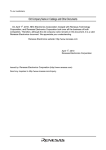
only if it is highlighted. Here's how the new design affects the cost/knowledge graph; the new user interface
costs are shown by the red line — it's almost twice as good for someone who does not know how to use the
microwave cooker:
Plot@8meanFirstPassage@Hx 100L * designer + H1 - x 100L litButton,
start, goalD, meanFirstPassage@
Hx 100L * designer + H1 - x 100L gnome, start, goalD<,
8x, 0, 100<, AxesLabel fi 8"Knowledge %", "Cost"<,
PlotStyle fi 8RGBColor@1, 0, 0D, RGBColor@0, 0, 0D<D;
Cost
120
100
80
60
40
20
20
40
60
80
100
Knowledge %
More generally, changing the physical design of the user interface will affect how likely a button is pressed.
For example, if a button is made bigger and has a more attractive appearance it would be used more. The
question is, how would this affect the user's ability to perform tasks? To help answer this design question, we
can use the mean first passage function to work out the expected time of performing a task as a function of
the proportion of time a button is used.
As an example, we construct two matrices: nonTime (which represents a user who never presses the time
button) and onlyTime (which represents a user who only presses the time button).
16
Specification-led desi
onlyTime = nonTime = Table@0, 8numberOfStates<, 8numberOfStates<D;
Do@If@buttonNamesPbT =!= timeButton,
nonTimePi, stateNames ’ devicePi, bTT +=
1 HnumberOfButtons - 1LD,
8b, numberOfButtons<, 8i, numberOfStates<D;
Do@If@buttonNamesPbT == timeButton,
onlyTimePi, stateNames ’ devicePi, bTT += 1D,
8b, numberOfButtons<, 8i, numberOfStates<D;
The nonTime matrix has zeros where a state transition can only happen by pressing the time button,
whereas the onlyTime matrix has ones where the time button works. Where the onlyTime matrix is 1, the
nonTime matrix must be zero. Printing the two matrices (below) makes things clearer!
Print@N nonTime
"
", onlyTime
0.75
i
j
j
j
j
j 0.5
j
j
j
j
0.5
j
j
j
j
j
0.5
j
j
j
j
j 0.5
j
j
j
k 0.5
0.25
0.5
0.25
0.25
0.25
0.25
0.
0.
0.
0.
0.
0.
0.
0.
0.
0.
0.
0.
TraditionalForm,
TraditionalFormD
0.
0.
0.25
0.
0.25
0.
0. y
z
z
0. z
z
z
z
z
z
0. z
z
z
z
z
0.25 z
z
z
z
z
0. z
z
z
z
0.25 {
0
i
j
j
j
j
j0
j
j
j
j
0
j
j
j
j
j
0
j
j
j
j
j0
j
j
j
k0
0
0
0
0
0
0
1
1
0
1
0
1
0
0
1
0
1
0
0
0
0
0
0
0
0y
z
z
0z
z
z
z
z
z
0z
z
z
z
z
0z
z
z
z
z
0z
z
z
z
0{
We can then plot the performance of a user whose behaviour is represented by a linear combination of these
two matrices.
Plot@meanFirstPassage@H1 - k 100L nonTime + k onlyTime 100, start,
goalD , 8 k, .1, 99.9<, AxesLabel fi 8"Knowledge %", "Cost"<D;
Cost
8000
6000
4000
2000
20
40
60
80
100
Knowledge %
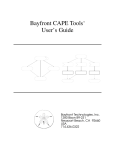
We will skip the details, but by plotting the graph on a decreasing interval, we can find a narrower range of k
that gives the best user performance:
Specification-led design
1
Plot@meanFirstPassage@H1 - k 100L nonTime + k onlyTime 100, start,
goalD , 8 k, 59.2, 59.5<, AxesLabel fi 8"Knowledge %", "Cost"<D;
Cost
59.2559.359.3559.459.4559.5Knowledge %
39.9919
39.9918
39.9917
39.9916
39.9915
This is saying that, for the given task and other things being equal, making the time button be used 60% of
the time (three times more likely than a 'fair' use of 20%) will make the device easier to use. In actual design,
we should consider all possible tasks the device is intended to support, and we should attach weights to each
task (e.g., quick defrost is less important, or done less often, than cooking at power level 1); then, we could
calculate the optimal 'size' (relative frequency of use) for each button.
Automatic (and hence correct) help
There is a legal requirement that descriptions of products correspond with the products themselves: under
the Sale of Goods Act 1979 (as amended by the Sale and Supply of Goods Act 1994 and the Sale of Goods
(Amendment) Act 1994) products should be 'fit for purpose' and should correspond with the description of
them. Thus it is the (UK) law that user manuals are correct — or, if we take a weaker view, that the
manufacturer at least knows what the correct description is, so that some appropriate description, but truthful,
can be written for the user.
Although our device definition is very basic, it can be used to generate quite useful help for the user or for
technical authors. We now define a function help that explains the shortest path (the least number of button
presses) to get from any state to any state. The definitions given below can be adapted straight-forwardly to
provide clearer help if 'buttons' aren't actually pressed (maybe they are knobs that have to be twisted).
18
Specification-led desi
whichButton@s_, f_D :=
Do@
If@devicePs, iT === stateNamesPfT,
Print@"
Press ", buttonNamesPiTD
D,
8i, Length buttonNames<
D;
help@s_, s_D :=
Print@"Nothing to do."D;
help@s_, f_D :=
Module@
8p = ShortestPath@FromAdjacencyMatrix@
MakeUnits@gnomeD, Type fi DirectedD, s, fD<,
Do@whichButton@pPiT, pPi + 1TD, 8i, Length p - 1<
D
D
The device might have an interactive feature, so pressing a button gives help, perhaps showing it in a display
panel. If so, it might be defined partly as follows — making use of the current state:
help@doWhat_D := help@state, doWhatD
Users may wish to ask (and get answered!) questions such as, "I pressed something, but I expected such-andsuch; what should I have done?" Thimbleby & Addison (1996) discuss how to supply answers to such
"intelligent help" questions.
We can use the help function to generate an entire user manual. A short function tells us how to get from
one state to another:
explain@i_, j_D := 8
Print@"To get from the device ", stateNamesPiT, " to ",
stateNamesPjT, ":"D;
help@i, jD;
<
And here is a small part of the manual:
explain@start, goalD;
To get from the device Power 1 to Power 2:
Press @TimeD
Press @PowerD
Ideally one would write more sophisticated routines to generate better natural language, rather than the
simplistic ones demonstrated here. In particular, straight-forward parametrisation of the routines would
allow equivalent manuals to be generated in any appropriate language.
Specification-led design
1
If we developed a typographical style for user manuals, then all devices processed would be able to use that
style (compare this idea with the tabular typesetting of the device specification shown earlier). Also, one can
generate HTML manuals for the World Wide Web, and then the user can also follow hypertext links to help
understand the workings of the device.
The entire manual can be printed with the following Mathematica code:
Do@
If@i „ j,
explain@i, jD
D,
8i, numberOfStates<, 8j, numberOfStates<
D;
To get from the device Clock to Quick defrost:
Press @Quick defrostD
To get from the device Clock to Timer 1:
Press @TimeD
To get from the device Clock to Timer 2:
Press @TimeD
Press @TimeD
To get from the device Clock to Power 1:
Press @TimeD
Press @PowerD
To get from the device Clock to Power 2:
Press @TimeD
Press @TimeD
Press @PowerD
To get from the device Quick defrost to Clock:
Press @ClockD
Press @ClearD
To get from the device Quick defrost to Timer 1:
Press @TimeD
To get from the device Quick defrost to Timer 2:
Press @TimeD
Press @TimeD
To get from the device Quick defrost to Power 1:
20
Specification-led desi
Press @TimeD
Press @PowerD
To get from the device Quick defrost to Power 2:
Press @TimeD
Press @TimeD
Press @PowerD
To get from the device Timer 1 to Clock:
Press @ClockD
Press @ClearD
To get from the device Timer 1 to Quick defrost:
Press @Quick defrostD
To get from the device Timer 1 to Timer 2:
Press @TimeD
To get from the device Timer 1 to Power 1:
Press @PowerD
To get from the device Timer 1 to Power 2:
Press @TimeD
Press @PowerD
To get from the device Timer 2 to Clock:
Press @ClockD
Press @ClearD
To get from the device Timer 2 to Quick defrost:
Press @Quick defrostD
To get from the device Timer 2 to Timer 1:
Press @TimeD
To get from the device Timer 2 to Power 1:
Press @TimeD
Press @PowerD
To get from the device Timer 2 to Power 2:
Press @PowerD
To get from the device Power 1 to Clock:
Press @ClockD
Specification-led design
2
Press @ClearD
To get from the device Power 1 to Quick defrost:
Press @Quick defrostD
To get from the device Power 1 to Timer 1:
Press @ClockD
Press @ClearD
Press @TimeD
To get from the device Power 1 to Timer 2:
Press @TimeD
To get from the device Power 1 to Power 2:
Press @TimeD
Press @PowerD
To get from the device Power 2 to Clock:
Press @ClockD
Press @ClearD
To get from the device Power 2 to Quick defrost:
Press @Quick defrostD
To get from the device Power 2 to Timer 1:
Press @TimeD
To get from the device Power 2 to Timer 2:
Press @TimeD
Press @TimeD
To get from the device Power 2 to Power 1:
Press @TimeD
Press @PowerD
This doesn't provide a particularly easy read (certainly not all of it!), but it is a complete and correct manual
that a technical author could work from. However, for many devices, including this microwave cooker, a
user's tasks won't be so-much to get from a known state to another state, but simply to get to the desired
state, regardless of the initial state. We will now generate a manual for this sort of use.
To represent a device in an unknown state, we represent its possible states as a set, and we define a function
to find out what set of states the device will be in after a given sequence of button presses:
22
Specification-led desi
StateSet@initialStates_, presses_D :=
If@presses == 8<, initialStates,
StateSet@Union@Map@stateNames ’ deviceP#, First@pressesDT &,
initialStatesDD, Rest@pressesDDD
A breadth-first search can then be used to look for unique states:
NewManual@explain_D :=
Module@8allStates = Range@numberOfStatesD, goals, queue<,
goals = allStates;
Search@seq_D :=
Do@Module@8p = Append@seq, bD, g<,
g = StateSet@allStates, pD;
If@Length@gD == 1 && MemberQ@goals, gP1TD,
explain@gP1T, pD;
goals = DeleteCases@goals, gP1TDD;
AppendTo@queue, pDD,
8b, numberOfButtons<D;
Search@queue = 8<D;
While@goals != 8<,
Search@First@queueDD;
queue = Rest@queueDD
D
Then, by defining some routines to explain things in (for instance!) English, we can print out the sequences of
button presses to get to each state. We now have the user manual that tells a user how to do anything
regardless of what the device is doing to start with. Notice how short it is; perhaps because of its brevity, as
we shall soon see, we can get some interesting design insights straight from it.
Specification-led design
2
Print@"Whatever the device is doing, you can always get it to"D;
SayList@8s_<D := s <> ".";
SayList@8s_, t_<D := s <> ", then " <> SayList@8t<D;
SayList@8s_, t__<D := s <> ", " <> SayList@8t<D;
English@state_, actions_D := Print@" ", stateNamesPstateT,
" by pressing ", SayList@ToString
buttonNamesPactionsTDD;
NewManual@EnglishD
Whatever the device is doing, you can always get it to
Clock by pressing @ClockD.
Quick defrost by pressing @Quick defrostD.
Timer 1 by pressing @ClockD, then @TimeD.
Timer 2 by pressing @ClockD, @TimeD, then @TimeD.
Power 1 by pressing @ClockD, @TimeD, then @PowerD.
Power 2 by pressing @ClockD, @TimeD, @TimeD, then @PowerD.
Looking at these instructions, it looks like the clock button ought to have been called reset. If so, note that
you can still get to state quickDefrost by pressing reset (i.e., clock) first, then the quickDefrost
button. Also, we might think that if such a manual is 'good,' what would a device look like that this manual
was the complete explanation for? To find out, all we need to do is change the English routine to one that
goes back to the device specification and sees what parts of it are used, and which are not.
24
Specification-led desi
Module@8d = Replace@device, _ -> "X", 82<D<,
checkUsed@s_, actions_D :=
Module@8i, states = Range@numberOfStatesD<,
For@i = 1, 8s< „ states, states = StateSet@states, 8actionsPi ++T<D,
“ "L &, statesDDD;
Scan@HdP#, actionsPiTT = "“
NewManual@checkUsedD;
“ L in the manual",
neatTable@"Actions used H“
d, stateNames, buttonNamesD
D
— Buttons —
States
@ClockD @Quick defrostD @TimeD @ClearD @PowerD
Clock
“
“
“
X
X
Quick defrost
“
“
X
X
X
Timer 1
“
“
“
X
“
Timer 2
“
“
X
X
“
Power 1
“
“
X
X
X
Power 2
“
“
X
X
X
Actions used H“Lin the manual
We can look closely at the non-blank entries in this table: these are the parts of the specification that the user
manual did not require. Amongst other comments: the clear button doesn't seem to be helping much!
(Probably Sharp's specification does not say what clear really does: it probably clears a numerical timer
setting that he wasn't interested in.) Nevertheless, our generating a manual and then automatically going
back to the specification has exposed some potential bad design. If this sort of manual is a good idea, then the
clear button as presently defined is a design feature that needs better justification.
Many other sorts of manuals can be generated too, and by creating them using Mathematica or some other
such system systematically we can guarantee their correctness. We can also use the technique of going back
from a good manual to reappraise the specification. After all, if we have a good user manual, then the bits in
the specification that aren't apparently needed are immediately suspicious features!
Elsewhere we discuss how the technical author's editing (starting from a correct manual) can be effectively
managed, even as the device specification changes (Thimbleby & Ladkin, 1995). It is possible (but requires
rather a lot of technical detail beyond the scope of this paper) to do something similar in Mathematica: the
output of the manual generation can be written to a notebook, where the technical author can freely edit it (as
a normal Mathematica document) and so make the user manual as readable as desired.
Mathematica allows 'cells' (i.e., manual paragraphs) to be tagged; using the tags, each paragraph can be
uniquely identified, even though the technical author has edited them. Now, if the device specification
changes, the notebook can be re-read, and a report automatically made of any cells whose original generated
text has changed (or is new or has been deleted). This report can be automatically interleaved back into the
manual, so that the technical author could more easily associate the comments with the affected parts of the
manual.
Specification-led design
2
The technical author can also point out peculiar features, or ones that are hard to explain: Mathematica could
then track these suitably-flagged comments back to the offending parts of the specification, much like we did
above (for instance, the technical author's comments would end up in the specification table, instead of the '—
' dashes).
Conclusions
The development method described in this paper is very powerful, and with a system such as Mathematica it
is also very easy to do. With Mathematica or with bespoke design packages, all the code could be concealed
from designers: this paper — because it is explicit — gives an unnecessarily technical feel to the approach.
The method is not limited to finite state machines (as might be supposed); Thimbleby & Ladkin (1997) discuss
generating user manuals for quite complex systems, such as parts of the A320 fly-by-wire airplane, where we
use a logic-based approach.
The Mathematica code shown in this paper will work with other devices, by making only the appropriate
changes to the device specification. This paper, then, is itself a complete gadget-design package — everything
discussed in this paper is explicitly and fully defined — and one is surprised that more devices are not
designed in this way, rather than by using superficial tools that emphasise looks against specification.
Mathematica could be accused of being esoteric (it does have complexities this paper avoided); our further
work is using Java to allow the user interface of the development environment to be put on the World Wide
Web, and for designers anywhere in the world to write Java applets that can be analysed and simulated on
the site. With world-wide use of simulations, one would be able to obtain global empirical statistics of device
use. We also hope to promote good practice in user interface design.
References
P. Cairns, M. Jones & H. W. Thimbleby, 1998, "Reusable Usability Analysis with Markov Models," working
paper (available from the authors).
J. Sharp, 1998, Interaction Design for Electronic Products using Virtual Simulations, PhD thesis, Brunel University.
N. Stanton, ed., 1998, Human Factors in Consumer Products, Taylor & Francis.
H. W. Thimbleby & M. A. Addison, 1994, "Manuals as Structured Programs," in G. Cockton, S. W. Draper and
G. R. S. Weir eds., BCS Conference HCI'94, People and Computers, IX, pp67–79, Cambridge University Press.
H. W. Thimbleby & M. A. Addison, 1996, "Intelligent Adaptive Assistance and Its Automatic Generation,"
Interacting with Computers, 8(1), pp51–68.
H. W. Thimbleby & P. B. Ladkin, 1995, "A Proper Explanation When You Need One," in M. A. R. Kirby, A. J.
Dix & J. E. Finlay eds., BCS Conference HCI'95, People and Computers, X, pp107–118, Cambridge University
Press.
H. W. Thimbleby & P. B. Ladkin, 1997, "From Logic to Manuals Again," IEE Proceedings Software Engineering,
144(3), pp185–192.
H. W. Thimbleby & I. H. Witten, 1993, "User Modelling as Machine Identification: New Design Methods for
HCI," in D. Hix & R. Hartson eds., Advances in Human Computer Interaction, IV, pp58–86, Ablex.
H. W. Thimbleby, 1994, "Formulating Usability," ACM SIGCHI Bulletin, 26(2), pp59–64.
26
Specification-led desi
H. W. Thimbleby, 1997, "Design for a Fax," Personal Technologies, 1(2), pp101–117.
S. Wolfram, 1996, The Mathematica Book, 3rd. ed., Addison-Wesley.
Specification-led design
2