1
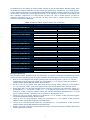
Table 23: Shigella Site-to-Site Quantitative Reproducibility across sites, days, runs and within run
Within Run Between Run Between Day
Within Day Within Day
Within Site Between Site
Variable
Ct. Score
Category N Mean SD %CV
SD
%CV
SD
%CV
SD
%CV
Total
SD %CV
HN
53 34.8
0.99 2.8% 0.57
1.6%
0.52
1.5%
0.29
0.8% 1.29 3.7%
LP
88 33.1
0.79 2.4% 0.35
1.1%
0.23
0.7%
0.47
1.4% 1.01 3.1%
MP
90 32.5
0.80 2.5% 0.39
1.2%
0.00
0.0%
0.50
1.5% 1.03 3.2%
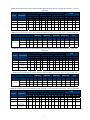
Table 24: Shiga toxin Site-to-Site Qualitative Reproducibility across sites with pooled days, runs and replicates
SITE
2
Category Concentration
3
Total
5
Correct
Incorrect Correct. Incorrect
Correct
Incorrect
N
N
%
N
N
%
N
N
%
N
%
N
%
30 100.0 0
0
30 100.0 0
0
30 100.0 0
0
90
100.0
0
0
16 53.3 14 46.7 15 50.0 15 50.0 14 46.7 16 53.3
45
50.0
45
50.0
0
90
100.0
0
0
3.3
89
98.9
1
1.1
%
%
%
TN
Blank
HN
100 CFU/mL
LP
≥1 and <2
x LoD
30 100.0 0
0
30 100.0 0
0
30 100.0 0
MP
≥2 and ≤5
x LoD
30 100.0 0
0
30 100.0 0
0
29 96.7
1
Correct
Incorrect
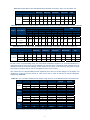
Table 25: Shiga toxin Site-to-Site Quantitative Reproducibility across sites, days, runs and within run
Within Run
Within Day
Variable
Between Run
Within Day
Between Day
Within Site
Between Site
Total
Category
N
Mean
SD
%CV
SD
%CV
SD
%CV
SD
%CV
SD
%CV
HN
45
35.9
1.78
5.0%
0.00
0.0%
0.00
0.0%
1.03
2.9%
2.06
5.7%
Ct. Score LP
90
31.8
0.65
2.0%
0.00
0.0%
0.00
0.0%
0.36
1.1%
0.74
2.3%
MP
89
31.3
0.62
2.0%
0.22
0.7%
0.07
0.2%
0.24
0.8%
0.70
2.2%
For the Lot-to-Lot reproducibility study, two users each completed a single run of 12 panel members on a
single instrument for each of two lots of reagents over a 5-day period. The panels used were the same as
described under the Precision heading, above. Results from 5 days of the accuracy and precision study
were used to comprise data for one lot of reagents for the Lot-to-Lot study.
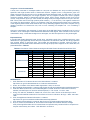
The overall Lot-to-Lot reproducibility percent agreement was 100% for the TN category for all targets, and
ranged from 13.33% to 62.22%, 95.56% to 100% and 97.78% to 100% for the HN, LP and MP categories,
respectively (Table 26).
Table 26: Lot-to-Lot Reproducibility Study Results using three lots of the BD MAX Enteric Bacterial Panel
Target
STEC
Campy
Shig
Sal
Level
Correct
Total
% Correct
TN*
HN*
LP
MP
TN
HN
LP
MP
TN
HN
LP
MP
TN
HN
LP
MP
90
27
89
90
90
56
90
88
90
15
86
89
90
12
89
90
90
90
90
90
90
90
90
90
90
90
90
90
90
90
90
90
100.00%
30.00%
98.89%
100.00%
100.00%
62.22%
100.00%
97.78%
100.00%
16.67%
95.56%
98.89%
100.00%
13.33%
98.89%
100.00%
95% CI
LowerCI
UpperCI
95.91%
100.00%
21.51%
40.13%
93.97%
99.80%
95.91%
100.00%
95.91%
100.00%
51.90%
71.54%
95.91%
100.00%
92.26%
99.39%
95.91%
100.00%
10.37%
25.69%
89.12%
98.26%
93.97%
99.80%
95.91%
100.00%
7.79%
21.87%
93.97%
99.80%
95.91%
100.00%
* For the True Negative (TN) and High Negative (HN) categories, the expected assay result was deemed to be
negative. Therefore, percent agreement was calculated for negative results
21