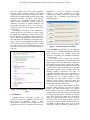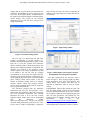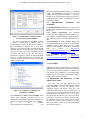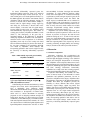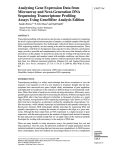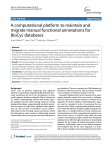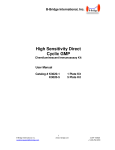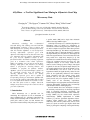
1
Proceedings of the 40th Hawaii International Conference on System Sciences - 2007
AffyMiner – a Tool for Significant Gene Mining in Affymetrix GeneChip
Microarray Data
Guoqing Lu1*, The Nguyen2, Yuannan Xia2, Zhaoyi Wang3, Mike Fromm2
1
Department of Biology, University of Nebraska at Omaha, Omaha, NE 68182
Center for Biotechnology, University of Nebraska - Lincoln, Lincoln, NE 68588
3
Cancer Center, Creighton University, 2500 California Plaza, Omaha, NE 68178
2
*[email protected] for GL
Abstract
Microarray
technology
has
revolutionized
molecular biology. The challenge associated with this
high-throughput technology is how to analyze and
make biological sense of a large amount of microarray
data. We introduce AffyMiner, a tool developed for
detecting differentially expressed genes from
Affymetrix GeneChip microarray data and connecting
gene annotation and gene ontology information with
the genes detected. AffyMiner consists of three
functional modules: GeneFinder for finding significant
genes in a treatment versus control experiment;
GOTree for mapping genes of interest onto the Gene
Ontology (GO) space; and interfaces for running
Cluster, a program for clustering analysis, and
GenMAPP, a program for pathway analysis.
AffyMiner effectively deals with multiple replicates in
the experiment, provides users the flexibility of
choosing different data metrics for finding
differentially expressed genes, and is capable of
incorporating various gene annotations. AffyMiner has
been used for the analysis of GeneChip data described
in several publications and has been found to reduce
the time and effort needed to compare data from
multiple arrays and to interpret the results in terms of
gene and cell functions.
1. Introduction
DNA microarrays are a powerful tool for
monitoring the expression of tens of thousands of
genes simultaneously [1]. Affymetrix GeneChips are
widely used microarrays with a collection of 11 - 20
probe pairs called a probe set that measures the
expression of each transcript. The probe pairs comprise
a perfect match (PM) and a single base mismatch
(MM) to the target mRNA region.
GeneChip microarrays use a statistical algorithm in
Microarray Suite 5.0 (MAS 5.0; Affymetrix) to
estimate the variance among probe pairs within a probe
set and to compute an expression index that represents
transcript abundance [2]. The MAS 5.0 algorithm uses
the One-Step Tukey’s Biweight Estimate to compute
the Signal intensity for each probe set, and employs the
Wilcoxon signed-rank test to assess the Detection calls
and p-values for a single array analysis [3, 4]. The
algorithm uses normalization and scaling techniques to
correct for variations between two arrays [5]. The
comparison analysis of two arrays results in data
matrices such as Change p-value, Change, and Signal
Log Ratio. In the case of replicate sample analysis, the
two sample statistical tests such as the Student t-test or
the Mann-Whitney test can be used to test the
hypothesis whether the signal intensity values for each
probe set are significantly different in the treatment
group compared with the control group. Such
statistical tests are not ideal for finding significant
genes, because only a few replicate samples (< 4) are
usually used in the microarray experiments.
Determining the most appropriate statistical method for
detecting differentially expressed genes in GeneChip
replicate data remains a challenging issue.
Several methods have been developed to improve
the sensitivity and selectivity for detecting significant
genes in GeneChip microarray experiments. The
widely used algorithms include the robust multiarray
average (RMA) [6], the model based expression
index/intensity (MBEI) implemented in dCHIP
software [7], and the positional dependent nearestneighbor model (PDNN) [8]. These algorithms
effectively deal with the ‘probe effect’, that is, some
probes in a probe set tend to give higher values than
others [2], through re-computing of the signal intensity
1530-1605/07 $20.00 © 2007 IEEE
1
Proceedings of the 40th Hawaii International Conference on System Sciences - 2007
for each probe set using the processed image data
exported from Affymetrix Microarray Suite or
GeneChip Operating Software (GCOS). These
methods rely solely on quantitative data, i.e., signal
intensity values for comparison analysis. Qualitative
data such as signal Detection are important parameters
in making decisions of which genes are significant. A
recent study showed that using the number of Present
calls as a threshold could ultimately eliminate
unreliable genes while preserving the most significant
genes in the result [9]. A joint use of qualitative data Change calls and quantitative data - fold change and
signal mean ratios also demonstrated false positives
were greatly reduced, whereas the use of a single
parameter has a false positive rate more than 30% [10].
Here we introduce a software tool called AffyMiner
that uses both quantitative and qualitative data metrics
for detecting differentially expressed genes in
GeneChip data. In addition, AffyMiner has functions
for associating gene annotation information and Gene
Ontology (GO) descriptions with significant genes
detected that provide better biological interpretations
of the results.
2. Software
2.1. Design
2.1.1. User requirements. The requirements
established from discussions with the users of our
Microarray Core Facility over the past three years
include:
x Making use of rich data metrics generated by the
Affymetrix system.
x Providing flexibility for the user to choose different
data metrics and different threshold values for
filtering for differentially expressed genes.
x Incorporating statistical analyses for the selection of
significant genes.
x Facilitating exploratory analyses such as clustering
analysis.
x Incorporating information from Gene Ontology and
metabolic pathways.
x Easy-to-use graphical interfaces.
2.1.2 Architecture. Based upon the user requirements
and our experience in using commercial and open
source microarray analysis programs such as
GeneSpring
(http://www.agilent.com/chem/genespring)
and
Bioconductor [11], we designed AffyMiner to include
three functional modules: GeneFinder, GOTree, and
interfaces to third-part programs (Figure 1). These
modules can analyze GeneChip data separately or
consecutively. For example, the gene list generated by
GeneFinder can be used by GOTree or Cluster for
further analysis. Two popular open source software
programs, Cluster and GenMAPP, were chosen for
clustering and pathway analyses, respectively.
Figure 1. The Architecture of AffyMiner.
2.2. Algorithms
2.2.1 GeneFinder. The algorithm implemented in
GeneFinder uses both qualitative and quantitative
measures of transcript performance, including
Detection, Change, Signal Log ratio, and the statistical
results. To determine significantly up-regulated genes
in an experiment with multiple replicates of treatment
and control samples, the following steps are used: 1)
eliminate the probe sets with signal Detection calls of
“Absent” in the treatment samples; 2) select the probe
sets with signal Change calls of “Increase”; 3)
eliminate the probe sets with Signal Log Ratios below
a threshold defined by the user; and 4) remove the
probe sets with change directions being “down” or pvalues above a threshold defined by the user (Figure
2).
The algorithm for detecting significantly downregulated genes is similar to the algorithm above but
with differences as described below: 1) eliminate the
probe sets with signal Detection calls of “Absent” in
the control samples instead of treatment samples; 2)
select the probe sets with signal Change calls of
“Decrease” rather than “Increase”; 3) eliminate the
probe sets with Signal Log Ratios above instead of
below a threshold; and 4) remove the probe sets with
change directions being “up” instead of “down.”
The algorithm for annotating genes is simple. Probe
set IDs appearing in both the gene annotation file and
the gene list are used to link gene annotation
information with quantitative and qualitative data of
significant genes.
2.2.2. GOTree. The Gene Ontology (GO) Consortium
produces structures of biological knowledge using a
controlled vocabulary consisting of GO terms [12]. GO
2
Proceedings of the 40th Hawaii International Conference on System Sciences - 2007
terms are organized into three general categories,
biological process, molecular function, and cellular
component. The terms within each category are linked
in defined parent-child relationships that reflect current
biological knowledge. All genes from different
organisms are systematically associated with GO
terms, and these associations continue to grow in
complexity and detail as sequence databases and
experimental knowledge grow [13]. GO provides a
useful tool to look for common features shared within
a list of genes.
The high-level description of the algorithm in
building the GO tree is as follows, 1) read the output
file generated by GeneFinder; 2) write in an array the
GO IDs and their corresponding Affymetix probe set
IDs; 3) find the GO Path IDs for each GO ID in the
array and add the GO Path IDs to each element in the
array; 4) sort by the GO Path IDs and compute the sum
of the probe sets associated with each node; 5) build
the entire tree based on the GO Path IDs and write in
each node the GO term, GO ID, and the number of
probe sets.
Figure 2. The algorithm for detecting up-regulated
genes
2.3. AffyMiner
AffyMiner includes GeneFinder, GOTree, and
interfaces to Cluster and GenMAPP as shown in the
main window of AffyMiner (Figure 3). Brief
descriptions of AffyMiner and its modules are also
available in this window. To illustrate the functions of
AffyMiner, we will use Affymetrix Drosophila
Genome 2.0 array data generated in the aging
experiment with caloric restricted Drosophila, kindly
provided by Dr. L. Harshman at the University of
Nebraska-Lincoln.
Figure 3. The main window of AffyMiner
2.3.1. GeneFinder. GeneFinder has two programs:
Significant Genes for finding differentially expressed
genes satisfying the user defined criteria and
Annotation for linking gene annotation information
with the gene list.
The Significant Genes program has interactive
interfaces to set up parameters, upload input files, and
define columns in the output table output, respectively.
The parameter-setting window contains three frames
for setting up the number of replicates, the direction of
a robust change, and the data metrics for detecting
differentially expressed genes. AffyMiner limits the
maximum number of replicates to five. This is a
reasonable assumption because the reproducibility of
Affymetrix GeneChip array data is high and most
publications use two to three replicates in their
experiments. The data metrics consist of Signal
Detection, Signal Change, Signal Log Ratio and
Statistical Test. The user can choose the data matrices
and threshold values for each analysis.
As shown in Figure 4, three treatment replicates
and three control replicates were used for example
analysis. The radio button Increase was checked,
which means the task was to find significantly upregulated genes. In the frame “Please select the criteria
for filtering significant genes”, checkboxes are used to
select which criteria are applied when filtering the
genes. The signal detection level was set 3, meaning
the Present calls in the signal detention value are
required to be present in all the 3 treatment replicates.
The number of signal Change calls was set 8, which
means that at least 8 Increases are required in the 9
3
Proceedings of the 40th Hawaii International Conference on System Sciences - 2007
Change calls for any given probe sets considered to be
significant. The threshold for average signal log ratio
was set 0.5, which requires about a 1.4-fold increase of
the signals in the treatment samples compared with the
control samples. The p-value for the statistical
significance was set 0.05. The above settings can be
changed dynamically.
probe set IDs. Once these two files are uploaded, the
columns in the output table can be chosen from the list
box interface.
Figure 5. Input setting window.
Figure 4. Parameter setting window
The next step is to upload input file and select
columns corresponding to specific samples (i.e.,
treatment and control) and data metrics (Figure 5). The
input file is a text file exported from Affymetrix
GCOS, containing results of single array analyses and
pairwise array comparison analyses. If Significant Test
checkbox was checked in the parameter setting
window (Figure 4), the results of statistical tests need
to be added to the text file with two columns
corresponding to the p-value and change direction,
respectively. The change direction is specified as “up”
for up-regulated genes and “down” for down-regulated
genes. Clicking “Back” button returns to the first
window if parameter settings need to be changed.
Clicking “Search” button starts analysis process.
Figure 6 shows significant genes found by Significant
Genes program in GeneFinder.
The Annotation program links the annotation
information with gene lists, and generates a userdefined table with quantitative data such as signal log
ratio and annotation information. The NetAffx
annotation file needs to be in the CSV (Comma
Separated Value) format, which can be downloaded
from
the
Affymetrix
website
(http://www.affymetrix.com/). The gene list input file
can be the result generated by Significant Genes or any
text file with a column corresponding to Affymetrix
Figure 6. Differentially expressed genes found by
the Significant Genes program in AffyMiner
The table resulting from the Annotation step is
shown in Figure 7, where Average Signal Log Ratio,
Target Description, Gene Title, Gene Ontology, and
Protein family were selected. This table can be
included in publications with no need for further
editing.
2.3.2. GOTree. GOTree takes as input two files. The
first file called GOPath consists of the information
about the hierarchical structure of GO terms, whereas
the second file contains the list of significant genes and
their GO term associations. The GOPath file was
generated from the ChipInfo program, which can be
downloaded
from
the
web.
(http://www.biostat.harvard.edu/complab/chipinfo/)
[14]. To run ChipInfo, the gene information file
downloaded from the Affymetrix website is required.
4
Proceedings of the 40th Hawaii International Conference on System Sciences - 2007
http://www.genmapp.org/download.asp to download
Cluster and GenMAPP, respectively. In the main
window, clicking the button “Set Path ...” will set up
the path to the corresponding program file (Figure 3).
Clicking the button Cluster or GenMAPP will run the
program for analysis.
2.4.
Implementation,
Availability
Figure 7. Annotation table resulting from the
Annotation program in AffyMiner
The GO tree generated from AffyMiner is shown
in Figure 8. Each node is labeled with the
corresponding GO term, GO ID, and the number of
genes associated. For example, line 3 of the Gene
Ontology tree as shown in Figure 8 indicates the node
represents behavior in biological process with GO ID
7610 and 2 probe sets on the significant gene list
associated with this GO term. The tree can be
expanded or clipped by clicking on the small square
boxes. A window displaying the Affymetrix IDs
associated with the GO term will pop up when the
number is right clicked.
Installation,
and
2.4.1. Implementation. AffyMiner was developed in
the Microsoft .Net platform and programmed in Visual
Basic .Net.
2.4.2. System requirements. The minimum
requirements to run AffyMiner include a Pentium 3 or
later computer, 512 MB of Memory, Windows 2000 or
later operating system, and .NET Framework 2.0 or
later.
2.4.3. Installation. To install AffyMiner, double click
on AffyMinerInstaller.msi and follow the instructions.
AffyMiner requires .NET Framework 2.0 or later
installed on the computer, which can be downloaded
from
our
website
at
http://bioinfosrv1.awh.unomaha.edu/affyminer/. Or Microsoft web
site at http://msdn.microsoft.com/netframework/.
2.4.4. Availability. AffyMiner is available for
download
at
http://bioinfosrv1.awh.unomaha.edu/affyminer/. The user manual
can be found from our website as well.
3. Case studies
AffyMiner has been tested by multiple users and their
feedback has been incorporated into its current features
[15, 16]. In the following example, we describe two
case studies using AffyMiner to find differentially
expressed genes, one related to nutritional genomics
and the other to cancer informatics.
3.1. Inflammation and delipidation of white
adipose tissue in mice
Figure 8. An example Gene Ontology tree
generated by AffyMiner
2.3.3. Interfaces to Cluster and GenMAPP. Both
Cluster and GenMAPP programs need to be
downloaded and installed on the local computer (see
below for the system requirements of the computer).
Go
to
the
websites,
http://rana.lbl.gov/EisenSoftware.htm
and
Our group (YX and MF) studied the gene
expression changes in the retroperitoneal white adipose
tissue (RP-WAT) in mice fed trans-10, cis-12
conjugated linoleic acid (t10c12 CLA) [17]. The
Affymetrix Mouse Genome 430 2.0 microarrays were
used to detect the expression changes of about 34,000
transcripts. Mice were sampled 1, 2, 3, 4, 7, 10, or 17
days after being fed control or 0.5% t10c12 CLA diets,
generating 7 time points in total. At each time point,
the RP-WAT tissues of ten control and ten t10c12
CLA-fed mice were harvested in groups of five mice
each to provide two control and two treatment samples
for microarray analysis.
5
Proceedings of the 40th Hawaii International Conference on System Sciences - 2007
To detect differentially expressed genes the
transformed RMA expression values were analyzed
using an empirical Bayes Linear model [18, 19]. A
total of 5408 genes were found significant on Day 1 by
the RMA approach. We used the same dataset and ran
AffyMiner with the following parameter settings: for
increase, 2 Present calls in the treatment samples, 3
Increase calls for signal change, average signal log
ratio being 0.5; for decrease, 2 Present calls in the
control samples, 3 Decrease calls for signal change,
average signal log ratio being -0.5. AffyMiner found
4089 differentially expressed genes. The number of
overlap genes found by AffyMiner and RMA is 2946
(Table 1). The discrepancy of the gene lists is
contributed mainly to the differences of algorithms
underlying AffyMiner and RMA. This observation is
consistent with a recent comparison of six different
algorithms, where only 27 to 36% overlap were found
between different methods [20]. On the other hand, all
the ten genes validated by the quantitative RT-PCR
were found by AffyMiner, which indicates that
incorporating qualitative data metrics might increase
the selectivity of detecting differentially expressed
genes.
Į66 and hER-ȕ. To further investigate the molecular
mechanisms by which hER-Į36 functions during
breast cancer development, we conducted microarray
experiments to profile estrogen responsive genes in the
ER-positive human breast cancer line MCF7 that
highly express recombinant hER-D36 as contrasted to
the parent MCF7 cells in the absence or presence of
estrogen. Affymetrix Human GeneChip Genome U133
Plus 2.0 Array was used, which contains over 47,000
transcripts. Experimental settings follow standard
procedures as described previously [17].
AffyMiner was used to identify significant genes
with different expression patterns in these cells in the
absence or presence of estrogen. We used the same
parameter settings as in 3.1. A total of 2162 and 1507
genes were found differentially expressed in 12 hour
estrogen treatment for the parental MCF7 cells and
hER-D36 expressing MCF7 cells, respectively. We are
currently performing in-depth pathway and ontology
analysis, and the results will be presented elsewhere.
Table 1. Differentially expressed genes found by
AffyMiner and RMA
Microarray technology has revolutionized the
analysis of gene expression. The challenge associated
with this high throughput technology is the statistical
analysis and biological interpretation of microarray
data. AffyMiner was developed to address these issues
through finding genes with significant changes in gene
expression, and linking these genes with the annotation
and Gene Ontology information. Functionally,
AffyMiner has overlap with other existing programs,
but has the distinguishing features discussed below.
Affymetrix Data Mining Tool (DMT) can filter
genes of interest based on the thresholds of certain
quantitative and qualitative parameters, but not as
powerful as AffyMiner in this aspect. AffyMiner takes
full advantage of the range of the different data metrics
available from MAS 5.0. AffyMiner provides the
flexibility to choose different data metrics (Signal
Detection, Signal Change, Signal Log Ratio, and
Statistic Test) and to set threshold values for analyzing
differentially expressed genes. This flexibility is very
important since no one single method outperforms
others for microarray data analysis [20, 22]. This is
apparent from the differences in the gene lists found by
the AffyMiner and RMA based methods in the case
study. Incorporating qualitative data metrics such as
Detection and Signal Change would increase the
selectivity of detecting differentially expressed genes
[20].
Genes
Approach
Up-regulated
Down-regulated
AffyMiner
1927
2162
RMA / Bayesian
approach
2530
2877
Common in both
1432
1514
3.2. A novel isoform of estrogen receptor-D
(ER-Į36) and breast cancer
Understanding the molecular mechanisms by which
estrogens drive breast cancer development has long
been a challenging issue. Numerous studies
demonstrate that the human estrogen receptor-Į (hERĮ66) contributes to development of human breast
cancer and is a critical determinant in assessing
prognosis as well as designing treatment strategies of
breast cancer. Recently, we discovered a novel variant
of hER-Į66, termed hER-Į36[21]. The hER-Į36 lacks
both transcriptional transactivation domains, AF-1 and
AF-2 but functions to inhibit the ligand-dependent and
ligand-independent transactivation activities of hER-
4. Discussion
4.1. Software comparison
6
Proceedings of the 40th Hawaii International Conference on System Sciences - 2007
GenePicker [10] has certain functions similar to
those in AffyMiner. GenePicker was developed for the
analysis of replicates of Affymetrix gene expression
microarrays. The GenePicker analysis is done through
defining analysis schemes, data normalization, ttest/ANOVA, and Change-fold Chang-analysis, and
the use of Change Call, Fold Change, and Signal mean
ratios. GenePicker provides a comparison of noise and
signal analysis scheme for determining a signal-tonoise in a given experiment, which is not available in
GeneFinder. However, GeneFinder uses one more data
matrix, i.e., Detection. As mentioned earlier,
GeneFinder also has the function of incorporating gene
annotation information with expression data, which is
not available in GenePicker.
The Affymetrix NetAffx Gene Ontology Mining
Tool can create a graph of GO terms associated with
the input probe sets. However, the graph is very
difficult to read as compared with the one generated by
AffyMiner (Figure 7). AffyMiner has the flexibility of
displaying the GO tree at different levels and the probe
sets associated with the GO terms can be viewed
easily. Another GO tool called GoSurfer was
developed for the GO analysis of Affymetrix
GeneChip data [7, 13, 14]. GoSurfer associates user
input gene lists with GO terms and visualizes such GO
terms as a hierarchical tree. GoSurfer compares two
lists of genes in order to find which GO terms are
enriched in one list of genes but relatively depleted in
another. GoSurfer can not map genes from a single list
onto the GO descriptions. In this regard, GOTree and
GoSurfer complement each other in the analysis of
Gene Ontology.
of incorporating various gene annotations. AffyMiner
has been used for analyzing the GeneChip data for
several publications, which has facilitated comparing
data from multiple arrays and interpreting the possible
biological implications associated with significant
changes in a gene’s expression.
6. Acknowledgements
This publication was made possible by NSF Grant
Number EPS-0346476 from the NSF EPSCoR
program and by NIH Grant Number P20 RR16469
from the INBRE Program of the National Center for
Research Resources. GL acknowledges the Pre-tenure
Award from University of Nebraska at Omaha. The
authors are grateful to a number of users for providing
feedbacks on AffyMiner.
4.2. Limitations
AffyMiner is a Windows application. It runs only
on computers using Microsoft Windows 2000 or
above. In addition, AffyMiner relies on the Affymetrix
MAS 5.0 algorithm for the low-level analysis in the
single array analysis and pairwise comparisons, and
NetAffx for gene annotation information. We
recommend the user check the NetAffx website
frequently and use the latest annotation file for
analysis.
5. Conclusions
As a whole, AffyMiner fills an important gap in
finding differentially expressed genes from Affymetrix
GeneChip microarray data. AffyMiner effectively
deals with multiple replicates in the experiment,
provides users flexibility choosing different data
metrics for detecting significant genes, and is capable
7
Proceedings of the 40th Hawaii International Conference on System Sciences - 2007
7. References
[1]
[2]
[3]
[4]
[5]
[6]
[7]
[8]
[9]
[10]
[11]
D. J. Lockhart, H. Dong, M. C. Byrne, M. T.
Follettie, M. V. Gallo, M. S. Chee, M.
Mittmann, C. Wang, M. Kobayashi, H.
Horton, and E. L. Brown, "Expression
monitoring by hybridization to high-density
oligonucleotide arrays," Nat Biotechnol, vol.
14, pp. 1675-80, 1996.
J. D. Clarke and T. Zhu, "Microarray analysis
of the transcriptome as a stepping stone
towards understanding biological systems:
practical considerations and perspectives,"
Plant J., vol. 45, pp. 630-50, 2006.
E. Hubbell, W. M. Liu, and R. Mei, "Robust
estimators for expression analysis,"
Bioinformatics, vol. 18, pp. 1585-92, 2002.
W. M. Liu, R. Mei, X. Di, T. B. Ryder, E.
Hubbell, S. Dee, T. A. Webster, C. A.
Harrington, M. H. Ho, J. Baid, and S. P.
Smeekens, "Analysis of high density
expression microarrays with signed-rank call
algorithms," Bioinformatics, vol. 18, pp.
1593-9, 2002.
Affymetrix, "GeneChip expression analysis data analysis fundamentals," 2006.
R. A. Irizarry, B. M. Bolstad, F. Collin, L. M.
Cope, B. Hobbs, and T. P. Speed,
"Summaries of Affymetrix GeneChip probe
level data," Nucleic Acids Res, vol. 31, pp.
e15, 2003.
C. Li and W. H. Wong, "Model-based
analysis of oligonucleotide arrays: expression
index computation and outlier detection,"
Proc Natl Acad Sci U S A, vol. 98, pp. 31-6,
2001.
L. Zhang, M. F. Miles, and K. D. Aldape, "A
model of molecular interactions on short
oligonucleotide microarrays," Nat Biotechnol,
vol. 21, pp. 818-21, 2003.
J. N. McClintick and H. J. Edenberg, "Effects
of filtering by Present call on analysis of
microarray experiments," BMC
Bioinformatics, vol. 7, pp. 49, 2006.
G. Finocchiaro, P. Parise, S. P. Minardi, M.
Alcalay, and H. Muller, "GenePicker:
replicate analysis of Affymetrix gene
expression microarrays," Bioinformatics, vol.
20, pp. 3670-2, 2004.
S. Dudoit, R. C. Gentleman, and J.
Quackenbush, "Open source software for the
analysis of microarray data," Biotechniques,
vol. Suppl, pp. 45-51, 2003.
[12]
[13]
[14]
[15]
[16]
[17]
M. A. Harris, J. Clark, A. Ireland, J. Lomax,
M. Ashburner, R. Foulger, K. Eilbeck, S.
Lewis, B. Marshall, C. Mungall, J. Richter, G.
M. Rubin, J. A. Blake, C. Bult, M. Dolan, H.
Drabkin, J. T. Eppig, D. P. Hill, L. Ni, M.
Ringwald, R. Balakrishnan, J. M. Cherry, K.
R. Christie, M. C. Costanzo, S. S. Dwight, S.
Engel, D. G. Fisk, J. E. Hirschman, E. L.
Hong, R. S. Nash, A. Sethuraman, C. L.
Theesfeld, D. Botstein, K. Dolinski, B.
Feierbach, T. Berardini, S. Mundodi, S. Y.
Rhee, R. Apweiler, D. Barrell, E. Camon, E.
Dimmer, V. Lee, R. Chisholm, P. Gaudet, W.
Kibbe, R. Kishore, E. M. Schwarz, P.
Sternberg, M. Gwinn, L. Hannick, J.
Wortman, M. Berriman, V. Wood, N. de la
Cruz, P. Tonellato, P. Jaiswal, T. Seigfried,
and R. White, "The Gene Ontology (GO)
database and informatics resource," Nucleic
Acids Res, vol. 32 Database issue, pp. D25861, 2004.
S. Zhong, L. Tian, C. Li, F. Storch, and W.
Wong, "Comparative Analysis of Gene Sets
in the Gene Ontology Space under the
Multiple Hypothesis Testing Framework,"
Proc. IEEE Comp Systems Bioinformatics,
vol. 2004, pp. 425-435, 2004.
S. Zhong, C. Li, and W. H. Wong, "ChipInfo:
Software for extracting gene annotation and
gene ontology information for microarray
analysis," Nucleic Acids Res, vol. 31, pp.
3483-6, 2003.
R. Alvarez-Venegas, M. Sadder, A. Hlavacka,
F. Baluska, Y. Xia, G. Lu, A. Firsov, G.
Sarath, H. Moriyama, J. G. Dubrovsky, and Z.
Avramova, "The Arabidopsis homolog of
trithorax, ATX1, binds phosphatidylinositol
5-phosphate, and the two regulate a common
set of target genes," Proc Natl Acad Sci U S
A, vol. 103, pp. 6049-54, 2006.
R. Alvarez-Venegas, Y. Xia, G. Lu, and Z.
Avramova, "Phosphoinositide 5-Phosphate
and Phosphoinositide 4-Phosphate Trigger
Distinct Specific Responses of Arabidopsis
Genes; Genome-Wide Expression Analyses,"
Plant Signaling & Behavior, vol. 1, pp. 140151, 2006.
P. C. Larosa, J. Miner, Y. Xia, Y. Zhou, S.
Kachman, and M. E. Fromm, "Trans-10, Cis12 Conjugated Linoleic Acid Causes
Inflammation And Delipidation Of White
8
Proceedings of the 40th Hawaii International Conference on System Sciences - 2007
[18]
[19]
[20]
[21]
[22]
Adipose Tissue In Mice: A Microarray And
Histological Analysis," Physiol Genomics,
2006.
G. K. Smyth, Michaud, J., and Scott, H., "The
use of within-array replicate spots for
assessing differential expression in
microarray experiments. Bioinformatics,"
Bioinformatics, vol. 21, pp. 2067-2075, 2005.
G. K. Smyth, "Linear Models and Empirical
Bayes Methods for Assessing Differential
Expression in Microarray Experiments,"
Statistical Applications in Genetics and
Molecular Biology, vol. 3, pp. Article 3,
2004.
F. F. Millenaar, J. Okyere, S. T. May, M. van
Zanten, L. A. Voesenek, and A. J. Peeters,
"How to decide? Different methods of
calculating gene expression from short
oligonucleotide array data will give different
results," BMC Bioinformatics, vol. 7, pp. 137,
2006.
Z. Wang, X. Zhang, P. Shen, B. W. Loggie,
Y. Chang, and T. F. Deuel, "A variant of
estrogen receptor-{alpha}, hER-{alpha}36:
transduction of estrogen- and antiestrogendependent membrane-initiated mitogenic
signaling," Proc Natl Acad Sci U S A, vol.
103, pp. 9063-8, 2006.
R. Breitling, P. Armengaud, A. Amtmann,
and P. Herzyk, "Rank products: a simple, yet
powerful, new method to detect differentially
regulated genes in replicated microarray
experiments," FEBS Lett, vol. 573, pp. 83-92,
2004.
9