1
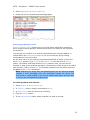
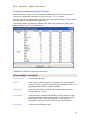
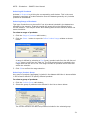
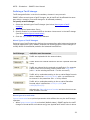
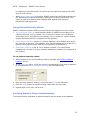
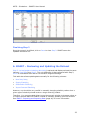
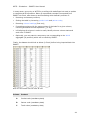
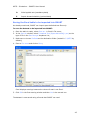
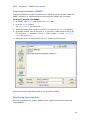
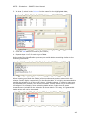
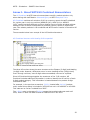
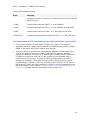
WITS – Simulation – SMART's User Manual WITS SMART Single Market Partial Equilibrium Simulation Tool 1 WITS – Simulation – SMART's User Manual Table of Contents 1. SMART – Module Objectives ...................................................... 3 2. SMART - Rationale ................................................................... 3 Rationale for Market Access analysis ...............................................................3 Rationale for Partial Equilibrium modeling ........................................................4 3. SMART - Theoretical Background ............................................... 5 SMART Theoretical Framework .......................................................................5 SMART Input Requirements and Output Results.............................................. 10 4. SMART - Opening and Extracting a Dataset................................11 Opening SMART .......................................................................................... 11 Extracting Data from WITS to feed SMART ..................................................... 12 About missing duties ................................................................................... 15 Product Selection in details .......................................................................... 17 5. SMART – Defining a Scenario ...................................................24 Checking and Exporting the Dataset .............................................................. 26 Defining Beneficiaries .................................................................................. 27 Defining Affected products ........................................................................... 30 Defining a Tariff change............................................................................... 32 Using Custom Elasticity Values ..................................................................... 33 Verifying Scenario Proper implementation ...................................................... 33 Finalizing Step 2 ......................................................................................... 35 6. SMART – Reviewing and Updating the Dataset ...........................35 7. SMART – Simulation Results.....................................................36 Opening a report ........................................................................................ 36 About the Exclude zero effects option ............................................................ 36 Aggregated versus individual results ............................................................. 37 Report on Trade Creation Effect .................................................................... 38 Report on Welfare Effect .............................................................................. 38 Report on Revenue Impact........................................................................... 39 Market View Report..................................................................................... 40 Exporter View Report .................................................................................. 40 Saving a Report .......................................................................................... 41 8. SMART – Importing Custom Data .............................................41 Exporting a SMART dataset to Excel .............................................................. 42 Preparing an Excel table to be imported into SMART........................................ 43 Saving the Excel table to be imported into SMART .......................................... 45 Importing a dataset in SMART ...................................................................... 46 Identifying Imported Data............................................................................ 46 Including product groups while importing data ............................................... 49 Annex 1. About WITS HS Combined Nomenclature .........................50 Consequences of HS combined on product selection and results ....................... 51 2 WITS – Simulation – SMART's User Manual 1. SMART – Module Objectives The objective of this course module is to learn how to use the SMART – partial equilibrium modeling tool - within WITS. After completing this module, you should notably be able to: Understand SMART’s theoretical framework; Export the extracted dataset for edition outside WITS; Extract a SMART dataset from TRAINS; Import your own dataset into SMART; Build a tariff change scenario; Understand and export SMART simulation results; 2. SMART - Rationale This section motivates the need for market access analyses. Next, it covers the important aspects of using partial equilibrium analytical tools for market access analysis. Rationale for Market Access analysis Despite successive rounds of multilateral, regional, and unilateral trade liberalization, some trade barriers (including tariffs) remain highly restrictive in many (both developed and developing) countries. For any government, it is crucial to be able to assess or to pre-empt the impact of different trade policy options. Market access analysis is a very useful tool that can be used to anticipate the likely economic effects of various policy alternatives. Impact of domestic trade reforms. For political economy or social purposes, it is often important to determine the distribution of the potential gains and losses from any contemplated policy changes. This will assist in anticipating any adjustment costs associated with reform implementation. Impact of foreign trade liberalization. For instance, when preparing for trade negotiations, market access analysis helps identify the sensitive sectors where negotiating efforts should be focused. Also, it could be useful in the formation of negotiating coalitions in multilateral/regional negotiations. The market access analysis tool included in the WITS package allows the researcher to investigate the impact of unilateral/preferential/multilateral trade reforms at home or abroad on various variables including: Trade flows (import, exports, trade creation, trade diversion), 3 WITS – Simulation – SMART's User Manual world prices, economic welfare tariff revenue, and Rationale for Partial Equilibrium modeling SMART, the market access simulation package included in WITS, is a partial equilibrium modeling tool. While there are many different approaches to market access analysis, adopting the partial equilibrium one has a number of advantages. It also has a number of its disadvantages that the analyst ought to bear in mind. Definitions: Partial equilibrium implies that the analysis only considers the effects of a given policy action in the market(s) that are directly affected. That is the analysis does not account for the economic interactions between the various markets in a given economy. In a general equilibrium setup all markets are simultaneously modeled and interact with each other. The advantages of partial equilibrium modeling The main advantage of the partial equilibrium approach to Market Access Analysis is its minimal data requirement. In fact, the only required data for the trade flows, the trade policy (tariff), and a couple of behavioral parameters (elasticities). This can therefore take advantage of the rich WITS datasets which contain all of those. Another advantage (which follows directly from the minimal data requirement) is that it permits an analysis at a fairly disaggregated (or detailed) level. For example, it allows the study of the effects of the liberalization of “brown rice” imports by Madagascar, a level of aggregation that is neither convenient nor possible in the framework of a general equilibrium model. This also resolves a number of “aggregation biases.” Illustrating the aggregation bias The graphics above illustrates an aggregation bias by considering 2 products (Apples and Oranges) falling into the same product category (Fruits). Apples face a tariff tA but demand for apples (DA) is perfectly inelastic. Consequently, tA does not entail welfare cost on the Apples market since it does not affect the level of imports. On the Oranges market, demand is somehow elastic but imports face no tariff. Again, 4 WITS – Simulation – SMART's User Manual there is no welfare cost. Therefore, the protection on the Fruits market is clearly not associated with welfare cost when analyzing at the its component level, while analysis implemented at the Fruits (aggregated) level would conclude that there is welfare cost – the blue stripe triangle – because of the aggregation bias. By the same logic, the partial equilibrium may allow the analysis of the likely impact of trade agreements like the Doha round more accurately, as the negotiations are conducted at a very disaggregated level. In general, by virtue of their simplicity, partial equilibrium models tend to be more transparent and easy to implement. Modeling is straightforward and results can be easily explained. The disadvantages of partial equilibrium modeling The partial equilibrium approach also has a number of disadvantages that have to be kept in mind while conducting any analysis. Since it is only a “partial” model of the economy, the analysis is only done on a pre-determined number of economic variables. This makes it very sensitive to a few (badly estimated) behavioral elasticities. Due to their simplicity also, partial equilibrium models may miss important interactions and feedbacks between various markets. In particular, the partial equilibrium approach tends to neglect the important inter-sectoral input/output (or upstream/downstream) linkages that are the basis of general equilibrium analyses. It also misses the existing constraints that apply to the various factors of production (e.g., labor, capital, land…) and their movement across sectors. 3. SMART - Theoretical Background This section briefly reviews the theoretical underpinning of SMART - a simulation tool included in WITS - by going over a specific partial equilibrium model - the Armington model - which is the basis for the SMART simulation package. SMART is partial equilibrium modeling tool included in WITS that is used for market analysis. It focuses on one importing market and its exporting partners and assesses the impact of a tariff change scenario by estimating new values for a set of variables. SMART Theoretical Framework Export supply side The setup of SMART is that, for a given good, different countries compete to supply (export to) a given home market. The focus of the simulation exercise is on the composition and volume of imports into that market. Export supply of a given good (say banana) by a given country supplier (say Ecuador) is assumed to be related to the price that it fetches in the export market. The degree of responsiveness of the supply of export to changes in the export price is given by the export supply elasticity. SMART assumes infinite export supply elasticity - that is, the export supply 5 WITS – Simulation – SMART's User Manual curves are flat and the world prices of each variety (e.g., bananas from Ecuador) are exogenously given. This is often called the price taker assumption. SMART can also operate with finite elasticity - upward sloping export supply functions – which entails a price effect in addition to the quantity effect. The following graphics depicts the adjustment process when the demand curve moves to the right (more imported quantity for a given price) in three situations which differ only by the type of elasticity of supply. Supply elasticity is infinitely inelastic: the market adjusts only through price (P0 to P1) since the quantity offered by suppliers is fixed. Supply elasticity is infinitely elastic: the market adjusts only through quantity (Q0 to Q1) since suppliers can meet with level of demand at the same price (P0). Supply elasticity is somehow elastic: the market adjusts through both price and quantity (P0 to P1 and Q0 to Q1). Demand side: the Armington Assumption SMART relies on the Armington assumption to model the behavior of the consumer. In particular, the adopted modeling approach is based on the assumption of imperfect substitutions between different import sources (different varieties). That is, goods (defined at the HS 6 digit level) imported from different countries, although similar, are imperfect substitutes—e.g., bananas from Ecuador are an imperfect substitute to bananas from Saint Lucia. Thanks to the Armington assumption, a preferential trade agreement does not produce a big bang solution, where all imports demand would shift to the beneficiary of the preferential tariff. Within the Armington assumption, the representative agent maximizes its welfare through a two-stage optimization process: First, given a general price index, she chooses the level of total spending/consumption on a “composite good”, (say aggregate consumption of 6 WITS – Simulation – SMART's User Manual bananas). The relationship between changes in the price index and the impact on total spending is determined by a given import demand elasticity. Then, within this composite good, she allocates the chosen level of spending among the different “varieties” of the good, depending on the relative price of each variety (say, choose more bananas from Ecuador, and less from Saint Lucia). The extent of the between-variety allocative response to change in the relative price is determined by the Armington substitution elasticity. Trade Effects In the SMART modeling framework, a change in trade policy (say preferential tariff liberalization) affects not only the price index/level of the composite good but also the relative prices of the different varieties. Though the export supply elasticity, the import demand elasticity, and the substitution elasticity, it will lead to changes in the chosen aggregate level of spending on that good, as well as, changes in the composition of the sourcing of that good. Both channels affect bilateral trade flows. SMART reports the results of any trade policy shock on a number of variables. In particular, it reports the effects on trade flows (i.e., imports from the different sources). It also decomposes those trade effects in trade creation and trade diversion. Trade creation is defined as the direct increase in imports following a reduction on the tariff imposed on good g from country c. If the tariff reduction on good g from country c is a preferential tariff reduction (i.e., it does not apply to other countries, c ), then imports of good g from country c are further going to increase due to the substitution away from imports of good g from other countries that becomes relatively more expensive. This is the definition of trade diversion in the SMART model. The graphics below illustrates the trade diversion and creation effects. A and B are two partner countries which the considered market imports good g from. Consumed composite quantity q0 is imported from A and B. The quantity respectively imported from A (A0) and B (B0) is given by E0, the intersection between q0 and the line depicting the relative price between the two varieties. Trade diversion effect: granting partner A a preferential tariff reduces its relative price compared with B. Consumption of the composite good is unchanged but the relative price line gets steeper. It leads to a new equilibrium (E1) where imports from A increases (from A0 to A1) while imports from B symmetrically decreases (from B0 to B1). This is the trade diversion effect as calculated in SMART. 7 WITS – Simulation – SMART's User Manual Trade creation effect: reducing the tariff on imports from partner A lowers the domestic price of the variety coming from A. It entails a revenue effect which allows reaching a higher composite quantity curve q1. For the same expenditure level, consumers can now import more of the variety coming from A (A1 to A2). On the market side, trade diversion is neutral. It does not affect the overall imported quantity but reallocates market shares among exporting partners based on the new relative prices. The increase in imports from tariff reduction beneficiaries is balanced by a decrease in imports from all others. For the market, the trade effect is only trade creation. For exporting countries, total trade effect is made of trade diversion and trade creation. In SMART, beneficiaries of the tariff reduction enjoy both positive diversion effect (A0 to A1) and positive creation effect (A1 to A2) while all other partners will suffer from negative diversion effect (B0 to B1) and no trade creation effect (no B2 on the graphics). Price Effect: This is a third component reported in the Trade Total effect and occurs only with a finite export supply elasticity assumption. It reflects the rise in world price for the good which demand increases following the tariff reduction (also known as the “terms of trade effect”). While trade creation and trade diversion effects depict impact on quantity, the price effect represents the additional import value from increased world price. Effects on Tariff Revenue, Consumer Surplus and Welfare SMART also calculates the impact of the trade policy change on tariff revenue, consumer surplus, and welfare. Tariff revenue change on a given import flow is computed simply as the final advalorem tariff multiplied by the final import value minus the initial ad-valorem tariff multiplied by the initial import value. The graphics below illustrates the link between tariff revenue, consumer surplus and welfare changes. It depicts the market for a given imported good with D and S the demand and supply curves (export supply elasticity is infinite). Impact of reducing a tariff from t0 to t1 8 WITS – Simulation – SMART's User Manual The left hand diagram depicts the current (pre cut) situation where the considered good faces a tariff (t0) which entails a domestic price of Pw+T0 (Pw is world price) and, given the structure of the demand, an imported quantity of Q0. The following variables are captured by the graphics: Initial Tariff Revenue (TR0): is represented by the horizontal red stripe rectangle and is equal to Q0*T0. Initial Consumer Surplus (CS0): is represented by the diagonal blue stripe triangle and is broadly defined as the difference between the consumer’s willingness to pay (marginal value) and the amount she actually pays. Initial Dead-Weight Loss (DWL0): is represented by the vertical green stripe triangle and represents what the economy looses in terms of welfare by imposing tariff t0 on the imported good. The right hand graphics depicts the impact of reducing the tariff from t0 to t1. Since the domestic price (Pw+t1) is lowered compared with the initial state, import demand increases from Q0 to Q1 with consequences on the variables seen above: Final Tariff Revenue (TR1): is represented by the horizontal stripe rectangle and is equal to Q1*T1. The result is not straightforward and depends on the magnitude of the import demand elasticity. Final Consumer Surplus (CS1): is represented by the diagonal stripe triangle. This result is not calculated by SMART, despite the (improper) use of the term Consumer Surplus in some results provided by SMART. Final Dead-Weight Loss (DWL1): is represented by the vertical green stripe triangle and represents what the economy still looses in terms of welfare because of the remaining tariff protection. Welfare Change (W): is represented by the a-b-c-d area and is what the economy as a whole gains by reducing the tariff from t0 to t1 (the reduction in dead-weight loss). This gain is made of: o o The additional tariff revenue entailed by the increase in imports (Q1-Q0)*t1 The additional consumer surplus entailed by the increase in imports ½*(Q1-Q0)*(t0-t1). It should be noted that tariff revenue change is made of two opposite effects: A tariff revenue loss at constant import value, which corresponds to a transfer from the State to consumers and is equal to Q0*(t0-t1). A tariff revenue gain through the increase in imports which enlarges the tax base and is equal to (Q1-Q0)*t1. Using SMART internal import demand elasticity values, the tariff liberalization simulation returns a negative tariff revenue change (that is revenue gain from increased imports not enough to dominate revenue loss due to tariff decrease) in most cases. 9 WITS – Simulation – SMART's User Manual SMART Input Requirements and Output Results SMART requires the following data used as the starting point for the simulation: Trade value by exporting partner which is actually regarded as trade quantity in SMART, by normalizing world price to 1; Tariff faced by each exporting partner which allow calculating domestic price (world price + tariff); SMART requires the following parameters reflecting consumer and exporter behaviors to calibrate the simulation: Import demand elasticity which may vary by product but must be the same for all varieties of the considered product (i.e. elasticity is the same whatever the exporting partner); Export supply elasticity which may vary by product but must be the same for all varieties of the considered product (i.e. elasticity is the same whatever the exporting partner); Substitution elasticity which may vary by product but must be the same for all varieties of the considered product (i.e. elasticity is the same whatever the exporting partner); Required data can be extracted from WITS, imported from alternative sources of information, or modified on the fly while building the scenario (elasticities). SMART returns the following results: Trade effect, which is made of creation effect, diversion effect (exporter side) and price effect (when export supply elasticity is finite); Tariff revenue change is calculated by SMART as TR1-TR0 (using the notation above). This result depends on both import demand and export supply elasticity values and is not straightforward. Welfare change as defined above. Please note that in SMART refers to Welfare Change in the reports whether it (improperly) mentions Welfare or Consumer Surplus. Impact of elasticity changes in SMART Changing elasticity values in SMART will have the following impact on results: Import demand elasticity proportionally affects import change. Doubling this elasticity will double the change in imports. Substitution elasticity almost proportionally affects trade diversion among exporters, almost because trade diversion reaches its ceiling with existing trade. Doubling the substitution elasticity will almost double trade diversion. Export supply elasticity is infinite by default in SMART (using the value 99) and entails import quantity effect only. Changing to a finite elasticity will affect results by transforming part of trade creation (quantity effect) into price effect. Maximum trade creation is achieved with infinite export supply elasticity. Total trade effect (creation effect + price effect) will be lower with any alternative value of export supply elasticity. 10 WITS – Simulation – SMART's User Manual SMART – Simulation Output (page 36) details all results provided in the various reports. 4. SMART - Opening and Extracting a Dataset Any SMART simulation is defined in a two-step process: The definition of the dataset on which the simulation will be applied; The specification of the tariff change scenario and other parameters that affect the dataset; This section discusses Step 1. For information related to Step 2, see SMART – Defining a Scenario (page 24). Opening SMART To open SMART: 1. Click on Analytical Tools tab. 2. Click on the SMART Simulation (Single Country) entry. The following screen will be displayed: 11 WITS – Simulation – SMART's User Manual The left panel (Required steps) gives access to all features related to the simulation definition while from the right one (View Options) gives access to the simulation results. This topic focuses on Step 1 of the simulation definition. Extracting Data from WITS to feed SMART Data used in a SMART simulation can be extracted from WITS or imported from a user file. The later is discussed SMART – Importing User Data. Click on the button in front of Step 1 to open the Simulation Data window as reproduced below. The window proposes three tabs: Use: lets you select an existing simulation dataset file (using .wds extension). Simulation Dataset lists all previously built dataset you may want to reuse. Extract: displays a panel to be described below in order to extract the dataset from WITS (TRAINS database). Import: displays a panel to import user data as a file, which will be used for the SMART simulation. This option is discussed in SMART – Importing User Data (page 41). 12 WITS – Simulation – SMART's User Manual Click on the Extract tab to display the extraction panel as reproduced below: The dataset definition requires three elements: A Reporter which is the country that is going to change its tariffs. SMART is single country simulation tool. A simulation involving several countries cutting their tariffs at the same time (regional trade agreement for example) may require several separate SMART simulations (one for each market/importer) depending on what is to be analyzed. A Year for the tariff and imports data to be used since the simulation needs a starting point in order to interpolate the consequences of the tariff reform. When available, SMART uses the same year for both tariffs and trade data. Otherwise, SMART goes for the best alternative (closest year or inverted trade). Products involved in the simulation, i.e. in the tariff reform. Including other products in the dataset is generally useless since there is nothing to simulate in terms of impact for products which tariffs are not modified. Moreover, the larger the number of selected products, the bigger the file to be manipulated. To build a dataset: 1. Make sure HS 6-digit is selected. Tariff line imports is not supported in SMART yet; 13 WITS – Simulation – SMART's User Manual 2. Check Include rows with missing duties (see below About missing duties for the rationale); 3. In Reporter, select the market which is going to be affected by the tariff reform; 4. Select a Year; 5. Select Products to be included as explained in Product Selection in details below; 6. Click on OK to save the dataset. A confirmation box like the following is displayed, click on Yes to confirm. 7. The Save extract file as window opens and proposes a name for the file as shown below: The proposed file name is built with TRN for TRAINS database, the selected reporter code (032 for Argentina in this example), the selected year (2005), the HS version of the dataset (H2) and the level of details (HS6 in any case since 14 WITS – Simulation – SMART's User Manual tariff line level is not working at the moment). You may want to change the file name for something more convenient like Argentina-2005-CH54 (CH54 stands for chapter 54, the selected products). It is recommended to save files in the proposed folder (SimData) since the system will always look into this folder by default when dealing with SMART simulation files. 8. Click the Save button. Smart confirms the operation with the following information box: Step 1 is completed. SMART returns to the main window and puts a check in front of Step 1. Step 2 (scenario definition) is explained in SMART – Defining a Scenario. About missing duties In order to run the simulation, SMART needs tariff values. When, for a given product/partner, the tariff is not Ad-Valorem, the tariff value is empty and SMART cannot compute. There are cases where, for a given product, some partners face an ad-valorem tariff while others face a non Ad-Valorem one. In such cases, SMART will take into account only partners facing an Ad-Valorem tariff and the simulation results will be wrong. In order to treat such products properly, one needs to supplement SMART with missing tariffs with ad-valorem equivalents. The screenshots below illustrates this issue by showing the dataset first when Include rows with missing duties is not checked and then when it is. The initial selection was: Market: USA Products: 610110 (HS Combined) Year: 2005 15 WITS – Simulation – SMART's User Manual Dataset when “Include rows with missing duties” is not selected In the example above, Include rows with missing duties remained unchecked. As a result, SMART includes in the dataset only countries having a tariff value (Canada and Mexico, both with a zero tariff). This dataset could be computed by SMART but results would be meaningless considering the number of actual partners not taken into account in the simulation (see next screenshot). In the next example, Include rows with missing duties was checked, forcing SMART to include in the dataset partners even if they don’t face an Ad-Valorem tariff and so cannot be computed in the simulation. Dataset when “Include rows with missing duties” is selected 16 WITS – Simulation – SMART's User Manual It is therefore recommended to always include row with missing duties when selecting the dataset, at least to check if some partners are facing non Ad-Valorem tariffs. If so, Ad-Valorem equivalents of non Ad-Valorem tariffs will have to be estimated or one will have to decide whether results without taking those partners into account will be meaningful. Product Selection in details The product selection panel is the same as in the Advanced Query tool. Products to be selected are those that are subject to tariff changes in the simulation. The simulation operates on each HS 6-digit product falling in selected categories or groups of products. SMART will return individual results by HS 6-digit product and aggregated results taking into account all products together. Elements of the Product Selection panel The product selection panel is composed of 3 main areas identified by red rectangles in the below picture: The nomenclature selection list (1) allows choosing the nomenclature you want to use for selecting product categories. The product selection mode (2) offers several ways of selecting products categories (see below) The product selection area (3) is where you actually make your product selection. Product selection always starts by choosing a Nomenclature. Then you can select products, product categories or product groups within the selected nomenclature using different modes of selection. Note that you can select products from different nomenclatures in the same query. 17 WITS – Simulation – SMART's User Manual Selecting a Nomenclature The first step in any product selection is to choose a nomenclature. Each nomenclature has its own product structure and level of details. Nomenclatures can be categorized into two groups: HS Combined: the HS Combined nomenclature combines all current and historical revisions of HS. As a country reports its tariff scheduled for a given year in only one revision (HS88/92 (H0), HS96 (H1) or HS2002 (H2)), combining these different revisions enables users to choose products without having to know in which nomenclature a particular country reports in a particular year. You select products in HS combined, WITS returns results in the native HS version. See About WITS HS Combined Nomenclature in annex (page 50) for detailed presentation. WITS derived nomenclatures: these are all other nomenclatures included in WITS and which data are converted to by using the concordance files. To select a nomenclature: 1. Open the Nomenclature dropdown list; 2. Click on the desired nomenclature. The product classification corresponding to the selected nomenclature is displayed in the product selection area as materialized below by the two red rectangles: 18 WITS – Simulation – SMART's User Manual Products can be selected using through four modes of selection you choose from the product selection area titled Select product by: Items Aggregates Clusters Search Selecting products by Item The selection by Items is the most common and basic way for selecting product categories. You can pick product categories at various levels of details. To make a selection by items, select Items in Select product by. Product categories are generally structured like a tree, Total trade (all products) being always the most aggregated category with several levels of sub-categories attached to it. Note: in SMART, Total trade cannot be selected as dataset. A folder icon ( ) in front of a product category indicates it contains sub-categories. Click on the category name to expand the branch and display the subcategories: 19 WITS – Simulation – SMART's User Manual HS Combined structure with chapter 01 expanded Note than when a category is expanded, its folder icon is changed into an open folder icon ( ). You can close an expanded branch by double-clicking on the parent category. Once the end of the structure (the leaf) is reached, there is no more subcategory and the leaf category is identified by a sheet icon ( ). HS Combined structure with Heading 0101 expanded To select products by item: 1. Select the desired classification in the Nomenclature list; 2. Select Items in Select product by; 3. Expand the corresponding branch in order to display the desired category. 4. Check the box in front of the desired category. 5. Repeat steps 1 to 4 until your selection is completed. 20 WITS – Simulation – SMART's User Manual Note: in principle, selecting from various nomenclatures works in SMART but it may be difficult to keep tracks of selected products from one nomenclature to the other since everything is converted in HS 6-digit codes in SMART results. Selecting products by cluster Cluster selection is a shortcut for selecting all same level product categories in one click. The available clusters depend on the selected nomenclature. In the case of HS nomenclature for example, 3 levels of categories are available: 2-digit, 4-digit and 6digit levels. WITS will then return information for each and every category belonging to the selected cluster(s). Note: selection by cluster is not recommended in SMART since it actually selects all HS 6-digit products and produces unnecessary large files. The only exception concerns the Range feature (see below). To select product by cluster: 1. Select the desired classification in the Nomenclature list; 2. Select Clusters in Select product by; 3. Check the cluster you want to include in your selection. In the case of the HS nomenclature, Chapter corresponds to all 2-digit categories, Heading to all 4-digit categories and Sub-Heading to all 6-digit categories. 4. Repeat steps 1 to 3 until your selection is completed. 21 WITS – Simulation – SMART's User Manual You can also define ranges of products using Clusters option. To define a range of product: 1. Select <New Range> - Define cluster as a range of items in the Clusters panel. The Define Product Range window is displayed. The same nomenclature used in the Cluster option will be kept for this option (HS Combined in this case). 2. Enter a name for the range in the Range Name text area; 3. Select a level of details in Tier; 4. Select the first product of the range in First Product; 5. Select the last product of the range in Last Product; 6. Check the Include Children products box if you also want to display all products within your specific range. This feature may be very useful if you want to select a large number of products and retrieve tariff data for each and every product in the range. 7. Click on the Save button to save your range. The Save button Example range selection Selecting products by aggregate Aggregates are groups of heterogeneous product categories that are either predefined in WITS or defined by you using the Create Product Groups utility. This way, you can select many products in one click instead of manually selecting each and every item included in the group. To select a product aggregate: 1. Select the desired classification in the Nomenclature list; 22 WITS – Simulation – SMART's User Manual 2. Select Aggregates in Select product by; 3. Check the box for the desired product aggregate. Selecting product by search Select Product By Search allows you to do a text search and find all products in which a specific string appears. Selecting this option will display a new screen as shown below. You can perform a search in all existing nomenclatures by using the default ALL located within the Nomenclature box; or you can choose any of the existing nomenclatures from the list box. We will do a search on all existing nomenclatures and find all items in which the word Textile appears. Type Textile in the Search Text box and click on Search button. The system finds total number of 680 products. Now, you can use the scrollbar to view all the products and place a checkmark in check boxes to the left of each product. Finally, click on OK. The selected products from the search panel will be added to the Products dimension. Note: Searching by string does not guaranty that you will retrieve desired products if their description does not specifically include the string. The Search tool is mostly helpful if you know a product description and you want to retrieve the corresponding product code. To select products from Search: 1. Select Search in Select product by; 2. In Search in, select a single nomenclature or ALL; 3. In Search Text, enter the text to be searched; 4. Click the Search button; 5. In the Search Results table, select products you want to include. 23 WITS – Simulation – SMART's User Manual 5. SMART – Defining a Scenario Any SMART simulation is defined in a two-step sequential process: 1. The definition of the dataset on which the simulation will applied; 2. The specification of the tariff change scenario and other parameters to affect the dataset; This topic discusses Step 2. For information related to Step 1, see SMART – Opening and Extracting a Dataset (page 11). Click on the button in front of Step 2 to open the Scenario definition window as reproduced below. 24 WITS – Simulation – SMART's User Manual Note: step 1 must be completed before starting with step 2, otherwise, the system returns an error message. Any scenario is made of four set of parameters: Beneficiary countries are partners which export to the considered market and will be affected by the tariff reform. Affected products are those which tariff is changed by the scenario. Tariff change which defines how tariff are to be affected for involved beneficiaries and products; Elasticities which define behaviors and affect the magnitude of the scenario impact. SMART allows including several scenarios in a single simulation. For example, a group of countries may be granted some preferential treatment while another group of beneficiaries is granted another one, or distinct groups of products may be affected by different types of tariff change, or any combination of the two preceding examples. Working with several scenarios in SMART requires some practice since the interface does not keep track of the various scenarios. A multiple scenario example will be detailed later in this document. 25 WITS – Simulation – SMART's User Manual Checking and Exporting the Dataset At anytime during step 2, you can check the dataset and how it is affected by the scenario and parameter changes by clicking on the View Data button. Having a look at the data should be the first task when opening Step 2, just to make sure the dataset corresponds to expectations. The example below reproduces a dataset view before any changed is made (note that the table is split in two parts below): The dataset includes the following information: Column Heading Description Tariff line code is the 6-digit HS code; Partner is the name of actives partners (exporters) for the considered product. The list of partners always starts with World which is an aggregate automatically created by SMART. Trade Value is the bilateral import value for the considered product from each partner (in $ ‘000); Applied duty is the effectively applied tariff faced by a given partner for the considered product entering the market. It is the MFN applied tariff unless another tariff (preferential in most cases) is recorded for the considered product-partner combination. Bound Duty is the bound tariff value if any; 26 WITS – Simulation – SMART's User Manual New Duty Rate is the new effectively applied tariff when a scenario is implemented. Otherwise, it replicates the initial Applied duty value; Supply Elasticity: is the export supply elasticity value. By default, SMART uses 99 for infinite elasticity for all products and partners. Substitution elasticity: is the substitution elasticity value between partners. SMART uses 1.5 as the default value. Import Demand Elasticity: values used by default in SMART are the same for all reporters but may vary by product. The current set includes over 100 distinct values that can be changed but the elasticity value is unique for a given product (import demand elasticity is irrespective of the partner). In the example above, both products (540110 and 540120) use the same value (1.47…) Exporting the dataset Click on the Save as… button to export the table as a file. The table is saved using the csv text file format. See SMART - Exporting and Importing Data (page 41) for more information. Defining Beneficiaries Beneficiaries (or affected) countries are selected in the left side panel as reproduced below: 27 WITS – Simulation – SMART's User Manual You can select: All countries if your scenario is multilateral and you want to reduce MFN tariffs for all partners. Note that given the underlying model, SMART is not very well fitted to this type of scenario. Specific countries allows selecting one or more individual countries; Country groups allows selecting one or several groups of countries; Selecting All Countries Activate All countries by clicking the corresponding radio button. Selecting Specific Countries To select countries: 1. Click the radio button in front of Specific Countries; 2. Check in the list the countries to be included; 3. To make sure the selection is correct, check Show beneficiaries only, uncheck it to display the full list and modify if necessary. 28 WITS – Simulation – SMART's User Manual Selecting Country Groups To select country groups: 1. Click the radio button in front of Country Groups; 2. Select a group in the dropdown list. SMART reflects your selection by checking in the list of individual countries those belonging to the group. 3. Repeat 2 to include additional groups until your selection is completed. 4. To make sure the selection is correct, check Show beneficiaries only, uncheck it to display the full list and modify if necessary. Groups and individual countries can be mixed in the selection. In the example below, the ANDEAN group of countries (Bolivia, Colombia, Ecuador, Peru and Venezuela) was added to the previous selection of individual countries (Canada, Mexico and USA). 29 WITS – Simulation – SMART's User Manual Defining Affected products Affected products are selected in the upper right panel as reproduced below: As for beneficiaries you can select: All products to affect all products included in the dataset; Product group to affect only products belonging to a group of products. Note that the list shows only product groups selected as aggregates in the dataset definition. Range of products to affect only products falling between two codes to be specified; 30 WITS – Simulation – SMART's User Manual Selecting All Products Activate All Products by clicking the corresponding radio button. This is the most frequently used type of product selection since the dataset generally only includes products to be affected. Selecting Range of Products This type of selection may be useful if not all products included in the dataset are affected by the scenario. Products outside the range will not be affected by the current scenario. This may be useful when dealing with several scenarios within the same simulation. To select a range of products: 1. Click the Range of products radio button; 2. Click the Select… button to open the Define Product Range window as shown below: A range is defined by selecting a First (lower) product code from the left list and a Last (upper) code from the right list. The first selected code is included in the range while the last one is not. The range includes all products which code falls within the selection. 3. Click OK to confirm the range selection. Selecting a Product Group Any group of products (aggregate) included in the dataset definition is also available in the scenario definition to specify affected products. To select a group of products: 1. Click the Product Group radio button; 2. Select the group of products to be affected in the list as shown below: The current scenario will affect all products included in the selected group. 31 WITS – Simulation – SMART's User Manual Defining a Tariff change Tariff change definition is the third mandatory element in any scenario. SMART offers several types of tariff changes, but all tariffs will be affected the same way within a scenario (one tariff change for all affected products). To specify a tariff change: 1. Select the desired type of tariff changes (see below About types of tariff changes); 2. Enter required parameters if any; 3. Specify whether or not bound tariffs to be taken into account in the tariff change (see below About Ignore bound rates); 4. Click the Apply button to modify the dataset. About Types of Tariff Changes Select a type of tariff change by clicking the corresponding radio button and entering required parameters if any. SMART proposes the following types of tariff changes to modify tariffs of the affected products and selected beneficiaries: Tariff Change Definition and Parameters Tariffs are replaced with the entered value; Tariffs above the entered maximum rate are replaced with that value; Tariffs are reduced by the entered cut coefficient. For example a 80% linear cut will modify existing tariffs with r1=0.2*r0 (with r0 as the existing tariff and r1 as the new tariff) Tariffs will be reduced according to the so-called Swiss formula which is defined as r1=(a*r0)/(a+r0) with a as coefficient to be entered in the parameter box. a=16 by default. Tariffs will be reduced according to the so-called Canadian formula which is defined as r1=r0*(1-r/100) and r=Min(38;32+r0/5). Activates the Rate adjustment formula text box where one can enter a custom formula. About Ignore bound rates Ignore bound rates is an optional parameter which affects the way the tariff change operates: When Ignore bound rates is unchecked (default status), SMART applies the tariff change to Bound tariffs and reduces any given Applied tariff which value is above 32 WITS – Simulation – SMART's User Manual its respective new Bound tariff. This option will be used when dealing with WTO type of tariff reforms. When Ignore bound rates is checked, SMART applies the tariff change directly to the Applied tariffs without affecting (or taking into account) Bound rates. This option is used when dealing with unilateral MFN applied tariff change or preferential trade agreement. Using Custom Elasticity Values SMART includes by default elasticity values that can be replaced with user values: Import demand elasticity values used by default in SMART are the same for all reporters but may vary by product. The current set includes over 100 distinct values that can be changed but the elasticity value is unique for a given product (import demand elasticity is irrespective of the partner); Export supply elasticity receives 99 (infinite elasticity) as by default value and is the same for all partners. The elasticity value can be changed but is unique for a given product (export supply elasticity is irrespective of the partner); Substitution elasticity is set at 1.5 by default in SMART. The value can be changed but is unique for a given product (substitution elasticity is irrespective of the partner); To use custom elasticity values: 1. Select product(s) for which elasticity must be changed (see Defining affected products above); 2. In the Elasticities panel, check the box(es) corresponding to the type of elasticity to be customized (Import demand elasticity was checked below); 3. Enter the new elasticity value(s) in the text area (3.2 in the example); 4. Click the Apply button to replace existing values with the new ones; 5. Repeat steps 1 to 4 until you’re done. Verifying Scenario Proper implementation The example below illustrates an applied scenario with its impact on the dataset: 33 WITS – Simulation – SMART's User Manual The scenario reduces tariffs to 0% for All products (within the selection) imported from the USA and changes the Import demand elasticity for All products and partners to 3.00. As a result the dataset is modified as following: Tariff for USA is reduced from 16.67 (Applied duty) to 0.00 (New Duty Rate) for 540110. 540120 is not affected by the scenario since the USA is not a partner. Import demand elasticity is changed from 1.47 to 3 for both products. 34 WITS – Simulation – SMART's User Manual Finalizing Step 2 Once the scenario is defined, click on Done to close Step 2. SMART saves the updated simulation file. 6. SMART – Reviewing and Updating the Dataset Step 3: review/update simulation data table is optional and displays almost the same table as View Data from Step 2. The only difference is that compared with Step 2, World is recalculated and returns correct tariff weighted average. This table also allows updating data manually for the following columns: New Duty Rate; Substitution Elasticity; Supply Elasticity; Import Demand Elasticity; However, one should be very careful in manually changing elasticity values since a given type of elasticity should receive a single value by product. Therefore, it is recommended either to use the scenario window to changes values or to import external data into SMART instead of manually updating from this window. See SMART - Exporting and Importing Data (page 41) for more information. 35 WITS – Simulation – SMART's User Manual 7. SMART – Simulation Results Results can be accessed only once the simulation is fully defined by completing Step 1 (dataset definition) and Step 2 (scenario definition). Opening a report All results are available through five reports that can be opened from the View options panel of the main SMART window. To open a report: 1. Choose whether to Exclude zero effects or not (see below) 2. Select one of the five reports; 3. Click on the Open button. About the Exclude zero effects option Zero effects concern products which are not affected by the simulation. Since SMART computes results mostly in terms of variation, a product not affected by the simulation does not affect results and there is no reason to include it unless one has particular interest in absolute values (pre and post trade or tariff revenue for example). A zero effect occurs when tariffs are unchanged for all active partners for a given product. A typical case arises when the beneficiary of a preferential trade agreement is not active partner for a given product. By default, SMART excludes zero effects (the box is checked). Uncheck it to include them. 36 WITS – Simulation – SMART's User Manual Aggregated versus individual results Reports return both aggregated and individual results. Depending on the report, products may be aggregated by reporter (all products), or by partner. To display individual data (by product/partner), click on the plus sign ( ) sign to expand the table as demonstrated below. In the first screenshot below, results are aggregated (Total HS meaning all selected products). Clicking on the plus sign ( ) expands the table and displays individual results. Clicking on the minus sign ( ) contracts the table and goes back to the initial display. 37 WITS – Simulation – SMART's User Manual Report on Trade Creation Effect The Trade Creation Effect report returns individual results on Trade Total effect by product code/partner combination and for all products as one aggregate. The table contains the following information: Column Heading Content Product returns Total HS which corresponds to the aggregated results for all products included in the simulation; HS Code is the HS 6-digit code; Tariff Line Code replicates the HS 6-digit code since tariff line level simulation is not working yet; Partner the partner (exporter) name; Trade Total Effect ($’000) is the sum of Trade Diversion effect, Trade Creation Effect and Price Effect. It corresponds to the impact of the tariff reform on import flows. Trade Diversion Effect ($’000) is the trade diversion effect among partners. Market side, trade diversion is equal to zero since what is gained by beneficiaries of the tariff reform is exactly compensated by the loss of all other partners; Trade Creation Effect ($’000) is trade creation effect for both the market and its partners; Price Effect ($’000) returns a value different from zero only in simulations where export supply elasticity is not infinite. It corresponds to a change in the world unit price following a change in domestic demand for imported goods. Old Simple Duty Rate (%) is the pre-tariff change simple average tariff; New Simple Duty Rate (%) is the post-tariff change simple average tariff; Note: $’000 means thousand of current US dollars Report on Welfare Effect The Welfare Effect report returns individual results on the market’s welfare by product code and for all products as one aggregate. The table contains the following information: 38 WITS – Simulation – SMART's User Manual Column Heading Content Product returns Total HS which corresponds to the aggregated results for all products included in the simulation; HS Code is the HS 6-digit code; Tariff Line Code replicates the HS 6-digit code since tariff line level simulation is not working yet; Trade Total Effect ($’000) is the sum of Trade Diversion effect, Trade Creation Effect and Price Effect; Welfare ($’000) is welfare change and correspond to the change in the dead-weight loss as explained in details in SMART – Theoretical Background (page 5); Old Weighted Rate (%) is the pre tariff change weighted (by bilateral trade) average tariff; New Weighted Rate (%) is the post tariff change weighted (by bilateral trade) average tariff; Note: $’000 means thousand of current US dollars Report on Revenue Impact The Revenue Impact report returns individual results on the market’s revenue by product code and for all products as one aggregate. The table contains the following information: Column Heading Content Product returns Total HS which corresponds to the aggregated results for all products included in the simulation; HS Code is the HS 6-digit code; Tariff Line Code replicates the HS 6-digit code since tariff line level simulation is not working yet; Revenue Effect ($’000) is the tariff revenue change between the pre and post situation; Trade Total Effect ($’000) is the sum of Trade Diversion effect, Trade Creation Effect and Price Effect; Trade Value ($’000) is the initial trade value. The sum of Trade value and Trade Total Effect gives the new trade value. 39 WITS – Simulation – SMART's User Manual Old Weighted Rate (%) is the pre tariff change weighted (by bilateral trade) average tariff; New Weighted Rate (%) is the post tariff change weighted (by bilateral trade) average tariff; Note: $’000 means thousand of current US dollars Market View Report The Market View report returns all three types of effects affecting the market (trade value, tariff revenue and welfare change) by individual product code and for all products as one aggregate. The table contains the following information: Column Heading Content Product returns Total HS which corresponds to the aggregated results for all products included in the simulation; HS Code is the HS 6-digit code; Tariff Line Code replicates the HS 6-digit code since tariff line level simulation is not working yet; Imports Before ($’000) is the initial import value; Imports, Changes in ($’000) is equal to the Trade Total Effect; Tariff Revenue ($’000) is the initial tariff revenue; New Tariff Revenue ($’000) is the post tariff revenue; Change in Tariff Revenue ($’000) is equal to New Tariff Revenue minus Tariff Revenue; Consumer Surplus (%) is actually welfare change and correspond to the change in the dead-weight loss as explained in details in SMART – Theoretical Background (page 5). Note: $’000 means thousand of current US dollars Exporter View Report The Export View report focuses specifically on the impact of the tariff reform on partners’ exports to the considered market. It’s a very useful report when the focus country is a partner of the considered market. SMART returns results by partner, for each traded product and for all products as an aggregate. The table contains the following information: 40 WITS – Simulation – SMART's User Manual Column Heading Content Exporter is the partner name; Code is the partner 3-digit code; Product returns HS in any case; Description is empty at the moment but should display the product’s description; Tariff Line Code replicates the HS 6-digit code since tariff line level simulation is not working yet; Exports Before ($’000) is the pre value of exports on the considered market; Exports After ($’000) is the post value of exports on the considered market; Exports, Change in Revenue ($’000) Is the change in export value to the considered market; Note: $’000 means thousand of current US dollars Saving a Report Any report can be saved as a file and open in MS Excel for example. To save a report: 1. Open the report 2. Click on the Save As… button; 3. In the Export Data to file window, choose a location (folder) and give a name. SMART proposes a name by default, made of your simulation file name plus the report’s name. The table is saved as a .csv (text) file compatible with many applications. 8. SMART – Importing Custom Data In SMART - Opening and Extracting a Dataset (page 11), you saw how to extract the dataset for the simulation from the TRAINS database. There will be cases where you have better data you wanting to use as dataset in SMART. This is notably useful if you notice some existing preferential agreements are missing in TRAINS and you want to adjust some tariffs. This topic demonstrates how to import custom data into SMART. It also shows how to work with files exported from SMART since a common practice is first to extract 41 WITS – Simulation – SMART's User Manual data from TRAINS in SMART, then export the dataset and edit its content outside WITS, and finally re-importing the modified dataset into SMART. MS Excel will be used as an example to illustrate data import/export features in SMART but the same could be achieved with any software offering compatibility with text formatted files. Exporting a SMART dataset to Excel To export a dataset from SMART: 1. Open the dataset table, either from Step 2, by clicking on the View Data button or from Step 3; 2. Click on the Save as… button; 3. Choose a location and name the file to be saved. Click on OK to save the dataset as a .csv (text with comma delimitation) file. To import the csv file into Excel: Because of the way Excel automatically treats .csv files, it is recommended to change the file extension to .txt before importing it into Excel. Otherwise all codes (product and country codes) will be treated as numbers by Excel and those having leading zeros will be truncated (010110 becoming 10110 for example). 1. Make sure your file extension is .txt; 2. In Excel, choose Open… in the File menu; 3. In the Open window, change the file type to Text files (*.prn; *.txt, *.csv); 4. Select the location of your file and click on Open; Excel displays the Text Import Wizard – Step 1 of 3. The wizard allows specifying the file structure in order to be properly handled by Excel. 5. At Step 1, make sure Delimited is selected, Start import at row has the value of 1 and the File origin is 437: OEM United States, and click on Next. 6. At Step 2, choose Comma as the only delimiter (uncheck Tab). You should recognize your data structure in the Data preview table. Click on Next to continue with Step 3 if everything looks fine, otherwise click on Back to return to Step 1. 7. Step 3 allows specifying how columns should be treated (numbers or text) by Excel. Here we want to make sure country and product codes will not be truncated. To do so, click on the HS code column and select Text as Column data format. Do the same with the Partner code column as shown below: 42 WITS – Simulation – SMART's User Manual All others columns can use the General data format. 8. Click on Finish to open the table in Excel. The dataset opens in Excel. From there you can modify the dataset before reimporting it back into SMART. Preparing an Excel table to be imported into SMART In order SMART to be able to read the imported file, it must follow a very specific structure and format (space delimited text file type). Hopefully, Excel (as most software) can export space delimited text files. Moreover, in order the SMART simulation to be computable, the imported dataset must include the following information: HS 6-digit product codes The corresponding Trade Value; Country code of each active exporting partner; The initial effectively applied tariff faced by each partner for the considered product; Other data (final tariffs, elasticity values) required for the simulation can be obtained from SMART Step 2 or included in the file. A space delimited text file is a file in which columns are separated by spaces in order to keep data properly aligned. Having this principle in mind is very helpful when preparing the dataset to be imported. The following provide with some guidance about the dataset formatting in Excel, based on data initially extracted from SMART. The main advantage of starting with a dataset initially extracted from SMART is that the file already uses the structure required for importing back into SMART. Moreover, 43 WITS – Simulation – SMART's User Manual in many cases, users rely on WITS for providing with trade flows but want to update or complete tariff information. Below is reproduced a sample file exported from SMART into Excel, after clean-up and formatting which basically consists of: Removing unnecessary columns; Removing column headings (first row); Sorting the table by increasing product code and partner code; Formatting numbers with the same number of decimals for a given column, removing thousand comma separators (,) if any; Left aligning all columns in order to easily identify where a column starts and ends once in SMART. Optionally, you may want to remove any row corresponding to the World aggregate (all partners) which will be rebuilt by SMART. Finally, the dataset should look as below (in Excel) before being imported back into SMART: Note: the screenshot does not show all rows Column Content A Product code (mandatory data) B Partner code (mandatory data) C Trade value (mandatory data) 44 WITS – Simulation – SMART's User Manual D Initial applied rate (mandatory data) E Import demand elasticity (optional data) Saving the Excel table to be imported into SMART As already mentioned, SMART can import space delimited text files only. To save the dataset to be imported into SMART: 1. Once the table is ready, select Save as… in Excel’s File menu; 2. In the Save As window, select Formatted Text (Space delimited)(*.prn) as the type of file in the Save as type dropdown list; 3. Make sure to choose SimData as the destination folder (located in C:\WITS by default); 4. Enter a File name and click on Save; Excel displays warnings because the chosen format is not Excel. 5. Click OK in the first warning window and then Yes in the second one. The dataset is now saved using a format that SMART can read. 45 WITS – Simulation – SMART's User Manual Importing a dataset in SMART Importing a dataset instead of extracting from WITS allows using custom data for a SMART simulation or implementing complex scenarios SMART can not handle. To import a dataset into SMART: 1. In SMART, open Step 1 and choose the Import tab; 2. Click the Browse button; The Input Data file window opens. 3. Select the folder which contains the file to be imported (SimData by default); 4. By default, SMART lists all files with a .txt extension. When saved in Excel, the file receives a .prn extension. To see .prn files, replace *.txt with *.prn in File name and press Enter. 5. Select the file in the list and click the Open button as shown below: Next step consists in identifying data to be imported in SMART Identifying Imported Data Once the imported file is chosen, SMART opens a panel which allows identifying imported data: 46 WITS – Simulation – SMART's User Manual The panel is divided in three areas identified above with red rectangles: The first area (1) displays a sample of the imported data. If the data do not look properly aligned, it is recommended to go back to Excel and double check the table there. The sample table is used to locate types of information (product code, partner code …). The second area (2) allows identifying and naming the different columns; The third area (3) is optional and allows selecting group of products you may want to refer to in the scenario definition. To locate and identify imported data: 1. In the sample table, highlight the range of characters corresponding to a type of data to be imported. For example, highlight the Product code (6 characters) of the first row; 47 WITS – Simulation – SMART's User Manual 2. In Area 2, select in the Column list the name for the highlighted data; 3. Click the Add button to confirm your choice; 4. Repeat steps 1 to 3 for each type of data. At the end of the identification process you would obtain something similar to the following screenshot: When locating non fixed-size fields (all but product and partner codes which are always 6 and 3 digits, respectively) in the sample table, it is highly recommended to extend the selection up to the next column, including spaces, in order to make sure the selected field (column) will not be truncated. This tip works only if columns are left aligned. For example, when selecting trade values, make sure all space characters are included in the selection as shown below. This way, it is guarantied trade values will not be truncated. 48 WITS – Simulation – SMART's User Manual 5. Optionally, select product groups you want to use when defining the tariff change scenario (see below); 6. Finally click the OK button to open the dataset into SMART. From now on, SMART operates as if data were extracted and you can continue with Step 2 of the simulation definition. Note: If final tariffs are not imported, make sure you first click the Reset button when you open SMART Step 2 window. Indeed, when importing a dataset which does not include final tariffs, SMART uses a zero default values for all final tariffs. When you click the Reset button, SMART overwrites the final tariffs with initial tariffs which provides for a good starting point. Including product groups while importing data Including groups of products at this stage is useful only if you want to refer to those groups when selecting affected products in the tariff change scenario definition. Selected groups will be available in the list of product groups in the scenario definition window. To include group of products: 1. Select a group in the Available Product Groups list; 2. Click the right arrow to move the selection to the Selected product groups list; 3. Repeat steps 1 and 2 until selection is completed. To remove a group from your selection: 1. Select the group to be removed in the Selected product groups list; 2. Click the left arrow to move the selection to the Available Product Groups list; 49 WITS – Simulation – SMART's User Manual Annex 1. About WITS HS Combined Nomenclature The HS Combined is WITS internal nomenclature used for product selection only when dealing with tariff data in Advanced Query or WITS Analytical Tools. HS Combined combines all revisions of HS. As a country reports its tariff scheduled for a given year in only one revision (HS88/92 (H0), HS96 (H1) or HS2002 (H2)), combining these different revisions enables users to choose products without having to know in which nomenclature a particular country reports in a particular year. One selects products in HS combined and WITS returns results in the native HS version. The screenshot below is an excerpt of the HS Combined structure. HS Combined structure with Heading 0101 expanded The three HS versions share the same structure at the Chapter (2-digit) and Heading (4-digit) levels. However, differences occur in some headings at the (6-digit level) level: through revisions, some 6-digit codes were added, removed or replaced. Since HS Combined brings together the structures of the 3 HS versions, HS Combined includes additional information in order to identify the HS version of each 6-digit product category. This information is located between the product 6-digit code and its label. For example, in the previous screenshot, (2002-) located after 010110 (product code) means this product is included in HS 2002 but not in HS 1988-92 or HS 1996. This code can be red as “included from 2002”. The (-2001) code in the case of 010111 means that product code was used until 2001, that is in both HS 1988-92 and HS 1996 but not in HS 2002. 50 WITS – Simulation – SMART's User Manual The following codes are used: Code Meaning No year information means the considered product code is used by all HS versions. (-1995) Product code used until 1995, i.e. in HS 1988/92. (-2001) Product code used until 2001, i.e. in HS 1988/92 and HS 1996. (1996-) Product code used since 1996, i.e. in HS 1996 and HS 2002. (1996-2001) Product code used between 1996 and 2001, i.e. in HS 1996 only. Consequences of HS combined on product selection and results For any item selection at HS 2-digit or 4-digit, any cluster or pre-defined aggregate selection, usage of HS Combined is transparent and produces results based on the native HS version used by each reporter. A given 6-digit level product may correspond to different product codes in the various HS versions. Therefore, if dealing with several reporters (possibly reporting in different HS versions) or several years (a same country may report in different HS versions from year to year) make sure the selected code is common to all HS versions, or select all codes corresponding to the chosen product. For example, if one wants to retrieve all occurrences of the product corresponding to 010190 in HS2, one must also select 010120 (its equivalent in HS0 and HS1). WITS will return results for 010190 or 010120 depending on the HS version used by each reporter. Available Product Concordances in Help and Information provides with all concordances at the 6-digit level. 51