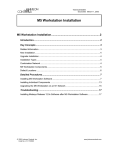
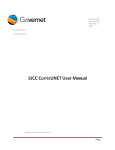
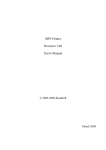
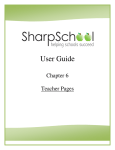
1
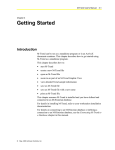
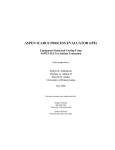
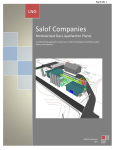
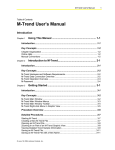
M-Trend User’s Manual
5-1
Chapter 5
Defining M-Trend Documents
Introduction
M-Trend documents are defined subsections or views of the default
database. A saved M-Trend document saves the settings used in a
particular view so that they may be recalled at a later time. See the
Getting Started chapter in this manual for further details. This chapter
describes M-Trend definition, which determines the data sources to be
displayed and how they appear.
This chapter describes how to:
•
set the General options for an M-Trend document
•
select Data Sources for an M-Trend document
•
remove Data Sources from an M-Trend document
•
set Data Range for an M-Trend document
•
set Data Source Options for an M-Trend document
•
set Plot Style for an M-Trend document
•
set fonts and colors for an M-Trend document
© May, 2000 Johnson Controls, Inc.
5-2
Operator’s Guide
Key Concepts
M-Trend Definition
The parameters in the M-Trend Edit Properties dialog box determine
what data is displayed in an M-Trend document, and the way it is
displayed.
Data Source Tab: M-Trend Definition
Select and remove individual data items available within the database
in the Data Source tab.
Add Button
Allows you to select desired data sources for display from a list of
available archived data. Data references can be selected more than
once in the same query. This allows comparison of the same data
source over different times using the offset function.
Remove Button
Removes unwanted data sources from the current trend view. It does
not remove data sources or samples from the database.
Data Source Name List Box
The list box includes all items currently involved in the M-Trend query.
Data Range Tab: M-Trend Definition
Set the desired range of chronological data in the Data Range tab. Use
the default date/time format provided, or use the wild card terms
described in the Wild Card Terms section in this chapter.
Study Range
The Study Range specifies the range of data that is queried for display
within the M-Trend document. The Study Range defaults to NOW-8H
until NOW, which reflects the last 8 hours of samples.
Refresh Rate
The Refresh Rate specifies the length of time between database
updates to the screen. This parameter is only enabled if a relative study
range has been entered, for example, TODAY or NOW.
Note:
The display changes on screen refreshes only if new samples
have been added to the Historian database since the last
query.
Defining M-Trend Documents
5-3
Wild Card Terms
M-Trend supports wild card terms when specifying a Study Range for
data retrieval within the Historian database. Wild card terms allow you
to easily specify relative time-based date ranges for the retrieval of
data. The following wild card terms are used:
•
NOW - This keyword specifies the current date/time. The value is
set at the exact time the database request is made.
•
TODAY - This keyword specifies the current date. If no time of
day is specified, midnight is assumed.
•
D - This keyword indicates a specific number of days. Example:
TODAY-8D indicates a date eight days prior to the current date.
•
H - This keyword indicates a specific number of hours. Example:
NOW-3H indicates a time three hours before the current time.
•
M - This keyword indicates a specific number of minutes.
Example: NOW-5H30M indicates a time 5 hours and 30 minutes
prior to the current time.
Time may also be specified either in the standard 12 hour, a.m./p.m.
format or in 24-hour time. For example, 12/12/97 12:00:00 p.m. and
12/12/97 23:00:00 are valid parameters.
Note:
Time and date formats allowed follow the regional time/date
format setting in the Windows operating system.
Data Source Options Tab: M-Trend Definition
Data Source Name
This drop-down box allows you to select one of the data sources you
have added to your Trend document in the Data Source.
Data Source Description
Allows you to give a descriptive name to the data source that is
selected in the Data Source Name list box. This description is then
used as a label for the data source on graphs or tables.
Units
Allows you to label the value of units on the Y-axis in graphical view.
The units specified are also included in the column label of text views.
Time Offset
The time offset feature allows you to shift the time line of a data
source in order to compare different time ranges of the same data
source, for example, to compare yesterday’s temperature to today’s.
5-4
Operator’s Guide
Pen
The Pen commands, Pen Style and Pen Color, allow you to customize
the look of the plotted line for each individual data source.
Aggregate Functions
Aggregate functions, in databases that support them such as the
AspenTech Historian, allow you to perform statistical functions on the
data in an M-Trend query in order to allow various types of analysis of
the data. You must set a data interval in order to use aggregate
functions. The data interval allows you to set the amount of time
between samples you are performing the aggregate functions on.
M-Trend supports the following aggregate functions:
All Data - Shows all available data. This is the default and is also the
only available option for queries on databases that do not support
aggregate functions.
Average - Returns the average (arithmetic mean) of the values of the
selected data source.
Maximum - Returns the largest values in a set of values.
Minimum - Returns the smallest values in a set of values.
Range - Returns the difference between the Minimum and Maximum
values in a set of values.
Standard Deviation - Estimates standard deviation based on a
sample. The standard deviation is a measure of how widely values are
dispersed from the average value (the mean).
Sum - Adds all the numbers in a range of data sources.
Variance - Estimates variance based on a sample.
Y Axis Range
For stacked graphs, allows the override of calculated ranges.
Plotting Methods
Continuous plotting assumes a linear change in value between samples
and draws a straight line between them. Discrete plotting follows the
assumption that each sample is an event, that is, the value changes
abruptly for each new sample, with the value staying constant until the
next sample is plotted. In Figure 5-1 the same data source is plotted
with continuous plotting (dark line) and discrete plotting (gray line).
Note that the larger the sample you are looking at, the less apparent the
differences are.
Defining M-Trend Documents
5-5
Figure 5-1: Continuous vs. Discrete Plotting
Plot Style Tab: M-Trend Definition
The Plot Style tab lists different plotting styles for each Y-axis used.
The following plotting styles are available:
•
Area Graph
•
Bar Graph
•
Line Graph
•
Points Graph
•
Points + Line Graph
•
Points + Spline Graph
•
Spline Graph
Mark Data Points
This option marks each data point on the graph with a small dot.
5-6
Operator’s Guide
Fonts/Colors Tab: M-Trend Definition
Change the visual display of the graph in the Fonts/Colors tab.
Font
The Fonts/Colors tab allows you to change the fonts associated with
all text displayed on the graph. You may also bold, italicize, or
underline text for emphasis.
Color
The Fonts/Colors tab allows you to change various foreground and
background colors.
Query
A request by M-Trend for information from the current database. The
M-Trend document shows the results of the most recent query.
Defining M-Trend Documents
5-7
Procedure Overview
Table 5-1: Defining M-Trend Documents
To Do This
Follow These Steps:
Set General Options for an
M-Trend Document
On the Edit menu, select Edit Trend. Select
the General tab. Fill in the fields. Click OK.
Select the Data Sources for an
M-Trend Document
On the Edit menu, select Edit Trend. Select
the Data Source tab. Click Browse. Select data
sources from the list. Click Add. Click OK.
Remove Data Sources from an
M-Trend Document
On the Edit menu, select Edit Trend. Select
the Data Source tab. Select a data source
from the list. Click Remove. Click OK.
Set Data Range for an M-Trend
Document
On the Edit menu, select Edit Trend. Select
the Data Range tab. Fill in the fields. Click OK.
Set Data Source Options for an
M-Trend Document
On the Edit menu, select Edit Trend. Select
the Data Source Options tab. Select a Data
Source Name. Fill in the fields. Click OK.
Set Plot Style for an M-Trend
Document
On the Edit menu, select Edit Trend. Select
the Plot Style tab. Fill in the fields. Click OK.
Set Fonts and Colors for an
M-Trend Document
On the Edit menu, select Edit Trend. Select
the Fonts/Colors tab. Choose the fonts, font
styles, and colors desired. Click OK.
5-8
Operator’s Guide
Detailed Procedures
The following procedures assume M-Trend is already connected to a
Historian database. For instructions on connecting to a data source or
information about data types in general, please refer to Connecting
M-Trend to a Database in this manual.
Setting General Options for an M-Trend Document
To set the General options for an M-Trend document:
1.
On the Edit menu, select Edit Trend or click the Edit View icon.
The M-Trend Definition dialog box appears (Figure 5-2).
Figure 5-2: M-Trend Definition Dialog Box: General Tab
2.
Select the General tab.
3.
Fill in the fields using Table 5-2.
Defining M-Trend Documents
5-9
Table 5-2: General Tab
Field
Description
Main Title
Title displayed with M-Trend document when displayed. Default
file name when saving document.
Sub Title
Additional heading to be associated with the given M-Trend
document.
Grid Lines: Show X axis grid lines.
Toggles the horizontal grid lines in Graphic View.
Grid Lines: Show Y axis grid lines.
Toggles the vertical grid lines in Graphic View.
Numeric Precision
Determines precision of data by specifying the number of digits
to be displayed after the decimal point.
Y Axis Mode: Fixed Y axis
Used to view individual data sources on the same graph.
Y Axis Mode: Stacked Y axis
Allows the viewing of separate data sources to compare sources
of different scales. The first six data source names are graphed.
Fixed Y Axis Range: High
Allows the setting of an upper boundary for the Y axis. Data that
is higher is truncated in the Graphic View. When set to Auto, the
upper limit of the Y axis is based on available data.
Fixed Y Axis Range: Low
Allows the setting of a lower boundary for the Y axis. Data that is
lower is truncated in the Graphic View. When set to Auto, the
lower limit of the Y axis is based on available data.
Load table at startup.
Allows you to load both the graph and the table simultaneously.
Default is unchecked, which loads graph only on startup.
4.
Click OK.
5-10
Operator’s Guide
Selecting Data Sources for an M-Trend Document
To select Data Sources for an M-Trend query:
1.
On the Edit menu, select Edit Trend or click the Edit View icon.
The M-Trend Definition dialog box appears (Figure 5-2).
Figure 5-3: M-Trend Definition Dialog Box: Data Source Tab
2.
Select the Data Source tab. Figure 5-3 shows a Data Source tab
with several Data Source Names.
3.
Type the Data Source Name or click the Browse button for a list
of available data sources (Figure 5-4).
Defining M-Trend Documents
5-11
Figure 5-4: Add Data Source Dialog Box
4.
Select up to 32 data sources and click Add.
5.
Click Done to return to the M-Trend Definition screen
(Figure 5-3).
Notes:
Only the first six Data Source Names listed in the Data
Source tab are shown in the graph. Samples from all 32 Data
Sources are displayed in the text view.
Data Source Names that do not appear in a graphical view
because they are not in the first six listed on the Data Source
tab can be repositioned so they do appear on the graph.
Reposition them by selecting and dragging into the top six.
You may select the same data source multiple times by
clicking add more than once.
6.
Click OK in the M-Trend Definition dialog box.
5-12
Operator’s Guide
Removing Data Sources for an M-Trend Document
To remove Data Sources from an M-Trend query:
1.
On the Edit menu, select Edit Trend or click the Edit View icon.
The M-Trend Definition dialog box appears (Figure 5-2).
2.
Select the Data Source tab. Figure 5-3 shows a Data Source tab
with several Data Source Names.
3.
Select the data source you want removed and click Remove.
4.
When finished removing data sources, click OK.
Defining M-Trend Documents
5-13
Setting Data Range for an M-Trend Document
To set the Data Range options for an M-Trend document:
1.
On the Edit menu, select Edit Trend or click the Edit View icon.
The M-Trend Definition dialog box appears.
Figure 5-5: M-Trend Definition Dialog Box: Data Range Tab
2.
Select the Data Range tab (Figure 5-5).
3.
Fill in the fields using actual dates and times or wild cards. See
the Key Concepts section of this chapter for a discussion of
available wild card terms.
4.
Set Refresh Rate to set the length of time between database
updates to the screen.
5-14
Operator’s Guide
Note:
5.
This parameter is only enabled when a relative study range is
selected using wild cards such as Today or Now. The view
changes only if new samples have been added to the
database since the last time the query was requested.
Click OK.
Setting Data Source Options for an M-Trend Document
To set the Data Source options for an M-Trend document:
1.
On the Edit menu, select Edit Trend or click the Edit View icon.
The M-Trend Definition dialog box appears.
Figure 5-6: M-Trend Definition Dialog Box:
Data Source Options Tab
2.
Select the Data Source Options tab (Figure 5-6).
3.
Fill in the fields using Table 5-3.
4.
Click OK.
Defining M-Trend Documents
5-15
Table 5-3: Data Source Options Tab
Field
Description
Data Source Name
Drop down box that allows you to select which data source is
currently available for editing.
Data Source Description
You may add text to represent the present data source. If text is
entered, it replaces the data source name in the graph legend.
Units
Allows you to override the default engineering units. Units specified
here are seen in both the graph and grid.
Time Offset
The time value entered for the time offset is subtracted from the
current data range and plotted on it. For example, if the offset set to
one day, the data from the day before is plotted on today’s time
range.
Note that to compare data from the same data source at different
times, the offset version should be given the same name with
different capitalization. That is “99.Outside Air” can be compared to
an offset “99.outside air” to use the offset capability.
Pen Style
Allows you to set line options such as thickness and solid or dotted.
Pen Color
Specifies color of individual data sources in graph.
Aggregate Functions: Function
All Data - Shows all available data.
Average - Returns the average (arithmetic mean) of the values of the
selected data sources.
Maximum - Returns the largest value in a set of values.
Minimum - Returns the smallest number in a set of values.
Range - Returns the difference between the Minimum and Maximum
values in a set of values.
Standard Deviation - Estimates standard deviation based on a
sample.
Sum – Adds all the numbers in a range of data sources.
Variance - Estimates variance based on a sample.
Aggregate Functions: Data Interval
Determines the interval between samples on which the aggregate
data is calculated.
Y Axis Range: High
For stacked graphs, allows override of the calculated ranges.
Y Axis Range: Low
For stacked graphs, allows override of the calculated ranges.
Plotting Method: Continuous Data
Assumes a linear change in value between samples and draws a
straight line between them.
Plotting Method: Discrete Data
Shows each sample as an event, that is, the value changes abruptly
for each new sample, with the value staying constant until the next
sample is plotted.
5-16
Operator’s Guide
Setting Plot Style for an M-Trend Document
To set the Plot Style for an M-Trend document:
1.
On the Edit menu, select Edit Trend or click the Edit View icon.
The M-Trend Definition dialog box appears.
Figure 5-7: M-Trend Definition Dialog Box: Plot Style Tab
2.
Select the Plot Style tab (Figure 5-7).
3.
Select the Axis and Plot Style you want for the current document.
4.
Select Mark Data Points if you would like each data point to be
marked with a small dot in Graphic View.
5.
Click OK.
Defining M-Trend Documents
5-17
Setting Fonts and Colors for an M-Trend Document
To set the fonts and colors for an M-Trend document:
1.
On the Edit menu, select Edit Trend or click the Edit View icon.
The M-Trend Definition dialog box appears.
Figure 5-8: M-Trend Definition Dialog Box:
Fonts/Colors Tab
2.
Select the Fonts/Colors tab (Figure 5-8).
3.
Select the fonts you want for the current document. Clicking on
the browse button displays a list of available fonts and styles.
4.
Select bold, italic, or underline if desired.
5.
Click on a colored box in the colors section of the dialog box to
open the color palette. Select a new color.
6.
Click OK.
5-18
Operator’s Guide