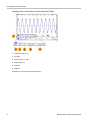
1
xx
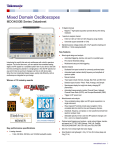
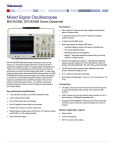
MDO3000 Series
Mixed Domain Oscilloscopes
ZZZ
User Manual
www.tektronix.com
077-0968-00
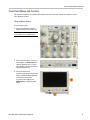
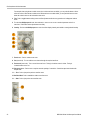
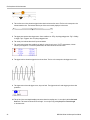
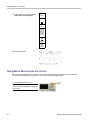
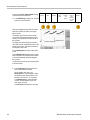
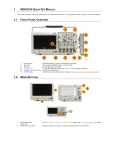
Get Acquainted with the Instrument
Front Panel Menus and Controls
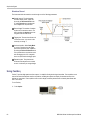
The front panel has buttons and controls for the functions that you use most often. Use the menu buttons to access
more specialized functions.
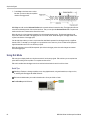
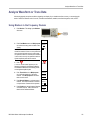
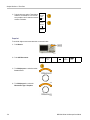
Using the Menu System
To use the menu system:
1. Push a front panel menu button to
display the menu that you want to use.
NOTE. The B1 and B2 buttons support up
to two different serial or parallel buses.
2. Push a lower menu button. If a pop-out
menu appears, turn Multipurpose a to
select the desired choice. If a pop-up
menu appears, push the button again to
select the desired choice.
3. Push a side menu button.
If the menu item contains more than one
choice, push the side button repeatedly
to cycle through the choices.
If a pop-out menu appears, turn
Multipurpose a to select the desired
choice.
MDO3000 Series Oscilloscopes User Manual
37
Get Acquainted with the Instrument
4. To remove a side menu, push the lower
button again or push Menu Off.
5. Certain menu choices require you to
set a numeric value to complete the
setup. You can use the upper and lower
multipurpose knobs a and b to adjust
values. You can also set many numerical
values with the 10-digit keypad on the
front panel.
6. Push Fine to turn off or on the ability to
make smaller adjustments.
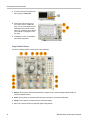
Using the Menu Buttons
Use the menu buttons to perform many functions in the oscilloscope.
1. Measure. Push to perform automated measurements on waveforms and to access the digital voltmeter (DVM) and
waveform histogram functions.
2. Search. Push to perform an automated search through an acquisition for user-defined events/criteria.
3. Autoset. Push to perform an automatic setup of oscilloscope settings.
4. Test. Push to activate advanced or application-specific testing features.
38
MDO3000 Series Oscilloscopes User Manual
Get Acquainted with the Instrument
5. Acquire. Push to set the acquisition mode and adjust the record length.
6. Trigger Menu. Push to specify trigger settings.
7. M. Push to manage the math waveform, including the display or removal of the math waveform from the display.
8. R. Push to manage reference waveforms, including the display or removal of each reference waveform from the display.
9. B1 or B2. Push to define and display a serial bus if you have the appropriate application modules. Parallel bus support
is available on MDO3000 products with the MDO3MSO option installed. Also, push the B1 or B2 button to display or
remove the corresponding bus from the display.
10. AFG. Push to enable the arbitrary function generator output and access the AFG menu.
11. Vertical Position. Turn to adjust the vertical position of the corresponding waveform. Push to center the waveform
baseline indicator.
12. Channel 1, 2, 3, or 4 Menu. Push to set vertical parameters for input waveforms and to display or remove the
corresponding waveform from the display.
13. Vertical Scale. Turn to adjust the vertical scale factor of the corresponding waveform (volts/division). Push the
front-panel Fine button to make smaller adjustments.
Below the display buttons
Use the buttons below the display to perform many functions in the oscilloscope.
1. Save / Recall Menu. Push to define the
Save button to save and recall setups,
waveforms, or screen images to internal
memory, a USB flash drive, or a mounted
network drive.
2. Default Setup. Push to perform an
immediate restore of the oscilloscope to
the default settings.
3. Utility. Push to activate the system utility
functions, such as selecting a language
or setting the date/time.
MDO3000 Series Oscilloscopes User Manual
39
Get Acquainted with the Instrument
4. B1 or B2. Push to define and display a
bus if you have the appropriate module
application keys.
MDO3AERO supports MIL-STD-1553
buses.
MDO3AUDIO supports I2S, Left
Justified (LJ), Right Justified (RJ),
and TDM buses.
MDO3AUTO supports CAN and LIN
buses.
MDO3EMBD supports I2C and SPI
buses.
MDO3COMP supports RS-232,
RS-422, RS-485, and UART buses.
MDO3FLEX supports FlexRay buses.
MDO3USB supports USB 2.0 buses.
Also, push the B1 or B2 button to display
or remove the corresponding bus from
the display.
5. R. Push to manage reference waveforms
and traces, including the display or
removal of each reference waveform or
trace from the display.
6. M. Push to manage the math waveform
or trace, including the display or removal
of the math waveform or trace from the
display.
40
MDO3000 Series Oscilloscopes User Manual
Get Acquainted with the Instrument
Using Spectral Analysis Controls
These buttons configure the acquisition and display of the RF input.
1. RF. Push to bring up the frequency
domain display and menu. The RF menu
provides access to the Spectrogram
display.
2. Freq/Span. Push to specify the portion
of the spectrum to view on the display.
Set the center frequency and the span –
or set the start and stop frequency.
3. Ampl. Push to set the reference level.
4. BW. Push to define the resolution
bandwidth.
5. Markers. Push to set automatic or
manual markers.
Using Other Controls
1. Cursors. Push once to activate the two vertical cursors. Push again to turn off all cursors. Push and hold to bring up the
cursor menu. Use the menu to select the cursor features, such as type, source, orientation, linked status, and units.
When the cursors are on, you can turn the multipurpose knobs to control their position.
2. Turn the upper multipurpose knob a, when activated, to move a cursor, to set a numerical parameter value for a menu
item, or to select from a pop-out list of choices. Push the Fine button to toggle between coarse and fine adjustment.
Screen icons tell you when a or b are active.
3. Select. Push to activate special functions.
MDO3000 Series Oscilloscopes User Manual
41
Get Acquainted with the Instrument
For example, when using the two vertical cursors (and no horizontal ones are visible), you can push this button to link or
unlink the cursors. When the two vertical and two horizontal cursors are both visible, you can push this button to make
either the vertical cursors or the horizontal cursors active.
4. Fine. Push to toggle between making coarse and fine adjustments with the many operations of multipurpose knobs a
and b
5. Turn the lower Multipurpose b knob, when activated, to move a cursor or set a numerical parameter value for a
menu item. Push Fine to make adjustments more slowly.
6. Intensity. Push to enable Multipurpose a to control waveform display intensity and knob b to control graticule intensity.
7. Zoom button. Push to activate zoom mode.
8. Pan (outer knob). Turn to scroll the zoom window through the acquired waveform.
9. Zoom-scale (inner knob). Turn to control the zoom factor. Turning it clockwise zooms in further. Turning it
counterclockwise zooms out.
10. Play-pause button. Push to start or stop the automatic panning of a waveform. Control the speed and direction with
the pan knob.
11. ← Prev. Push to jump to the previous waveform mark.
12. Set/Clear Mark. Push to establish or delete a waveform mark.
13. → Next. Push to jump to the next waveform mark.
42
MDO3000 Series Oscilloscopes User Manual
Get Acquainted with the Instrument
14. Horizontal Position. Turn to adjust the trigger point location relative to the acquired waveforms. Push to center
when delay is on. Push to set to 10% when delay is off.
15. Horizontal Scale. Turn to adjust the horizontal scale (time/division).
16. Autoset. Push to automatically set the vertical, horizontal, and trigger controls for a usable, stable display.
17. Single. Push to make a single sequence acquisition.
18. Run/Stop. Push to start or stop acquisitions.
19. Trigger Level. Turn to adjust the trigger level.
Push Level to Set 50%. Push the Trigger level knob to set the trigger level to the midpoint of the waveform.
20. Force Trig. Push to force an immediate trigger event.
MDO3000 Series Oscilloscopes User Manual
43
Get Acquainted with the Instrument
21. Print. Push to print to the selected printer.
22. Power switch. Push to power on or off the oscilloscope.
23. USB 2.0 Host port. Insert a USB peripheral to the oscilloscope, such as a keyboard or a flash drive.
24. Save. Push to perform an immediate save operation. The save operation uses the current save parameters, as defined
in the Save / Recall menu.
25. Save / Recall Menu. Push to save and recall setups, waveforms, and screen images to internal memory, or a USB
flash drive.
26. Default Setup. Push to perform an immediate restore of the oscilloscope to the default settings.
27. Utility. Push to activate the system utility functions, such as selecting a language or setting the date/time.
28. D15 - D0. Push to display or remove the digital channels from the display, and to access the digital channel setup
menu (with option MDO3MSO only).
29. Menu Off. Push to clear a displayed menu from the screen.
44
MDO3000 Series Oscilloscopes User Manual
Get Acquainted with the Instrument
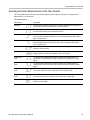
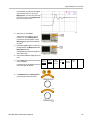
Identifying Items in the Time Domain Display
The items shown in the graphic below may appear in the display. Not all of these items are visible at any given time. Some
readouts move outside the graticule area when menus are turned off.
1. The acquisition readout shows when an acquisition is running, stopped, or when acquisition preview is in effect. Run =
acquisitions enabled. Stop = Acquisitions not enabled. Roll = roll mode (40 ms/div or slower). PreVu = The oscilloscope
is stopped or between triggers. You can change the horizontal or vertical position or scale to see approximately what the
next acquisition will look like. A/B = When using the average acquisition mode, B shows the total number of acquisitions to
be averaged (set this using the Acquisition Mode side menu), and A shows the current progress towards this total number.
2. The trigger position icon shows the trigger position in the acquisition.
3. The expansion point icon (an orange triangle) shows the point that the horizontal scale expands and compresses around.
To make the expansion point the same as the trigger point, push Acquire and set the lower menu Delay item to Off.
MDO3000 Series Oscilloscopes User Manual
45
Get Acquainted with the Instrument
4. The waveform record view shows the trigger location relative to the waveform record. The line color corresponds to the
selected waveform color. The brackets show the part of the record currently displayed on the screen.
5. The trigger status readout shows trigger status. Status conditions are: PrTrig: Acquiring pretrigger data. Trig? = Waiting
for trigger. Trig’d: Triggered. Auto: Acquiring untriggered data.
6. The security icon indicates when the I/O ports are disabled.
7. The cursor readout shows time, amplitude, and delta (Δ) values for each cursor. For FFT measurements, it shows
frequency and magnitude. For serial and parallel buses, the readout shows the decoded values.
8. The trigger level icon shows the trigger level on the waveform. The icon color corresponds to the trigger source color.
9. The trigger readout shows the trigger source, slope, and level. The trigger readouts for other trigger types show other
parameters.
10. The top line of the record length/sampling rate readout shows the sampling rate. You can adjust it with the Horizontal
Scale knob. The bottom line shows the record length. You can adjust it by pushing Acquire and Record Length
on the lower menu.
46
MDO3000 Series Oscilloscopes User Manual
Get Acquainted with the Instrument
11. The horizontal position/scale readout shows on the top line the horizontal scale (adjust with the Horizontal Scale knob).
With Delay Mode on, the bottom line shows the time from the T symbol to the expansion point icon (adjust with the
Horizontal Position knob). Use horizontal position to insert added delay between when the trigger occurs and when you
actually capture the data. Insert a negative time to capture more pretrigger information. With Delay Mode off, the bottom
line shows the time location of the trigger within the acquisition, as a percentage.
12. The Timing Resolution readout shows the timing resolution of the digital channels. Timing resolution is the time between
samples. It is the reciprocal of the digital sample rate. When the MagniVu control is on, “MagniVu” appears in the readout.
13. Measurement readouts show the selected measurements. You can select up to four measurements to display at one
symbol appears instead of the expected numerical measurement if a vertical clipping condition exists. Part of
time. A
the waveform is above or below the display. To obtain a proper numerical measurement, turn the vertical scale and
position knobs to make all of the waveform appear in the display.
14. The auxiliary waveform readouts show the vertical and horizontal scale factors of the math and reference waveforms.
15. The channel readout shows the channel scale factor (per division), coupling, invert, and bandwidth status. Adjust with the
Vertical Scale knob and in the channel 1, 2, 3, or 4 menus.
16. For digital channels, the baseline indicators point to the high and low levels. The indicator colors follow the color code
used on resistors. The D0 indicator is black, the D1 indicator is brown, the D2 indicator is red, and so on.
MDO3000 Series Oscilloscopes User Manual
47
Get Acquainted with the Instrument
17. The group icon indicates when digital channels are grouped.
18. The bus display shows decoded packet level information for serial buses or for parallel buses. The bus indicator
shows the bus number and bus type.
19. For analog channels, the waveform baseline indicator shows the zero-volt level of a waveform, assuming you have not
used any offset. The icon colors correspond to the waveform colors.
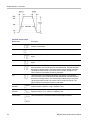
Identifying Items in the Frequency Domain Display
Activate the frequency domain display by pressing the front panel RF button.
48
MDO3000 Series Oscilloscopes User Manual
Get Acquainted with the Instrument
1. Vertical graticule labels
2. Start frequency
3. Reference level
4. Vertical scale
5. Center frequency
6. Span and resolution bandwidth
7. Stop frequency
8. Reference marker
MDO3000 Series Oscilloscopes User Manual
49
Get Acquainted with the Instrument
Identifying Items in the Arbitrary Function Generator Display
1. If visible, the output is on
2. AFG label
3. Waveform type, e.g. “Sine”
4. Additive Noise icon
5. Frequency
6. Amplitude
(See page 183, Use the Arbitrary Function Generator.)
50
MDO3000 Series Oscilloscopes User Manual
Get Acquainted with the Instrument
Identifying Items in the Digital Voltmeter Display
1. Measurement type (AC+DC RMS, DC, AC RMS, or Frequency)
2. Numerical value of the current measurement
3. Graphic (min, max, value, five-second rolling range)
The number on the left side of the graphic’s linear scale is the minimum value of the range (e.g. 0.000 V).
The number on the right side of the graphic’s linear scale is the maximum value of the range (e.g. 400.0 mV).
The gray bar shows the five second rolling average of measurements.
The inverted triangle shows the location on the scale of the current measurement value.
4. Minimum measurement value recorded since you powered on the instrument or since you last pushed the Reset
DVM Statistics menu item.
5. Maximum measurement value recorded since you powered on the instrument or since you last pushed the Reset
DVM Statistics menu item.
6. Average of all measurement values recorded since you powered on the instrument or since you last pushed the Reset
DVM Statistics menu item.
7. Frequency
NOTE. An “Over bandwidth” message appears for voltage measurements ≥ 10 kHz. An “Under bandwidth” message
appears for voltage measurements ≤ 10 Hz. A “?” message appears next to min or max measurements that have gone
out of bounds. Push Reset DVM Statistics to remove the “?” from the display.
(See page 131, Taking Digital Voltmeter Measurements.).
MDO3000 Series Oscilloscopes User Manual
51
Get Acquainted with the Instrument
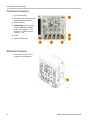
Front Panel Connectors
1. Logic Probe Connector
2. Channel 1, 2, 3, 4. Channel inputs with
TekVPI Versatile Probe Interface.
3. RF input connector.
4. PROBE COMP. Square wave signal
source to compensate or calibrate
probes. Output voltage: 0 – 2.5 V,
amplitude ± 1% behind 1 kΩ ±2%.
Frequency: 1 kHz.
5. Ground.
6. Application Module Slots.
Side-Panel Connector
1. Ground strap connector. This is a
receptacle for a grounding strap.
52
MDO3000 Series Oscilloscopes User Manual
Get Acquainted with the Instrument
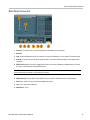
Rear-Panel Connectors
1. AFG OUT. Use the AFG OUT port to transmit signals from the arbitrary function generator.
2. AUX OUT
3. LAN. Use the LAN (Ethernet) port (RJ-45 connector) to connect the oscilloscope to a 10/100 Base-T local area network.
4. Video Out. Use the Video Out port (DB-15 female connector) to show the oscilloscope display on an external monitor
or projector.
5. USB 2.0 Device port. Use the USB 2.0 High Speed Device port to connect a PictBridge compatible printer, or for direct
PC control of the oscilloscope using USBTMC protocol.
NOTE. The cable connected from the USB 2.0 Device port to the host computer must meet the USB2.0 specification for high
speed operation when connected to a high speed host controller.
6. USB 2.0 Host port. Use the USB 2.0 High Speed Host port to connect a USB memory device or USB keyboard.
7. Power input. Attach to an AC power line with integral safety ground.
8. Lock. Use to secure the oscilloscope.
9. VESA mount. 75 mm.
MDO3000 Series Oscilloscopes User Manual
53
Acquire the Signal
Acquire the Signal
This section describes concepts of and procedures for setting up the oscilloscope to acquire the signal as you want it to.
Setting Up Analog Channels
Use front panel buttons and knobs to set up your instrument to acquire signals using the analog channels.
1. Connect the
TPP0250/TPP0500B/TPP1000 or VPI
probe to the input signal source.
2. Select the input channel by pushing the
front panel buttons.
NOTE. If you are using a probe that does not
supply probe encoding, set the attenuation
(probe factor) in the oscilloscope vertical
menu for the channel to match the probe.
3. Push Default Setup.
4. Push Autoset.
54
MDO3000 Series Oscilloscopes User Manual
Acquire the Signal
5. Push the desired channel button. Then
adjust the vertical position and scale.
6. Adjust the horizontal position and scale.
The horizontal position determines the
number of pretrigger and posttrigger
samples.
The horizontal scale determines the size
of the acquisition window relative to the
waveform. You can scale the window to
contain a waveform edge, a cycle, several
cycles, or thousands of cycles.
Quick Tip
Use the zoom feature to see multiple cycles of your signal in the upper part, and a single cycle in the lower part of the
display. (See page 147, Using Wave Inspector to Manage Long Record Length Waveforms.)
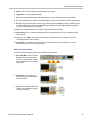
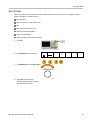
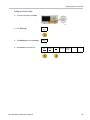
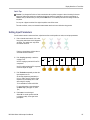
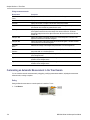
Labeling Channels and Buses
You can add a label to the channels and buses shown on the display for easy identification. The label is placed on the
waveform baseline indicator in the left side of the screen. The label can have up to 32 characters.
To label a channel, push a channel input button for an analog channel.
1. Push a front panel button for an input
channel or a bus.
MDO3000 Series Oscilloscopes User Manual
55
Acquire the Signal
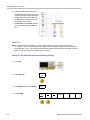
2. Push a lower menu button to create a label,
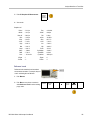
such as for channel 1 or B1.
3. Push Choose Preset Label to view a list
of labels.
Label
Choose
Preset
Label
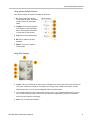
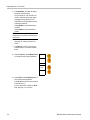
4. Turn Multipurpose b to scroll through the
list to find a suitable label. You can edit the
label after you insert it if necessary.
5. Push Insert Preset Label to add the label.
Insert
Preset
Label
If you are using a USB keyboard, use the
arrow keys to position the insertion point
and edit the inserted label, or type in a new
label. (See page 35, Connecting a USB
Keyboard to Your Oscilloscope.)
6. If you do not have a USB keyboard
connected, push the side and lower menu
arrow keys to position the insertion point.
56
MDO3000 Series Oscilloscopes User Manual
Acquire the Signal
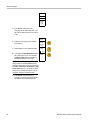
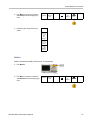
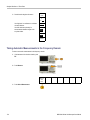
7. Turn Multipurpose a to scroll through the
list of letters, numbers, and other characters
to find the character in the name that you
want to enter.
ABCDEFGHIJKLMNOPQRSTUVWXYZ
abcdefghijklmnopqrstuvwxyz
0123456789_=+-!@#$%^&*()[]{}<>/~'”\|:,.?
8. Push Select or Enter Character to let the
oscilloscope know that you have picked the
proper character to use.
You can use the lower menu buttons to edit
the label as needed.
Enter
Character
Back
Space
Delete
Clear
9. Continue scrolling and pushing Select until
you have entered all the desired characters.
For another label, push the side and lower
menu arrow keys to reposition the insertion
point.
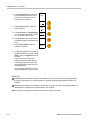
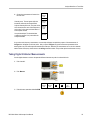
10. Push Display Labels and select On to see
the label.
Display
Labels
On| Off
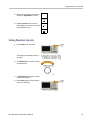
Using the Default Setup
To return the oscilloscope to its default settings:
1. Push Default Setup.
2. If you change your mind, push Undo
Default Setup to undo the last default
setup.
MDO3000 Series Oscilloscopes User Manual
Undo
Default
Setup
57
Acquire the Signal
Using Autoset
Autoset adjusts the instrument (acquisition, horizontal, trigger, and vertical controls) such that it displays four or five waveform
cycles for analog channels with the trigger near the midlevel, and ten cycles for digital channels.
Autoset works with both the analog and digital channels.
1. To autoset an analog channel, connect the
analog probe, and then select the input
channel. (See page 54, Setting Up Analog
Channels.)
To autoset a digital channel, connect
the logic probe and select the input
channel. (See page 79, Setting Up Digital
Channels.)
2. Push Autoset to execute an Autoset.
3. If desired, push Undo Autoset to undo
the last Autoset.
Undo
Autoset
You can also disable the Autoset function. To disable or enable the Autoset function:
1. Push and hold Autoset.
2. Push and hold Menu Off.
3. Release Menu Off, and then release
Autoset.
58
MDO3000 Series Oscilloscopes User Manual
Acquire the Signal
4. Select the desired setting using the side
menu.
Autoset
Enabled
Autoset
Disabled
Quick Tips
To position the waveform appropriately, Autoset may change the vertical position. Autoset always sets vertical offset
to 0 V.
If you use Autoset when no channels are displayed, the instrument turns on channel 1 and scales it.
If you use Autoset and the oscilloscope detects a video signal, the oscilloscope automatically sets the trigger type to
video and makes other adjustments to display a stable video signal.
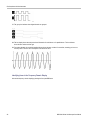
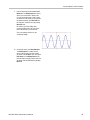
Acquisition Concepts
Before a signal can be displayed, it must pass through the input channel where it is scaled and digitized. Each channel
has a dedicated input amplifier and digitizer. Each channel produces a stream of digital data from which the instrument
extracts waveform records.
Sampling Process
Acquisition is the process of sampling an
analog signal, converting it into digital
data, and assembling it into a waveform
record, which is then stored in acquisition
memory.
Input signal
Sampled points
Digital values
Real-Time Sampling
MDO3000 Series oscilloscopes use
real-time sampling. In real-time sampling,
the instrument digitizes all of the points it
acquires using a single trigger event.
Record points
Sampling rate
MDO3000 Series Oscilloscopes User Manual
59
Acquire the Signal
Waveform Record
The instrument builds the waveform record through use of the following parameters:
Sample interval: The time between
recorded sample points. Adjust this
by turning the Horizontal Scale knob
or pushing Acquire and changing the
record length in the Acquire menu.
Record length: The number of samples
required to fill a waveform record. Set
this by pushing the Acquire button and
using the lower and side menus.
Trigger point: The zero time reference in
a waveform record. It is shown on the
screen by an orange T.
Horizontal position: When Delay Mode
is on, this is the time from the trigger
point to the expansion point. Adjust this
by turning the Horizontal Position knob.
Use a positive time to acquire the record
after the trigger point. Use a negative
time to acquire it before the trigger point.
Expansion point: The point that the
horizontal scale expands and contracts
around. It is shown by an orange triangle.
Using FastAcq
FastAcq™ provides high-speed waveform capture. It is helpful in finding elusive signal anomalies. Fast acquisition mode
reduces the dead time between waveform acquisitions, enabling the capture and display of transient events such as
glitches and runt pulses. Fast acquisition mode can also display waveform phenomena at an intensity that reflects their
rate of occurrence.
To use FastAcq:
1. Push Acquire.
60
MDO3000 Series Oscilloscopes User Manual
Acquire the Signal
2. Push FastAcq.
Mode
Sample
Record
Length
10k
FastAcq
Off
Delay
On Off
Set Horiz.
Position to
10%
Waveform
Display
XY Display
Off
FastACq
3. Toggle the FastAcq side-menu button to
select On.
Fast Acq
4. Push Waveform Palette.
Waveform
Palette
a Temperature
On Off
5. Turn the Multipurpose a knob to select the
desired display palette.
The display palette lets you enhance the visibility
of events. This choice uses intensity grading to
indicate how often rare transients occur relative
to normal signals. The choices are Temperature,
Spectral, Normal and Inverted.
Temperature uses color-grading to indicate
frequency of occurrence with hot colors like
red/yellow indicating frequently occurring events
and colder colors like blue/green indicating
rarely occurring events.
Spectral uses color-grading to indicate
frequency of occurrence with colder colors like
blue indicating frequently occurring events and
hot colors like red indicating rarely occurring
events.
Normal uses the default channel color (like
yellow for channel one) along with gray-scale
to indicate frequency of occurrence where
frequently occurring events are bright.
Inverted uses the default channel color
along with gray scale to indicate frequency of
occurrence where rarely occurring events are
bright.
These color palettes help highlight the events
that over time occur more often or, in the case of
infrequent anomalies, occur less often.
MDO3000 Series Oscilloscopes User Manual
61
Acquire the Signal
How the Analog Acquisition Modes Work
Sample mode retains the first sampled point
from each acquisition interval. Sample is the
default mode.
Peak Detect mode uses the highest and
lowest of all the samples contained in two
consecutive acquisition intervals. This mode
only works with real-time, noninterpolated
sampling and is useful for catching high
frequency glitches.
Hi Res mode calculates the average of all
the samples for each acquisition interval.
This mode also only works with real-time,
noninterpolated sampling. Hi-Res provides
a higher-resolution, lower-bandwidth
waveform.
Envelope mode finds the highest and lowest
record points over all acquisitions. Envelope
uses Peak Detect for each individual
acquisition.
Average mode calculates the average value
for each record point over a user-specified
number of acquisitions. Average uses
Sample mode for each individual acquisition.
Use average mode to reduce random noise.
Changing the Acquisition Mode, Record Length, and Delay Time
Use this procedure to change the acquisition mode.
1. Push Acquire.
2. Push Mode.
62
Mode
Sample
Record
Length
10k
FastAcq
Off
Delay
On Off
Set Horiz.
Position to
10%
Waveform
Display
XY Display
Off
MDO3000 Series Oscilloscopes User Manual
Acquire the Signal
3. Then choose the acquisition mode from the
side menu. You can chose from: Sample,
Peak Detect, Hi Res, Envelope, or Average.
Acquisition
Mode
Sample
Peak
Detect
Hi Res
Envelope
Average
16
NOTE. Peak Detect and Hi Res modes take advantage of sample points that the oscilloscope would have discarded at lower
sweep speeds. Therefore, these modes only work when the current sample rate is less than the maximum possible sample
rate. As soon as the oscilloscope starts to acquire at the maximum sample rate, then the Peak Detect, Hi Res and Sample
modes all look the same. You can control the sample rate by setting the Horizontal scale and the Record Length.
4. If you chose Average, turn Multipurpose a
to set the number of waveforms to average
over.
5. Push Record Length.
6. Scroll through the available choices.
Choose among 1000, 10 k, 100 k, 1 M, 5 M,
and 10 M points.
MDO3000 Series Oscilloscopes User Manual
63
Acquire the Signal
7. Push Delay on the lower menu to select
On when you want to delay the acquisition
relative to the trigger event.
With Delay set to On, turn the Horizontal Position knob counterclockwise to increase the delay. The trigger point will move
to the left and ultimately outside of the acquired waveform. Then you can adjust the Horizontal Scale knob to acquire more
detail around the area of interest at the center of the screen.
When this delay is on, the trigger point separates from the horizontal expansion point. The horizontal expansion point
stays at the center of the screen. The trigger point can move off the screen. When this happens, the trigger marker turns
to point in the direction of the trigger point.
Use the delay feature when you want to acquire waveform detail that is separated from the trigger event by a significant
interval of time. For example, you can trigger on a sync pulse that occurs once every 10 ms and then look at high-speed
signal characteristics that occur 6 ms after the sync pulse.
When the delay feature is set to Off, the expansion point is tied to the trigger point so that scale changes are centered
around the trigger point.
Using Roll Mode
Roll mode gives a display similar to a strip chart recorder for low-frequency signals. Roll mode lets you see acquired data
points without waiting for the acquisition of a complete waveform record.
Roll mode is enabled when the trigger mode is auto and the horizontal scale is set to 40 ms/div or slower.
Quick Tips
Switching to Envelope or Average acquisition mode, using digital channels, using math waveforms, turning on a bus,
or switching to Normal trigger will disable Roll mode.
Roll mode is disabled when you set the horizontal scale to 40 ms per division or faster.
Push Run/Stop to halt Roll mode.
64
MDO3000 Series Oscilloscopes User Manual
Acquire the Signal
Act on Event
Tell the oscilloscope to perform a defined action after a defined event has occurred. The event can be a trigger or a certain
number of acquisitions. The action can be to:
Stop acquisitions
Save a waveform or a screen image to a file
Print
Send a pulse out the AUX OUT port
Generate a remote interface SRQ
Send an e-mail notification
Display a message on the oscilloscope display
1. Push Test.
2. Push Application on the lower-menu.
Application
Act on
Event
Event
Acquisition
Action
Repeat
Off
3. Turn Multipurpose a to select Act on Event
4. Push Event on the lower menu.
This brings up the event type side menu.
Select the desired event type.
MDO3000 Series Oscilloscopes User Manual
65
Acquire the Signal
Event Type
None
Trigger
Acquisitions
(a) 10
5. Push Actions on the lower menu.
This brings up the Actions side menu. Use
the menu to select an action to occur on the
event.
Actions
6. Select the action type from the resulting
pop-out menu.
Select
Actions
(a) Stop
Acq
7. Select whether or not to enable the action.
Enable
Action
On Off
8. If you selected E-mail Notification from the
list of actions above, you can now select
Configure E-mail from the side menu to
define the parameters of the e-mail.
Configure
E-mail
NOTE. There is a single set of SMTP server
settings saved for both Act on Event e-mail
notification and for the e-mail printer (set through
the Utility > Print Setup > Select Printer > Add
E-mail Printer menus). If you modify the SMTP
settings in one of these two locations, they will
be similarly modified in the other location.
9. Push Repeat. from the lower menu.
This lets you set how many times to repeat
the selected event and resulting action.
66
MDO3000 Series Oscilloscopes User Manual
Display Waveform or Trace Data
Display Waveform or Trace Data
This section contains concepts and procedures for displaying the acquired waveform or trace.
Adding and Removing a Waveform
1. To add or remove a waveform from the
display, push the corresponding front
panel channel button or the D15-D0
button.
You can use the channel as a trigger
source whether or not it is displayed.
Setting the Display Style and Persistence
1. To set the display style, push Acquire.
2. Push Waveform Display.
MDO3000 Series Oscilloscopes User Manual
Mode
Sample
Record
Length
10k
FastAcq
Off
Delay
On Off
Set Horiz.
Position to
10%
Waveform
Display
XY Display
On
101
Display Waveform or Trace Data
3. Push Dots Only On Off on the side menu.
Dots on will display the waveform record
points as dots on the screen. Dots off
connects the dots with vectors.
Waveform
Display
Dots Only
On Off
4. Push Persistence to Off to display the
display persistence.
Persistence
5. Push Persist Time, and turn Multipurpose
a to have waveform data remain on screen
for a user-specified amount of time.
Persist
Time
(a) Auto
6. Push Set to Auto to have the oscilloscope
automatically determine a persistence time
for you.
Set to Auto
7. Push Clear Persistence to reset the
persistence information.
Clear Persistence
On Off
8. To display the amplitude from one waveform
against the amplitude from another, push XY
Display. Then push Triggered XY from the
side menu.
A data point from the first waveform
specifies the horizontal location while the
corresponding data point from the second
waveform specifies the vertical location for
each displayed point.
You can optionally view both the YT and XY
displays simultaneously on the same screen.
Quick Tips
Variable persistence accumulates record points for a specified time interval. Each record point decays independently
according to the time interval. Use variable persistence for displaying infrequently appearing signal anomalies, such
as glitches.
Infinite persistence continuously accumulates record points until you change one of the acquisition display settings. Use
infinite persistence for displaying unique signal anomalies, such as glitches.
The XY Display mode graphs the data in fixed pairs of waveforms against one another.
102
MDO3000 Series Oscilloscopes User Manual
Display Waveform or Trace Data
Setting the Graticule Style
1. To set the graticule style, push Utility.
2. Push Utility Page.
Utility
Page
3. Turn Multipurpose a and select Display.
Display
4. Push Graticule on the lower menu.
Utility
Page
Display
MDO3000 Series Oscilloscopes User Manual
Backlight
Intensity
High
Graticule
Full
Screen
Annotation
Trigger
Frequency
Readout
103
Display Waveform or Trace Data
5. Select the desired style on the side menu.
The Frame graticule provides a clean screen
on which you can most easily read automatic
measurement results and other screen text.
The Full graticule can help you make cursor
measurements on hard copies.
The Grid, Solid, and Cross Hair graticules
provide compromises between Frame and
Full.
Quick Tips
You can display IRE and mV graticules. To do this, set the trigger type to video and set the vertical scale to
114 mV/division. (The 114 mV/division selection is available in the fine vertical scale settings for the channel when you
set the trigger type to video.) The oscilloscope will automatically display the IRE graticule for NTSC signals, and the mV
graticule for other video signals (PAL, SECAM, HDTV, and custom).
Setting the LCD Backlight Brightness and Dimming Settings
1. Push Utility.
2. Push Utility Page.
104
Utility
Page
3. Turn Multipurpose a and select Display.
Display
4. Push Backlight .
Utility
Page
Display
Backlight
High
Graticule
Full
Screen
Annotation
MDO3000 Series Oscilloscopes User Manual
Display Waveform or Trace Data
5. Select the intensity level on the side menu.
Choices are: High, Medium, and Low.
Backlight
Backlight
Intensity
High
6. Enabling Auto-Dim will turn down the
screen lighting after a set time. Using it may
help prolong the LCD life.
Auto-Dim
On Off
Time
60min
Setting Waveform Intensity
1. Push Intensity on the front panel.
This will bring up the intensity readout on
the display.
2. Turn Multipurpose a to select the desired
waveform intensity.
3. Turn Multipurpose b to select the desired
intensity for the graticule.
4. Push Intensity again to clear the intensity
readout from the display.
MDO3000 Series Oscilloscopes User Manual
105
Display Waveform or Trace Data
Scaling and Positioning a Waveform
Use the horizontal controls to adjust the time base, adjust the trigger point, and to examine waveform details more closely.
You can also use the Wave Inspector Pan and Zoom controls to adjust the display of waveforms. (See page 147, Using
Wave Inspector to Manage Long Record Length Waveforms.)
If you push the Horizontal Position knob and Delay is set to On, the horizontal position is set to 0 seconds. If you push it
and Delay is set to Off, the horizontal position is set to 10%.
Original waveform
Scaled horizontally
Positioned horizontally
Use the vertical controls to select waveforms, adjust the waveform vertical position and scale, and set input parameters.
Push a channel menu button (1, 2, 3, or 4), button as many times as needed and the associated menu items to select,
add, or remove a waveform.
Original waveform
106
Scaled vertically
Positioned vertically
MDO3000 Series Oscilloscopes User Manual
Display Waveform or Trace Data
Quick Tips
Preview. If you change the Position or Scale controls when the acquisition is stopped or when it is waiting for the next
trigger, the oscilloscope rescales and repositions the relevant waveforms in response to the new control settings. It
simulates what you will see when you next push the RUN button. The oscilloscope uses the new settings for the next
acquisition.
You may see a clipped waveform if the original acquisition went off the screen.
The math waveform, cursors, and automatic measurements remain active and valid when using preview.
Setting Input Parameters
Use the vertical controls to select waveforms, adjust the waveform vertical position and scale, and set input parameters.
1. Push a channel menu button 1, 2, 3, or 4 to
bring up the vertical menu for the designated
waveform. The vertical menu only affects
the selected waveform.
Pushing a channel button will also select or
cancel that waveform selection.
2. Push Coupling repeatedly to select the
coupling to use.
Use DC coupling to pass both AC and DC
components.
Coupling
DC| AC
Termination
1MΩ| 50Ω
Invert
On |Off
Bandwidth
Full
(1) Label
More
Use AC coupling to block the DC component
and show only the AC signal.
3. Push Termination repeatedly to select the
input impedance to use.
Set the input impedance (termination) to
50 Ω or 1 MΩ if using DC coupling. Input
impedance is automatically set to 1 MΩ
when using AC coupling.
75 Ω is available on models ≤ 500 MHz.
For more information on input impedance,
see Quick Tips. (See page 110, Quick
Tips.)
4. Push Invert to invert the signal.
Select Off for normal operation and On
to invert the polarity of the signal in the
preamplifier.
MDO3000 Series Oscilloscopes User Manual
107
Display Waveform or Trace Data
5. Push Bandwidth, and select the desired
bandwidth on the side menu.
The set choices are: Full, 250 MHz, and
20 MHz. Additional choices may appear,
depending on the probe that you use.
Select Full to set the bandwidth to the full
oscilloscope bandwidth.
Select 250 MHz to set the bandwidth to
250 MHz.
Select 20 MHz to set the bandwidth to
20 MHz.
NOTE. 100 MHz and 200 MHz model
oscilloscopes do not include a 250 MHz option
on the menu.
6. Push Label to create a label for the channel.
(See page 55, Labeling Channels and
Buses.)
7. Push More to access a pop-up menu of
additional features. These are described
below.
8. Select Fine Scale to enable Multipurpose
a to make fine vertical scale adjustments.
Fine Scale
Offset
Position
Probe
Setup
Deskew
9. Select Offset to enable Multipurpose a to
make vertical offset adjustments.
Push Set to 0 V on the side menu to set the
vertical offset to 0 V.
For more information on offset, see Quick
Tips. (See page 110, Quick Tips.)
108
MDO3000 Series Oscilloscopes User Manual
Display Waveform or Trace Data
10. Select Probe Setup to define probe
parameters.
On the side menu:
Select Voltage or Current to set the
probe type for probes that do not
have a TekProbe Level 1, TekProbe II
(requires a TPA-BNC adapter) or TekVPI
interface.
For probes that do not have a Tek
interface, when Probe Type is set to
Voltage, turn Multipurpose a to set
Attenuation to match the probe
For probes that do not have a Tek
interface, when Probe Type is set to
Current, turn Multipurpose a to set the
Amps/Volts ratio (Attenuation) to match
the probe.
If you are measuring current by probing
the voltage drop across a resistor,
set Measure Current to Yes. Push
A/V ratio on the side menu and turn
Multipurpose a to set the Amps/Volts
or Volts/Amp ratio of your setup. For
example, if you are measuring the drop
across a 2 Ω resistor, set the V/A ratio
to 2.
For some types of probes, you can push
this button to instruct the oscilloscope to
perform an AC calibration on the entire
signal path from the probe tip to the
specific oscilloscope channel. This can
result in a flatter frequency response
over the entire frequency range.
11. Select Deskew to make display and
measurement adjustments for probes that
have differing propagation delays. This is
especially important when using a current
probe in conjunction with a voltage probe.
For best results, use a deskew fixture, such
as the Tektronix 067-1686-xx.
MDO3000 Series Oscilloscopes User Manual
109
Display Waveform or Trace Data
If you do not have a deskew fixture, you
can use the controls in the Deskew menu to
set the oscilloscope's deskew parameters
to recommended values, based on the
nominal propagation delay of each probe.
The oscilloscope automatically loads the
nominal propagation delay values of TekVPI
and TekProbe II (requires use of a TPA-BNC
adaptor) probes. For other common probes,
first push Select on the side menu, and
select the channel to which the probe is
attached. Then push Probe Model on the
side menu, and select the probe model. If
your probe is not in the list, set probe model
to Other, and push Propagation Delay on
the side menu and dial in its propagation
delay with Multipurpose a.
To display the recommended deskew values
calculated by the oscilloscope, set Show
rec. deskews on the side menu to Yes.
To set the deskew values of each channel
to the recommended values, push Set all
deskews to recommended values on the
side menu.
Quick Tips
Using Probes with the TekProbe II and TekVPI Interfaces. When you attach a probe with the TekProbe II or the
TekVPI interface, the oscilloscope sets the channel sensitivity, coupling, and termination resistance automatically to
match the probe requirements. Tek Probe II probes require use of the TPA-BNC Adapter.
The Difference Between Vertical Position and Offset. Adjust the vertical position to place the waveforms where you
want to see them. The waveform baseline indicators indicate the zero Volts (or Amps) level for each waveform. If you
adjust the channel's Vertical Scale, the waveform expands or contracts around the waveform's baseline indicator.
When you use the Channel<x> > More >Offset > Vertical Offset control to move a waveform, the baseline indicator
no longer represents zero. Instead, it represents the level of the offset. If you adjust the channel's Vertical Scale, the
waveform expands or contracts around the waveform's baseline indicator.
50 Ω Protection. If you select 50 Ω termination, the maximum vertical scale factor is limited to 1 V/div, except that with a
10X probe the scale factor is 10 V. If you apply excessive input voltage, the oscilloscope automatically switches to 1
MΩ termination to protect the internal 50 Ω termination. For more details, refer to the specifications in the MDO3000
Series Oscilloscopes Technical Reference.
110
MDO3000 Series Oscilloscopes User Manual
Analyze Waveform or Trace Data
Analyze Waveform or Trace Data
After having properly set up the acquisition, triggering, and display of your desired waveform or trace, you can analyze the
results. Select from features such as cursors, automatic measurements, statistics, waveform histograms, math, and FFT.
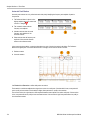
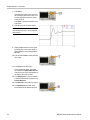
Using Markers in the Frequency Domain
1. Push Markers. This brings up the Markers
side menu.
Markers
2. Push Peak Markers and turn Multipurpose
a to select how many peaks to label on the
display.
NOTE. This is the maximum number of peaks
that will be marked. If there are more peaks that
meet the threshold and excursion criteria than
the specified number of Peak Markers identified
in this control, then only the specified number of
highest amplitude peaks will be marked.
3. Push
To Center to set the center frequency to the
frequency indicated by the Reference Marker.
The Reference Marker is automatically placed
on the highest amplitude peak.
4. Push Threshold and turn Multipurpose
a to define the threshold of the peak
markers. Turn Multipurpose b to define
their excursion value.
Peak
Markers
(a) 5
On| Off
To Center
Threshold
-50.0 dBm
Excursion
30.0 dB
5. Push Manual Markers to activate manual
markers. Use manual markers to measure
non-peak areas of interest in the spectrum.
Manual
Markers
6. Push Readout to choose between Absolute
and Delta readouts. Delta readouts are
relative to the Reference Marker.
Readout
Absolute
Delta
MDO3000 Series Oscilloscopes User Manual
On |Off
119
Analyze Waveform or Trace Data
Automatic Peak Markers
Automatic peak markers are on by default and assist with quickly identifying the frequency and amplitude of peaks in
the spectrum.
1. The Reference Marker is placed on the
highest amplitude peak. It is marked with
a red R in a triangle.
2. The automatic markers indicate
frequency and amplitude.
3. Absolute readouts show the actual
frequency and amplitude of the
automatic markers.
4. Delta readouts show the frequency and
amplitude of the automatic markers
relative to the reference marker.
In the screen shot shown below, a marker has been placed on each of the obvious peaks in the display. The Reference
Marker is the highest peak. It is marked with the red R in a triangle, and its readout is shown in red text.
1. Reference marker
2. Automatic markers
Use Threshold and Excursion to define which peaks are marked.
The threshold is a minimum amplitude that a signal must cross to be a valid peak. If the threshold is lower, more peaks will
tend to qualify to have markers. If the threshold is higher, fewer peaks tend to qualify to have markers.
The excursion is how far a signal needs to fall in amplitude between marked peaks to be another valid peak. If the excursion
is low, more peaks will tend to qualify to have associated markers. If the excursion is high, fewer peaks will tend to qualify to
have associated markers.
120
MDO3000 Series Oscilloscopes User Manual
Analyze Waveform or Trace Data
Each automatic marker has a readout associated with it. These can be absolute or delta readouts. An absolute marker
readout shows the actual frequency and amplitude of the associated marker. A delta marker readout shows the frequency
and amplitude differences from the Reference Marker. The Reference Marker’s readout indicates absolute frequency
and amplitude, regardless of the readout type.
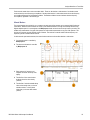
Manual Markers
Two manual markers are provided for you to measure non-peak areas of the spectrum and to measure Noise Density and
Phase Noise. When the manual markers are turned on, the Reference Marker is no longer automatically attached to the
highest amplitude peak. It is now assigned to the Multipurpose a knob and can be moved to any location you desire. This
enables easy measurement of any part of the spectrum as well as delta measurements to any part of the spectrum. This
also lets you measure non-peak spectral content of interest. The readouts for manual markers indicate frequency and
amplitude, just like automatic marker readouts.
As with automatic peak marker readouts, the manual marker readouts can show either absolute or delta values.
1. One manual marker is controlled by
Multipurpose a.
2. The other manual marker is controlled
by Multipurpose b.
3. Delta readouts for frequency and
amplitude are shown at the top of the
display.
4. The third line of the manual marker
a always shows the noise density
(dBm/Hz).
5. The third line of manual marker b always
shows noise density when you choose
absolute markers. It shows phase
noise when you choose delta markers
(dBc/Hz).
MDO3000 Series Oscilloscopes User Manual
121
Analyze Waveform or Trace Data
Taking Automatic Measurements in the Time Domain
To take an automatic measurement in the time domain:
1. If the instrument is in the frequency domain,
push channel 1.
2. Push Measure.
3. Push Add Measurement.
Add Measurement
Remove
Measurement
Indicators
DVM
DC
Waveform
Histograms
More
4. Turn the Multipurpose b knob to select the
specific measurement. If needed, then turn
Multipurpose a to select the channel to
measure on.
5. To remove a measurement, push Remove
Measurement, turn Multipurpose a to
select the specific measurement, and push
OK Remove Measurement on the side
menu.
Quick Tips
To remove all measurements, select Remove All Measurements.
A
symbol appears instead of the expected numerical measurement if a vertical clipping condition exists. Part of the
waveform is above or below the display. To obtain a proper numerical measurement, turn the vertical scale and position
knobs to make all of the waveform appear in the display.
If the oscilloscope displays a Low Resolution message, increase the record length of the acquisition so that the
oscilloscope has more points from which to calculate the measurement.
122
MDO3000 Series Oscilloscopes User Manual
Analyze Waveform or Trace Data
Selecting Automatic Measurements in the Time Domain
The following tables list each automatic measurement by category: time or amplitude. (See page 122, Taking Automatic
Measurements in the Time Domain.)
Time measurements
Measurement
Description
Frequency
The first cycle in a waveform or gated region. Frequency is the reciprocal of the period; it
is measured in hertz (Hz) where one Hz is one cycle per second.
Period
The time required to complete the first cycle in a waveform or gated region. Period is
the reciprocal of frequency and is measured in seconds.
Rise Time
The time required for the leading edge of the first pulse in the waveform or gated region
to rise from the low reference value (default = 10%) to the high reference value (default =
90%) of the final value.
Fall Time
The time required for the falling edge of the first pulse in the waveform or gated region to
fall from the high reference value (default = 90%) to the low reference value (default =
10%) of the final value.
Delay
The time between the mid reference (default 50%) amplitude point of two different
waveforms. See also Phase.
Phase
The amount of time that one waveform leads or lags another waveform, expressed in
degrees where 360° makes up one waveform cycle. See also Delay.
Positive Pulse
Width
The distance (time) between the mid reference (default 50%) amplitude points of a
positive pulse. The measurement is made on the first pulse in the waveform or gated
region.
Negative Pulse
Width
The distance (time) between the mid reference (default 50%) amplitude points of a
negative pulse. The measurement is made on the first pulse in the waveform or gated
region.
Positive Duty
Cycle
The ratio of the positive pulse width to the signal period expressed as a percentage. The
duty cycle is measured on the first cycle in the waveform or gated region.
Negative Duty
Cycle
The ratio of the negative pulse width to the signal period expressed as a percentage.
The duty cycle is measured on the first cycle in the waveform or gated region.
Burst Width
The duration of a burst (a series of transient events) and is measured over the entire
waveform or gated region.
MDO3000 Series Oscilloscopes User Manual
123
Analyze Waveform or Trace Data
Amplitude measurements
124
Measurement
Description
Peak-to-peak
The absolute difference between the maximum and minimum amplitude in the entire
waveform or gated region.
Amplitude
The high value less the low value measured over the entire waveform or gated region.
Max
The most positive peak voltage. Max is measured over the entire waveform or gated
region.
Min
The most negative peak voltage. Min is measured over the entire waveform or gated
region.
High
This value is used as 100% whenever high reference, mid reference, or low reference
values are needed, such as in fall time or rise time measurements. Calculate using either
the min/max or histogram method. The min/max method uses the maximum value found.
The histogram method uses the most common value found above the midpoint. This
value is measured over the entire waveform or gated region.
Low
This value is used as 0% whenever high reference, mid reference, or low reference
values are needed, such as in fall time or rise time measurements. Calculate using either
the min/max or histogram method. The min/max method uses the minimum value found.
The histogram method uses the most common value found below the midpoint. This
value is measured over the entire waveform or gated region.
Positive
Overshoot
This is measured over the entire waveform or gated region and is expressed as:
Positive Overshoot = (Maximum – High) / Amplitude x 100%.
Negative
Overshoot
This is measured over the entire waveform or gated region and is expressed as:
Negative Overshoot = (Low – Minimum) / Amplitude x 100%.
Total overshoot
This is the summation of the positive overshoot and the negative overshoot.
MDO3000 Series Oscilloscopes User Manual
Analyze Waveform or Trace Data
Amplitude measurements (cont.)
Measurement
Description
Mean
The arithmetic mean over the entire waveform or gated region.
Cycle Mean
The arithmetic mean over the first cycle in the waveform or the first cycle in the gated
region.
RMS
The true Root Mean Square voltage over the entire waveform or gated region.
Cycle RMS
The true Root Mean Square voltage over the first cycle in the waveform or the first
cycle in the gated region.
Miscellaneous measurements
Measurement
Description
Positive Pulse
Count
The number of positive pulses that rise above the mid reference crossing in the waveform
or gated region.
Negative Pulse
Count
The number of negative pulses that fall below the mid reference crossing in the waveform
or gated region.
Rising Edge
Count
The number of positive transitions from the low reference value to the high reference
value in the waveform or gated region.
Falling Edge
Count
The number of negative transitions from the high reference value to the low reference
value in the waveform or gated region.
Area
Area measurement is a voltage over time measurement. It returns the area over the
entire waveform or gated region in volt-seconds. Area measured above ground is
positive; area measured below ground is negative.
Cycle Area
A voltage over time measurement. The measurement is the area over the first cycle
in the waveform or the first cycle in the gated region expressed in volt-seconds. The
area above the common reference point is positive, and the area below the common
reference point is negative.
MDO3000 Series Oscilloscopes User Manual
125
Analyze Waveform or Trace Data
Histogram measurements
Measurement
Description
Waveform
Count
Displays the number of waveforms that contributed to the histogram.
Hits in Box
Displays the number of samples within the histogram box or on its boundaries.
Peak Hits
Displays the number of samples in the bin that contains the most hits.
Median
Displays the middle histogram data value, where half of all histogram data points are
less than this value and half are greater than this value.
Peak-to-peak
Displays the peak-to-peak value of the histogram. Vertical histograms display the voltage
of the highest nonzero bin minus the voltage of the lowest nonzero bin. Horizontal
histograms display the time of the right-most nonzero bin minus the time of the left-most
nonzero bin.
Histogram Max
Displays the voltage of the highest nonzero bin in vertical histograms or the time of the
right most nonzero bin in horizontal histograms.
Histogram Min
Displays the voltage of the lowest nonzero bin in vertical histograms or the time of the left
most nonzero bin in horizontal histograms.
Histogram
Mean
Measures the average of all histogram data points within or on the histogram box.
Standard
Deviation
Measures the standard deviation (Root Mean Square (RMS) deviation) of all histogram
data points within or on the histogram box.
Sigma1
Displays the percentage of the hits in the histogram that are within one standard deviation
of the histogram mean.
Sigma2
Displays the percentage of the hits in the histogram that are within two standard
deviations of the histogram mean.
Sigma3
Displays the percentage of the hits in the histogram that are within three standard
deviations of the histogram mean.
Customizing an Automatic Measurement in the Time Domain
You can customize automatic measurements by using gating, modifying measurement statistics, adjusting the measurement
reference levels, or taking a snapshot.
Gating
Gating confines the measurement to a certain portion of a waveform. To use:
1. Push Measure.
126
MDO3000 Series Oscilloscopes User Manual
Analyze Waveform or Trace Data
2. Push More as many times as needed to
select Gating from the resulting pop-up
menu.
Add Measurement
3. Position the gates using the side menu
options.
Gating
Remove
Measurement
Indicators
DVM
DC
Waveform
Histograms
More
DVM
DC
Waveform
Histograms
More
Off
(Full
Record)
Screen
Between
Cursors
Statistics
Statistics characterize the stability of measurements. To adjust statistics:
1. Push Measure.
2. Push More as many times as needed to
select Statistics from the resulting pop-up
menu.
MDO3000 Series Oscilloscopes User Manual
Add Measurement
Remove
Measurement
Indicators
127
Analyze Waveform or Trace Data
3. Push the side menu options. These include
whether to turn statistics on or off and how
many samples to use for mean and standard
deviation calculations.
Measurement Statistics
On| Off
Mean &
Std Dev
Samples
(a) |32
Reset
Statistics
Snapshot
To see all the single-sourced measurements at one moment in time:
1. Push Measure.
2. Push Add Measurement.
Add Measurement
Remove
Measurement
Indicators
DVM
DC
Waveform
Histograms
More
3. Turn Multipurpose a to select the desired
Source channel.
4. Turn Multipurpose b to select the
Measurement Type of Snapshot.
128
MDO3000 Series Oscilloscopes User Manual
Analyze Waveform or Trace Data
5. Push OK Snapshot All Measurements.
OK
Snapshot
All Measurements
6. View results.
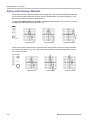
Snapshot on 1
Period
+Width
Burst W
Rise
+Duty
+Over
High
Max
Ampl
Mean
RMS
Area
+Edges
+Pulses
: 312.2μs
: 103.7μs
: 936.5μs
: 1.452μs
: 33.23%
: 7.143%
: 9.200 V
: 10.40 V
: 16.80 V
: -5.396 V
: 7.769 V
: -21.58 mVs
:1
:2
Freq
–Width
Fall
±Over
–Duty
–Over
Low
Min
Pk-Pk
CycleMean
CycleRMS
CycleArea
-Edges
-Pulses
: 3.203 kHz
: 208.5μs
1.144μs
: 14.286%
: 66.77 %
: 7.143 %
: -7.600 V
: -8.800 V
: 19.20 V
: -5.396 V
: 8.206 V
: -654.6μVs
:0
:2
Reference Levels
Reference levels determine how time-related
measurements are taken. For example, they are
used in calculating rise and fall times.
1. Push Measure.
2. Push More as many times as needed to
select Reference Levels from the resulting
pop-up menu.
MDO3000 Series Oscilloscopes User Manual
Add Measurement
Remove
Measurement
Indicators
DVM
DC
Waveform Histograms
More
129
Analyze Waveform or Trace Data
3. Set the levels using the side menu.
Reference
Levels
Set Levels
in
% |Units
Use High and Low reference to calculate
rise and fall times.
Use Mid reference primarily for
measurements between edges such
as pulse widths.
High Ref
(a) 90.0 %
Mid Ref
50.0 %
50.0 %
Low Ref
10.0 %
- Set to
Defaults
Taking Automatic Measurements in the Frequency Domain
To take an automatic measurement in the frequency domain:
1. If the instrument is in the time domain, push
RF.
2. Push Measure.
Select
Measurement
None
3. Push Select Measurement.
130
MDO3000 Series Oscilloscopes User Manual
Analyze Waveform or Trace Data
4. Choose the measurement of interest from
the side menu.
Select
Measurement
None
Channel power: The total power within the
bandwidth, defined by the Channel Width.
Channel
Power
Adjacent channel power ratio: The power in the
main channel and the ratio of channel power to
main power, for the upper and lower halves of
each adjacent channel.
Adjacent
Channel
Power
Ratio
Occupied bandwidth: The bandwidth that
contains the specified % of power within the
analysis bandwidth.
Occupied
Bandwidth
As you select each frequency measurement, on screen help will appear to explain the purpose of that measurement. A
Configure item will appear on the lower menu. After you press Configure and set the measurement parameters in the
resulting side menu, the oscilloscope will automatically set the span. When the RF measurements are on, the Auto detection
method will set all frequency domain traces to the Average detection method. This provides optimal measurement accuracy.
Taking Digital Voltmeter Measurements
Use the digital voltmeter to measure the potential difference between two points in an electrical circuit.
1. Push channel 1 .
2. Push Measure.
Add
Measurement
Remove
Measurement
Indicators
Off
DVM
Off
Waveform
Histograms
More
3. Push the bottom-menu button labelled DVM.
MDO3000 Series Oscilloscopes User Manual
131
Analyze Waveform or Trace Data
4. From the side menu, select the desired
Mode, Source and Display Style.
Digital
Voltmeter
Mode
(a)
|
Off
Source
(b)
|1
Autorange
Unavailable when
Triggering
on DVM
Source
Display
Style
Full
Minimized
Reset
DVM
Statistics
View the finished results.
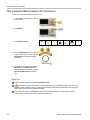
Taking Manual Measurements with Cursors
Cursors are on-screen markers that you position in the waveform display to take manual measurements on acquired data.
They appear as horizontal and/or as vertical lines. To use cursors on analog or digital channels:
1. Push Cursors to turn cursors on.
NOTE. A second push turns cursors off. You
can also push and hold Cursors to display the
cursor menu.
132
MDO3000 Series Oscilloscopes User Manual
Analyze Waveform or Trace Data
In this example, two vertical cursors appear
on the selected waveform. As you turn
Multipurpose a, you move one cursor to the
right or left. As you turn knob Multipurpose
b, you move the other cursor.
2. With cursors on, push Select.
This turns the cursor linking on and off.
If linking is on, turning Multipurpose a
moves the two cursors together. Turning
Multipurpose b adjusts the time between
the cursors.
3. Push Fine to toggle between a coarse and a
fine adjustment for the Multipurpose a and
Multipurpose b knobs.
Pushing Fine also changes the sensitivity of
other knobs as well.
4. Push and hold Cursors to display the cursor
menu.
5. Push Cursors on the lower menu to set the
cursors to Screen.
In screen mode, two horizontal bars and two
vertical bars span the graticule.
Cursors
Waveform
Screen
Source
Selected
Waveform
Bars
Horizontal
Vertical
Linked
On Off
Bring
Cursors
On Screen
Cursor
Units
6. Turn Multipurpose a and Multipurpose b
to move the pair of horizontal cursors.
MDO3000 Series Oscilloscopes User Manual
133
Analyze Waveform or Trace Data
7. Push Select.
This makes the vertical cursors active and
the horizontal cursors inactive. Now, as you
turn the multipurpose knobs, the vertical
cursors will move.
Push Select to make the horizontal cursors
active again.
8. View the cursor and the cursor readout.
NOTE. On digital channels, you can take timing
measurements with cursors, but not amplitude
measurements.
9. Display multiple waveforms on the screen
by pushing one or more of the channel 1
through 4 buttons or by pushing the D15 –
D0 button.
10. Push and hold Cursors to display the cursor
menu again.
11. Push Source on the lower menu.
A pop-up menu will appear. The default
menu selection of Selected Waveform will
cause the cursors to take measurements on
the selected (last used) waveform.
12. Turn Multipurpose a to choose a channel
to measure other than the one pointed to by
Selected Waveform.
13. Push Menu Off to remove the pop-up menu.
14. Turn Multipurpose a and take cursor
measurements on the alternate waveform.
134
MDO3000 Series Oscilloscopes User Manual
Analyze Waveform or Trace Data
15. Push Cursors again. This turns off the
cursors. The screen no longer displays the
cursors and the cursor readout.
Using Cursor Readouts
Cursor readouts supply textual and numeric information relating to the current cursor positions. The oscilloscope always
shows the readouts when the cursors are turned on.
Readouts appear in the upper right corner of the graticule. If Zoom is on, the readout appears in the upper right corner of
the zoom window.
When a bus is selected, the readout shows the decoded bus data in the format you have selected from the choices in the bus
menu. When a digital channel is selected, the cursors show the values of all displayed digital channels.
NOTE. When serial or parallel buses are selected, the data value at that point is displayed in the cursor readout.
Δ Readout:
The Δ readouts indicate the difference
between the cursor positions.
a Readout:
Indicates that the value is controlled by the
Multipurpose a knob.
b Readout:
Indicates that the value is controlled by the
Multipurpose b knob.
The horizontal cursor lines on the display
measure the vertical parameters, typically
voltage.
MDO3000 Series Oscilloscopes User Manual
135
Analyze Waveform or Trace Data
The vertical cursor lines on the display
measure horizontal parameters, typically
time.
The square and circle shapes in the readout map to the multipurpose knobs when both vertical and horizontal cursors
are present.
Using XY Cursors
When the XY Display mode is on, the cursor readouts will appear to the right of the lower graticule (XY). They will include
rectangular, polar, product, and ratio readouts. The oscilloscope will display vertical-bar waveform cursors in the upper
graticule (YT).
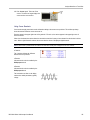
Setting Up a Histogram
You can display a vertical (voltage) or horizontal (time) histogram. Use histogram measurements to get statistical
measurement data for a section of a waveform along one axis. The sources for a histogram can be any of the four or two
analog channels, a math waveform, or any of the four or two reference waveforms.
To Display a Histogram
1. Set up the oscilloscope to show the
waveform on which to measure the
histogram. Use Autoset if appropriate.
2. Push Measure.
3. Push Waveform Histograms on the lower
menu.
136
Add Measurement
Remove
Measurement
Indicators
DVM
DC
Waveform
Histograms
More
MDO3000 Series Oscilloscopes User Manual
Use the Arbitrary Function Generator
Use the Arbitrary Function Generator
The MDO3000 contains an optional integrated arbitrary function generator (AFG) (option MDO3AFG). This is useful for
simulating signals within a design or adding noise to signals to perform margin testing.
The function generator provides output of predefined waveforms up to 50 MHz. Choose between sine, square, pulse,
ramp/triangle, DC, noise, sin(x)/x (Sinc), Gaussian, Lorentz, exponential rise/fall, Haversine and cardiac signals.
The AFG can generate up to 131,072 points of an arbitrary waveform. You can create the waveform from any of the four
internal ARB memories, the four (or two) analog channels, the four (or two) reference waveforms, the math waveform or the
16 digital channel waveforms. You can also use a .CSV (spreadsheet) file stored externally or a predefined template.
You can modify your arbitrary waveform via an on-screen editor and then replicate it out of the generator. For more involved
waveform manipulation, you can use Tektronix’ ArbExpress PC-based waveform creation and editing software. It is available
for free download from www.tektronix.com/software. Use version 3.1 or later with the MDO3000.
How to access the AFG
To access the AFG output, connect your cable
to the port marked AFG OUT in the back of the
oscilloscope.
To see the output of the AFG, connect the other
end of the cable to one of the input channels on
the front of the oscilloscope.
Push the front-panel AFG button to turn the
AFG output on and off.
The button lights up when the output is on. The
light goes out when it is off. The On-Off status is
always off when you recall an instrument setup.
The AFG will always come up in the off state
when you turn the oscilloscope power on.
MDO3000 Series Oscilloscopes User Manual
183
Use the Arbitrary Function Generator
How to change the waveform type
1. Push the AFG button to bring up the AFG
lower menu.
Waveform
Sine
Wave–
form
Settings
Frequency
Amplitude
Offset
100.00kHz
500.00mVpp
0.0000 V
Period
High
Low
10.000μs
250.00mV
–250.00
mV
Output
Settings
2. Push the Waveform button on the AFG
lower menu and turn the Multipurpose a
knob to select the waveform type.
3. Push the Waveform Settings button on
the AFG lower menu to set the frequency,
period, amplitude, offset and the high and
low levels of the desired waveform.
4. Push the Output Settings button on the
lower menu to adjust the load impedance
and amount of additive noise.
You can enable the AFG trigger pulse to
come out of the rear-panel AUX OUT port.
This is useful if you want an AUX OUT pulse
that is synchronized to your AFG waveform
block. To enable this feature, push AFG >
Output Settings > AUX OUT > AFG.
The channel 1 sine wave shows the output of the AFG. The channel 2 square wave
show the output of the AFG sync pulse. It comes from the AUX OUT port.
184
MDO3000 Series Oscilloscopes User Manual
Use the Arbitrary Function Generator
Restrictions. When an output frequency is
The output waveform (MHz)
AFG trigger output
frequency (MHz).
higher than 4.9 MHz, some restrictions exist. A frequency setting.
divided frequency that is lower than 4.9 MHz is
output from the AUX OUT port. The AFG trigger ≤ 4.9 MHz
frequency will be limited as shown in the table
>4.9 MHz to 14.7 MHz
to the right.
>14.7 MHz to 24.5 MHz
Signal frequency / 5
>24.5 MHz to 34.3 MHz
Signal frequency / 7
>34.3 MHz to 44.1 MHz
Signal frequency / 9
>44.1 MHz to 50 MHz
Signal frequency / 11
Signal frequency
Signal frequency / 3
How to create an arbitrary waveform
You can create the waveform from any of the four internal ARB memories, the four (or two) analog channels, the four (or two)
reference waveforms, the math waveform or the 16 digital channel waveforms. You can also use a .CSV (spreadsheet) file
stored externally or a predefined template (square, sine, ramp, pulse, or noise).
1. Push the AFG button to bring up the AFG
lower menu.
2. On the lower-menu, push Waveform and
turn Multipurpose a to select Arbitrary from
the list of waveforms on the resulting pop-up
menu.
Waveform
Arbitrary
Waveform
Settings
Waveform
Edit
Freq.
Ampl.
Offset
100.00kHz
500.00mVpp
0.000 V
Period
10.000μV
High
250.00mV
Low –250.
00mV
Output
Settings
3. Push Waveform Settings to set the
frequency, period, amplitude, offset, and high
and low levels.
4. Push Waveform Edit to bring up the
Waveform Edit lower menu. This menu will
let you manipulate existing waveform points,
as well as to add and delete points, and to
edit the voltage level.
For cases with many points to edit, consider
using Tektronix ArbExpress software,
which is available for free download from
www.tektronix.com/software.
Also, use the Waveform Edit menu to create
new arbitrary waveforms in the instrument.
You can do this by loading them from files
or from live channels.
MDO3000 Series Oscilloscopes User Manual
185
Use the Arbitrary Function Generator
If needed, push AFG > Waveform Edit to bring
up the waveform edit lower menu.
5. Push Edit Existing to change, add, or delete
points in a current waveform.
Edit
Existing
Create
New
Load
Waveform
Freq.
Ampl.
Offset
100.00kHz
500.00mVpp
0.000 V
Period
10.000 μs
High
250.00mV
Low –250.
00mV
Save
Waveform
When you enable the internal editor, the screen
splits into a smaller top window and a larger
bottom window.
The smaller, top part of the screen becomes
an overview, which shows the entire waveform
memory. A box shows the zoomed-in portion of
the waveform.
The larger, lower part becomes the zoomed-in
view of the overview, as defined by the box in the
top part of the screen. This lower part shows up
to 500 points of the record.
Turn the Multipurpose a knob to select a point
to edit.
Turn the Multipurpose b knob to set the voltage
level of that point. The voltage level is a function
of the current amplitude and offset settings for
the waveform.
Use the side menu items to add or remove points
from the waveform.
6. Push Create New from the lower-menu to
make a fresh arbitrary waveform.
On the resulting side menu, turn
Multipurpose a or use the keypad to define
the number of points in the waveform. Your
waveform can have up to 131,072 points.
Turn Multipurpose b to choose the basic
function. Choose between square, sine,
ramp, pulse, and noise.
Push OK Create to build the new waveform.
186
MDO3000 Series Oscilloscopes User Manual
Use the Arbitrary Function Generator
7. Push the lower-menu button labeled Load
Waveform. Turn Multipurpose a to choose
which of your waveforms to display. Also,
you can use the side menu to load a saved
waveform from a file. When you have chosen
the desired waveform, push OK Load from
the side menu. Clear the menu by pushing
Menu Off twice.
Be sure that you have a BNC cable
connected from the AUX OUT port on the
back to the channel 1 port on the front.
View your arbitrary waveform on the
oscilloscope display.
8. On the lower menu, push Save Waveform.
Turn Multipurpose a to select which of
the four slots to store your newly created
waveform. Push OK Save. If you want, push
Edit Labels and use Multipurpose a and
the lower menu to assign a name to your new
waveform. Clear the label menu by pushing
Menu off.
MDO3000 Series Oscilloscopes User Manual
187
Use the Arbitrary Function Generator
Quick Tips
You can save arbitrary waveforms in .CSV format. A .CSV file consists of sets of waveform point pairs (voltage, point
number).
You can load arbitrary waveforms from a variety of active time domain waveform sources: Channel 1 - 4, Ref 1 - 4,
MATH, digital channels D0 - D15.
The arbitrary waveform memory may be saved to and loaded from one of four arbitrary waveform memory locations.
These may only be loaded to the active arbitrary waveform. You cannot save them to files or recall them directly to
the arbitrary waveform memory locations.
NOTE. Loading from digital waveform sources will use the main waveform record. MagniVu records are not supported.
NOTE. Load impedance scales the vertical settings to show what the load would see based on the load impedance. Since
the AFG is a 50 Ω source, for most accurate operation, set the load impedance to 50 Ω and set the input channel to 50 Ω.
NOTE. Noise range is reduced above 50% of the function Maximum Amplitude according to the function:
Noise Percent Maximum = 100.0 * (Maximum Amplitude / Amplitude – 1.0)
188
MDO3000 Series Oscilloscopes User Manual