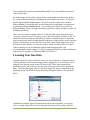
1
ISP 2.2 User Manual
February 26, 2009
Table of Contents
1 Introduction ...................................................................................................................... 3
1.1 Operational Modes .................................................................................................... 4
1.2 Trial Mode ................................................................................................................ 4
1.3 Check for Updates..................................................................................................... 6
1.4 Technical Support ..................................................................................................... 6
1.5 Purchase ISP ............................................................................................................. 6
2 The User Interface............................................................................................................ 7
2.1 The File Menu ........................................................................................................... 9
2.2 The Edit Menu ........................................................................................................ 10
2.3 The View Menu ...................................................................................................... 10
2.4 The Window Menu ................................................................................................. 10
2.5 The Help Menu ....................................................................................................... 10
3 Application Toolbar ....................................................................................................... 11
3.1 File .......................................................................................................................... 11
3.2 View ........................................................................................................................ 11
3.3 Window Layout ...................................................................................................... 11
3.4 2D Interact Mode .................................................................................................... 12
3.5 3D Interact Mode .................................................................................................... 12
3.6 Display Tools .......................................................................................................... 12
3.7 Analyze Tools ......................................................................................................... 14
3.8 Snapshot Tools ........................................................................................................ 14
4 Quick Tutorial ................................................................................................................ 15
4.1 Step 1: Load Data.................................................................................................... 15
4.2 Step 2: Interact With Images................................................................................... 16
4.3 Step 3: Interact With a Volume .............................................................................. 18
5 Loading Your Own Data................................................................................................ 20
5.1 The Open Wizard .................................................................................................... 21
5.2 Supported 2D and 3D File Formats ........................................................................ 22
6 Application Settings ....................................................................................................... 24
6.1 Interface Settings .................................................................................................... 24
6.2 Toolbar Settings ...................................................................................................... 25
6.3 Print Settings ........................................................................................................... 25
6.4 Graphics Settings .................................................................................................... 25
In the future, the Graphics Settings area will contain graphics specific options. ......... 25
6.5 Preset Settings ......................................................................................................... 25
7 Display Windows ........................................................................................................... 26
7.1 Data Display Types ................................................................................................. 26
7.2 Image Display Windows ......................................................................................... 26
7.3 Volume Display Windows ...................................................................................... 30
8 Control Panel ................................................................................................................. 34
8.1 Color/Opacity Settings Tab..................................................................................... 34
8.1.1 Color/Opacity Presets ...................................................................................... 34
8.1.2 Color/Opacity Settings ..................................................................................... 35
1
Copyright © 2009 Kitware, Inc.
8.2 Window/Level Settings Tab ................................................................................... 36
8.2.1 Window/Level Presets ..................................................................................... 36
8.2.2 Window/Level Settings .................................................................................... 37
8.3 Analyze Tab ............................................................................................................ 37
8.3.1 Linear Measurement ........................................................................................ 38
8.3.2 Bi-dimensional Measurement .......................................................................... 39
8.3.3 Angle Measurement ......................................................................................... 39
8.3.4 Contour Measurement ...................................................................................... 40
8.3.5 Arrow/2D Labeling .......................................................................................... 40
8.3.6 Deleting a Measurement .................................................................................. 41
8.4 Review Tab ............................................................................................................. 41
8.4.1 Snapshot ........................................................................................................... 41
8.4.2 Movie ............................................................................................................... 42
8.5 Info Tab ................................................................................................................... 43
8.6 Plugins Tab ............................................................................................................. 44
2
Copyright © 2009 Kitware, Inc.
1 Introduction
Welcome to ISP 2.2, a full featured data visualization application intended for authoring
and reading Interactive Scientific Publications in the medical, scientific, and engineering
communities. ISP can interactively render, reformat, annotate, measure, animate and
capture / print volumetric and image data, all of which can be saved into a visualization
session file for use in interactive scientific publications. The main features of ISP 2.2
include the ability to:
•
Simultaneously load a wide range of 2D and 3D image data formats including
DICOM, TIFF, and JPEG images.
•
Rapidly volume render 3D scalar data with and without shading and support for
maximum intensity projections. Accelerated GPU volume rendering is available
on computers with advanced Nvidia graphics cards.
•
Select from a collection of standard 2D/3D appearance presets.
•
Modify volume rendering transfer functions.
•
Perform 2D measurements including: linear, bi-dimensional, angular and contour.
•
Produce animations of 2D or 3D renderings.
•
Place 2D or 3D arrow and text annotations.
•
Save the entire system state into a session file, including snapshots of the system
state, at multiple points during a visualization session.
•
Quickly and easily insert visualization sessions as links into Word and PDF
documents for use in OSA’s interactive scientific publication system.
•
Run a set of standard image processing plugins on loaded image data or run a
plugin with your own source code.
•
We also now provide the ability to segment lung lesions in Computed
Tomography Scans.
One of the strengths of ISP 2.2 is its ability to load and a wide range of display medical
image data. However, it is important to recognize that ISP 2.2 has not been reviewed by
government regulatory agencies (e.g. US FDA) and is not approved for clinical use.
This document is intended as both a tutorial and a reference guide. The Quick Tutorial
session will take you step-by-step through a typical ISP session including loading data,
3
Copyright © 2009 Kitware, Inc.
viewing images and volumes, adding annotation, and saving sessions. This is a good
place to start if you are a new to this version of ISP.
The remainder of this document acts as a reference guide. All users are encouraged to
read the section on The User Interface as it documents many commonly used features.
For help on a particular setting you will find chapters with sub sections in the table of
contents for easy reference. Detailed information on each button, entry, slider and option
can be found in each of the sections provided.
This documentation has been developed specifically for ISP 2.2. We encourage you to
check OSA’s ISP home page at http://midas.osa.org/~midasos/wiki/ for updates, news,
and FAQs.
1.1 Operational Modes
ISP can currently be used in one of two modes: Trial Mode or Professional Mode. In
Trial Mode, all functionality is enabled during the 30-day trial period and disabled
thereafter, except for the ability to load and explore OSA published interactive scientific
publication content. Similar to the ability to view adobe PDF files without cost, the ISP
2.2 system is designed to allow readers to explore OSA published interactive scientific
publications with a freely available application.
In Professional Mode, all of the main application functionality is enabled for the term of
the licensing period. This is particularly useful during the creation of visualization
content when authoring an interactive scientific publication.
1.2 Trial Mode
The first time you run ISP 2.2 the Registration Wizard should pop up. This may not occur
if ISP 2.2 was previously installed on this same computer. You may access the Wizard
from the Help menu on the ISP menu bar if it does not automatically appear or if you
need to alter your registration in the future. The first page of the Wizard will appear as
shown below.
4
Copyright © 2009 Kitware, Inc.
It is highly recommended that you obtain the trial license and run ISP in trial mode in
order to understand the full capabilities of this visualization and data processing system.
If you are connected to the Internet, the easiest way to obtain a trial license is to use the
Registration Wizard. If you are not on the Internet you can use this Wizard to receive
instructions on alternate methods for obtaining a trial license, and to manually install this
license. Leave the option selected to get a trial license and click on the Next button. On
the next page you will be asked if your computer is connected to the Internet. Select Yes
or No and press Next to continue.
If you selected No, then you will receive instructions on alternate methods for obtaining a
license. Your computer ID will be displayed, and you may enter this at the registration
web site: www.kitware.com/VVLicense/register.cgi or you may email this information to
[email protected]. You will receive your trial license via email, which you must load
using the file browser button.
If you yes, the next page in the Registration Wizard will give you the opportunity to enter
your email address so that OSA may notify you of future releases of ISP and its related
products.
Once you submit your email address, press the Next button. ISP will attempt to contact
the license server and install your license file. If this occurs successfully, you will see a
message indicating the installation was successful, and your trial license will begin. Press
the Finish button to close the Wizard.
If a connection could not be made, you will see an error message. This may occur if your
computer is not connected to the Internet, or if you use a proxy server or VPN for your
connection. If this error occurs, please use the Back button on your browser twice, then
indicate that your computer is not connected to the Internet. You can then follow the
instructions for manually obtaining and installing a license file (see above).
Any problems encountered during registration should be reported to OSA technical
support at [email protected] or (202) 416-1938.
5
Copyright © 2009 Kitware, Inc.
1.3 Check for Updates
Updated versions of ISP may be made available from time to time. If you have purchased
a ISP Professional Mode license, and you have provided your email address during
registration, you will be notified via email when new updates are available. All users
running ISP 2.2 are encouraged to check the OSA ISP website
http://midas.osa.org/~midasos/wiki/ for updates as well.
1.4 Technical Support
You may email technical support questions to [email protected]. When sending a
question to customer support, please include the following information:
•
•
•
Your name and phone number
ISP version (go the Help Menu and then About to get this information)
Mode (trial or professional)
If you are reporting a bug, please provide the following information:
•
•
•
•
•
•
The operating system you are using
The number of processors on your system
The type of video card installed on your system (to find this on Windows XP,
right mouse click on your desktop, select Properties, then Settings).
The size and type of the data you loaded (512x512x200 unsigned short data)
A detailed description of the problem you encountered
The sequence of operations that caused the problem, and whether it is
reproducible
OSA and Kitware welcome customer feedback. If there is a particular feature that you
would like to see available in the future, please send an email to [email protected] or
(202) 416-1938with a brief description of the functionality and how you would use it in
your application area.
1.5 Purchase ISP
Please see the OSA ISP web site at http://midas.osa.org/~midasos/wiki/ for the latest
information on obtaining a Professional license for creating interactive scientific
publication content.
Once OSA has granted you a Professional license for ISP, you will receive an email
requesting your computer ID to register the product. You can find the computer ID on the
About dialog from the Help menu located on the ISP menu bar. After this information has
been entered into the licensing database you will need to use the Registration Wizard to
obtain your license. Please give OSA 1-2 business days to process your registration.
6
Copyright © 2009 Kitware, Inc.
To obtain your Professional License, select "Purchase and register the professional
version" from the initial page of the Wizard, and press Next. After reviewing the
instructions, press Next then indicate whether your computer is connected to the Internet.
If your computer is connected to the Internet, you can retrieve your license easily through
the Wizard. If it is not connected to the internet, you must use the small file icon to
browse for the license file sent to you, via email, when your purchase was completed.
2 The User Interface
The ISP user interface consists of five main regions as illustrated below. This includes
the Main Menu Bar, the Toolbar, the Control Panel, the Display Windows, and the Status
Gauge. Note that not all of these regions will be visible at all times. A detailed
description of each of these regions is provided below.
Main Menu Bar: The main menu bar provides pulldown menus along the top of the
application under the following headings: File, Edit, View, Window, and Help. The File
menu provides functionality for loading data, saving data, printing and exiting. The Edit
menu supports the copying of screenshots to the clipboard. The View menu provides
ways to change application settings. The entries in the Window menu allow the user to
hide or display interface areas and turn on/off toolbars. Within the Help menu is the
About function which contains product and licensing information as well as information
on obtaining Technical Support. For more information on the functionality of the File,
Edit, View, Window, and Help menus see sections 2.1, 2.2, 2.3, 2.4, and 2.5,
respectively.
7
Copyright © 2009 Kitware, Inc.
Toolbar: The toolbar area displays icon representations of the commonly used ISP
functionalities. The appearance of this toolbar (showing/hiding specific shortcut toolbars)
can be controlled using the Toolbar area in the Window Menu. More information on the
Toolbar can be found in Section 3 of this document.
Control Panel: The Control Panel is located on the left side of the window by default.
You can toggle the visibility of the panel in the Window menu. Five Property Tabs are
provided in the Control Panel providing interfaces for color/opacity, window/level,
analysis, review, and information. More information on the Property Tabs can be found
in Section 8.
To switch between the tabs, simply click on the tab. You can resize the Control Panel
area by moving the mouse over the right edge of the panel area, the mouse arrow will
change to a horizontal arrow. Click on that edge and drag the mouse left or right to
adjust the Panel’s size. In order to maintain the readability of the Control Panel interface
elements, the Control Panel may only be reduced to a specific size; however, it can be
expanded to fit the whole screen. If you have an unusually large font you may find the
need to increase the size of the panel area.
A feature of the Property Tabs is that you can close and open the areas on the panel using
the small icon in the top right corner of the area. When the area is open, the icon will
appear as a small "X". Pressing this will close the area, displaying only the area title. The
icon in the corner will now be a small downward-facing triangle. Pressing this will once
again open an area.
Display Windows: From one to nine display windows may be visible at any time. These
will be located below the Main Menu Bar and the Toolbar. Clicking inside a window will
highlight the periphery of the window with a green line, indicating that this window is
active. This is important when using tools for performing measurements and other data
operations. There are six different types of windows as described below:
Volume: This is a volume rendering display of the data. This window supports 3D
interaction.
X-Y (Axial) Image: This is an axis-aligned slice of the data along the Z axis. This
window supports 2D interaction.
X-Z (Coronal) Image: This is an axis-aligned slice of the data along the Y axis. This
window supports 2D interaction.
Y-Z (Sagittal) Image: This is an axis-aligned slice of the data along the X axis. This
window supports 2D interaction.
Lightbox: This is an image display, allowing for up to 25 consecutive images to be
displayed in a grid pattern. This window supports 2D interaction.
8
Copyright © 2009 Kitware, Inc.
Oblique Probe: This is the image obtained from applying an oblique probe to the volume
displayed in the Volume window. You can display the oblique probe in 3D from the
Toolbar and adjust the placement interactively in the Volume window. The window will
support 2D interaction by allowing you to adjust the plane from which to view the slice in
the oblique probe window.
For each of the display windows, there is a pulldown menu in the upper left corner (on
the title bar). Using this menu you can change the dataset and type of display in this
window. For example, selecting the first Window layout option on the Window menu or
the toolbar will display one Volume window. Keep in mind that you can only display
each type of window once - if you choose a window type that is already displayed, the
two windows will swap positions. For example, if you are viewing the Axial and Sagittal
image side-by-side, and you select Sagittal from the pulldown menu on the Axial
window, then the Axial and Sagittal windows will swap positions.
Status Information: The status bar is located at the bottom left of the application. Short
messages will appear in this area, generally when ISP is performing some complex
processing, or when the mouse is moved over an image window. The value of a 2D pixel
at the location of the mouse pointer is displayed in this area.
Status Gauge: The main application progress gauge is located at the lower right corner of
ISP. During long processing operations, progress will be pictorially displayed in this area,
such as the progress in loading a dataset. If an error occurs in ISP, the rightmost box area
will show an error warning symbol.
2.1 The File Menu
The File menu contains selections for opening files, selections for saving sessions and
screenshots, and menu selections for closing datasets and exiting the application.
The Open File menu selection provides the user with a file browser to select the file to be
loaded. See Section 4: Load Data for more information on loading datasets into ISP.
The Open Recent File menu selection provides a list of the 15 most recently loaded
datasets. Selection of any of these recently loaded datasets will reload that data into ISP
provided the location of the data on the file system has not changed.
The Save Session menu selection will save the current state of the application into a ISP
session file. Whatever was loaded when the session file was saved will be reloaded when
the session file is opened.
The Save Screenshot menu selection allows the user to save the display area contents into
a file using one of several image formats. Supported formats include Windows Bitmap
(*.bmp), JPEG (*.jpg), PNG (*.png), Binary PPM (*.ppm), and TIFF (*.tif).
9
Copyright © 2009 Kitware, Inc.
The Close Selected Data menu selection will remove the dataset shown in the currently
selected (green highlight) display window. The layout of ISP will automatically adjust to
fill the display windows with other open dataset displays, if they are available.
The Exit menu selection will terminate the application. The user is prompted with a
confirmation popup window unless the option “Do not show this dialog anymore” has
been selected.
2.2 The Edit Menu
The Edit menu consists of a single menu item for copying a screenshot. Selecting the
“Copy Screenshot” menu item copies an image of the currently displayed viewing area to
the Windows clipboard. If only one of the display windows is needed, simply double
click in the desired window and copy the screenshot.
2.3 The View Menu
The View menu provides access to ISP application settings. For more information on see
Section 6: Application Settings.
2.4 The Window Menu
The Window menu contains controls for the visibility of user interface areas including
the Control Panel (on the left by default) and various toolbar areas. More information on
the toolbar layout can be found in the Section 3: Application Toolbar. The Window menu
also has a selection for viewing and reporting errors encountered by ISP.
2.5 The Help Menu
The Help menu provides a selection for displaying the ISP 2.2 User Manual, a selection
for displaying keyboard shortcuts, emailing technical support, a selection for starting the
product registration wizard, and information about this version of ISP.
Email Technical Support: Selecting this option will open up a window that provides a
user interface for emailing technical support. Information on your system hardware and
the ISP version is automatically obtained and inserted into the email for your
convenience.
Register: Selecting this option will display the registration Wizard. You should use this
Wizard if you are obtaining a trial license of ISP 2.2, or if you have purchased an ISP and
you wish to obtain your Professional Mode License.
About ISP: This menu option will pop up a dialog containing information about the
version of ISP you are running and Kitware copyright information. In addition, your
10
Copyright © 2009 Kitware, Inc.
computer ID, the expiration time of your current license, and location of important
directories will be displayed on this dialog. You may need the Computer ID information
in order to obtain or extend a Professional license for ISP.
3 Application Toolbar
The ISP application toolbar provides quick access to commonly used functionalities. To
add/remove these functionalities on the main ISP select Toolbars from the Window Menu
and check/uncheck the desired toolbar(s). The following figure illustrates the location of
the eight main areas of the toolbar.
A single button click on any of the toolbar icons will execute the operation represented
by the icon. Each of the main areas of the toolbar, along with a description of each icon’s
functionality, will be described in the following sections.
3.1 File
The left-most icon on the application toolbar will launch the Open File dialogue window.
This is a convenience icon that achieves the same result as pulling down the File menu
and selecting Open File.
The disk icon will launch the Save Session dialogue window. This is a convenience icon
that achieves the same result as pulling down the File menu and selecting Save Session.
3.2 View
The Set View icon area is reserved for setting the entire display area to a single view
type. Selecting the left-most icon in this area will change the window layout to 1x1 and
set the display type to X-Y or Axial image display. The middle icon in this toolbar area
will change the window layout to 1x1 and set the display type to a Volume display. The
right-most icon in this toolbar area will change the window layout to 1x1 and set the
display type to Lightbox.
3.3 Window Layout
The Set Window Layout area of the application toolbar is provided to allow quick
selection of a window layout. Available layout options include:
• 1 column x 1 row
11
Copyright © 2009 Kitware, Inc.
•
•
•
•
•
•
1 column x 2 rows
2 columns x 1 row
2 columns x 2 rows
2 columns x 3 rows
3 columns x 2 rows
3 columns x 3 rows
3.4 2D Interact Mode
The 2D Interact Mode area allows the user to quickly select the image interaction mode
associated with the left mouse button. The first three icons are available in all image
display windows and provide icons for window/level, pan, and zoom. An Oblique
Display window also allows for three additional interaction operations:
•
Rotate: Performs a 2D rotation of the oblique image.
•
Reslice: Performs a 3D rotation of the oblique image plane.
•
Translate: Performs a 3D translation of the oblique image perpendicular to the
oblique image plane.
3.5 3D Interact Mode
The 3D Interact Mode area allows the user to quickly select the volume interaction mode
associated with the left mouse button. This toolbar area provides icons for 3D rotate, pan,
and zoom operations.
3.6 Display Tools
The Display Tools area allows the user to enable additional display tools that enhance the
ability to visualize a 3D dataset. The toolbar contains icons for:
•
Oblique Probe Display: Toggles the display of a 3D bounding box and an oblique
plane in the dataset’s Volume Display Window, as shown below:
12
Copyright © 2009 Kitware, Inc.
A left mouse press on the plane allows for translation of the slice along the
direction perpendicular to the plane. Rotation of the plane can be accomplished by
dragging the arrow handles. The Oblique Display Window will interactively
update during oblique plane interaction.
•
3D Cursor: Toggles the display of a 3D cursor in the Volume window and the
orthogonal image display windows (e.g. Axial, Sagittal, Coronal), as shown
below.
The 3D cursor is shown at the corresponding location in all three orthogonal
image displays for the dataset. The X, Y, and Z axes are shown in red green and
blue. Clicking and dragging the intersection of the axes will move the location of
the cursor and update the other three displays to show the location of the cursor.
13
Copyright © 2009 Kitware, Inc.
•
Cropping Planes: Toggles the display of cropping planes on the orthogonal image
display windows, as shown below.
Cropping planes in image windows allows the user to remove orthogonal sections
of data from the Volume display. The cropping planes are initially located at the
periphery of the 3D dataset and are represented as white lines in the orthogonal
image display windows. Cropping is achieved by pressing the left mouse button
on a white line and dragging it to the desired cropping location. The Volume
Display Window for the dataset will be interactively cropped during this
interaction. For example, cropping removed one side of the head in the Figure
above.
•
Compression Tool: The main toolbar icon toggles the display of a compressed
version of the selected dataset. To the right of this is a slider that allows you to set
the desired level of compression. This is useful for setting the compression level
that will ultimately be used to quickly transmit a compressed version of the
dataset to interactive scientific publication readers when the manuscript is
published.
3.7 Analyze Tools
The analyze tools provided on the application toolbar have the same functionality as the
analyze tool icons available on the Analyze Tab of the Control Panel. Detailed
information on the use of these tools can be found in Section 8.2.
3.8 Snapshot Tools
14
Copyright © 2009 Kitware, Inc.
The snapshot tools provided on the application toolbar have the same functionality as the
snapshot tool icons available on the Review Tab of the Control Panel. Detailed
information on the use of these tools can be found in Section 8.3.
4 Quick Tutorial
This quick tutorial will walk you through the basic steps of visualization and interacting
with your volume data. It is assumed that you will perform these steps in the order
presented in this documentation. Although some of the interface examples may look
slightly different depending on your platform, the tutorial concepts are platformindependent. The images in this manual were captured on a Windows Vista operating
system.
4.1 Step 1: Load Data
In this first step we will locate and load one of the example datasets that is distributed
with the ISP Tutorial example. The ISPTutorial can be downloaded from the following
location http://midas.osa.org/~midasos/wiki/ (Authors). Begin by selecting the Open File
option in the File menu. This will pop up the file browser as shown below. Using the
controls provided by the dialog, navigate to the place where you installed ISP. Select the
file called CTNeck.vti and press the Open button (or simply double click on the file to
open it).
At this point the Open Wizard will pop up to lead you through setting some of the
parameters that may not be explicitly set in the file. You will first be asked if the data
should be loaded as medical image data or general scientific data. In this case we will
select scientific. Select medical if you would like the interface and annotations to display
medical terms (e.g. sagittal). Next we will be asked to provide information on the Units
that the data values and distances represent. The data being loaded in this example is
Visualization Toolkit XML image format and we are missing a descriptive string for the
measured data values, the distance unit type, and we do not have any information on the
orientation of the data during acquisition. You will notice that values are provided in the
Wizard - these come from an auxiliary file (CTNeckt.vti.vvi) that stores this information.
Generally, the .vvi file is written after you have loaded a dataset so that the information is
retained for the next time you load the dataset. In this case, the vvi file came with your
ISP distribution. Hit the Next button twice to load the data using the provided default
values.
15
Copyright © 2009 Kitware, Inc.
This file contains a CT scan of the neck and part of the head of a human male. You can
view basic information about the data by selecting the Info Tab on the left Control Panel.
Also, be sure to select the 2 by 2 layout option from the application toolbar, to see both
the volume rendering and the images at once. Click on the top left Volume window then
go to the C/O Tab (located on the Control Panel on the left) and select the CT|Bone
preset. Your interface at this point should like similar to the image shown below.
4.2 Step 2: Interact With Images
We will now explore some of the
interaction possibilities in the 2D
image windows. First, we will
start by switching the position of
the X-Z and Y-Z viewing
windows by clicking on the
arrow in the left corner of the XZ window. Then select
CTNeck.vti: Y-Z from the drop
16
Copyright © 2009 Kitware, Inc.
down menu. Your display area should now have a layout similar to the one shown in the
image on the right.
Note that each of the image display windows has a slider along the left. This allows you
to adjust the currently displayed slice. Try moving the slider up and down to view the
image slices through the neck. There are some keyboard shortcuts as well. Before using
the keyboard shortcuts ensure that the desired image window is active. Active windows
will be highlighted in green (as it is in the image to the right) indicating that this is the
currently selected window. Now you can use the left and right arrow keys to move back
and forward through slices one at a time. The Page Up and Page Down keys will move
backward and forward by 10 slices at a time, while the Home key will go to the first slice,
and the End key will go to the last slice. Note that the slice number is reported in the top
left corner annotation of an image display window.
Move the slider back to some center position. Using controls on the W/L Tab on the left
side of the application, we will now adjust the Window and Level of the image to control
the contrast and brightness; note that the current window and level settings are displayed
both in the lower right corner of each image window and in the Window/Level Settings
area of the W/L Tab. We can adjust these values in one of three ways: by selecting a
Window/Level Preset, by manually entering new values in the Window and Level text
entry boxes, or by left clicking and dragging the mouse in the image display window.
ISP comes with several Window/Level presets that you can select from the W/L Tab on
the Control Panel. Try selecting different presets and view the result these Window/Level
values have on the images.
Now try manually entering new values in the Window and Level text entry boxes.
Looking at the Status Information at the bottom left of the application you will see that
the scalar values in the lower density bone regions (trabecular bone) are generally at or
above 300. We will manually enter values that will highlight the bone. To do this set this
region to a middle gray value by setting the Level to 300 and the Window to 500. Making
this change should alter your image to appear similar to the Figure below.
17
Copyright © 2009 Kitware, Inc.
Note that the other 2D image windows also change due to the new window and level
settings. These values are set for the entire application window, not per image window,
keeping all 2D views of the same dataset synchronized.
Now try adjusting the Window and Level Values using the mouse. Press the left mouse
button and move the cursor left to right to adjust the window value, and up and down to
adjust the level value. You can press the Reset button in the Window/Level Settings area
in the W/L Tab to reset these values.
In addition to the window/level functionality on the left mouse button, ISP also supports
2D panning and zooming. Press the right mouse button in an Image Display Window,
here you may select Window/Level, Pan or Zoom. Select Pan and then manipulate the
image. Then right click and select Zoom to manipulate the image. To apply the zoom
function you must left click your mouse and move in an upward direction to zoom in and
a downward direction to zoom out. Spend some time panning and zooming the image to
become comfortable with the functionality. Note that panning and zooming is applied
independently in each image window. Also note that Window/Level, Pan, and Zoom
functionality can be accessed with a single button click on the Application Toolbar.
4.3 Step 3: Interact With a Volume
Now we will focus on interaction in the volume display window. The most common
interaction methods in the volume display window are rotation, panning, and zooming.
Like interaction with images, these functions have been mapped to the left mouse by
pressing the right mouse and selecting the desired interaction mode. Spend some time
panning, zooming and rotating the volume to become comfortable with these
functionalities. Again, to apply the zoom function you must left click your mouse and
move in an upward direction to zoom in and a downward direction to zoom out. If you
lose the volume during this interaction, press the "R" key on your keyboard, verifying
first that the volume display window has keyboard focus, to reset the camera.
18
Copyright © 2009 Kitware, Inc.
You can set the camera to one of the six standard directions, +X, -X, +Y, -Y, +Z or -Z,
using the Standard View menu which is accessible when you perform a right mouse click
in the Volume window.
You may also wish to try switching between Parallel and Perspective projections (also
available accessible when you right click in the Volume window) to see the difference
between these two projection modes.
We will now adjust the color and opacity mappings to alter the appearance of our
rendered volume. We will first begin by selecting the “CT | Bone” Volume Appearance
Preset from the Color/Opacity Settings Tab. Now, grab the first node (point) from the left
in the Scalar Opacity Mapping area, and drag this node down to the left. The interface
should now look something like the image shown below.
Here is what occurs in the application when you make this change. Each point in the
opacity function represents the rendered opacity of the scalar value at the point location.
Moving the bottom most point to the left caused a much larger range of scalar values to
be assigned a non-zero opacity, which in this case happens to be muscle tissue. This
revealed the muscles of the neck surrounding the originally displayed bone structure.
Moving the tan colored point up will increase the opacity of the function and display the
neck muscles with less transparency. Spend some time adjusting the opacity function
(moving, adding, and deleting points) to get a good idea of how this mapping will affect
your image. You may also add points on the graph line in the transfer function by
clicking on the graph line at the desired point. To delete a point, click on the point and
then hit delete on your keyboard. At any point you can reset the original volume
appearance to its preset by selecting (highlighting in blue) that preset in the Control
Panel.
Now we will adjust the color settings. Start by double clicking on the red point in the
Scalar Color Mapping area. This provides a color selection popup window that allows
you to set the color of the point. You can change the color of the point using a range of
19
Copyright © 2009 Kitware, Inc.
color modification interfaces including RGB and HSV text areas and the mouse based
color selection box.
So far the images we have been viewing in the volume display area have been shaded.
We will now disable shading by clicking on the small sphere icon in the C/O Tab and
unselecting the Enable Shading Button. This will cause the volume to be rendered
without shading. Turn shading back on by clicking on the small sphere icon again and
reselecting the Enable Shading Button. Try selecting each of the Presets shown for
different shading effects. The right-most sphere represents a shiny, or highly specular, set
of shading parameters.
There are more features available on this C/O Tab and right mouse menu than can be
covered in a simple tutorial. This panel is one of the most complex interfaces in ISP 2.2,
and defines the core parameters that affect the volume rendered image. It is important
that you spend some time becoming familiar with the use of this panel in order to produce
effective visualizations of your data. Please read the Control Panel chapter later in the
document for more details. You may also wish to consult a textbook that covers basic
volume rendering if you are unfamiliar with the underlying principals. One
recommendation would be chapter 7 in The Visualization Toolkit: An Object-Orientated
Approach to 3D Graphics (3rd Edition) ISBN 1-930934-07-6.
5 Loading Your Own Data
Using the Open File option on the File menu, you can load image or volumetric data as
well as previously saved sessions and appearance settings files. A session file is saved
using the Save Session option on the File menu in ISP. These files contain all the
parameters of ISP, and a pointer to the data (the session file itself does not contain the
data). The dialog that opens when you select the Open File option is dependent on the
operating system. For Windows Vista, the dialog will appear similar to the one shown
below:
In addition to using the Open File option on the File menu to load data, you can also
select a recently viewed file from a list using the Open Recent File option on the File
20
Copyright © 2009 Kitware, Inc.
menu. When you load data this way, the parameters that you entered previously on the
Open File Wizard will be retrieve, and the Open File Wizard will not be displayed. If you
need to change some configurable parameter in the Open File Wizard, you should instead
use the Open File option. This option will always display the Wizard, even though the
previous values could be retrieved from the auxiliary .vvi file stored when you last
opened this dataset.
To load a session file, select the ISP Session option from the Files of type menu. Use the
Open File dialog to browse your disk for the specific file. Press Open (or double click on
the session file name) to load it. If the data referenced inside the session file cannot be
found automatically, another dialog will appear asking you to locate this file.
To load a 3D dataset, simply locate it using the Open File browser, press Open, then
follow the instructions on the Wizard.
To open a series of 2D data files, locate any one of the files from the series and press
Open. ISP should automatically detect the entire set of images in the series, provided that
they all reside in the same directory, they all have the same basic parameters (such as
width and height) and they all follow some simple naming pattern (such as image.1.tif,
image.2.tif, etc.).
ISP supports both 3D (volume) and 2D (series of images) datasets in a variety of formats.
Since these data files do not contain all of the information that may be necessary for
accurate visualization, a Wizard will open to guide you through setting these values.
5.1 The Open Wizard
The Open Wizard will guide you through loading a dataset and setting parameters that
could not be retrieved directly from the data you are opening. In addition, it allows you to
change some automatically determined values. The exact appearance and configuration
of this Wizard will depend on the dataset you are opening. A few examples are given
here to guide you through entering the values in this Wizard. Depending on your data,
you may not encounter all of these dialogs, or you may encounter them in a different
order.
When opening a series of image files, the first page displayed by the Open Wizard will
appear similar to the example shown below.
21
Copyright © 2009 Kitware, Inc.
You have the choice of opening a single 2D or 3D image or loading a series of 2D images
to form a 3D dataset. If your data consists of a series of 2D slices that comprise a 3D
dataset, as is often the case with 3D medical data stored in DICOM format, select “My
data is stored in a series of 2D files”. If your data is a series of DICOM images, ISP will
likely be able to determine all of the additional information needed from the DICOM
header to properly load your dataset. If your data is a collection of images in a standard
image format such as tiff or bmp, you will be presented with a series of popup windows
requesting additional information. These may include a file pattern window such as the
one below:
The instructions on this window ask you to provide a filename pattern for specifying the
pattern to be used when reading sequential files from the file system. You will also be
asked to provide the starting and ending slice number. ISP will attempt to determine this
information given the file that you selected. You should verify that the filename pattern,
starting slice, and ending slice information is correct to ensure your data is loaded
correctly.
Additional popup windows include requests for information on the origin and spacing of
your data, your data units, and the slice ordering of your data.
5.2 Supported 2D and 3D File Formats
22
Copyright © 2009 Kitware, Inc.
ISP supports image datasets that have a data type of signed or unsigned char, short, or int,
as well as float or double. These files could have 1 to 4 components per sample point. For
two-component data, this can be either two independent components, or the first
component could be used to define color while the second is used to define opacity. For
three-component data, these can be three independent components or RGB. For fourcomponent data, these can either be four independent components, or RGBA. For threeor four-component data that is not independent, the data type must be unsigned char. Not
all file formats support all of these types of data.
The supported 2D and 3D data file formats are:
DICOM: DICOM data is generated by many medical scanning devices. ISP cannot read
all DICOM files. For example, if the scanning parameters (such as field of view) were
changed during the acquisition of an image series, ISP will be unable to read the data. ISP
will also not be able to read the data if CT data was acquired with gantry tilt.
GE Signa: GE Signa data is created by some General Electric CT and MR scanners, and
will typically have a .mr or .ct extension.
BioRad Confocal: These files are created from a BioRad Confocal Microscope, and will
typically have a .pic extension.
Zeiss LSM: These files are created from the Zeiss Microscope and typically have an .lsm
extension.
Metamorph Stack: Metamorph Stack Files are the output type produced by MetaMorph
and the MetaMorph Imaging Series applications. These files are a derivative of the TIFF
format, and typically have a .stk extension.
Analyze: Analyze files are created from the Analyze volume visualization application
and will typically have an .hdr extension.
VTK: ISP can read files written by the Visualization Toolkit. This includes image data
stored in the older *.vtk format, as well as the newer *.vti format.
VolVis: VolVis files are created from the VolVis volume visualization application and
will typically have a .slc extension.
BMP Images: A series of Windows bitmap files can be read to form a volume. The
extension is typically .bmp.
JPEG Images: ISP can read a series of JPEG image files to form a volume. The extension
is typically .jpg or .jpeg.
PNG Images: A series of PNG files can be read to form a volume. The extension is
typically .png.
23
Copyright © 2009 Kitware, Inc.
PNM Images: ISP can read a series of PNM files to form a volume. The extension of
these files may be .pnm, .pgm or .ppm.
TIFF Images: A series of TIFF images can be read to form a volume. The extension is
typically .tif, or .tiff.
Raw Data: Raw data files may be a series of 2D raw files or one 3D raw files. Raw files
contain a header followed by X*Y*C (2D) or X*Y*Z*C (3D) data values, where X, Y,
and Z are the dimensions of the data, and C is the number of components.
6 Application Settings
The Application Settings panel (found in the View Menu on the main toolbar) is used to
control the general behavior of ISP. A description of each setting area follows.
6.1 Interface Settings
The Interface Settings area of the Application Settings panel contains a set of check
boxes controlling the basic behavior of ISP, these settings are retained across sessions of
ISP and will appear similar to the example shown below:
Confirm on exit: When this box is checked, ISP will display a dialog box requiring you to
confirm or cancel the operation when you exit ISP. If this box is not checked, exiting ISP
will cause the application to close with no opportunity to cancel the operation.
Confirm send error log on exit: ISP tracks errors that are encountered during a session
and displays them in a popup window accessible from the Window menu. When this box
is checked the user is asked to confirm if error log information is permitted to be sent
back to Kitware via email. Email of error log information is only requested upon exit of
ISP and if an error was encountered.
24
Copyright © 2009 Kitware, Inc.
Save window geometry on exit: When checked, ISP will save the width, height, and
position of the ISP application. When restarting ISP, it will appear with the same
geometry as when it was last run. If this box is not checked then the default size and
position are used.
Show splash screen: When checked, a splash screen showing startup progress will be
displayed when ISP is launched; otherwise, the splash screen will not be displayed, and
the ISP application will appear once all initialization is complete. This may require
several seconds from the time you double click on the ISP icon, depending on the speed
of your computer and your current ISP configuration.
Show balloon help: When the mouse cursor is held still over a user interface element for
a few seconds, a small yellow pop-up will appear with a short message (tool tip)
explaining the function of a specific button or menu. If this box is not checked, then this
functionality will be disabled.
Position of view panel: The position of the viewing area within the application is set with
this menu. You may configure the viewing area to appear on the left or right side of the
application window.
6.2 Toolbar Settings
The Toolbar Settings area of the Application Settings panel allows you to control the way
the toolbar appears. Each of the check boxes is described below.
Flat frame:
Checking this option will remove the raised frame around the
toolbar.
Flat buttons: Checking this option will remove the raised frame around each of
the buttons in the toolbar.
6.3 Print Settings
The DPI Setting allows the user to set the resolution (expressed as Dots Per Inch) of
images that are sent to the printer. Supported values include 100, 150, 300, and 600 DPI.
6.4 Graphics Settings
In the future, the Graphics Settings area will contain graphics specific options.
6.5 Preset Settings
The “Create preset thumbnails automatically” setting allows a user to specify when
volume appearance preset thumbnails are created. When selected, all preset thumbnails
25
Copyright © 2009 Kitware, Inc.
are created when the data is loaded, which may take a few seconds to complete. When
this option is deselected, thumbnails are created as each preset is selected/highlighted.
7 Display Windows
The display area of the application consists of one or more viewing windows, each of
which is capable of displaying one of the datasets loaded into ISP. The currently active
window will be displayed with a green border highlight.
7.1 Data Display Types
Six interactive display representations are created for each 3D dataset that is loaded into
ISP and each of these can be placed in any of the display windows. The first figure in the
User Interface section of this manual (Section 2) shows a 2 column by 3 row layout with
all six display representations visible for a single 3D dataset. The data display
representations are:
1.
2.
3.
4.
5.
6.
Volume: Displays a 3D rendering of a dataset.
X-Y or Axial: Displays a 2D slice of a dataset on an X-Y plane.
X-Z or Sagittal: Displays a 2D slice of a dataset on an X-Z plane.
Y-Z or Coronal: Displays a 2D slice of a dataset on a Y-Z plane.
Lightbox: Displays an MxN tiled set of 2D slices of a dataset.
Oblique: Displays a 2D slice of a dataset on an oblique plane.
Only X-Y or Axial image displays are available for 2D datasets loaded into ISP.
7.2 Image Display Windows
An Image display window contains the following information:
26
Copyright © 2009 Kitware, Inc.
The Display Pulldown, represented by a down arrow icon in the top left corner of a
display window, allows the user to select which combination of dataset and display type
will appear in the window.
The Display Type area shows the current display type selected for the window.
The Slice Slider appears on the left-hand side of an image display window and contains a
slider handle that allows the user to interactively select the slice to be displayed.
Corner annotations are provided in each of the four corners of the window. When
viewing DICOM data, corner annotation in an Image window consists of the following
information:
Top Left:
<Display Type>
: The type of display/image orientation
<Modality> <Manufacturer> <Manufacturer Model> <Station>
Exam: <M>
: M = Study ID
Series: <N> (<D>)
: N = Series Number, D = Series Description
Image <X / Y>
: X = Current Index, Y = Last Index
<P>
: The slice position
Bottom Left:
27
Copyright © 2009 Kitware, Inc.
When the modality is CT, the annotation lines are (top to bottom):
mA: <M>
: M = tube current expressed in milliamps
kVp: <P>
: P = tube power expressed in killivolts
Thick: <T>
: T = Slice thickness expressed in mm
<Application Name and Version>
When the modality is MR, the annotation lines are (top to bottom):
TR: <R>
: R = Repitition time
TE: <E>
: E = Echo time
Thick: <T>
: T = Slice thickness expressed in mm
<Application Name and Version>
Top Right:
<Institution Name>
<Patient Name>
<Patient ID>
<Age> <Gender> <Birthdate>
<Acquisition Date> <Acquisition Time>
Bottom Right:
WW/WL: <WW> / <WL>
: WW = Window, WL = Level
When viewing other types of data, corner annotations will display:
Top Left:
<Display Type>
Image <X / Y>
<P>
: The type of display/image orientation
: X = Current Index, Y = Last Index
: The slice position
Bottom Left:
<Application Name and Version>
Top Right:
Dataset filename
Bottom Right:
WW/WL: <WW> / <WL>
: WW = Window, WL = Level
Side annotation displays the orientation of the image on the outer periphery of the
window.
28
Copyright © 2009 Kitware, Inc.
Pressing the right mouse button in an Image display window will open the Mouse Menu,
as shown in the figure above. The Mouse Menu consists of a top area for selecting the
Image interaction operation that will be performed when pressing the left mouse button
and several selections that specify how to display information in the window, such as a
selection for enabling/disabling the corner image annotations.
The Image Display Window interaction operation may be set to one of the following
functionalities:
Window/Level: manipulates the color ramp applied to the image. A left mouse
drag to the right/left will increase/decrease the width of a linear intensity
mapping, whereas moving up/down will increase/decrease the location of the
ramp in the available intensity range.
Pan: manipulates the location of the image in the window. A left mouse drag
moves the location of the image in the viewing window.
Zoom: manipulates the magnification of the image in the window. A left mouse
drag up/down will increase/decrease the magnification of the image.
Pressing and dragging the left mouse button in an Image window will execute the
currently selected 2D interaction operation (Window/Level, Pan or Zoom). When
Window/Level mode is selected as the 2D interaction operation, it is possible to
temporarily change the 2D interaction mode by pressing the Shift key (to pan) or the Ctrl
key (to zoom) during a left mouse drag. You may reset the location and magnification of
an image window by pressing the “R” key on your keyboard. Make sure that the
appropriate image window is selected (it will be outlined in green) before resetting the
image.
The next set of selections in the Mouse Menu toggle the following image display
annotations:
Corner Annotation: Annotations shown in all four corners of the image.
Side Annotation: Annotations shown on all four sides of the image.
Scale Bar: A scale bar displaying a distance reference at the bottom of the image.
The right Mouse Menu also provides a selection for setting the 2D interpolation method
(nearest neighbor or bilinear) and resetting the display of the image/camera.
At the bottom of the right Mouse Menu are three additional selection options:
Reset Window/Level: Resets the window/level to ramp across the entire range of
pixel values.
29
Copyright © 2009 Kitware, Inc.
Color Mapping: You may select one of:
Raw: Applies a grey scale color ramp to the image.
Color Mapped: Applies the Scalar Color Mapping to the image.
Color Mapped – Opacity Modulated: Applies the Scalar Color Mapping and
the Scalar Opacity Mapping to the image.
Background Color: The background to be displayed surrounding the image can be
specified with this sub-menu. The colors selected in the sub-menu specify
the colors to blend to form a gradient image.
7.3 Volume Display Windows
A Volume display window contains the following information:
The Display Pulldown, represented by a down arrow icon in the top left corner of a
display window, allows the user to select which combination of dataset and display type
will appear in the window. The Display Type area shows the current display type selected
for the window, which in this case is “Volume”. Several types of annotations may be
selected for display with the volume. The Color Bar, when requested, appears on the lefthand side of an image display window. Corner Annotations are provided in each of the
30
Copyright © 2009 Kitware, Inc.
four corners of the window. When viewing DICOM data, corner annotation in a Volume
window consists of the following information:
Top Left:
<Display Type>
: The type of display/image orientation
<Modality> <Manufacturer> <Manufacturer Model> <Station>
Exam: <M>
: M = Study ID
Series: <N> (<D>)
: N = Series Number, D = Series Description
Bottom Left:
When the modality is CT, the annotation lines are (top to bottom):
mA: <M>
: M = tube current expressed in milliamps
kVp: <P>
: P = tube power expressed in killivolts
Thick: <T>
: T = Slice thickness expressed in mm
<Application Name and Version>
When the modality is MR, the annotation lines are (top to bottom):
TR: <R>
: R = Repitition time
TE: <E>
: E = Echo time
Thick: <T>
: T = Slice thickness expressed in mm
<Application Name and Version>
Top Right:
<Institution Name>
<Patient Name>
<Patient ID>
<Age> <Gender> <Birthdate>
<Acquisition Date> <Acquisition Time>
Bottom Right:
<Orientation>
: Location of orientation cube, when shown
When viewing other types of data, corner annotations will display:
Top Left:
Volume
: Specifies the Volume display type
Bottom Left:
<Application Name and Version>
31
Copyright © 2009 Kitware, Inc.
Top Right:
Dataset filename
Bottom Right:
<Orientation>
: Location of orientation cube, when shown
The Scale Bar may be displayed and when activated it is shown at the bottom of the
image window and displays a reference distance in the same units as the displayed
dataset.
A 3D Bounding Box may also be displayed and will be displayed in the display area
surrounding the dataset.
A 3D Orientation Cube may be displayed and appears in the bottom right corner of a
Volume window. The cube is aligned with the 3D dataset and the labels on the cube show
the primary viewing directions visible from the current viewing position.
Pressing the right mouse button in a Volume display window will open the Mouse Menu,
as shown in the Figure above. The Mouse Menu consists of a top area for selecting the
Volume interaction operation that will be performed when pressing the left mouse button
and a bottom area for enabling/disabling the available volume annotations and other
Volume display options.
The Volume Display Window interaction operation may be set to one of:
Rotate: performs a 3D rotation of the dataset.
Pan: moves the location of the dataset in the Volume Display Window. A left
mouse drag moves the location of the volume in the viewing window.
Zoom: manipulates the size of the volume projection in the Volume Display
Window. A left mouse drag up/down will increase/decrease the size of the
projection in the window.
Pressing and dragging the left mouse button in a Volume window will execute the
currently selected 3D interaction operation. It is possible to temporarily change the 3D
interaction mode by pressing the Shift or Ctrl keys during a left mouse drag, when Rotate
Mode is selected. Pressing Shift during a left mouse drag will apply a Pan operation and
pressing Ctrl will apply a Zoom operation. You may reset the location and magnification
of a volume by pressing the “r” key in an image window. Make sure that the appropriate
image window is selected (it will be outlined in green) before resetting the image.
The volume annotation selections at the bottom of the Mouse Menu toggle the display of
the following volume display annotations:
32
Copyright © 2009 Kitware, Inc.
Corner Annotation: Annotations shown in all four corners.
Orientation Cube: A 3D orientation cube is shown in the lower right corner.
Scale Bar: A scale bar displays a distance reference at the bottom of the window.
Color Bar: A color bar is shown on the left-hand side of the window.
Bounding Box: A 3D bounding box is shown surrounding the dataset.
The right mouse menu also has a selection area for the virtual camera used to display the
dataset. This section of the menu contains a selection for resetting the camera position,
selecting a parallel or perspective viewing transformation, and selecting from one of 6
orthogonal viewing directions.
The viewing transformation is set to Parallel by default. This setting allows all objects in
the rendering to appear the same size regardless of their actual location in the image. The
viewing transformation may also be set to Perspective to obtain more realistic renderings,
where objects that are distant appear smaller than those closer to the observer.
The Projection Type contains a Standard View selection with a sub-menu containing six
buttons for placing the viewing position at differing locations around the dataset:
• L: positions the viewer at the Left of the 3D dataset (+X viewing vector).
• R: Positions the viewer at the Right of the 3D dataset (-X viewing vector).
• P: Positions the viewer Posterior to the 3D dataset (+Y viewing vector).
• A: Positions the viewer Anterior to the 3D dataset (-Y viewing vector).
• S: Positions the viewer Superior to the 3D dataset (+Z viewing vector)
• I: Positions the viewer Inferior to the 3D dataset (-Z viewing vector).
The bottom of the right mouse menu contains a Background Color sub-menu. This submenu allows the user to select a gradient background for the Volume Display or a
constant color background. The Primary Background Color selection is used to define the
color of the background when a
constant color is desired. When
a gradient is selected, the
background displays a gradient
of colors blending from the
Primary Background Color to
the Secondary Background
Color. The Figure on the right
shows a CT head dataset
displayed with a gradient
background that transitions
from black to gray.
33
Copyright © 2009 Kitware, Inc.
8 Control Panel
The ISP Control Panel (see also Section 4: The User Interface) provides tools and
information for working with 2D and 3D datasets. The panel contains the following five
property tabs:
•
Color/Opacity Settings Tab: provides tools for setting color and opacity display
properties. These settings mostly apply to Volume Display windows.
•
Window/Level Settings Tab: provides tools for setting window/level display
properties. These settings mostly apply to 2D Image Display windows.
•
Analyze Tab: provides tools for measurement, modification, and analysis of data.
•
Review Tab: provides tools for summarizing a visualization session including the
management of snapshots and the creation of movies.
•
Plugins Tab: provides support for running standard or user defined source code on
loaded data.
•
Info Tab: provides additional information on a dataset.
•
Advanced Algorithms Tab: This tab is intended
for advanced algorithms. It currently supports
the segmentation of lung lesions in CT scans.
8.1 Color/Opacity Settings Tab
The Color/Opacity Settings Tab shows display settings
primarily for the Volume Display associated with the
active viewing window (i.e. the window with the green
highlight). The Color/Opacity Settings Tab will show
available Color/Opacity Presets and Color/Opacity
Settings (See Figure below and on the right).
8.1.1 Color/Opacity Presets
The Color/Opacity Presets area provides a scrollable
list of available volume rendering presets that can be
applied with a single click to the active volume display
window. The currently selected preset is highlighted in
blue and the color and opacity mapping for the preset is
displayed in the Color/Opacity Settings area just below
the Color/Opacity Presets area. When DICOM data has
34
Copyright © 2009 Kitware, Inc.
been loaded, only volume rendering presets for the image modality will be shown.
Buttons that allow the user to manage color/opacity presets are provided directly below
the preset list. The buttons, listed in left to right order, perform the following operations:
•
•
•
•
•
•
•
•
Previous: Select the previous preset (move up 1).
Next: Select the next preset (move down 1).
Add: Add a preset.
Update: Update the currently selected preset.
Delete: Delete the currently selected preset.
Locate: Locate the currently selected preset on disk.
Email: Email the selected preset.
Load: Load a preset.
8.1.2 Color/Opacity Settings
The Color/Opacity Settings area displays the current Scalar Opacity Mapping, which
when combined with the Scalar Color Mapping defines a volume rendering transfer
function. A Component selection menu is provided for selecting which component is
being displayed. This will always be “1” when single component data has been loaded, as
is often the case with commonly available CT and MR imaging datasets.
The Scalar Opacity Mapping, along with the dataset histogram (shown in dark grey), is
plotted in the drawing area below the Component selection. The horizontal axis
represents scalar values and the vertical axis represents opacity (ranging from zero to
one). The circular node points of the opacity mapping may be adjusted interactively by
clicking and dragging the point vertically or horizontally. Pressing the Page Up/Page
Down keys moves the currently selected point up/down by one. The “S:” and the “O:”
text entry areas show the scalar value and the selected opacity, respectively, for the
currently selected scalar opacity function point.
Selecting a square point along the function displays “M:” and “S:” text entry areas, each
with accompanying slider bars. The purpose of these values is to specify the interpolation
function between the program’s preset transfer function points. The value of the “M:”
text entry area defines the scalar location of the midpoint of the transition (analogous to
“Level” in the Window/Level Function) and the “S:” text entry area defines the sharpness
of the interpolation. A sharpness value of zero specifies a linear ramp (straight line), a
value of .5 specifies X interpolation (smooth curve), and a value of 1 specifies a step
function (sharp angle).
The Scalar Color Mapping, again with the dataset histogram, is plotted in the drawing
area below the Scalar Opacity Mapping area. Similar to the Scalar Opacity Mapping, the
horizontal axis represents scalar values. However, the vertical axis is not used in this
function display. The circular node points of the color mapping may be adjusted
35
Copyright © 2009 Kitware, Inc.
interactively by clicking and dragging the point horizontally. The color of the point
shows the color set at the selected point’s location in the function.
A bar with two endpoints is provided below the scalar opacity mapping and the scalar
color mapping functions. A particular location within the scalar range can be magnified
by adjusting the endpoints of the bar. Another bar is provided to the right of the volume
rendering transfer function for selecting an opacity range to display.
Two buttons for specifying volume appearance properties are located directly below the
Scalar Color Mapping function. Clicking on the left button (displayed as a sphere over a
checkerboard icon) opens up the Material Properties popup window. From within this
window the user is able to turn shading on/off as well as select from four different
shading presets. A close button is provided for closing the Material Properties popup
window.
A menu selection is provided directly to the right of the Material Properties button. This
selection menu specifies that either Volume Rendering or Maximum Intensity Projection
(MIP) rendering will be performed in the Volume Display Window. The color and
opacity of the maximum opacity encountered along a viewing ray will determine the
color and opacity of the rendered pixel when MIP rendering is selected. In order to
achieve a traditional MIP rendering using a single color hue, MIP rendering should be
selected, the Scalar Opacity Mapping should be set to a linear opacity ramp, and the
Scalar Color Mapping should be set to a constant white. The color of the Scalar Color
Mapping vertices (points) can be modified by double clicking on each point. This will
bring up the color popup window. Select a white color for a traditional MIP and click
OK. An example MIP preset for CT data is available in the Color/Opacity Presets list
provided with ISP.
8.2 Window/Level Settings Tab
The Window/Level Settings Tab is located directly to the
right of the Color/Opacity Settings Tab and provides
settings primarily for the 2D Image Displays associated
with the active viewing window (i.e. the window with
the green highlight). The Window/Level Settings Tab
will show available Window/Level Presets and
Window/Level Settings (See Figure below and on the
right)
8.2.1 Window/Level Presets
The Window/Level Presets area provides a scrollable list
of available presets that can be applied with a single
click to the 2D image display windows associated with
the highlighted dataset. All Image Display Windows for
36
Copyright © 2009 Kitware, Inc.
a loaded dataset are shown with the same Window/Level setting. The currently selected
preset is highlighted in blue and the window/level mapping for the preset is displayed in
the “W” and “L” columns and in the Window/Level Settings area just below the
Window/Level Presets area. When DICOM data has been loaded, only presets for the
image modality will be shown and the Window/Level presets embedded in the DICOM
data are shown in the list of available presets.
Buttons that allow the user to manage presets are provided directly below the
Window/Level preset list. The buttons, listed in left to right order, perform the following
operations:
•
•
•
•
•
•
•
•
Previous: Select the previous preset (move up 1).
Next: Select the next preset (move down 1).
Add: Add a preset.
Update: Update the currently selected preset.
Delete: Delete the currently selected preset.
Locate: Locate the currently selected preset on disk.
Email: Email the selected preset.
Load: Load a preset.
8.2.2 Window/Level Settings
The Window/Level Settings area displays the current Window/Level settings. A text area
is provided for individually setting the Window and Level values. In addition, a Reset
button is provided that will change the Window Level function to span the entire scalar
range. Below the Window/Level values is a text area showing the scalar range of the data
and the intensity mapping range. For Window/Level functions, the intensity mapping
always ranges from zero to one.
The Window/Level function, along with the dataset histogram (shown in dark grey), is
plotted in the transfer function below the Window and Level values. The points showing
the vertices of the Window/Level function may be adjusted interactively by clicking and
dragging the point. Pressing the PageUp/PageDown keys moves the currently selected
point up/down by one. The “P:” label, located directly below the Reset button, shows the
scalar value of the currently selected point and manual text entry allows the precise
setting of a point in the function. A bar with two endpoints is provided below the
Window/Level function. A particular location within the scalar range can be magnified
by adjusting the endpoints of the bar.
8.3 Analyze Tab
The Analyze Tab, located in the Control Panel and shown in the Figure on the right,
displays areas for Measurements/Annotations and Segmentation and provides tools for
performing measurements, annotations, and data modification. The
Measurements/Annotations area contains a list of measurements and annotations, a series
37
Copyright © 2009 Kitware, Inc.
of buttons for managing them, and an additional area for the display of their properties.
Shortcut buttons for these measurements and annotations are also available in the main
toolbar. They can be made to appear on the Application Toolbar by going to the Window
drop down menu, selecting Toolbars and then Measurement.
The Measurement/Annotation list displays the type of
measurement/annotation performed, its main value, its
visibility, its color, and a comment area for adding a text
description. Visibility of an entry in the list can be modified
by clicking on the toggle button and color can be modified
by double clicking on the color square and modifying the
color selection popup window. The list shows the currently
selected measurement/annotation highlighted in blue. All
measurements and annotations performed on image windows
remain visible when the slice displayed is changed.
Measurements and annotations for 2D images include linear
measurement, bi-dimensional measurement, angle
measurement, contour measurement, and arrow annotation.
When the active viewing window is a 3D volume display, all
forms of measurement are disabled except for arrow
annotation.
Buttons that allow the user to place and manage measurements and annotations are
provided directly below the list area. The buttons, listed in left to right order, perform the
following operations:
•
•
•
•
•
•
Linear: Place a linear measurement on the selected 2D window.
Bi-dimensional: Place a bi-dimensional measurement in the selected 2D window.
Angle: Place an angle measurement in the selected 2D window.
Contour: Place a contour measurement in the selected 2D window.
Arrow: Place an arrow in the selected 2D or 3D window.
Delete: Delete the currently selected measurement/annotation.
8.3.1 Linear Measurement
Clicking on the linear distance measurement icon and then clicking inside the active
image display window will place the first point of a linear measurement. Moving the
mouse will interactively draw a linear measurement widget. Clicking a second time in the
image display window will place the second point of the measurement widget. The
handles of the linear measurement widget, identified by white crosshairs, may be
modified interactively by using the mouse to click and drag the end widget points. The
linear measurement value will be displayed as a label next to the linear measurement and
will be shown in the value column for the measurement in the measurement list. In the
Figure shown below one of each measurement and annotation type was applied to the
38
Copyright © 2009 Kitware, Inc.
bottom left image display window. The measurement/annotation list is shown on the
Control Panel along with the properties of the selected contour measurement.
8.3.2 Bi-dimensional Measurement
Clicking on the bi-dimensional measurement icon and then clicking inside the active
image display window will place the first point of a bi-dimensional measurement.
Moving the mouse will interactively draw two measurements: linear and perpendicular.
Clicking a second time in the same image display window will place the endpoints of the
first line (linear) of a bi-dimensional measurement widget. Moving the mouse will
interactively draw a line emanating from the second point, perpendicular to the first line.
Clicking the mouse a third time will place the endpoints of the perpendicular line.
The second line will be drawn such that the distance from the end point of the second line
to the first line is half the total length of the second line; this distance may be modified on
the bi-dimensional measurement widget by clicking on the line segments and dragging
them around the line intersection point. The handles of the bi-dimensional measurement
widget, identified by white crosshairs, may be modified interactively by clicking on them
and dragging them to a new location. The bi-dimensional measurement value will be
displayed as a label next to the widget and will be shown in the value column for the
measurement in the measurement list.
8.3.3 Angle Measurement
Placement of an angle measurement is started by clicking on the angle measurement icon
and then clicking inside the active image display window. This will place the first point
of an angle measurement. Clicking a second time in the same image display window will
place the endpoint of the first line. Clicking a third time in the image display window will
place the endpoint of the second line, creating the angle widget. The handles of the angle
39
Copyright © 2009 Kitware, Inc.
widget, identified by white crosshairs, may be modified interactively by clicking on them
and dragging them to a new location. The angle measurement value will be displayed as a
label in the widget and shown in the value column for the measurement in the
measurement list.
8.3.4 Contour Measurement
Clicking on the contour measurement icon and then clicking inside the active image
display window will place the first point (displayed as a green square) of a Bezier contour
measurement. Additional mouse clicks will drop additional contour points. Clicking on
the first point again will close the contour and complete the contour widget. Each point of
the contour may be moved by clicking on it and dragging the point to the desired location
in the display window or on the contour line. An existing contour point can be removed
by clicking on it, at which point it will be active and displayed as an open circle, and
pressing the delete key. An additional point can be added to the contour by clicking on
the yellow contour path.
Image statistics for all pixels inside the contour are displayed in the Property list below
the measurement and annotation buttons. Contour image statistics include:
•
•
•
•
•
•
•
The area of the contour
The perimeter distance of the contour
The mean of the pixel values within the contour
The standard deviation of the pixel values within the contour
The minimum pixel value within the contour
The maximum pixel value within the contour
The number of pixels within the contour
When a contour measurement is selected and active in the measurement list the
Segmentation area is populated with several user interface elements for modifying the
dataset. This functionality is provided to allow the user to replace all pixel values inside
or outside a contour with a value.
The Replace text area is provided for the user to specify the value that will replace
modified voxels. The Inside/Outside menu selection allows the user to specify whether
values will be replaced inside or outside of the contour. The Volume/Slice menu selection
allows the user to specify whether the replace operation is applied on the entire volume or
the currently visible slice. When the volume is requested, the replace operation is applied
to all slices. The last button in the Segmentation area, displayed with a scissor and
contour icon, applies the replace operation to the dataset. Note: applying this
segmentation operation modifies the data and the original data values cannot be retrieved
without reloading the dataset.
8.3.5 Arrow/2D Labeling
40
Copyright © 2009 Kitware, Inc.
Clicking on the arrow/2D label icon (displayed as a pointing hand) and then clicking
inside the active display window will place an arrow annotation. A Label Properties area
will appear above the Segmentation area and show the properties of the arrow annotation.
Label properties include a text area for viewing and modifying the label text, a size slider
for modifying the size of the label text, a font selection, and three buttons for modifying
the style of the text (bold, italic, and shadow). In addition, the location of the arrow and
the label text can be modified interactively using the mouse within the display window.
The color of the arrow and text can be modified by double clicking on the color square
for the arrow annotation in the measurement and annotation list.
8.3.6 Deleting a Measurement
The measurement delete button is displayed as an icon with a garbage can. A
measurement or annotation can be removed permanently from the measurement list by
first clicking on the measurement/annotation in the measurement list, which highlights
the entry in blue, and then clicking on the measurement delete button.
8.4 Review Tab
The Review Tab, in the Control Panel, provides tools for creating and managing
snapshots and movies. Shortcuts to these features can also be placed in the main toolbar
by going to the Window drop down menu, selecting Toolbars and then Snapshot.
Snapshot and movie support is provided to allow the user to quickly save and summarize
data visualization results. The Figure on the right shows the Review Tab containing five
snapshots in the Snapshot list.
8.4.1 Snapshot
Saving a snapshot captures the full state of the ISP
application. ISP allows the user to save multiple snapshots
during a visualization session. This is useful for rapidly
indexing through a series of visualization concepts in a
single session. Saving the ISP session will not only save the
current state of ISP for future retrieval, but will also save all
snapshots.
The Snapshot area consists of a snapshot list area with
several snapshot management buttons below it. The buttons
perform the following operations (left to right):
• Previous: Selects the previous snapshot (move up 1).
• Next: Selects the next snapshot (move down 1).
• Add: Adds a snapshot to the list.
• Apply: Sets the system state to the currently selected
snapshot.
• Update: Updates the currently selected snapshot with
41
Copyright © 2009 Kitware, Inc.
•
the current system state.
Delete: Deletes the currently selected snapshot.
Clicking on the Add snapshot button adds a snapshot to the snapshot list area along with
a thumbnail showing the state of the ISP application at the time of the snapshot. This is
particularly useful when making measurements on a selected slice of a dataset. The
comment for the snapshot shows the date and time that the snapshot was added.
8.4.2 Movie
The movie area provides the ability to preview and create an AVI, MPEG2, TIFF, or
JPEG movie of a rotating/zooming volume (when requested for a Volume Display
Window) and the ability to preview and create an animation of a series of consecutive
image slices (when requested for a 2D Image Display Window). On Mac systems
MPEG2 movies are not available.
Specifying a Volume Display animation is performed using the following interface
controls:
Number of frames: This value specifies the number of frames in the output
animation. Smaller numbers will lead to faster animation creation times, but a
jumpier appearance. Larger numbers will provide a smooth appearance, but may
take a while to generate and may produce large AVI files (depending on the
compression type).
X rotation (azimuth): Use this area to specify the total rotation about the X axis
(of the viewing coordinate system) that will occur during the animation. This is
specified in degrees, so if you want a full rotation you would enter 360.
Y rotation (elevation): This value indicates the total rotation about Y axis (of the
viewing coordinate system) that will occur during the animation.
Z rotation (roll): This value specifies the roll (rotation around the viewing
coordinate Z axis) that will occur during the animation.
Zoom factor: The zoom factor is a value that indicates how much you will zoom
in or out during the animation. The number should be close to 1.0 (1.0 indicates
no zoom) where values above 1.0 indicate zooming in, and values below 1.0
indicate zooming out.
Specifying an Image Display animation is performed using the following interface
controls:
Number of frames: This value specifies the number of frames in the output
animation. Smaller numbers will lead to faster animation creation times, but a
jumpier appearance. Larger numbers will provide a smooth appearance, but may
42
Copyright © 2009 Kitware, Inc.
take a while to generate and may produce large movie files (depending on the
compression type).
Starting slice: This value indicates the starting slice for the animation.
Ending slice: This value indicates the ending slice for the animation.
The user interface for creation of movies for Volume Display and Image Display
windows both contain the following three buttons for producing a movie:
Preview: The preview button will allow you to view the animation in the volume
or image window. For 3D Volume animations, an interactive volume rendering
rate will be used for the preview, while a higher quality rendering will be used
when the animation is created.
Create: The create button will pop up a Save Animation dialog allowing you to
specify the location and file name of your animation. The file type will be AVI
and therefore the animation file will have an .avi extension. This will be added to
the filename if you do not enter it here. Once you've selected the file name, the
Video Compression dialog will be displayed allowing you to select a compressor
type for this file. Note that this is a standard Windows dialog (which will appear
similar to the one shown on the right) but not every compression format will be
supported by your system. Uncompressed Full Frames will always work. You
may need to experiment with a few of the compressed types to determine if it is
supported by your system, how much compression is achieved, and what the best
trade-off is for image size versus image quality. This trade-off is controlled with
the Compression Quality Slider.
During creation, the images will be rendered into a memory buffer, and the
progress of the animation creation will be displayed on the main progress gauge
in the upper right corner of the application. This means that it is safe to close ISP
or pop other windows on top of it without affecting your animation.
Cancel: The cancel button can be used to cancel the preview or the creation of an
animation.
8.5 Info Tab
The Info Tab displays additional information on the data shown in the active window,
similar to the figure below:
43
Copyright © 2009 Kitware, Inc.
Here you can find information on a dataset such as:
• Scope:
Whether ISP is displaying in medical or scientific mode
• Images:
Number of images loaded
• Distance Units:
Units used to express distance
• Voxel Dimensions: Number of voxels in X, Y, and Z
• Physical Dimensions: Physical size of dataset
• Voxel Spacing:
Distance between samples along X, Y, and Z
• Scalar Units:
Units used to express a scalar value at a voxel location
• Scalar Range:
Maximum and minimum scalar value in the dataset
• Scalar Size:
Amount of memory used to express a scalar value
• File Name:
Name of the file loaded
• Directory:
Directory path of the file loaded
8.6 Plugins Tab
The Plugins Tab contains a list of filters and algorithms that can be applied to volumes.
They range from simple image processing filters to more complex algorithms for image
segmentation and registration. Its goal is to assist algorithm developers by providing a
visualization application into which they can insert their algorithms.
The following plugins are included with ISP :
Noise Suppression
_ Gaussian smooth (VTK)
_ Median Filter (VTK)
_ Median Filter (ITK)
_ Dilate Filter (ITK)
_ Erode Filter (ITK)
_ Curvature Flow Filter (ITK)
_ Curvature Anisotropic Diffusion Filter (ITK)
44
Copyright © 2009 Kitware, Inc.
_ Gradient Anisotropic Diffusion Filter (ITK)
Binary Hole Filling
Voting based hole filling
Edge Detection
_ Canny edge detection (ITK)
Utility
_ Gradient Magnitude (VTK)
_ Gradient Magnitude (ITK)
_ Gradient Magnitude IIR (ITK)
_ Crop (C)
_ Threshold (C)
_ Merge Volumes (C)
_ Boundary (C)
_ Component Arithmetic (C)
Danielsson Distance map
Masking
Subsample
Checkerboard filter
Level Sets Segmentation
_ Geodesic Active Contour Filter (ITK)
_ Watershed Module (ITK)
_ Fast Marching Filter (ITK)
Region Growing Segmentation
_ Confidence Connected (ITK)
_ Isolated Connected (ITK)
_ Connected Threshold (ITK)
Statistical segmentation
KMeans
Markov Random field based smoothing
MRF + KMeans
Intensity Transformations
_ Sigmoid (ITK)
_ Intensity Windowing (ITK)
Rescale intensity to 8 bits (ITK)
Surface Generation
_ 4th Order level set (ITK)
_ Anti-Alias (ITK)
Registration
Normalized Mutual Information based Rigid
Mattes MI based multiresolution rigid registration
Mattes MI based multiresolution affine registration
8.6.1 Inserting your own plugins into ISP
This section describes the basic steps required for writing a new plugin. A plain Clanguage interface has been defined in ISP, that allows very generic methods to interface
45
Copyright © 2009 Kitware, Inc.
with the internal data representation. Another interesting aspect of the integration is that it
is implemented in the form of run-time plugins. This means that the shared libraries
containing the user’s compiled plugin must be placed in the Plugins/ directory where ISP
will look for them.
The example here illustrates the implementation of a simple filter having only one
parameter to be set from the GUI. The example assumes that the filter is written using the
Insight Segmentation and Registration Toolkit (ITK) but should be general enough for
the reader to apply to other toolkits, or C / C++ implementation as well. The next section
contains a detailed skeleton (in C++) which will walk you through the steps of creating
your own plugin. In the following four sections actual examples are given for C, C++,
VTK, and ITK. These examples are filters available in ISP. To install a new plugin in
ISP, you would place the new dll in the Plugins directory in the installation directory.
Once you have placed the new plugin in the Plugins directory, they will be available the
next time you start ISP.
Plugin Life Cycle
The process of developing an ISP plugin is depicted in the figure below. A single public
header file defines the plain C-Language data structures used for exporting and importing
data, and for transferring GUI parameters between the ISP GUI and the plugin. A plugin
developer must implement a set of C-Language functions that will be invoked by ISP
during its interactions with the plugin. The source code of the plugin is compiled and
packaged in the form of a shared library. No libraries from ISP are required during this
process. The shared library containing the plugin is finally copied into a specific directory
of the ISP binary installation. This particular directory is searched by ISP at start-up time.
Any shared libraries found in this directory will be dynamically loaded. The name of the
library should conform to the name of the plugin initialization function. The development
cycle of a plugin is totally decoupled from ISP’s internal code. The single communication
bridge between the plugins and the application is the header file defining the data and
GUI structures. A developer of a new plugin, must simply implement the methods
defined in the public header file.
Defining the plugin name
The plugin name will determine the name of the shared library used for deployment. It
will also determine the name of the initialization function. For example a plugin named
vvITKGradientMagnitude will be deployed in a shared library with name
libvvITKGradientMagnitude.so in Unix/OsX, and vITKGradientMagnitude.dll on MSWindows. Its initialization function will be called vvITKGradientMagnitudeInit().
46
Copyright © 2009 Kitware, Inc.
The initialization function
The initialization function of the plugin must conform to the following API
extern "C" {
void VV_PLUGIN_EXPORT vvITKGradientMagnitudeInit(vtkVVPluginInfo
*info)
{
}
}
where the symbol VV PLUGIN EXPORT and the structure vtkVVPluginInfo are both
defined in the public header file vtkVVPluginInfo.h. This initialization function is
invoked by ISP at start-up time, just after the shared library has been dynamically loaded.
The typical content of this function is shown below.
{
vvPluginVersionCheck();
// setup information that never changes
info->ProcessData = ProcessData;
info->UpdateGUI = UpdateGUI;
info->SetProperty(info, VVP_NAME,
"Gradient Magnitude IIR (ITK)");
info->SetProperty(info, VVP_GROUP, "Utility");
info->SetProperty(info, VVP_TERSE_DOCUMENTATION,
"Gradient Magnitude Gaussian IIR");
info->SetProperty(info, VVP_FULL_DOCUMENTATION,
"This filter applies IIR filters to compute the
equivalent of convolving the input image with the
derivatives of a Gaussian kernel and then computing
the magnitude of the resulting gradient.");
info->SetProperty(info, VVP_SUPPORTS_IN_PLACE_PROCESSING, "0");
info->SetProperty(info, VVP_SUPPORTS_PROCESSING_PIECES, "0");
info->SetProperty(info, VVP_NUMBER_OF_GUI_ITEMS, "1");
info->SetProperty(info, VVP_REQUIRED_Z_OVERLAP, "0");
info->SetProperty(info, VVP_PER_VOXEL_MEMORY_REQUIRED, "8");
}
47
Copyright © 2009 Kitware, Inc.
First, the macro vvPluginVersionCheck() must be called in order to verify that the plugin
API conforms to the current version of ISP’s binary distribution. When the versions do
not match, the plugin is not executed and an error message is reported to the user at runtime. Once the version number has been validated, the info structure is initialized. The
ProcessData member of this structure is set to the pointer of the function that will
perform the computation on the input data. Setting the function as a function pointer
allows for considerable freedom in the implementation of the function. Likewise the
UpdateGUI pointer in the info structure is also set to a function pointer. The function
SetProperty() is used to define general properties of the plugin. Some of these properties
are displayed on the GUI as informative text. For example, the textual name of the
plugin, terse and extended documentation. The properties are identified by tags. This
enforces further the decoupling between the internal representation of information in ISP
and the structure of code in the plugin. For example the tag VVP NAME specifies that
the string being passed as third argument of the SetProperty() method should be used for
the text label of the plugin in the GUI. Other non-GUI properties are also set with this
method. For example, we specify whether this filter is capable of performing in-place
processing or not, whether it allows to process data in pieces (streaming) or not. We also
provide an estimate of the memory consumption that will result from the execution of the
filter. This last information is provided in the form of an estimation of number of bytes to
be used per voxel of the input data set. Memory consumption estimation is of
fundamental importance for the successful coupling between ISP and the plugin. ISP will
use this factor for making sure that the system has enough memory for completing the
processing of the plugin and for determining if the undo information can be kept. Note
that this estimate is not based on the size of the final data set produced as output but on
the total amount of memory required for intermediate processing. In other words, it
should provide the peak of memory consumption during the plugin execution. The
initialization function, in this case
vvITKGradientMagnitudeInit(), will be called only once during the start-up process of
ISP.
The ProcessData function
The ProcessData() function actually performs the computations on the data. The signature
of this function is:
static int ProcessData(void *inf, vtkVVProcessDataStruct *pds)
where the first argument is actually a pointer to a vtkVVPluginInfo structure that can be
downcasted to it by doing
vtkVVPluginInfo *info = (vtkVVPluginInfo *)inf;
The second argument to ProcessData() is the vtkVVProcessDataStruct. This structure
carries the information on the data set to be processed, including the actual buffer of
voxel data, the number of voxel along each dimensions in space, the voxel spacing and
the voxel type among others. Of particular interest in this structure are the members
inData that is a pointer to the data buffer of the input data set, and the outData that is a
48
Copyright © 2009 Kitware, Inc.
pointer to the output data set buffer. The ProcessData() function is expected to extract the
data from the inData pointer, process it and store the final results in the outData buffer.
The typical starting code of this function involves extracting the meta information about
the data set. The following code shows for example, how to extract the dimensions and
spacing of the data set from the vtkVVProcessDataStruct and vtkVVPluginInfo
structures.
SizeType size;
IndexType start;
double origin[3];
double spacing[3];
size[0] = info->InputVolumeDimensions[0];
size[1] = info->InputVolumeDimensions[1];
size[2] = pds->NumberOfSlicesToProcess;
for(unsigned int i=0; i<3; i++)
{
origin[i] = info->InputVolumeOrigin[i];
spacing[i] = info->InputVolumeSpacing[i];
start[i] = 0;
}
Using this information, the image data can be imported into an ITK image using the
itkImportImageFilter.
RegionType region;
region.SetIndex( start );
region.SetSize( size );
m_ImportFilter->SetSpacing( spacing );
m_ImportFilter->SetOrigin( origin );
m_ImportFilter->SetRegion( region );
m_ImportFilter->SetImportPointer( pds->inData,
totalNumberOfPixels, false );
The output of the import filter is then connected as the input of the ITK data pipeline and
the pipeline execution can be triggered by calling Update() on the last filter.
m_FilterA->SetInput(
m_FilterB->SetInput(
m_FilterC->SetInput(
m_FilterD->SetInput(
m_FilterD->Update();
m_ImportFilter->GetOutput() );
m_FilterA->GetOutput() );
m_FilterB->GetOutput() );
m_FilterC->GetOutput() );
Finally the output data can be copied into the pointer provided by ISP. This is typically
done using an ITK image iterator that will visit all the voxels.
outputImage = m_Filter->GetOutput();
typedef itk::ImageRegionConstIterator< OutputImageType >
OutputIteratorType;
OutputIteratorType ot( outputImage, outputImage>GetBufferedRegion() );
OutputPixelType * outData = static_cast< OutputPixelType * >(
pds-
49
Copyright © 2009 Kitware, Inc.
>outData );
ot.GoToBegin();
while( !ot.IsAtEnd() )
{
*outData = ot.Get();
++ot;
++outData;
}
When memory consumption is critical, it is more convenient to actually connect the
output memory buffer provided by ISP to the output image of the last filter in the ITK
pipeline. This can be done by invoking the following lines of code before executing the
pipeline.
m_FilterD->GetOutput()->SetRegions(region);
m_FilterD->GetOutput()->GetPixelContainer()->SetImportPointer(
static_cast< OutputPixelType * >( pds->outData ),
totalNumberOfPixels, false);
m_Filter->GetOutput()->Allocate( );
The current distribution of ITK provides support for not having to write this same code
for each new plugin. A templated class is available for providing these basic services.
New plugins only need to define their own ITK pipelines and invoke the methods of the
base class in the appropriate order.
Refreshing the GUI
Given that the execution of most image processing algorithms take considerable time on
3D data sets, it is important to provide some feedback to the user as to how the
processing is progressing. This also provides a chance for the user to cancel the operation
if the expected total execution time is excessively long. This notification can be done
from within the ProcessData() function by calling the UpdateProgress() function of the
vtkVVPluginInfo structure. For example:
float progress = 0.5; // 50% progress
info->UpdateProgress( info, progress, "half data set processed");
This function will update the progress bar on ISP’s GUI and will set the last string as a
message in the status bar. There is a balance to be found concerning the frequency with
which this function should be invoked. If invoked too often, it will negatively impact the
performance of the plugin since a considerable amount of time will be spent in GUI
refreshing. If not called often enough, it will produce the impression that the processing is
failing and the application is not responding to the user commands anymore.
Detailed Skeleton Example
/*
This is a skeleton plugin that includes basic instructions on what you need
to do to create a plugin. You will want to look through vtkVVPluginAPI.h as
well to get a feel for how it works.
50
Copyright © 2009 Kitware, Inc.
1) You should save a copy of this file with the name of the plugin you want
to create. Say you want to create a luminance plugin, then you should
save this file as vvLuminance.cxx or vvJohnDoeLuminance.cxx in these
two examples your plugin would be named Luminance or JohnDoeLuminance
respectively
2) Rename a few occurances of Sample in this file to the name of your
plugin. Specifically look for the "TODO: Rename" comments in the rest
of this file and where you see <your_plugin> replace that with the name
of your plugin (such as Luminance). This is TODO items 1 through 4
3) Update the terse and full documentation strings for your plugin. This is
TODO item 5. The terse documentation should be a quick one sentence
description of your plugin. The full documentation should be a long
description of what the plugin does, any limitations it has, and who to
contact with questions.
4) Inside the UpdateGUI function there is a block of code folloing TODO
item 6: this code specifies the properties of the output of this
plugin. The implementaiton currently provided indicates that the output
volume has all the same properties as the input volume. Properties
include the volume's dimensions, spacing, origin, number of components
per voxel, and data type (short, int, float). If for example your plugin
always creates floating point output then you would want to set
info->OutputVolumeScalarType = VTK_FLOAT (note that while we use
VTK_FLOAT to indicate floating point data your plugin does not need any
relationship to VTK (The Visualization Toolkit) itself)
5) Create your GUI elements. This involves two main steps. First you need
to determine how many GUI items you will have. A GUI item can be an
option menu, checkbox or slider. Once you have determined how many gui
items you will have you need to set that value in TODO item 7. The you
need to actually spcify the GUI items. This is adeed to the UpdateGUI
function at TODO item 8. There are a number of options here and I
recommend looking at the source code to the other plugins to get an idea
for how to create the GUI items.
6) Now you are ready to think about how your filter will process its
data. There are a couple options here that you can adjust. Depending on
the nature of your algorithm you might be able to process the volume
in-place, in-pieces, or all-at-once. The most memory efficient option is
to support processing the input volume in-place but fo rthis to work
your algorithm must not change the parameters of the volume (see 4)
because the input volume's block of memory will be used for the output
volume. Typically only simple algorithms can be in-place. The next
option is in-pieces. This means that you will be asked to process the
input volume in pieces and ProcessData will be called one time for each
piece. In this case the memory is not shared between the input and
output so they can have different parameters. The third option
all-at-once is the simplest but consumes the most memory (both the input
volume and output volume must be in memory at the same time). With
all-at-once there really are no limitations so it is probably the best
option for your first attempt at writing a plugin. Once you have made
your decision you need to specify it at TODO item 9.
7) Now you can write your algorithm in the vv<your_plugin>Template
function. If you are unfamilliar with C++ templated functions the only
real thing you need to know is that IT represents the input volumes data
type (e.g. float, short, etc). If you have GUI items then you should get
the current values of them at TOTO item 10. The we loop over all the
voxels and perform an operation. In this case a simple copy of the input
volume to the output volume. At TODO item 11 you should place your own
Table Of Contents
84
algorithm.
8) Now you should have working source code that you need to compile into a
DLL (or shared module on UNIX)
The plugin interface support quite complex operations and I recommend looking
at some of the other plugins source code to see how they work and get ideas
for what can be done.
*/
51
Copyright © 2009 Kitware, Inc.
#include "vtkVVPluginAPI.h"
#include <string.h>
#include <stdlib.h>
#include <stdio.h>
#ifdef _MSC_VER
#pragma warning ( disable : 4710 )
#endif
template <class IT>
/* TODO 1: Rename vvSampleTemplate to vv<your_plugin>Template */
void vvSampleTemplate(vtkVVPluginInfo *info,
vtkVVProcessDataStruct *pds,
IT *)
{
IT *inPtr = (IT *)pds->inData;
IT *outPtr = (IT *)pds->outData;
int *dim = info->InputVolumeDimensions;
int inNumComp = info->InputVolumeNumberOfComponents;
int i, j, k, l;
int abort;
/* TODO 10: Get your GUI values here */
/* loop over the slices */
for ( k = 0; k < dim[2]; k++ )
{
/* update the progress status */
info->UpdateProgress(info,(float)1.0*k/dim[2],"Processing...");
/* see if we should abort */
abort = atoi(info->GetProperty(info,VVP_ABORT_PROCESSING));
/* loop over the rows and handle aborts */
for ( j = 0; !abort && j < dim[1]; j++ )
{
/* loop over the columns */
for ( i = 0; i < dim[0]; i++ )
{
/* loop over the components */
for (l = 0; l < inNumComp; ++l)
{
/* TODO 11: put your algorithm code here */
*outPtr = *inPtr;
outPtr++;
inPtr++;
}
}
}
}
info->UpdateProgress(info,(float)1.0,"Processing Complete");
}
static int ProcessData(void *inf, vtkVVProcessDataStruct *pds)
{
vtkVVPluginInfo *info = (vtkVVPluginInfo *)inf;
switch (info->InputVolumeScalarType)
{
/* TODO 2: Rename vvSampleTemplate to vv<your_plugin>Template */
vtkTemplateMacro3(vvSampleTemplate, info, pds,
static_cast<VTK_TT *>(0));
}
return 0;
}
/* this function updates the GUI elements to accomidate new data */
/* it will always get called prior to the plugin executing. */
static int UpdateGUI(void *inf)
{
vtkVVPluginInfo *info = (vtkVVPluginInfo *)inf;
/* TODO 8: create your required GUI elements here */
/* TODO 6: modify the following code as required. By default the output
* image's properties match those of the input depending on what your
52
Copyright © 2009 Kitware, Inc.
* filter does it may need to change some of these values
*/
info->OutputVolumeScalarType = info->InputVolumeScalarType;
info->OutputVolumeNumberOfComponents =
info->InputVolumeNumberOfComponents;
memcpy(info->OutputVolumeDimensions,info->InputVolumeDimensions,
3*sizeof(int));
memcpy(info->OutputVolumeSpacing,info->InputVolumeSpacing,
3*sizeof(float));
memcpy(info->OutputVolumeOrigin,info->InputVolumeOrigin,
3*sizeof(float));
return 1;
}
extern "C"
{
/* TODO 3: Rename vvSampleInit to vv<your_plugin>Init */
void VV_PLUGIN_EXPORT vvSampleInit(vtkVVPluginInfo *info)
{
/* always check the version */
vvPluginVersionCheck();
/* setup information that never changes */
info->ProcessData = ProcessData;
info->UpdateGUI = UpdateGUI;
/* set the properties this plugin uses */
/* TODO 4: Rename "Sample" to "<your_plugin>" */
info->SetProperty(info, VVP_NAME, "Sample");
info->SetProperty(info, VVP_GROUP, "Utility");
/* TODO 5: update the terse and full documentation for your filter */
info->SetProperty(info, VVP_TERSE_DOCUMENTATION,
"Replace voxels above/at/below the threshold value");
info->SetProperty(info, VVP_FULL_DOCUMENTATION,
"This filter performs a pixel replacement, replacing pixel in the
original data by a specified replacement value. The pixels to be replaced are
determine
by comparing the original pixel value to a threshold value with a user specified
comparison operation. This filter operates in place, and does not change the
dimensions,
data type, or spacing of the volume.");
/* TODO 9: set these two values to "0" or "1" based on how your plugin
* handles data all possible combinations of 0 and 1 are valid. */
info->SetProperty(info, VVP_SUPPORTS_IN_PLACE_PROCESSING, "0");
info->SetProperty(info, VVP_SUPPORTS_PROCESSING_PIECES, "0");
/* TODO 7: set the number of GUI items used by this plugin */
info->SetProperty(info, VVP_NUMBER_OF_GUI_ITEMS, "0");
}
}
Example1: A C Filter
/* This is the C code for the Utilites: Boundary filter */
#include "vtkVVPluginAPI.h"
#include <string.h>
#include <stdlib.h>
#include <stdio.h>
#define SetPixel(info, ptr, value) \
switch (info->OutputVolumeScalarType) \
{ \
case VTK_CHAR: \
((char *)ptr)[0] = (char)value; break; \
case VTK_UNSIGNED_CHAR: \
((unsigned char *)ptr)[0] = (unsigned char)value; break; \
case VTK_SHORT: \
((short *)ptr)[0] = (short)value; break; \
case VTK_UNSIGNED_SHORT: \
53
Copyright © 2009 Kitware, Inc.
((unsigned short *)ptr)[0] =(unsigned short)value; break;\
case VTK_LONG: \
((long *)ptr)[0] = (long)value; break; \
case VTK_UNSIGNED_LONG: \
((unsigned long *)ptr)[0] = (unsigned long)value; break; \
case VTK_INT: \
((int *)ptr)[0] = (int)value; break; \
case VTK_UNSIGNED_INT: \
((unsigned int *)ptr)[0] = (unsigned int)value; break; \
case VTK_FLOAT: \
((float *)ptr)[0] = (float)value; break; \
case VTK_DOUBLE: \
((double *)ptr)[0] = value; break; \
}
static int ProcessData(void *inf, vtkVVProcessDataStruct *pds)
{
vtkVVPluginInfo *info = (vtkVVPluginInfo *)inf;
double replacementValue = atof(info->GetGUIProperty(info, 0,
VVP_GUI_VALUE));
int *dim = info->InputVolumeDimensions;
unsigned int rsize = info->InputVolumeScalarSize;
int i, j, k;
unsigned char *ptr = (unsigned char *)pds->outData;
for ( k = 0; k < dim[2]; k++ )
{
for ( j = 0; j < dim[1]; j++ )
{
if ( j == 0 || k == 0 ||
j == (dim[1]-1) || k == (dim[2]-1) )
{
for ( i = 0;
i < dim[0]*info->InputVolumeNumberOfComponents;
i++ )
{
SetPixel(info,ptr,replacementValue);
ptr += rsize;
}
}
else
{
for ( i = 0;
i < info->InputVolumeNumberOfComponents;
i++ )
{
SetPixel(info,ptr,replacementValue);
SetPixel(info,
ptr+info->InputVolumeNumberOfComponents*dim[0]-1,
replacementValue);
Extending Filters With Plugins
87
ptr += rsize;
}
ptr = ptr+ info->InputVolumeNumberOfComponents*rsize*
(dim[0] - 1);
}
}
}
return 0;
}
static int UpdateGUI(void *inf)
{
char tmp[1024];
vtkVVPluginInfo *info = (vtkVVPluginInfo *)inf;
info->SetGUIProperty(info, 0, VVP_GUI_LABEL,
"New Boundary Value");
54
Copyright © 2009 Kitware, Inc.
info->SetGUIProperty(info, 0, VVP_GUI_TYPE, VVP_GUI_SCALE);
info->SetGUIProperty(info, 0, VVP_GUI_DEFAULT , "0");
info->SetGUIProperty(info, 0, VVP_GUI_HELP,
"What value to set the boundary voxels to");
sprintf(tmp,"%f %f %f",
info->InputVolumeScalarTypeRange[0],
info->InputVolumeScalarTypeRange[1],
1.0);
info->SetGUIProperty(info, 0, VVP_GUI_HINTS , tmp);
info->OutputVolumeScalarType = info->InputVolumeScalarType;
info->OutputVolumeNumberOfComponents =
info->InputVolumeNumberOfComponents;
memcpy(info->OutputVolumeDimensions,
info->InputVolumeDimensions,
3*sizeof(int));
memcpy(info->OutputVolumeSpacing,info->InputVolumeSpacing,
3*sizeof(float));
memcpy(info->OutputVolumeOrigin,info->InputVolumeOrigin,
3*sizeof(float));
return 1;
}
void VV_PLUGIN_EXPORT vvBoundaryInit(vtkVVPluginInfo *info)
{
/* always check the version */
vvPluginVersionCheck();
/* setup information that never changes */
info->ProcessData = ProcessData;
info->UpdateGUI = UpdateGUI;
info->SetProperty(info, VVP_NAME, "Boundary");
info->SetProperty(info, VVP_GROUP, "Utility");
info->SetProperty(info, VVP_TERSE_DOCUMENTATION,
"Replace all boundary (outside edge) voxels with the specified value");
info->SetProperty(info, VVP_FULL_DOCUMENTATION,
"This filter performs a voxel replacement, replacing every voxel that is a boundary
voxel with the specified value. Boundary voxels are the voxels that have at least
one
face on the boundary of the volume. Put another way, boundary voxels are voxels that
are
not fully enclosed by other voxels.");
info->SetProperty(info, VVP_SUPPORTS_IN_PLACE_PROCESSING, "1");
info->SetProperty(info, VVP_SUPPORTS_PROCESSING_PIECES, "1");
info->SetProperty(info, VVP_REQUIRED_Z_OVERLAP, "0");
info->SetProperty(info, VVP_NUMBER_OF_GUI_ITEMS, "1");
}
Example 2: A C++ Filter
/* This is the C++ code for the Utilities: Threshold filter */
#include "vtkVVPluginAPI.h"
#include <string.h>
#include <stdlib.h>
#include <stdio.h>
#ifdef _MSC_VER
#pragma warning ( disable : 4710 )
#endif
#define ApplyThresholdFilterMacro( COMPARISON ) \
int i, j, k; \
for ( k = 0; k < dim[2]; k++ ) \
{ \
info->UpdateProgress(info,(float)1.0*k/dim[2], \
"Thresholding..."); \
abort = atoi(info->GetProperty(info, \
VVP_ABORT_PROCESSING));\
for ( j = 0; !abort && j < dim[1]; j++ ) \
{ \
55
Copyright © 2009 Kitware, Inc.
for ( i = 0; i < nc*dim[0]; i++ ) \
{ \
if ( *ptr COMPARISON compVal ) \
{ \
*ptr = assignVal; \
} \
ptr++; \
} \
} \
} \
info->UpdateProgress(info,(float)1.0, \
"Thresholding Complete");
template <class IT>
void vvThresholdTemplate(vtkVVPluginInfo *info,
vtkVVProcessDataStruct *pds,
IT *)
{
IT *ptr = (IT *)pds->outData;
int *dim = info->InputVolumeDimensions;
double v1 = atof(info->GetGUIProperty(info, 1,
VVP_GUI_VALUE));
double v2 = atof(info->GetGUIProperty(info, 2,
VVP_GUI_VALUE));
const char *label = info->GetGUIProperty(info, 0,
VVP_GUI_VALUE);
int abort = 0;
IT compVal = (IT)v1;
IT assignVal = (IT)v2;
int nc = info->InputVolumeNumberOfComponents;
if (!strcmp(label,"<"))
{
ApplyThresholdFilterMacro( < );
}
if (!strcmp(label,"<="))
{
ApplyThresholdFilterMacro( <= );
}
if (!strcmp(label,"=="))
{
ApplyThresholdFilterMacro( == );
}
if (!strcmp(label,">="))
{
Extending Filters With Plugins
89
ApplyThresholdFilterMacro( >= );
}
if (!strcmp(label,">"))
{
ApplyThresholdFilterMacro( > );
}
}
static int ProcessData(void *inf,
vtkVVProcessDataStruct *pds)
{
vtkVVPluginInfo *info = (vtkVVPluginInfo *)inf;
switch (info->InputVolumeScalarType)
{
// invoke the appropriate templated function
vtkTemplateMacro3(vvThresholdTemplate, info, pds,
static_cast<VTK_TT *>(0));
}
return 0;
}
static int UpdateGUI(void *inf)
56
Copyright © 2009 Kitware, Inc.
{
char tmp[1024];
vtkVVPluginInfo *info = (vtkVVPluginInfo *)inf;
info->SetGUIProperty(info, 0, VVP_GUI_LABEL,
"Replace values");
info->SetGUIProperty(info, 0, VVP_GUI_TYPE,
VVP_GUI_CHOICE);
info->SetGUIProperty(info, 0, VVP_GUI_DEFAULT ,
"<");
info->SetGUIProperty(info, 0, VVP_GUI_HELP,
"The comparison operation for a pixel");
info->SetGUIProperty(info, 0, VVP_GUI_HINTS,
"5\n<\n<=\n==\n>=\n>");
info->SetGUIProperty(info, 1, VVP_GUI_LABEL,
"Threshold Value");
info->SetGUIProperty(info, 1, VVP_GUI_TYPE,
VVP_GUI_SCALE);
info->SetGUIProperty(info, 1, VVP_GUI_DEFAULT ,
"0");
info->SetGUIProperty(info, 1, VVP_GUI_HELP,
"The value to compare against");
info->SetGUIProperty(info, 2, VVP_GUI_LABEL,
"Replacement Value");
info->SetGUIProperty(info, 2, VVP_GUI_TYPE,
VVP_GUI_SCALE);
info->SetGUIProperty(info, 2, VVP_GUI_DEFAULT ,
"0");
info->SetGUIProperty(info, 2, VVP_GUI_HELP,
"The value to replace with");
/* set the range of the sliders */
sprintf(tmp,"%f %f %f",
info->InputVolumeScalarRange[0],
info->InputVolumeScalarRange[1],
1.0);
info->SetGUIProperty(info, 1, VVP_GUI_HINTS , tmp);
sprintf(tmp,"%f %f %f",
info->InputVolumeScalarTypeRange[0],
info->InputVolumeScalarTypeRange[1],
1.0);
info->SetGUIProperty(info, 2, VVP_GUI_HINTS , tmp);
info->OutputVolumeScalarType = info->InputVolumeScalarType;
info->OutputVolumeNumberOfComponents =
info->InputVolumeNumberOfComponents;
memcpy(info->OutputVolumeDimensions,
info->InputVolumeDimensions,
3*sizeof(int));
memcpy(info->OutputVolumeSpacing,
Table Of Contents
90
info->InputVolumeSpacing,
3*sizeof(float));
memcpy(info->OutputVolumeOrigin,
info->InputVolumeOrigin,
3*sizeof(float));
return 1;
}
extern "C"
{
void VV_PLUGIN_EXPORT vvThresholdInit(vtkVVPluginInfo *info)
{
/* always check the version */
vvPluginVersionCheck();
/* setup information that never changes */
info->ProcessData = ProcessData;
57
Copyright © 2009 Kitware, Inc.
info->UpdateGUI = UpdateGUI;
/* set the properties this plugin uses */
info->SetProperty(info, VVP_NAME, "Threshold");
info->SetProperty(info, VVP_GROUP, "Utility");
info->SetProperty(info, VVP_TERSE_DOCUMENTATION,
"Replace voxels above/at/below the threshold value");
info->SetProperty(info, VVP_FULL_DOCUMENTATION,
"This filter performs a pixel replacement, replacing pixel in the
original data by a specified replacement value. The pixels to be replaced are
determine
by comparing the original pixel value to a threshold value with a user specified
comparison operation. This filter operates in place, and does not change the
dimensions,
data type, or spacing of the volume.");
info->SetProperty(info, VVP_SUPPORTS_IN_PLACE_PROCESSING, "1");
info->SetProperty(info, VVP_SUPPORTS_PROCESSING_PIECES, "1");
info->SetProperty(info, VVP_NUMBER_OF_GUI_ITEMS, "3");
}
}
Example 3: A VTK Filter
/* This is the code for Utility: Gradient Magnitude Filter (VTK) */
#include "vtkVVPluginAPI.h"
#include <string.h>
#include <stdlib.h>
#include "vtkImageImport.h"
#include "vtkImageData.h"
#include "vtkPointData.h"
#include "vtkImageGradientMagnitude.h"
#include "vtkCallbackCommand.h"
extern "C" {
static void
vvGradientMagnitudeProgress(vtkObject *obj,
unsigned long, void *inf,
void *vtkNotUsed(prog))
{
vtkVVPluginInfo *info = (vtkVVPluginInfo *)inf;
vtkSource *src = vtkSource::SafeDownCast(obj);
if (src)
{
info->UpdateProgress(info,src->GetProgress(),
"Computing Gradient Magnitudes...");
/* check for abort */
src->SetAbortExecute
(atoi(info->GetProperty(info,VVP_ABORT_PROCESSING)));
}
}
}
static int ProcessData(void *inf, vtkVVProcessDataStruct *pds)
{
vtkVVPluginInfo *info = (vtkVVPluginInfo *)inf;
int *dim = info->InputVolumeDimensions;
// create a Gaussian Filter
vtkImageGradientMagnitude *ig = vtkImageGradientMagnitude::New();
// Set the parameters on it
ig->SetDimensionality(3);
// setup progress
vtkCallbackCommand *cc = vtkCallbackCommand::New();
cc->SetCallback(vvGradientMagnitudeProgress);
cc->SetClientData(inf);
ig->AddObserver(vtkCommand::ProgressEvent,cc);
cc->Delete();
// setup the input
vtkImageImport *ii = vtkImageImport::New();
58
Copyright © 2009 Kitware, Inc.
ii->SetDataExtent(0, dim[0] - 1, 0, dim[1] - 1, 0, dim[2] - 1);
ii->SetWholeExtent(0, dim[0] - 1, 0, dim[1] - 1, 0, dim[2] - 1);
ii->SetDataScalarType(info->InputVolumeScalarType);
ii->SetNumberOfScalarComponents(
info->InputVolumeNumberOfComponents);
ii->SetDataOrigin(info->InputVolumeOrigin);
ii->SetDataSpacing(info->InputVolumeSpacing);
ii->SetImportVoidPointer(pds->inData);
ig->SetInput(ii->GetOutput());
// get the output, would be nice to have VTK write directly
// into the output buffer but... VTK is often broken in that regard
// so we will try, but check afterwards to see if it worked
vtkImageData *od = ig->GetOutput();
od->UpdateInformation();
od->SetExtent(0,0,0,0,0,0);
Table Of Contents
92
od->AllocateScalars();
int size = dim[0] * dim[1] * pds->NumberOfSlicesToProcess *
info->InputVolumeNumberOfComponents;
od->SetExtent(0, dim[0] - 1, 0, dim[1] - 1,
pds->StartSlice,
pds->StartSlice + pds->NumberOfSlicesToProcess - 1);
od->GetPointData()->GetScalars()->SetVoidArray(pds->outData,size,1);
// run the filter
od->SetUpdateExtent(od->GetExtent());
od->Update();
// did VTK not use our memory?
if (od->GetScalarPointer() != pds->outData)
{
memcpy(pds->outData, od->GetScalarPointer(),
(od->GetPointData()->GetScalars()->GetMaxId() + 1)*
od->GetPointData()->GetScalars()->GetDataTypeSize());
}
// clean up
ii->Delete();
ig->Delete();
return 0;
}
static int UpdateGUI(void *inf)
{
vtkVVPluginInfo *info = (vtkVVPluginInfo *)inf;
info->OutputVolumeScalarType = info->InputVolumeScalarType;
info->OutputVolumeNumberOfComponents =
info->InputVolumeNumberOfComponents;
memcpy(info->OutputVolumeDimensions,info->InputVolumeDimensions,
3*sizeof(int));
memcpy(info->OutputVolumeSpacing,info->InputVolumeSpacing,
3*sizeof(float));
memcpy(info->OutputVolumeOrigin,info->InputVolumeOrigin,
3*sizeof(float));
return 1;
}
extern "C" {
void VV_PLUGIN_EXPORT vvVTKGradientMagnitudeInit(vtkVVPluginInfo *info)
{
/* always check the version */
vvPluginVersionCheck();
// setup information that never changes
info->ProcessData = ProcessData;
info->UpdateGUI = UpdateGUI;
info->SetProperty(info, VVP_NAME, "Gradient Magnitude Filter (VTK)");
info->SetProperty(info, VVP_GROUP, "Utility");
info->SetProperty(info, VVP_TERSE_DOCUMENTATION,
"Calculate the Gradient Magnitude");
59
Copyright © 2009 Kitware, Inc.
info->SetProperty(info, VVP_FULL_DOCUMENTATION,
"Compute the 3D gradient magnitude of the input volume. The resulting volume has the
same dimensions, etc, as the input volume.");
info->SetProperty(info, VVP_SUPPORTS_IN_PLACE_PROCESSING, "0");
info->SetProperty(info, VVP_SUPPORTS_PROCESSING_PIECES, "1");
info->SetProperty(info, VVP_NUMBER_OF_GUI_ITEMS, "0");
info->SetProperty(info, VVP_REQUIRED_Z_OVERLAP, "1");
}
}
Example 4: An ITK Filter
/* This is the code for Surface Generation: Anti-Aliasing (ITK) */
#include "vvITKFilterModuleWithRescaling.h"
#include "itkAntiAliasBinaryImageFilter.h"
template <class TInputPixelType>
class AntiAliasRunner
{
public:
typedef TInputPixelType InputPixelType;
typedef itk::Image< InputPixelType, 3 > InputImageType;
typedef float InternalPixelType;
typedef itk::Image< InternalPixelType,3 > InternalImageType;
typedef itk::AntiAliasBinaryImageFilter<
InputImageType,
InternalImageType > FilterType;
typedef unsigned char OutputPixelType;
typedef VolView::PlugIn::FilterModuleWithRescaling<
FilterType,
OutputPixelType > ModuleType;
public:
AntiAliasRunner() {}
void Execute( vtkVVPluginInfo *info, vtkVVProcessDataStruct *pds )
{
const unsigned int maxNumberOfIterations = atoi( info->GetGUIProperty(info, 0,
VVP_GUI_VALUE ) );
const float maximumRMSError = atof( info->GetGUIProperty(info, 1,
VVP_GUI_VALUE ) );
ModuleType module;
module.SetPluginInfo( info );
module.SetUpdateMessage("Reducing aliasing effects...");
// Set the parameters on it
module.GetFilter()->SetMaximumIterations( maxNumberOfIterations );
module.GetFilter()->SetMaximumRMSError( maximumRMSError );
module.SetOutputMinimum( 0 );
module.SetOutputMaximum( 255 );
// Execute the filter
module.ProcessData( pds );
}
};
static int ProcessData(void *inf, vtkVVProcessDataStruct *pds)
{
vtkVVPluginInfo *info = (vtkVVPluginInfo *)inf;
// make sure there is only one component of input data
if (info->InputVolumeNumberOfComponents != 1)
{
info->SetProperty( info, VVP_ERROR,
"The AntiAlias filter only works with single component data" );
return -1;
}
try
{
switch( info->InputVolumeScalarType )
{
case VTK_CHAR:
60
Copyright © 2009 Kitware, Inc.
{
AntiAliasRunner<signed char> runner;
runner.Execute( info, pds );
break;
}
case VTK_UNSIGNED_CHAR:
{
AntiAliasRunner<unsigned char> runner;
runner.Execute( info, pds );
break;
}
case VTK_SHORT:
{
AntiAliasRunner<signed short> runner;
runner.Execute( info, pds );
break;
}
case VTK_UNSIGNED_SHORT:
{
AntiAliasRunner<unsigned short> runner;
runner.Execute( info, pds );
break;
}
case VTK_INT:
{
AntiAliasRunner<signed int> runner;
runner.Execute( info, pds );
break;
}
case VTK_UNSIGNED_INT:
{
AntiAliasRunner<unsigned int> runner;
runner.Execute( info, pds );
break;
}
case VTK_LONG:
{
AntiAliasRunner<signed long> runner;
runner.Execute( info, pds );
break;
}
case VTK_UNSIGNED_LONG:
{
AntiAliasRunner<unsigned long> runner;
runner.Execute( info, pds );
break;
}
case VTK_FLOAT:
{
AntiAliasRunner<float> runner;
runner.Execute( info, pds );
break;
}
case VTK_DOUBLE:
{
AntiAliasRunner<double> runner;
runner.Execute( info, pds );
break;
}
default:
info->SetProperty( info, VVP_ERROR,
"Pixel Type Unknown for the AntiAlias filter" );
return -1;
break;
}
}
61
Copyright © 2009 Kitware, Inc.
catch( itk::ExceptionObject & except )
{
info->SetProperty( info, VVP_ERROR, except.what() );
return -1;
}
return 0;
}
static int UpdateGUI(void *inf)
{
vtkVVPluginInfo *info = (vtkVVPluginInfo *)inf;
info->SetGUIProperty(info, 0, VVP_GUI_LABEL, "Number of Iterations ");
info->SetGUIProperty(info, 0, VVP_GUI_TYPE, VVP_GUI_SCALE);
info->SetGUIProperty(info, 0, VVP_GUI_DEFAULT, "5");
info->SetGUIProperty(info, 0, VVP_GUI_HELP, "Number of times that the diffusion
approximation will be computed. The more iterations, the stronger the smoothing");
info->SetGUIProperty(info, 0, VVP_GUI_HINTS , "1 100 1");
info->SetGUIProperty(info, 1, VVP_GUI_LABEL, "Maximum RMS Error");
info->SetGUIProperty(info, 1, VVP_GUI_TYPE, VVP_GUI_SCALE);
info->SetGUIProperty(info, 1, VVP_GUI_DEFAULT, "0.05");
info->SetGUIProperty(info, 1, VVP_GUI_HELP, "Maximum RMS error allows. This value
defines the convergence criterion for the smoothing.");
info->SetGUIProperty(info, 1, VVP_GUI_HINTS , "0.001 0.1 0.001");
const char * stringValue = info->GetGUIProperty(info, 0, VVP_GUI_VALUE );
if( !stringValue )
{
info->SetProperty(info, VVP_REQUIRED_Z_OVERLAP, "0");
}
else
{
info->SetProperty(info, VVP_REQUIRED_Z_OVERLAP, stringValue);
}
info->OutputVolumeScalarType = VTK_UNSIGNED_CHAR;
info->OutputVolumeNumberOfComponents = 1;
info->OutputVolumeDimensions[0] = info->InputVolumeDimensions[0];
info->OutputVolumeDimensions[1] = info->InputVolumeDimensions[1];
info->OutputVolumeDimensions[2] = info->InputVolumeDimensions[2];
memcpy(info->OutputVolumeSpacing,info->InputVolumeSpacing,
3*sizeof(float));
memcpy(info->OutputVolumeOrigin,info->InputVolumeOrigin,
3*sizeof(float));
return 1;
}
extern "C" {
void VV_PLUGIN_EXPORT vvITKAntiAliasInit(vtkVVPluginInfo *info)
{
vvPluginVersionCheck();
// setup information that never changes
info->ProcessData = ProcessData;
info->UpdateGUI = UpdateGUI;
info->SetProperty(info, VVP_NAME, "Anti-Aliasing (ITK)");
info->SetProperty(info, VVP_GROUP, "Surface Generation");
info->SetProperty(info, VVP_TERSE_DOCUMENTATION,
"Reduction of aliasing effects");
info->SetProperty(info, VVP_FULL_DOCUMENTATION,
"This filter applies a level set evolution over a binary image in order to produce a
smoother contour that is suitable for extracting iso-surfaces. The resulting contour
is
encoded as the zero-set of the output level set. The zero set will be rescaled as
the
mid-value of the intensity range corresponding to the pixel type used. This filter
processes the whole image in one piece, and does not change the dimensions, or
spacing of
the volume. The pixel type however, is converted to unsigned 8 bits since it is
enough
for representing the implicit smoothed surface.");
info->SetProperty(info, VVP_SUPPORTS_IN_PLACE_PROCESSING, "0");
62
Copyright © 2009 Kitware, Inc.
info->SetProperty(info,
info->SetProperty(info,
info->SetProperty(info,
info->SetProperty(info,
}
}
VVP_SUPPORTS_PROCESSING_PIECES, "0");
VVP_NUMBER_OF_GUI_ITEMS, "2");
VVP_REQUIRED_Z_OVERLAP, "0");
VVP_PER_VOXEL_MEMORY_REQUIRED, "8");
63
Copyright © 2009 Kitware, Inc.