1
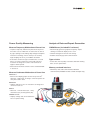
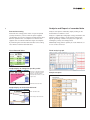
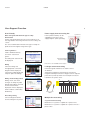
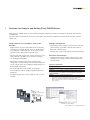
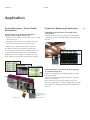
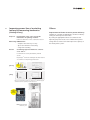
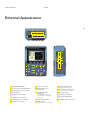
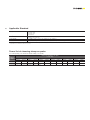
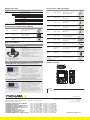
A Clear Path to
Electrical Power
Excellence!
CW500
Power Quality Analyzer
Bulletin CW500-01EN
Electrical power
measurement is a key for
innovation.
The Yokogawa CW500 is a
portable power meter that
utilizes a current clamp
sensor for use in the field
enabling consumption
and power quality
measurement of the power
line.
By the navigation screen
of the unit, the connection
setting and detail setting of
the unit is simple and direct
by following the screens.
Keys which directly turn on
desired measuring screens
allow comfortance at the
use of field.
Stored measured data are
easily accessed by a click
on the file with included
PC software.
Simplified power
measuring – Several direct
keys keep you simple and
direct access to Voltage/
Current/Power/Power factor/
Phase Angle/Frequency/
Integrated power/Demand by
values or by a trend graph.
Firmly capture line
power quality issue –
Captures short period power
malfunction conforming IEC
6100-4-30 Class S.
User support – Function of
Quick Start Guide to support
secure wiring and setting of
units.
Features
• Power Measure and Logging
• Power Quality Measuring
• User Support
• Analysis of Data and Report Generation
Power Measuring and Logging
•Simultaneously measures 3 CH Voltage input, 4 CH current
clamp-on probe input, 2 CH DCV input.
•Displays value list or trend graph screen of Instantaneous/
Average/Maximum/Minimum of Voltage/Current/Power/Power
factor/Phase Angle/Phase Advanced Capacitance Calculation
and DCV input.
•Integration Value of Active/
Reactive/Apparent Energy
is each displayed by
consumption and generation.
•Demand value can be
monitored by screens of
present power consumption
compared to aimed demand
power value.
User Support
Quick Start Guide Function:
•Start Guide Function supports secure wiring and setting
before measuring.
•Automatically recognize the type of current clamp-on probe.
Vector Display:
•Indicates Voltage and Current phase difference and values
between input channels of voltage and current.
•Checks whether the wiring is appropriate or not.
Power Quality Measuring
Analysis of Data and Report Generation
Measure Temporary Malfunction of Power Line
CW500Viewer (Included PC software)
•Captures temporary malfunction phenomena of power
line which causes malfunction or destruction of devices
by types (Voltage swell, Voltage dip, Voltage interruption,
Transient overvoltage, inrush current) as an event by
high sampling rate of 24 µs and RMS calculation.
•Event data contains the type of malfunction, occurred
time or occurrence finish time, measured value and
waveform of voltage and current of all channels for
approx. 200 ms period.
•Measurement method conforms to IEC standard 610004-30 Class S
•Automatically generates graph and report by simple
clicking on a file data displayed on screen.
•Uniform management of main unit settings
•Realtime measuring by USB communication.
Measure Continuous Malfunction of Power Line
Harmonics
•Measure and display graphs and list of up to the 50th
Harmonic components of voltage, current and power for
each phase and in total.
Waveform
•Displays with up to 10 or 12 waveforms of voltage and
current for each CH.
Flicker
•Measures, 1 minute flicker (Pst, 1 min),
short flicker (Pst) and long flicker (Plt).
Unbalance rate
•Displays voltage and current unbalance
rate on 3 phase wiring.
Types of data
•Power data, Power quality event data, Main Unit Setting
data, Screen capture data.
Memory card and interface
•SD Memory card, USB communication, Bluetooth
communication (Available for USA, Canada and Japan only)
Function
CW500
Function
Power Measuring
List Display
Power line and Input Channel: 3 CH Voltage,
4 CH for Current Clamp Probe.
Hems of measuring
values can be selected
with position.
1P2W (up to 4 system), 1P3W (up to 2 system),
3P3W2current (up to 2 system), 3P3W3current,
3P4W
Power measuring item:
Instantaneous, Average, Maximum and Minimum
values:
Voltage/Current/Power (Active, Reactive, Apparent)/Power
factor/ Phase Angle/Frequency/Calculated Phase Shift
Condensor/DC voltage value 2 CH.
Integration Value
•Energy (Active, Reactive, Apparent) each by
consumption and generation
•Demand (Occurrence of max. demand time, current
demand, estimated demand value)
Recording Interval Period:
1/2/5/10/15/20/30 second, 1/2/5/10/15/20/30 minute,
1 hour/2 hours
Recording method
Zoom Display
Zoom display can be
selected by 4 or 8
division.
Trend Graph
Trend graph of voltage/
current/power/power
factor/frequency/
advanced phase
condenser/DC voltage
Manual, time setting, period setting
Estimated Recording Length with 2 GB SD card.
Interval
1 sec.
1 min.
30 min.
Power recording
13 days
Over 1 year
Over 10 years
+Harmonics
3 days
3 months
Over 7 years
•The recording length shortens according to the number
of power quality events.
•Only included SD memory card or dedicated SD
memory card is guaranteed.
Various Measuring Screen
•List display, Zoom display by 4 or 8 division,
Trend graph display
•Integration Value Display for Energy
•Demand List display of value,
Demand Graph display for change of period,
Demand Graph display for whole recording
Energy Display
List of Active, Apparent,
Reactive by consumption
or generation
4
Analysis and Report of recorded data
5
Demand measuring
Demand is the average power value of a specific period
(usually 30 minutes). Contract with the power supplier
conditionally concerns the maximum average power value
between period for the consumption fee. This function
supports how to maintain within the target consumption
by monitoring the estimated demand value to the setting
rate, with the maximum demand value.
Analysis and report is enabled by simply clicking on the
desired data on software screen.
Analysis is capable by trend graph, average, maximum and
minimum value of voltage, current, power, power factor.
Report generating could be set by day time, night time,
working day, off day or monthly period.
Additionally energy data to quantity of crude oil barrels, or
to CO2 can be converted.
List of Demand Value
Trend analysis graph
Graph display of change on specific period
When the estimated demand
value line is displayed inside
this area, it mean that the
demand value will be over the
target value.
Estimated demand value
Graph display of whole demand trend
Max. demand value
Aimed target demand value
Sample of report
Function
CW500
Power Quality Function
6
Short period power line malfunctions such as voltage swells/dips/interruptions/transient overvoltage or inrush currents, or
long period such as harmonic distortion, flicker may damage or reset your devices.
The CW500 helps to identify each of those short period malfunctions, by recording occurrence time, occurrence finish time
and waveforms. Additionally there is a digital output on occurrence.
Long period malfunctions can be analyzed by harmonics, flicker, waveform or checking on the unbalance rate calculation
for 3 phase measurement.
All data can be finalized to a report format with included software.
The CW500 conforms to the IEC standard of 61000-4-30 Class S.
Power line malfucntion
phenemona
Example of cause and influence
Voltage Swell
Lightnings or heavy load switching on power line may
cause momentary swell on voltage.
Voltage Dip
Generating moments on motor load may cause an
inrush current and cause dips on voltage.
Example of waveform
Notes
Occurred time and
waveform is recorded.
Digital output is set on
during the occurred
period.
Voltage interruption
Momentary or long interruption to power distribution by
lightning or open breakers
Transient overvoltage
(impulse)
Lightning or heavy load switching on power line may
cause momentary change on voltage.
Inrush current
Generating moments on motor load may cause an
inrush current.
Flicker
Increase and decrease on certain phases could cause
flickering distortion on voltage and currents.
Pst (1 min), Pst or Plt is
measured.
Harmonics
Inverter and Thyristor circuits (phase control cirtuits)
which are used for the control circuit of general devices
could affect currents and cause harmonic distortion.
Up to 50th harmonic
contents are measured.
Unbalance rate
Heavy loading on a specific phase, could influence
motor operation and could cause harmonic distortion.
Voltage and Current
unbalance rate
measured on vector
screen for 3 phase
7
Power Quality Measuring Function
Capture temporary power line issues
Capture continuous power line issues
Various kind of power issues are captured by high
sampling rate of 24 µs and overlapping RMS measuring
by half cycles. They are recorded as an event by occurred
time, occurrence finish time and waveforms are recorded.
Harmonic Measuring
•Displays components of up to the 50th Harmonics
contents by individual channel or overall by graph or list
•Displays the maximum occurred point on graph.
•Main unit displays list of occurred issue by types.
•Recorded data are easily analyzed and report is
generated by PC software.
Voltage swell
Voltage dip
Voltage Interrupt
Transient overvoltage
Inrush Current
Graph display
List display
Power line malfunction event
Display event, timing
and measurement
Flicker
Displays list or graph of
1minute flicker (Pst, 1 min),
short term flicker (Pst) or
long term flicker (Plt).
List display
Waveforms and
measured data
are stored on a SD
memory card.
Main operation
Waveform
Displays voltage and
current waveform by all or
individually.
It can be zoomed in and out
by vertical or horizontal with
rate selection below.
Vertical rate: 0.1, 0.5, 1, 2, 5, 10
Horizontal rate: 1, 2, 5, 10
Analyze and report is created by PC
Function
CW500
User Support Function
8
User Friendly
Power supply from measuring line
Quick start guide and Automatic type of clamp
identification
A quick start guide will show how to wire and how to set
the range before measuring which ensures the settings are
correct.
The sensor identification will detect the type of clamp-on
probe and set the highest range of the type.
Power (under 240 VAC) can be
supplied by using the “Power
supply adapter” (sold separately).
Start of guidance
PUSH “START/STOP”key
and select “Quick start
guide”.
Recording item selection will
be displayed.
Power line
Example diagram
of power supply
Note: This is not available for EU region.
Recording setting
Set recording interval time
and recording time or period.
External magnetic field effect is 0.002 A or less,
at 400 A/m.
Yokogawa’s proprietary technology has achieved a
magnetic field impact amount of 30 ppm even in adjacent
power lines (at 100 A), Below is an example to measure
neutral line of 3 phase 4 line.
1R
Clamp-on probe
96060
2S
Load
Wiring check/self diag./self id.
Wiring check, self check
and type of clamp-on probe
identification will be executed
and the results will be
displayed. If NG is displayed,
detail could be confirmed by
ENTER key.
Leakage current measuring
Source
Wiring
Select the wiring and
the appropriate connection
diagram will be displayed.
Connect the voltage probe and
clamp-on probe accordingly.
3T
N
N
U1
U2
U3
CW500 side
CH1 CH2 CH3 CH4
3 Phase 4 wire
Multiple line measuring
4 system load measuring
Maximum of 4 systems is capable for 1 phase 2 line
Maximum of 2 systems is capable for 1 phase 3 line or 3
phase 3 line.
9
Software for Analysis and Setting (Free) CW500Viewer
Data analysis , making reports of data, making setting file and doing a real time measuring can be easily done with the
CW500Viewer.
The data can be transferred by SD memory card, USB communication or Bluetooth communication (for USA, Canada,
Japan only).
Graph and lists are created by a click on the
data file.
•Graph and lists of the recorded data file are created by
clicking on the desired data file. They can be displayed
and copied on a clip board so it can be used on other
software such as Word or Excel spread sheet.
•The time axis and measure axis can be zoomed in or out
easily. With this capability, micro and macro changes,
can be displayed desirably.
•Waveforms of power quality events (Voltage swell,
voltage dips, voltage interrupt, transient overvoltage and
inrush current) which are recorded by 200 ms period can
be displayed and printed.
•The integrated data can be added on one graph
which enables the whole energy integration data to be
displayed.
•Integrated energy data can be scaled into CO2 or crude
oil value.
Settings management
•Setting data can be read out from and to the main unit
via SD memory card, USB communication cable or
Bluetooth communication*.
•Settings data can be easily edited saved and managed.
Real time measurement
•Real time measurement can be achieved up to 2 units
simultaneously via USB communication or Bluetooth
communication*
System requirement
OS
Windows 8/7/Vista (32 bit/64 bit)
CPU
Pentium 4 or Pentium Processor over 2 GHz
Display
1024 × 768 dots, 65536 colors or more
HDD (Hard-disk
space required)
1 GByte or more (including Framework)
Others
.NET Framework (3.5)
Note:Windows is a registered trademark of Microsoft in the United States.
Pentium is a registered trademark of Intel in the United States.
Bluetooth is a registered trademark of Bluetooth SIG.
Other company names or names of merchandise are trademarks of
their company.
USB
communication
Bluetooth
communication*
Example of multiple
graph display
SD Memory Card
Example of setting display
*Only available for US, Canada and Japan.
Application
CW500
Application
Power Measuring + Power Quality
Examination
Examination of main power line quality for
factory system control and assets
•Confirm to check quality of power line for factory system
control and assets.
•Simultaneously measure the consumption of energy
trend and consider solutions for energy saving.
Power Line Measuring Examination
LED lighting introduction for checking power
saving effect
Introduce the effect of power saving to use LED lightning
compared to the non LED lightning by measuring before
and after.
CW500 not only continuously measures harmonics
but captures malfunction of power line and records
occurrance time with waveforms. Simultaneously it can
measure power and leakage current of neutral phase.
Additionally users can confirm the condition of assets
when signals are connected to the DCV input channels.
Checking power consumption of driving pumps
of a manufacturing line
Asset operation check
Leakage current
Inverters were applied to many driving pumps in a liquid
manufacturing line.
Power consumption checking was needed to check the
effect before and after.
Many settings to measure many pumps is easily and
efficiently arranged by PC software. Additionally the power
line quality is checked to be safely operated with the new
inverters.
Voltage/Current/
Power/Power factor/
Demand/
Analog input 2 CH
10
11
Improving power line of a printing
factory by measuring harmonics
(Printing factory)
Purpose: Investigation of the cause of periodic
malfunction for printing machine.
Harmonics distortion on line could be the reason?
Measuring:CW500 merit
• Compact size and easy to carry.
• Up to 50th Harmonics measuring.
• Long term recording
Result:
Confirming high level harmonic contents
on 5th and 7th.
Found harmonics were generated by internal
assets.
Especially 5th harmonics damages the direct reactor
of condensor for improving power factor
Found
cause
[Before]
Harmonics on current input
Harmonic contents on current input
Harmonics on current input
Harmonic contents on current input
[After]
Effect of correspondence: Harmonic contents of 5th and after dropped
and malfunction rate of printing machine decreased.
Confirmation
of inflow
harmonics
500kV transformers
of factory “A”.
Others
Improvement of Power factor for power efficiency
CW500 can calculate the appropriate condensor value by
setting the aimed power factor value.
By setting the appropriate advanced condensor and
improving the power factor, users will benefit for power
saving with less load current and improve the capacity of
the whole power system.
External Appearance
CW500
External Appearance
12
17
19
18
13
14
15
16
5
1
9
10
11
6
2
7
3
8
4
12
1 START/STOP SWITCH
9 Print screen switch
2 Screen switch of W and Wh item
10 Data Hold/Key lock
3 Vector and wiring check switch
4 Power button
5 Waveform screen switch
6 Harmonic screen switch
(long press)
11 LCD Key/Contrast
(long press)
Turn ON/OFF the display and
change brightness and contrast
by long press
7 Power quality screen switch
12 Cursor and Enter Key
8 Setting screen switch
13 USB terminal
Mini B pin for PC communication
14 Digital output terminal
Trigger signal output on event
15 Analog input terminal 2 CH
For 100 mV, 1 V, 10 V, DC input
16 SD card interface
17 Voltage input terminal
18 AC power supply input
19 Clamp-on probe connection
Accessories
Accessories
Clamp-on Probe (sold separately)
For Leakage
Model code
For Load current
For load current (flexible type)
96060
96061
96062
96063
96064
96065
96066
40 mm
18 mm
24 mm
30 mm
40 mm
110 mm
150 mm
Photo
Measurable
diameter
Input Range
AC 2 A
AC 50 A
AC 100 A
AC 200 A
AC 500 A
AC 1000 A
AC 300 A
AC 1000 A
AC 3000 A
Output
voltage
AC 50 mV
(25 mV/A)
AC 500 mV
AC 500 mV
AC 500 mV
AC 500 mV
AC 500 mV
For each range
AC 500 mV
50 Hz/
60 Hz
±1.0% rdg
±0.05 mV
±0.5% rdg
±0.1 mV
±0.5% rdg
±0.1 mV
±0.5% rdg
±0.1 mV
±0.5% rdg
±0.1 mV
±0.8% rdg
±0.2 mV
40 Hz to
1 kHz
±2.0% rdg
±0.1 mV
±0.8% rdg
±0.2 mV
±1.0% rdg
±0.2 mV
±0.8% rdg
±0.2 mV
±1.0% rdg
±0.2 mV
±1.5% rdg
±0.4 mV
1 kHz to
3.5 kHz
±3.0% rdg
±0.2 mV
±1.0% rdg
±0.4 mV
—
±1.0% rdg
±0.4 mV
—
—
—
Less than ±2.0°
(0.5 to 50 A,
40 Hz to 3.5 kHz)
Less than ±2.0°
(1 to 100 A,
45 Hz to 65 Hz)
Less than ±1.0°
(2 to 200 A,
40Hz to 3.5kHz)
Less than ±1.0°
(5 to 500 A,
45 Hz to 65 Hz)
Less than ±2.0°
(45 Hz to 65 Hz)
Less than ±3.0°
(40 Hz to 1 kHz)
Less than ±1.0°
(for each range/
45 to 65 Hz)
AC 300 Vrms
AC 300 Vrms
AC 300 Vrms
AC 600 Vrms
AC 600 Vrms
AC 600 Vrms
AC 600 Vrms
approx.
70(W) × 120(H) ×
25(D) mm
approx.
52(W) × 106(H) ×
25(D) mm
approx.
60(W) × 100(H) ×
26(D) mm
approx.
73(W) × 130(H) ×
30(D) mm
approx.
81(W) × 128(H) ×
36(D) mm
approx.
73(W) × 130(H) ×
30(D) mm
approx.
61(W) × 111(H) ×
43(D)mm
approx. 170 g
approx. 160 g
approx. 240 g
approx. 260 g
approx. 170 g
approx. 950 g
Accuracy
Level
13
Accuracy
Degree
Max Circuit
voltage
Dimension
Weight
approx. 230 g
(excluding pointed part)
±1.0% rdg*
*45 to 65 Hz (measuring at the center of sensor)
Other accessory (sold separetely)
Extension code
98082*1
Power supply adapter
98031
Portable case (for CW500)
93047
*1 Extension code 98082 corresponds to below current probe. 96060, 96061, 96062
*2 The following clamp-on probe are able to be connected. 96030, 96033, 96036
Conversion Cable (Banana-DIN)
99073*2
(Planned to be released)
Specifications
CW500
Specifications
14
Model code
Bluetooth function
CW500-B0
CW500-B1
No Bluetooth Function
With Bluetooth Function*1
Wiring connections
1P2W (max. 4 systems), 1P3W (max. 2 systems), 3P3W (max. 2 systems), 3P3W3current, 3P4W
Measurements items
Voltage, Current, Frequency, Active power, Reactive power, Apparent power, Active energy, Reactive energy,
Apparent energy, Power factor, Phase Advancing Condensor, Neutral current, Demand, Harmonics, Power Quality
(Swell/Dip/Interrupt/Transient overvoltage, Inrush current, Unbalance rate. IEC flicker
Other function
Digital output, Analog DCV input function
Voltage
(RMS)
Range
600.0/1000 V
Accuracy
±0.2% rdg ±0.2% rng. (sine wave, 40 to 70 Hz)
Allowable input
1 to 120% (rms) of each range, 200% for peak of each range
Display range
0.15 to 130% of each range
Crest factor
3 or less
Sampling speed of voltage transient 24 µs
Current
(RMS)
Active
power
Range
96060 (2 A type): 2000 mA
96061 (50 A type): 5000 mA/50 A/AUTO
96062 (100 A type): 10/100 A/AUTO
96063 (200 A type): 20/200 A/AUTO
96064 (500 A type): 50/500 A/AUTO
96065 (1000 A type): 100/1000 A/AUTO
96066 (3000 A type): 300/1000/3000 A
Accuracy
±0.2% rdg ±0.2% rng. + accuracy of clamp-on probe (sine wave, 40 to 70 Hz)
Allowable input
1 to 110% (rms) of each range, 200% for peak of each range
Display range
0.15 to 130% of each range
Crest factor
3 or less
Accuracy
±0.3% rdg ±0.2% rng. + accuracy of clamp-on probe (Power factor 1, sine wave, 40 to 70 Hz)
Effect of Power Factor
±1.0% rdg (40 to 70 Hz, reading at power factor 0.5 against 1.0)
Frequency meter range
40 to 70 Hz
Power supply (AC Line)
AC100 to 240 V/50 to 60 Hz/7 VA max.
Power supply (DC Battery)
Alkaline size AA battery LR6 or Ni-Mh (HR15-51) × 6 pcs
Battery life approx. 3 hours (LR6 Backlight OFF)
Internal memory
Flash memory (4 MB)
External memory card
SD Card (2 GB)
PC communication
USB Ver. 2.0
Display
320 × 240 (RGB) Pixel, 3.5 inch color TFT
Display update period
1s
Display Language
English, French, Spanish, Polish, Korean, Chinese, Japanese
Temperature and humidity range
23±5°C, less than 85% RH (without condensation)
Operating temperature and himidity range
0 to 45°C, less than 85% RH (without condensation)
Storage temperature and humidity range
−20 to 60°C, less than 85% RH (without condensation)
Dimensions
120 (W) × 175 (H) × 68 (D) mm
Weight
Approx. 900 g (with battery)
Included accessories (attached)
98078 Voltage Probe,
93046 Carrying case
97060 SD Memory Card 2 GB
USB cable, Power cord,
Quick manual, Alkaline size AA battery LR6 × 6pcs, Input terminal plate × 6 pcs, PC software (CD-ROM)
Optional accessories (sold separately)
96060, 96061, 96062, 96063, 96064 (Clamp-on Probe)
96065, 96066 (Clamp-on probe, flexible type)
98031 (Power supply adapter)*2
93047 (Portable case with magnet)
*1 Bluetooth model is available only for USA, Canada and Japan
*2 98031 Power supply adapter is not available for EU region.
USB Ver. 2.0/Bluetooth Ver. 2.1 + EDR Class2*1
15
Applicable Standard
Safety Standard
EN 61010-1 CAT IV 300 V, CAT III 600 V, CAT II 1000 V Pollution level 2
EN 61010-2-030
EN 61010-2-033
EN 61010-031
EMC*
EN 61326-1 Class A Table 2
EN 55011 Class A Group1
Power Quality
IEC 61000-4-30 Ed. 2 Class S, IEC 61000-4-15, IEC 61000-4-7
Wireless
FCC approval, IC approval, Radio Electric technology engineering Radio technology standard
*This is a Class A instrument designed for an industrial environment. Operation of this equipment in a residential area may cause radio interference, in which case users will be
responsible for any interference which they cause.
Power list of choosing clamp-on probe
For 1P2W (multiply 2 for 1P3W and 3P3W, multiply 3 for 3P4W)
Voltage
range
Clamp-on Probe Model code (rate)
Current range
96061 (50 A)
96062 (100 A)
96063 (200 A)
96064 (500 A)
96065 (1000 A)
96066 (3000 A)
5000 mA
50.00 A
10.00 A
100.0 A
20.00 A
200.0 A
50.00 A
500.0 A
100.0 A
1000 A
300.0 A
3000 A
600.0 V
3000 W
30.00 kW
6000 W
60.00 kW
12.00 kW
120.0 kW
30.00 kW
300.0 kW
60.00 kW
600.0 kW
180.0 kW
1800 kW
1000 V
5000 W
50.00 kW
10.00 kW
100.0 kW
20.00 kW
200.0 kW
50.00 kW
500.0 kW
100.0 kW
1000 kW
300.0 kW
3000 kW
96060 is dedicated for leakage only and is uncapable for power measuring
Model and suffix
Model code
CW500
Suffix code
-B0
-B1
-D
-F
-H
-N
-P
-R
-S
Accessories sold separately
Notes
Power Quality Analyzer
No Bluetooth Function
With Bluetooth Function*
AC code (UL/CSA)
AC code (VDE)
AC code (GB)
AC code (NBR)
AC code (KC)
AC code (SAA)
AC code (BS)
Model code
Model name
Notes
96060
Clamp-on probe
40 mm AC 2 A, Leakage
current measurement
96061
Clamp-on probe
18 mm AC 50 A, Load current
measurement
96062
Clamp-on probe
24 mm AC 100 A, Load current
measurement
96063
Clamp-on probe
30 mm AC 200 A, Load current
measurement
96064
Clamp-on probe
40 mm AC 500 A, Load current
measurement
96065
Clamp-on probe
max. approx. 110 mm
AC 1000 A flexible type load
current measurement
96066
Clamp-on probe
max. approx. 150 mm
AC 3000 A, 3 CH Load current
measurement
98082
Extension cable
Extension cable for Clamp-on
Probe
98031*
Power supply
adapter
Power supply from measure line
(100 to 240 V)
93047
Portable case
Case with magnet
99073
(Planned to
be released)
Conversion Cable
(Banana-DIN)
for 96030, 96033, 96036
*Available for USA, Canada and Japan only
Accessories (included with CW500)
Model name
Notes
98078
Voltage Probe
1 set 4 pcs Red Black White Blue
4 mm Approx. 3 m
93046
Carrying Case
CW500 and Clamp-on probe
can be contained
97060
SD Memory Card
(2 GB)
2 GB SD Memory Card
LOCK
Model code
SD
2GB
Relevant products
CW120 series Clamp on Power Meter
CW120/CW121
Simple and low cost model
• 3P3W model 2 CH input (CW120), 3P4W model
3CH input (CW121)
• Frequency range: 45 Hz to 65 Hz, Basic power
accuracy: ±(0.8% rdg + 0.4% rng)
• Multiple system (CW120: 3 system 1P2W,
CW121: 4 system for 1P2W)
• Recording from 1 sec.
• Measuring voltage up to 400 V
• Communication protocol: Modbus, PC link
Dim. 117 (W) × 161 (H) × 51 (D) mm
Approximately 0.6 kg
*Not available for EU region
WT300E series Power Meter (Direct current input type)
WT332E/WT333E
Compact three-phase model with optional harmonic
measurement function
Outline drawing
• Three-phase model (three-phase, three-wire: two
input elements; three-phase, four-wire: three input
elements)
• Power measurement frequency range:
DC and 0.1 Hz to 100 kHz
• Basic power accuracy: 0.1% of reading.
• Max. 3 channels simultaneous Harmonic
measurement (needs /G5 option)
• A variety of other features, including line filter,
Dim. 213 (W) × 132 (H) × 350 (D) mm
maximum hold, and integration function with
Approximately 5 kg
categorization of positive and negative polarity,
and average active power function
WT310E/WT310EH
(Unit: mm)
68
175
120
Low-cost model providing mobility for standalone
measurement of standby consumed power and rated power
• Single-phase model
• Power measurement frequency range: DC and
0.1 Hz to 100 kHz (WT310EH: up to 20 kHz)
• Basic power accuracy: 0.1% of reading.
• Wide current input range (5 mA to 20 A)
(WT310EH 1 A to 40 A)
• A variety of other features, including line filter,
Dim. 213 (W) × 88 (H) × 350 (D) mm
maximum hold, and integration function with
Approximately 3 kg
categorization of positive and negative polarity,
and average active power function
NOTICE
● Before operating the product, read the user's manual thoroughly for proper and
safe operation.
YMI-KS-MI-SE01
YOKOGAWA METERS & INSTRUMENTS CORPORATION
Global Sales Dept. /Phone: +81-422-52-6237 Facsimile: +81-422-52-6462
E-mail: [email protected]
YOKOGAWA CORPORATION OF AMERICA
YOKOGAWA EUROPE B.V.
YOKOGAWA SHANGHAI TRADING CO., LTD.
YOKOGAWA ELECTRIC KOREA CO., LTD.
YOKOGAWA ENGINEERING ASIA PTE. LTD.
YOKOGAWA INDIA LTD.
YOKOGAWA ELECTRIC CIS LTD.
YOKOGAWA AMERICA DO SUL LTDA.
YOKOGAWA AUSTRALIA PTY. LTD.
YOKOGAWA MIDDLE EAST & AFRICA B.S.C(c)
Phone: +1-770-253-7000
Phone: +31-88-4641000
Phone: +86-21-6239-6363
Phone: +82-2-2628-3810
Phone: +65-6241-9933
Phone: +91-80-4158-6000
Phone: +7-495-737-7868
Phone: +55-11-5681-2400
Phone: +61-2-8870-1100
Phone: +973-17-358100
Subject to Change without notice.
Copyright © 2015, Yokogawa Meters & Instruments Corporation
[Ed: 01/b]
Printed in Japan, 510(KP)
Facsimile: +1-770-254-0928
Facsimile: +31-88-4641111
Facsimile: +86-21-6880-4987
Facsimile: +82-2-2628-3899
Facsimile: +65-6241-2606
Facsimile: +91-80-2852-8656
Facsimile: +7-495-737-7869
Facsimile: +55-11-5681-4434
Facsimile: +61-2-8870-1111
Facsimile: +973-17-336100
http://tmi.yokogawa.com/