1
60
2 Introduction to Scilab
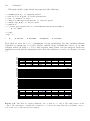
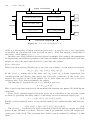
y
−π
0
π
x
sin(5t) exp(−t/2)
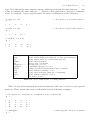
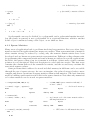
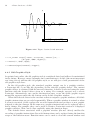
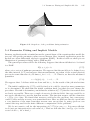
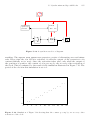
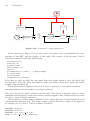
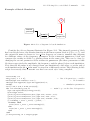
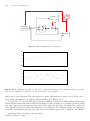
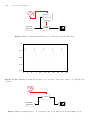
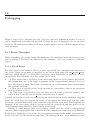
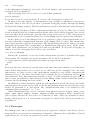
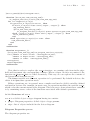
Figure 2.14. Figure obtained with xs2latex.
−→ a.x_ticks= tlist([’ticks’,’locations’,’labels’],xt,...
["$-\pi$","$0$","$\pi$"]);
−→ xtitle("","$x$","$y$");
−→ xs2latex(xget("window"),"figps");
2.4.5 Old Graphics Style
As pointed out earlier, the old graphics style is considered dated and will not be maintained
in the future. However, many examples and contributions to Scilab (the most important
one being Scicos) still use the old graphics style, so we will give a brief presentation of the
old graphics style here.
In the old graphics style, the standard graphics output can be a graphics window,
a Postscript file, or an Xfig file depending on the selected graphics driver. The current
graphics driver is obtained with the driver() function. A driver is selected using the same
function with the desired driver given as a string. For example, driver(’Pos’) selects
Postscript. Alternatively, one can use the function xinit or use the Scilab graphic export
menu that appears under the file button on the Scilab Graphics window.
When the selected driver is the one that redirects output to graphic windows, all Scilab
graphics instructions are recorded sequentially. When a graphics window is resized or when
a zoom is executed, Scilab replays the recorded instructions and produces a new graphic
adapted to the size changes. In the same way, graphics instructions can be replayed after a
driver change. For example, they can be used to obtain a Postscript version of a displayed
graphics window. This can de done explicitly using the function xs2ps.
The default driver associated with a graphics window (the Rec driver) enables the
recording of graphics instructions. Recorded instructions can be replayed using the function
xtape or the function xbasr. Function xbasc can be used to clear the current window and