1
Technical University of Crete
Department of Electronic Engineering
And Computer Engineering
Section of Electronics and Computer
Architecture
Master Thesis
«Java Software platform for Energy Buildings
Management»
Petros M. Patelis
Electronic and Computer Engineer
Chania 2008
Contents
I would like to give special thanks for their valuable assistance to the
professors
George Stavrakakis
Kostas Kalaitzakis
Dionysia Kolokotsa
This master thesis is dedicated to my family and my friends and also to
my girlfriend Christina who was helpful and supporting
-2-
Contents
Contents
Chapter 1 – Introduction.............................................................................................5
1.1 Generally .........................................................................................................5
1.2 Contribution of Master Thesis ..........................................................................6
1.3 Short Presentation of Chapters..........................................................................7
Chapter 2 – State of the Art .......................................................................................8
2.1 Generally..........................................................................................................8
2.2 Energy Performance building evaluation in Mediterranean Countries:
Comparison between software simulations and operating rating simulation ............8
2.3 Energy code for Office buildings in Israel.........................................................9
2.4 Development of energy performance benchmarks and building energy ratings
for non - domestic buildings: An example for Irish primary schools .....................11
Chapter 3 – Energy Classification based on Climatic Conditions
of a location .............................................................................................................13
3.1 Normalization of Energy Consumption...........................................................13
3.1.1 Normalization based on Heating and Cooling degree - days .....................13
3.1.2 Normalization based on Climate Severity Index (CSI) .............................17
3.1.3 Energy Classification Categories .............................................................20
Chapter 4 – Energy Classification based on European Standards ..............................23
4.1 Generally........................................................................................................23
4.2 Energy Performance Indicators.......................................................................24
4.2.1 Generally about Indicators .......................................................................24
4.2.2 Classification Procedure ..........................................................................26
4.3 Classification without Weather Correction......................................................26
4.4 Classification with Weather Correction...........................................................28
Chapter 5 – Description of the Platform ...................................................................39
5.1 Database System ............................................................................................41
5.1.1 Generally.................................................................................................41
5.1.2 ER diagram..............................................................................................42
5.1.3 Explanation of the Relationships..............................................................43
5.1.4 Presentation and Analysis of the Tables ...................................................44
Chapter 6 – Case Study and Results .........................................................................47
6.1 Generally........................................................................................................47
6.2 Ground Floor..................................................................................................47
6.3 1st Floor..........................................................................................................48
6.4 Experimental Results......................................................................................49
6.4.1 Energy class and Results for Ground Floor ..............................................49
6.4.2 Energy class and Results for 1st Floor ......................................................54
Chapter 7 – Conclusions and Future Work ...............................................................59
7.1 Generally........................................................................................................59
7.2 Analysis of the results for the 1st Floor............................................................59
7.3 Analysis of the results for the Ground Floor ..................................................60
7.4 Future Work ...................................................................................................61
References ...............................................................................................................62
Appendix A..............................................................................................................63
A.1 Energy Classification using Calculated Method .............................................63
A.1.1 Climate Severity Index and Degree - days Methods analysis ...................63
A.1.2 Explanation of Building's Data................................................................65
-3-
Contents
Appendix B..............................................................................................................66
B.1 Energy Classification using Measured Method...............................................66
B.1.1 Heating Consumption Calculation...........................................................66
B.1.2 Cooling Consumption Calculation...........................................................67
B.1.3 Lighting Consumption Calculation..........................................................68
B.1.4 Appliances Consumption Calculation......................................................69
B.1.5 Outdoor Temperature File .......................................................................70
Appendix C..............................................................................................................71
C.1 Communication between sensors and Personal Computer ..............................71
C.1.1 Use of Java Native Interface....................................................................71
C.1.2 Java Native Interface...............................................................................71
C.2 Measurement Java Platform for PCI - 6024E .................................................77
C.2.1 Platform Interface ...................................................................................77
C.2.2 Platform Operation..................................................................................79
C.3 Description of PCI - 6024E............................................................................82
C.3.1 Features of PCI - 6024E device ...............................................................82
C.3.2 NI - DAQ Driver Software ......................................................................82
C.3.3 Block Diagram of 6024E.........................................................................82
C.3.4 Measurement Precision ...........................................................................83
C.3.5 I/O Connector .........................................................................................83
C.3.6 Differential Connection...........................................................................84
Appendix D..............................................................................................................85
D.1 User Manual ..................................................................................................85
D.1.1 Login Security System ............................................................................85
D.1.2 Main Menu .............................................................................................85
D.1.3 Building's Data operation........................................................................89
D.1.4 Measured Method ...................................................................................91
D.1.5 Calculated Method..................................................................................94
D.1.6 Building Grading ....................................................................................95
Appendix E ..............................................................................................................96
E.1 Features of European Standard prEN 15203/15315 ........................................96
E.2 Terms and Definitions....................................................................................96
E.3 Symbols, Units and Subscripts .......................................................................98
Appendix F ..............................................................................................................99
F.1 Description of Java Files ................................................................................99
F.1.1 MyDBConnection.java file ......................................................................99
F.1.2 Pfileoperations.java file ...........................................................................99
F.1.3 SimplifiedRatingMethod.java file ..........................................................100
F.1.4 CalculateLoads.java file.........................................................................100
F.1.5 EnergyYear.java file ..............................................................................101
F.1.6 EnergyRating.java file ...........................................................................101
F.1.7 EnergyResults.java file ..........................................................................102
F.1.8 EnergyGradingResults.java file .............................................................102
Appendix G............................................................................................................104
G.1 Relational Scheme and Tables .....................................................................104
-4-
Chapter 1 - Introduction
Chapter 1 – Introduction
1.1 Generally
In the past few years, the rapid progress of Computer Engineering science has
led to the development of many intelligent and flexible systems in the level of
software and in the level of hardware as well. Furthermore, according to frequent
reports about the reduction of the classical energy sources (e.g oil, gas) and the
environmental pollution, which is caused by their thoughtless use, the scientific
community has turned its interest to using not only renewable energy systems but also
to developing software applications that can offer useful information about a building.
Such applications have been developed in order to achieve energy and environmental
classifications in buildings.
Energy and environmental management in buildings is a new field of interest
and aims at the maintenance of living and working conditions for the occupants in a
specific building. The role of such applications is to inform each user of the system or
the owner of a building about the weaknesses of a building. This master thesis
introduces an application for energy management in buildings and tries to inform
about the energy consumption and how it can be reduced without causing any
discomfort conditions to the occupants. The development of such applications can
give an important solution against the energy problem, which deplores the modern
societies, and can upgrade the standard of living especially in regions with great
number of inhabitants.
This application has been developed in Java programming language and uses
efficient techniques for energy classification in buildings located in Greece. These
techniques are based on two basic methodologies introduced by Climatic Conditions
and European prEN Standards. Moreover, the Java application uses a storing data
system by using JavaDB library. This Java library is offered by Sun Microsystems
Inc. Company and it is used for the implementation of a database system which can be
considered embedded to the application. Furthermore, such an application can be
applied in any building. However, in this case only four types of buildings are used.
These four categories are: Schools, Shops, Hotels and Offices.
Chapter 1 - Introduction
1.2 Contribution of Master Thesis
This master thesis deals with energy classification methods based on Climatic
Conditions and European standards methodologies. It presents useful information
about each methodology and describes the techniques used for classification.
Moreover, it describes each application form/interface used for energy rating
implementation while it also presents the proper data needed for the application to
function successfully. Furthermore, it is essential to consider that this Java application
is divided in two parts. The first part deals with the proper data collection and the
second part deals with the methods of classification including their results.
As far as the first part, this application supports data either provided by files,
which have been stored using a Building Energy Management System, or have been
provided manually depending on the classification methodology that is going to be
applied. In the case of data stored in files, a Building Management System is
responsible for these measurements and such a system has been set up in the Electric
Circuits and Renewable Energy Sources laboratory which is located in the Technical
University of Crete.
The second part can be analyzed with regard to the methodology that was
used. This means that, if a user of the system desires to use the Climatic Conditions
methodology then there are two additional methods that the user can choose. These
methods are: Climate Severity Index and Degree – Days. Also, if the system user
desires to use this methodology, which refers to a European Standard, then the
methods that can be used, are: Measured and Calculated methods. With regard to the
results, the application uses Java libraries which provide graphical depiction of the
results and additionally they can be organized in written forms.
-6-
Chapter 1 - Introduction
1.3 Short Presentation of Chapters
Chapter 1 presents a short description about the Java application and the aim
of implementing it. What it should be achieved via the application and a short analysis
about the contribution of thesis is presented as well. Chapter 2 constitutes a quite
extended description of the most recent developed methods for energy classification
in buildings located in Greece or in other countries all over the world. In chapter 3,
the first methodology of energy classification (based on climatic conditions) in
buildings for Greek locations is presented. The requirements of this methodology and
the mathematic background are presented as well.
Chapter 4 presents the energy classification methodology based on the
standard prEN 15203:2006. The required specifications are declared including
mathematic background and the two categories of this energy classification
methodology. In both methodologies, data required and equations used for the
implementation are presented. Chapter 5 presents a flowchart of the application
including a short description. Moreover it includes a description and a presentation of
the database system that was used (ER diagram), the tables composing it and the
existing relationships among tables.
In chapter 6, case study and the results are presented. The case study part
describes the place where the application was applied while the result part is
constituted by graphs replying to building’s energy consumptions for a whole year.
Chapter 7 includes the conclusions that arise from the analysis of the graphs presented
in chapter 6. Moreover, future extensions constitute part of this chapter. This part
introduces techniques and ways of extending the present application. Finally,
important information about various topics that have been taken into account for the
implementation is described in appendices.
-7-
Chapter 2 – State of the Art
Chapter 2 – State of the Art
2.1 Generally
This chapter presents some of the most recent essays based on energy
classification in buildings located in Europe and other countries. It introduces a short
presentation of each essay.
2.2 Energy performance building evaluation in Mediterranean
countries: Comparison between software simulations and operating
rating simulation
In this essay three different models, including software calculations,
concerning Energy Performance of buildings, have been developed and compared to
real energy consumption data (Tronchin & Fabbri 2007). This study has been applied
to a single house in Italy and its results have been compared to results coming from
software codes applied in Mediterranean countries.
Figure 1. DesignBuilder simulation.
Figure 2. Ground floor
This application implements three different methods. Method A calculates the
effective energy consumption for data measured in three years. This method uses
methodology described by prEN standard 15603. Moreover, it uses real energy
consumption data coming from gas or electrical bills. The average values of energy
consumption in bills can be converted in primary energy by using primary energy
factors regarding different energy carriers.
Method B is implemented by using CEN standards prEN 13790 and 15603
and plant systems. This method simulates data by using “DesignBuilder” and
“EnergyPlus” softwares and it was implemented in a 3D interface using metrological
data. This software allows the dynamic evaluation of heating and cooling
8
Chapter 2 – State of the Art
consumption during all seasons, including DHW and other energy consumption. It
also informs users of the average temperature indoor and surface temperature during
all year. Finally, method C is based on an Italian law and was implemented by
Polytechnic of Milan.
2.3 Energy code for Office buildings in Israel
This section presents a new energy code for office buildings in Israel (Shavin,
Yezioro & Capeluto 2007). This code is based on a prescriptive approach and can be
easily applied as a tool for the design of office buildings. This approach is based on
the results obtained from an energetic – economic optimization model that provides a
recommended and preferred prescription for office buildings under given constraints.
The method uses a model, which creates a set of suboptimal solutions, and allows the
existence of energy savings with reasonable economic costs along with architectural
design freedom. The model uses ENERGY software as the basic simulation
application. This application includes daylight and artificial lighting calculations.
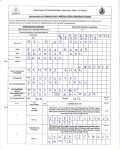
The implemented model takes into account 12 decision variables which are
identified as those factors that influence the most the energetic performance for office
buildings. Each one of these decision variables may obtain between 2 to 27 discrete
values (see Table 1). Finally, the optimization model aims at the reduction of energy
consumption for given economic constraints. In this case, the total life cycle cost
(TLCC) is calculated. The TLCC includes energy cost of each design alternative and
construction cost of the 12 decision variables and the cost of the air conditioning
system according to the required size to keep internal thermal comfort, i.e.
temperature and relative humidity, and interest on the capitalized cost of building and
mechanical elements. The energy code for office buildings focuses only on electrical
energy consumption as most new office buildings are cooled and heated by air
conditioning units.
9
Chapter 2 – State of the Art
Table 1. Variables presentation including their ranges
10
Chapter 2 – State of the Art
2.4 Development of energy performance benchmarks and building
energy ratings for non-domestic buildings: An example for Irish
primary schools
This application presents a methodology in which energy benchmarks and
rating systems are developed, starting from the data collection from a building stock
(Hernadez, Burke & Lewis 2007). Moreover, this methodology is applied in an Irish
school including calculated and measured methods. This analysis concerns primary
schools in Ireland since they can be considered as homogeneous buildings with
homogeneous occupancy and activities. In this case, data collection is achieved by
questionnaires since it is expected that schools would provide a better response rate
compared to other buildings.
The information, which is included in the questionnaires, refers to the
following parts:
-
General information about the school (name, address, etc)
-
Construction details (specifications for the walls and roofs, etc)
-
Heating, ventilation and lighting.
After the completion of 67 questionnaires, their data, which included
occupancy densities, activity and heating schedules, were used to develop a standard
activity schedule for primary school buildings. The construction values for stock
reference buildings came from the data included on the questionnaire responses. A
summary of the main characteristics used for the stock reference building is presented
in Table 1.
11
Chapter 2 – State of the Art
The reference regulation parameter for buildings, which is presented in Table 2, is
based on the Irish Building Regulations 2005 Technical Guidance.
The Calculated method for rating is obtained by the calculation of design
values of a building. Furthermore, the measured energy rating is obtained by the
weighted sum of the measured annual amounts of all the energywares used by the
building. Measured energy rating is also called operational rating. Also, the software
used for the calculation of energy performance in buildings is EnergyPlus. When
Energy Performance indicator is calculated then a grade technique is applied. This
technique is provided by the prEN standard 15217:2005 and is described in Table 3.
EP corresponds to the energy performance indicator of the Irish school and
parameters Rs and Rr corresponds to the building stock reference and regulation
reference respectively.
12
Chapter 3 – Energy Classification based on Climatic Conditions of a Location
Chapter 3 – Energy Classification based on Climatic
Conditions of a Location
3.1 Normalization of Energy Consumption
3.1.1 Normalization based on Heating and Cooling Degree – days
The specific classification methodology takes into account a location’s
climatic conditions so that energy classifications of buildings in different locations
can be compared. In order to define the class of a building, by using this
methodology, the calculation of the normalized form of energy consumption is
required. This calculation procedure requires the existence of reference climatic
conditions – in this case the climatic conditions of Athens. The criterion of selecting
these reference conditions is based on the fact that the evaluated and recorded
buildings are located in Athens.
This methodology of energy classification is based on the modification of
energy needs for heating and cooling when the building under study is in different
location than the one that has reference climatic conditions. In case that the building
under study exists in the reference location, its energy needs for heating and cooling
do not modify.
The classification methodology which uses heating and cooling degree – days
can be considered as the most popular approach of normalization in Greece. Heating
and cooling degree – days are equal to the difference between base and outdoor
temperatures multiplying it with the number of days which indicate the period of
interest.
The following equations are used for the calculation of heating and cooling
degree – days for a location:
·
Cooling period
t end
HDD = å (THDD _ base - Tout )
(1)
t start
·
Heating period
t end
CDD = å (Tout - TCDD _ base )
t start
13
(2)
Chapter 3 – Energy Classification based on Climatic Conditions of a Location
where
HDD are the heating degree - days [ 0 C × days ]
CDD are the cooling degree – days [ 0 C × days ]
THDD _ base is the indoor base temperature during heating period [ 0 C ]
TCDD _ base is the indoor base temperature during cooling period [ 0 C ]
Tout is the mean outdoor temperature in daily base [ 0 C ]
t start is the starting day of heating/cooling period
t end is the ending day of heating/cooling period
The implementation of this methodology requires the following rules:
·
The suggested base temperature for Greece is equal to 19 0 C .
·
The degree – days are calculated in daily base.
·
Only positive values of differences between base and outdoor
temperature are accepted since these indicate the actual needs for
heating or cooling.
·
The calculations are executed for a whole year including both climatic
conditions for the reference location ( HDD N και CDD N ) and climatic
conditions for any other location ( HDD και CDD ).
It is very important to be noticed that the parameter chosen for the calculation
of normalized energy consumption is the outdoor temperature. Outdoor temperature is
the most available parameter describing climatic conditions in Greek locations,
against others, such as solar radiation. A simplified approach for energy normalization
using heating and cooling degree – days is described by the following equations:
·
N
Q Heating
= Q Heating ×
HDD N
HDD
(3)
·
N
QCooling
= QCooling ×
CDD N
CDD
(4)
14
Chapter 3 – Energy Classification based on Climatic Conditions of a Location
where
N
Q Heating
is the annual normalized energy consumption for heating
[kWh / year ]
Q Heating is the annual energy consumption for heating [kWh / year ]
N
QCooling
is the annual normalized energy consumption for cooling
[kWh / year ]
QCooling is the annual energy consumption for cooling [kWh / year ]
HDD N are the heating degree – days for reference location [ 0 C × days ]
CDD N are the cooling degree – days for reference location [ 0 C × days ]
The heating and cooling degree – days for the reference location (Athens) are
1228 and 1020 respectively, considering base temperature equal to 19 0 C . The
Cooling period is the period that includes the range of months from May to September
and the heating period is the one that includes the range of months from October to
April (see Table 1).
Period
Degree – days [ 0 C × days ]
Heating
October – April
1228
Cooling
May – September
1020
Table 1. Heating and Cooling degree – days based on reference location (Athens)
The following table presents Greek locations including their heating and cooling
degree – days:
Location
Heating Degree –
Location
days
Cooling Degree –
days
1. Agrinio
1331
42. Kos
896
2. Agchialos
1740
43. Lamia
1467
3. Athens
1228
44. Larissa
1858
4. Aigio
1210
45. Lefkada
1146
15
Chapter 3 – Energy Classification based on Climatic Conditions of a Location
5. Alexandroupolis
1923
46. Limnos
1449
6. Aliartos
1839
47. Lidoriki
1991
7. Anavryta
1537
48. Methoni
953
8. Antiparos
899
49. Milos
1068
9. Anogeia
1703
50. Mytilini
1234
10. Araxos
1155
51. Naxos
856
11. Argostoli
998
52. Nafplion
1095
12. Arta
1276
53. Xanthi
1910
13. Astypalaia
835
54. Oreoi
1428
14. Volos
1471
55. Orestiada
2187
15. Gortynos (Crete)
1004
56. Palaiochora (Crete)
730
16. Desfina
1974
57. Paros
932
17. Domokos
2376
58. Patra
1207
18. Drama
1945
59. Piraeus
1001
19. Edessa
2053
60. Platanos (Nafpaktias)
2363
20. Elefsina
1240
61. Polygyros
2300
21. Zakynthos
940
62. Ptolemaida
2483
22. Irakleio
829
63. Pyrgos
1110
23. Thasos
1781
64. Rethymno
714
24. Salonica
1812
65. Rhodes
935
25. Thira
1082
66. Samos
1022
26. Ierapetra
681
67. Serres
2010
27. Ikaria
877
68.Siteia
745
28. Ioannina
2027
69. Skopelos
1452
29. Kavala
1970
70. Skyros
1246
30. Kalavryta
2240
71. Souda
1055
31. Kalamata
992
72. Soufli
2124
32. Kalampaka
1813
73. Syros
971
33. Karpathos
697
74. Tanagra
1546
34. Karystos
1140
75. Germiades
2089
35. Kerkyra
1203
76. Trikala
1702
36. Kozani
2469
77. Tripoli
2085
37. Komotini
1996
78. Tympakion
898
16
Chapter 3 – Energy Classification based on Climatic Conditions of a Location
38. Konitsa
2003
79. Farsala
1777
39. Korinthos
1167
80. Florina
2620
40. Kythira
1052
81. Chalkida
1200
41. Kymi
1516
82. Chios
1113
Table 2. Heating and Cooling degree – days for Greek locations
3.1.2 Normalization based on Climate Severity Index (CSI)
After the definition of heating or cooling energy needs, two locations can be
considered identical as far as the climatic conditions are concerned, if heating energy
consumption of a building is equal to cooling energy consumption of the same
building under the climatic conditions of both locations. Actually, it is possible that
two locations with the same heating energy consumption, can have different cooling
energy consumption and reversely.
The methodology which can express heating and cooling energy needs of a
building regarding climatic conditions is the Climate Severity Index (CSI)
methodology. This methodology calculates severities and compares them between
two different climatic conditions (that is, climatic conditions of a building’s location
and climatic conditions of a reference location). Actually, the higher the value of CSI
the more severe the climatic conditions can be. Furthermore, only positive values of
CSI are used. During a year CSI values are calculated twice. The first value refers to
heating period and the other refers to cooling period. When CSI values are negative or
zero then the energy needs for heating and cooling can be considered as negligible.
This means that there are no energy needs under the specific climate conditions.
Now, it can be considered that energy needs for a specific building can be
calculated under different climatic conditions which may indicate either different
locations or different time periods for a specific location or a combination of both.
The calculation of normalized energy needs for a building is achieved by dividing the
value of Climate Severity Index of the reference location to the value of Climate
Severity Index for a specific location and then multiplying it with the heating or
cooling energy needs of the building. The absolute effect of climatic conditions on
heating or cooling energy needs depends on the features of a building, but the relative
climatic effect is independent from parameters like a building’s envelope, the size of
17
Chapter 3 – Energy Classification based on Climatic Conditions of a Location
the windows or the orientation of the building. The only significant parameter is the
use of a building due to internal gains.
The steps required, are presented below:
·
Selection of the reference climate conditions
·
Selection of typologies for each building category
·
Selection of climatic conditions referring to different climates (e.g
typical meteorological time)
Furthermore, the energy needs for heating and cooling are calculated under
different scenarios (orientation, etc) by using energy simulation models. The results of
each combination of climatic conditions are evaluated while the value of Climate
Severity Index for the specific combination is defined. The average value of all CSI
parameters refers to an indicator of energy needs for a specific location. The equation
used for the CSI calculation is presented below:
CSI = a × DD + b × (n / N ) + c × ( DD ) 2 + d × (n / N ) 2 + e (5)
where:
DD are the degree – days for heating or cooling depending on the evaluation period
n/N is the fraction of the real sunlight hours to the maximum sunlight hours for the
specific latitude
a, b, c, d and e are constants depending on the type of building
Table 3 presents the values for a, b, c, d, e parameters for heating/cooling periods.
Period
a
b
c
D
e
Winter
-0,002
-2,20
9.04 × e -6
1,88
0,96
Summer
0,028
8,93
- 6.62 × e -5
-5,52
-4,81
Table 3. CSI constants for residences located in Greece.
The measures of annual energy consumption for a building, during a year, can
be modified in order to comply with the reference year. Moreover, the measures of
18
Chapter 3 – Energy Classification based on Climatic Conditions of a Location
annual energy consumption for a building in a specific location, can be modified in
order to comply with the climatic conditions for the reference location.
The calculation of this category of normalization can be achieved by
multiplying the energy consumption for heating or cooling with the fraction of the
reference value of CSI index and the value of CSI index for climatic conditions for a
specific location. The equations used for the calculation are:
·
·
N
Q Heating
= QHeating ×
N
Cooling
Q
= QCooling ×
N
CSI Heating
CSI Heating
N
CSI Cooling
CSI Cooling
(6)
(7)
where
N
Q Heating
is
the
annual
normalized
energy
consumptions
for
heating [kWh / year ]
N
QCooling
is the annual normalized energy consumptions for cooling
[kWh / year ]
Q Heating is the annual energy consumption for heating [kWh / year ]
QCooling is the annual energy consumption for cooling [kWh / year ]
N
CSI Heating
is the value of Climate Severity Index for heating energy needs
for the reference location
N
CSI Cooling
is the value of Climate Severity Index for cooling energy needs
for the reference location
CSI Heating is the value of Climate Severity Index for heating energy needs
for a specific location
CSI Cooling is the value of Climate Severity Index for heating energy needs
for a specific location
It is very important to be noticed that the only parameter given for the
calculation of energy consumption is degree – days for heating of a specific latitude
(see table 2) while cooling degree – days are not given. In this case, the calculation of
degree – days was achieved by using equation 2 for each Greek location. In addition,
there are four building categories tested and evaluated. These categories are: Schools,
Offices, Shops and Hotels.
19
Chapter 3 – Energy Classification based on Climatic Conditions of a Location
3.1.3 Energy Classification Categories
As it was mentioned previously, there are four types of buildings which are
evaluated: Schools, Offices, Hotels and Shops. Also there are four energy categories
according to the value of normalized energy consumption as well. An energy category
depends on the type of building, the period of interest and whether the building has or
has not insulation. The following tables present the four energy categories for each
building type.
Categories
A
B
C
D
[0 – 10)
[10 – 20)
[20 – 40)
>=40
[0 – 10)
[10 – 25)
[25 – 55)
>=55
[0 – 40)
[40 – 65)
[65 – 125)
>=125
[0 – 45)
[45 – 75)
[75 – 130)
>=130
Consumption
Cooling period –
with Insulation
( KWh / m 2 × year )
Cooling period –
without Insulation
( KWh / m 2 × year )
Heating period –
with Insulation
( KWh / m 2 × year )
Heating period –
without Insulation
( KWh / m 2 × year )
Table 4. Energy consumption’s limits for Offices
20
Chapter 3 – Energy Classification based on Climatic Conditions of a Location
Categories
A
B
C
D
[0 – 10)
[10 – 15)
[15 – 25)
>=25
[0 – 25)
[25 – 40)
[40 – 80)
>=80
[0 – 35)
[35 – 65)
[65 – 120)
>=120
[0 – 30)
[30 – 60)
[60 – 110)
>=110
Consumption
Cooling period –
with Insulation
( KWh / m 2 × year )
Cooling period –
without Insulation
( KWh / m 2 × year )
Heating period –
with Insulation
( KWh / m 2 × year )
Heating period –
without Insulation
( KWh / m 2 × year )
Table 5. Energy consumption’s limits for Shops
Categories
A
B
C
D
[0 – 15)
[15 – 35)
[35 – 75)
>=75
[0 – 30)
[30 – 45)
[45 – 65)
>=65
[0 – 35)
[35 – 60)
[60 – 95)
>=95
Consumption
Cooling period
( KWh / m 2 × year )
Heating period –
with Insulation
( KWh / m 2 × year )
Heating period –
without Insulation
( KWh / m 2 × year )
Table 6. Energy consumption’s limits for Schools
21
Chapter 3 – Energy Classification based on Climatic Conditions of a Location
Categories
A
B
C
D
[0 – 5)
[5 – 15)
[15 – 25)
>=25
[0 – 5)
[5 – 15)
[15 – 35)
>=35
[0 – 90)
[90 – 140)
[140 – 215)
>=215
[0 – 95)
[95 – 145)
[145 – 205)
>=205
Consumption
Cooling period –
with Insulation
( KWh / m 2 × year )
Cooling period –
without Insulation
( KWh / m 2 × year )
Heating period –
with Insulation
( KWh / m 2 × year )
Heating period –
without Insulation
( KWh / m 2 × year )
Table 7. Energy consumption’s limits for Hotels
22
Chapter 4 – Energy Classification based on European Standard
Chapter 4 – Energy Classification based on European
Standard prEN 15203:2006
4.1 Generally
Standards can be considered as instructions containing methodologies which
are used for achieving energy or environmental classification of buildings. This
master thesis is focusing only on standards that refer to energy classification. These
standards are developed by the scientific community of European Union and are
legally established. Therefore each member of the European Union, is obliged to
comply with them according to its energy policy. The data used for energy
classification, which are measured annually, define building parameters (e.g.
Rs and Rr ) and climatic data (such as temperature, relative humidity etc) (CEN
Members 2006). The implementation of the standards’ methodologies can lead to
useful conclusions about energy consumption for a building.
However, standards have not only been developed in Europe but also in the
United States as well. This thesis is focusing, only, on standards developed in Europe
and their implementation in buildings located in Greece. It is essential to notice that,
energy classification based on standards is a more reliable and convenient way than
classification using degree – days and climate severity index methods. This is based
on the fact that degree – days, which are also used by climate severity index
methodology, are not available for most cases of energy classification. This analysis
presents two main methodologies of classification: including weather correction and
not including weather correction.
23
Chapter 4 – Energy Classification based on European Standard
4.2 Energy Performance Indicators
4.2.1 Generally about Indicators
In order to study the Energy performance of a building, an indicator’s value is
measured. The indicator is called Energy Performance indicator (or EP indicator)
(CEN Members 2006). EP indicator is expressed by the weighted sum of a building’s
delivered energy. This is described by the following expression:
n
EPperiod = å deliveredEnergy i ,
(1)
i =1
where i = 1,2,..., n declares the months of a period (heating/cooling).
Furthermore, the Energy Performance indicator can represent the Primary
energy of a building ( E p ), Carbon Dioxide emissions ( mCO2 ) and the net delivered
energy defined by national policies (e.g. delivered energy, E p ). In addition, indicators
should be based on two types of ratings according to prEN 15203/15315. These types
of ratings are:
-
standard calculated energy rating
-
measured energy rating
The calculated energy rating consists a convenient way for planned or actual
buildings. An indicator is renamed to “standard calculated energy indicator” or
“measured energy indicator” if it is based on standard calculated energy rating or
measured energy rating respectively. The calculation of EP indicator demands two
types of requirements:
a) the definition of overall energy performance requirement ( EPr )
b) several specific requirements based on
1.
energy use for heating, domestic hot water, cooling,
lighting, etc
2.
energy need for heating domestic hot water and cooling
24
Chapter 4 – Energy Classification based on European Standard
3.
features of a building itself or of its technical building
systems (e.g. heat transfer coefficient of building’s
envelope, etc.)
4.
features of the building envelope or technical building
systems components (e.g. thermal transmittance of walls,
efficiency of boilers, insulation of heating and hot water
pipes)
While each indicator must be different for
-
a new building
-
renovation of an existing building
-
extension of an existing building
-
different types of buildings
For new buildings and their renovations, requirements shall include one
overall energy performance requirement. For partial renovation of an existing
building and for extension to an existing building where overall requirements can be
difficult to apply, simplified approaches based on specific requirements can be used.
When specifying these requirements a consideration shall be given to the following
important energy uses:
-
thermal characteristics of the building envelope
-
heating installation and hot water supply
-
air conditioning installation (including dehumidification)
-
ventilation (including humidification)
-
built in lighting installation
-
passive solar heat sources and solar protection
-
energy production in particular by renewable sources and co-generation.
25
Chapter 4 – Energy Classification based on European Standard
4.2.2 Classification Procedure
For the determination of a building’s class the following steps are required:
a) definition of the building’s type (e.g. office, hotel, etc)
b) selection of Energy Performance Regulation parameter ( Rr )
and Building Stock reference parameter ( Rs ) according to the
building’s type
c) determination of EP indicator’s values for each period of a year
(heating or cooling)
d) determination of the class according to the following rules:
i)
Class A → EP < 0.5 × Rr
ii)
Class B → 0.5 × Rr £ EP < Rr
iii)
Class C → Rr £ EP < 0.5 × ( Rr + Rs )
iv)
Class D → 0.5 × ( Rr + Rs ) £ EP < Rs
v)
Class E → Rs £ EP < 1.25 × Rs
vi)
Class F → 1.25 × Rs £ EP < 1.5 × Rs
vii)
Class G → 1.5 × Rs £ EP
4.3 Classification without Weather Correction
The analysis based on classification without weather correction concerns
annual data referring to two main periods: Heating and Cooling period. The
application form that implements this methodology is presented in Appendix B. The
use of this methodology demands data taken for 3 or more years (CEN Members
2006). These data come from electrical, oil or gas bills in case of heating and cooling
devices. In case of lighting devices and appliances, data can come either from files
(where data are stored into files by BEMS) or inputs declaring consumption in watts,
the number of used devices and the total hours of usage. The application, which is
responsible for annual energy classification, consists of 4 categories: Heating,
Cooling, Lighting and Appliances.
Firstly, this study is focusing only on measured energy and not on calculated
energy. The determination of this type of energy is based on an assessment time
26
Chapter 4 – Energy Classification based on European Standard
period. Assessment time period is called a significant number of years (in this case, 3
or more years) where several measurements are taken in order that energy
consumption of a building is calculated. Furthermore, there are requirements that
must be taken into account for energyware calculation which are:
-
the time period is an integer number of years. If assessment period is not
an integer then the equation 2 indicates how many energywares can be
calculated
-
if the time of period is less than 3 years. Then energyware calculation is
based on the method including weather correction (see next paragraph)
-
a building cannot be modified when energy performance is changed during
the assessment time period. In case that a change occurs then a new
assessment time period must be defined in order to get the new energy
rating
Energyware is calculated by the following equation:
E=
t an
× E per
t per
(2)
where
E per is the amount of energyware used during assessment period
t an is the duration of a year
t per is the assessment time period
27
Chapter 4 – Energy Classification based on European Standard
4.4 Classification with Weather Correction
This methodology uses the same application system for data collection and it
uses data taken for less than 3 years (see Appendix B). Each building is classified
annually for a specific assessment time period (1 or 2 years) (CEN Members 2006).
The Energyware of a building is defined by the following equation:
E an =
Qan ,calc
Q per ,calc
× E per
(3)
where
E per is the amount of energyware used for heating or cooling during the assessment
time period.
Qan ,calc is the annual calculated energy need for heating or cooling.
Q per ,calc is the calculated energy need for heating or cooling during the assessment
time period.
And Qan ,calc parameter is defined by the following equations according to a specific
period of year:
n
Qcalc ,heating = å U i × Ai × (Tout - Ti ) - (Q floor + Qsol + Qair + Qlight + Qappl + Qeq )
i =1
n
Qcalc ,cooling = (Q floor + Qsol + Qair + Qlight + Qappl + Qeq ) - å U i × Ai × (Ti - Tout )
(4)
i =1
where
U : conductivity of the walls
A : building’s area ( m 2 )
Ti : indoor temperature ( o C )
Tout : outdoor temperature ( o C )
Q floor , Qlight , Qeq , Qsol , Qappl : heating or cooling loads measured on floor, lighting,
building’s equipment, solar irradiance and appliances respectively.
28
Chapter 4 – Energy Classification based on European Standard
Qair : heating or cooling load excluded by air. This load is calculated by r × C r × V& .
Studying equation 4, someone can easily realize that the weather correction is
obtained by the difference between indoor and outdoor temperature. This means that
the evaluation of annual energy consumption takes into account indoor and outdoor
temperatures measured according to the specific year and location.
However, the calculation of energy needs for a building considers both periods
of study. This means that, two energy need values are defined, one for heating and
one for cooling period. The overall energy need for the building is equal to the mean
value of heating and cooling energy need amounts. So,
Eoverall ,an =
E an ,heating + Ean ,cooling
(5)
2
The value of Eoverall ,an defines the class of a building based on the following rules:
i)
Class A → Eoverall , an < 0.5 × Rr
ii)
Class B → 0.5 × Rr £ Eoverall ,an < Rr
iii)
Class C → Rr £ Eoverall ,an < 0.5 × ( Rr + Rs )
iv)
Class D → 0.5 × ( Rr + Rs ) £ Eoverall , an < Rs
v)
Class E → Rs £ E overall , an < 1.25 × Rs
vi)
Class F → 1.25 × Rs £ Eoverall ,an < 1.5 × Rs
vii)
Class G → 1.5 × Rs £ Eoverall ,an
29
Chapter 4 – Energy Classification based on European Standard
4.5 Reference Values
4.5.1 Energy Performance Regulation Reference R r
According to standard prEN ISO 15217, R r parameter corresponds to the
typical value of the requirements of energy performance regulations for new
buildings. R r is given as input before the classification process starts. Each building
has its own R r parameter. The unit of this parameter is KWh/year and compared to
indicator EP it indicates the class of a building (see below).
4.5.2 Building Stock Reference
This corresponds to the energy performance reached by approximately 50% of
the national or regional building stock (median value). This parameter is provided by
prEN ISO 15217 standards as well. The value of this parameter differs in every
building. This means that the four types of buildings have different values of R s . For
buildings in Greece this value is extracted by the following charts. The charts contain
data for heating/cooling period, for different types of building and for the existence of
Figure 1. Graph concerning to Offices with insulation during Cooling period.
30
150_155
140_145
130_135
120_125
110_115
100_105
90_95
80_85
70_75
60_65
50_55
40_45
30_35
20_25
10_15
0_5
%
Buildings
insulation or the lack of it.
Chapter 4 – Energy Classification based on European Standard
Offices – Cooling period
(without Insulation)
100
90
80
%
Buildings
70
60
50
40
30
20
C
160_165
150_155
140_145
130_135
120_125
110_115
100_105
90_95
80_85
70_75
60_65
50_55
D
40_45
30_35
Β
10_15
Α
0_5
0
20_25
10
Energy (kWh/sqm)
Figure 2. Graph concerning to Offices without insulation during Cooling period.
%
Buildings
100
90
80
70
60
50
40
30
20
10
0
Offices – Heating period
(with Insulation)
Energy (kWh/sqm)
Figure 3. Graph concerning to Offices with insulation during Heating period.
31
600_605
575_580
550_555
525_530
500_505
475_480
450_455
425_430
350_355
325_330
300_305
275_280
250_255
225_230
200_205
175_180
150_155
125_130
100_105
75_80
400_405
D
C
375_380
Β
50_55
25_30
0_5
Α
Chapter 4 – Energy Classification based on European Standard
Offices – Heating period
(without Insulation)
100
90
80
%
Buildings
70
60
50
40
30
C
690_695
660_665
630_635
600_605
570_575
540_545
510_515
480_485
450_455
420_425
390_395
360_365
330_335
300_305
270_275
240_245
210_215
180_185
150_155
D
120_125
Β
90_95
Α
60_65
0
0_5
10
30_35
20
Energy (kWh/sqm)
Figure 5. Graph concerning to Shops with insulation during Cooling period.
32
90_95
85_90
80_85
75_80
70_75
65_70
60_65
55_60
50_55
45_50
40_45
35_40
30_35
25_30
20_25
15_20
10_15
5_10
0_5
%
Buildings
Figure 4. Graph concerning to Offices without insulation during Heating period.
Chapter 4 – Energy Classification based on European Standard
Shops – Cooling period
(without Insulation)
100
90
80
%
Buildings
70
60
50
40
30
20
C
270_275
255_260
240_245
225_230
210_215
195_200
180_185
165_170
150_155
135_140
120_125
105_110
90_95
D
75_80
60_65
Β
45_50
15_20
Α
0_5
0
30_35
10
Energy (kWh/sqm)
Figure 6. Graph concerning to Shops without insulation during Cooling period.
Shops – Heating period
(with Insulation)
100
90
80
%
Buildings
70
60
50
40
30
20
Energy (kWh/sqm)
Figure 7. Graph concerning to Shops with insulation during Heating period.
33
315_320
300_305
285_290
270_275
255_260
240_245
225_230
210_215
195_200
180_185
165_170
150_155
135_140
120_125
D
105_110
90_95
75_80
C
60_65
Β
30_35
15_20
Α
0_5
0
45_50
10
Chapter 4 – Energy Classification based on European Standard
Shops – Heating period
(without Insulation)
100
90
80
%
Buildings
70
60
50
40
30
Energy (kWh/sqm)
Figure 9. Graph concerning to Hotels with insulation during Cooling period.
34
50_55
45_50
40_45
35_40
30_35
25_30
20_25
15_20
10_15
5_10
0_5
%
Buildings
Figure 8. Graph concerning to Shops without insulation during Heating period.
690_695
660_665
630_635
600_605
570_575
540_545
510_515
480_485
450_455
420_425
390_395
360_365
330_335
300_305
270_275
240_245
210_215
180_185
90_95
D
150_155
C
120_125
Α Β
60_65
0
0_5
10
30_35
20
Chapter 4 – Energy Classification based on European Standard
Hotels – Cooling period
(without Insulation)
100
90
80
%
Buildings
70
60
50
40
30
20
100_105
Energy (kWh/sqm)
95_100
90_95
85_90
80_85
75_80
70_75
65_70
60_65
55_60
50_55
45_50
40_45
35_40
30_35
D
25_30
20_25
C
15_20
Β
10_15
Α
5_10
0
0_5
10
Figure 10. Graph concerning to Hotels without insulation during Cooling period.
Hotels – Heating period
(with Insulation)
100
90
80
%
Buildings
70
60
50
40
30
Energy (kWh/sqm)
Figure 11. Graph concerning to Hotels with insulation during Heating period.
35
440_445
420_425
400_405
380_385
360_365
340_345
320_325
300_305
280_285
260_265
240_245
220_225
200_205
D
180_185
160_165
C
140_145
100_105
Β
80_85
60_65
40_45
20_25
Α
0_5
0
120_125
20
10
Chapter 4 – Energy Classification based on European Standard
Hotels – Heating period
(without Insulation)
100
90
80
%
Buildings
70
60
50
40
30
20
660_665
630_635
600_605
570_575
540_545
510_515
480_485
450_455
420_425
390_395
360_365
330_335
300_305
270_275
240_245
210_215
D
180_185
90_95
60_65
30_35
C
150_155
Β
Α
0_5
0
120_125
10
Energy (kWh/sqm)
Figure 12. Graph concerning to Hotels without insulation during Heating period.
Schools – Cooling period
100
90
70
60
50
40
30
20
Energy (kWh/sqm)
Figure 13. Graph concerning to Schools during Cooling period.
36
180_185
170_175
160_165
150_155
140_145
130_135
120_125
110_115
100_105
90_95
80_85
70_75
D
60_65
40_45
50_55
C
Β
30_35
Α
10_15
0
20_25
10
0_5
%
Buildings
80
Chapter 4 – Energy Classification based on European Standard
Schools – Heating period
(with Insulation)
100
90
%
Buildings
80
70
60
50
40
30
20
Energy (kWh/sqm)
Figure 14. Graph concerning to Schools with insulation during Heating period.
Figure 15. Graph concerning to Schools without insulation during Heating period.
37
190_195
180_185
170_175
160_165
150_155
140_145
130_135
110_115
100_105
90_95
80_85
70_75
60_65
50_55
120_125
D
C
Β
40_45
20_25
10_15
Α
0_5
0
30_35
10
Chapter 4 – Energy Classification based on European Standard
Type of
Heating Period ( KWh / m 2 )
Cooling Period ( KWh / m 2 )
Building
Insulation
No Insulation
Insulation
No Insulation
Offices
56
67
15
24
Shops
66
50
14
45
Hotels
138
139
12
12
Schools
42
58
32
32
Table 1. Values of the reference parameter Rs.
38
Chapter 5 – Description of the Platform
Chapter 5 – Description of the Platform
The flowchart that describes the efficiency and the main operations of the
application software is presented below:
Figure 1. Application flowchart
39
Chapter 5 – Description of the Platform
When a user decides to use the Java application, user settings, such as
username and password, are required in order to log in to the main menu. When the
insertion of the settings is successful then the Main Menu form appears. From the
Main Menu the user can choose each of the option he/she desires. The two options
are: Building Data form and Energy Classification. The first form concerns data and
information of the building of interest and the other one helps the calculation of the
class of the building and the extraction of the results. When the user chooses Building
Data application then he/she has two options. The first one, which is named Building
Process, is referred to the insertion, deletion or update of data for the specific building
or zone. By choosing any of these processes changes may occur to the database. Each
change of the data updates the corresponding table of the database system.
The second one, which is named Energy Rating Methods, presents the
methods that are used for the classification. Measured method requires data that either
have been taken for three or more years or have been taken for less than three years.
This method uses electrical, gas or oil bills of the building while data for lighting and
appliances are required as well. The other method, named Calculation Method,
requires data coming from the climatic conditions of the location where the specific
building exists. Climatic conditions concern to heating or cooling degree – days and
the hours of sunlight that are prevailed to the specific location. Both methods’ data are
stored in the corresponding tables of the database system.
Energy Classification process acts reversely from the other ones. This means
that this procedure uses the stored data and calculates the results. This procedure is
responsible for the building’s classification. When the Measured method is used, the
procedure identifies whether given data are referred to more than three years measures
or not. If data for an assessment period of three years occur then an Energy
Performance Indicator is calculated and according to its value the corresponding class
of the building arises. If data measures are referred to less than three years then a
weather correction procedure starts and the corresponding energyware is calculated.
Its value defines the class of the building. In case of the Calculated method, Energy
Classification procedure checks if the proper data exist. Anyway, whatever method is
used, the results are presented either in graphical form or in a report. Graphical form
is constituted by a set of graphs, which indicate the class of the building and the
values of the corresponding energywares. On the other hand, the report constitutes a
presentation including the graphical results and the calculated parameters.
40
Chapter 5 – Description of the Platform
5.1 – Database System
5.1.1 Generally
This application manages large amounts of data, hence the existence of a
reliable storing system is necessary. This system must provide a faster and more
convenient way of retrieving data as well. These data are responsible for the proper
functionality of the application and are used for the evaluation of a building (e.g class
definition) and the calculation of the normalized values of energy consumption.
However, this application has been developed in Java programming language. So, this
storing system must communicate with the programming language without any
problem while its greatest advantage, is that the database system is incorporated to the
Java application. The solution of this requirement is the implementation of an
embedded database system.
The database scheme (ER diagram, see below) has been developed using
JavaDB tool offered by Java Netbeans interface. The use of this JavaDB tool provides
the proper connection between the Java application and the database system, while
this connection is achieved easier than using any other programming languages like
SQL or Oracle. SQL and Oracle programming languages may require more
complicated software codes in order that the connection can be achieved.
This method of implementation was preferred against storing data into files.
File processing may cause some difficulties. The first difficulty concerns the total
number of the files used. This difficulty concerns the fact that each file should
represent the corresponding table of the ER scheme. Hence, files should be used in
order to store the data. The second difficulty is described from the size of a file –
table. When new data are stored in a file then its size is getting larger. This is a
problem since the first thought of implementing this application is not to occupy a
large amount of the hard disk. And, finally, when an application has to process files
then the proper software code, that processes the files, must exist. This makes the
application more complicated and slower, since the data retrieving from files may
take long time than the retrieving using JavaDB database system.
41
Chapter 5 – Description of the Platform
5.1.2 ER Diagram
The following image presents the ER diagram which describes the formation
of the database system (Ramakrishnan & Gehrke 2000).
SimplifiedRatingMethod
Users
PK
PK
Username
sbid
sMethod
sAnnualH
sSunH
sMSunH
sAnnualC
sSunC
sMSunC
sNormQH
sNormQC
sCategoryH
sCategoryC
Password
1
SEMBuildings
Zones
PK
N
Zon
esB
uild
ing
s
zid
zDescription
zFrom
zTo
zCO2
zHum
zMRT
zTemp
zLux
gs
in
ld
ui
N
bCategory
bDescritpion
bSurface
bFloors
bAddress
bInsulation
bAC
bNB
bTout
M
1
s
ing
ild
tBu
h
Lig
cB
Lighting
PK
light_id
ltype
lconsumption
lhours
DE
MB
uild
ing
s
M
Lo
1
bid
N
DetailedRatingMethod
lid
lB u
s
ing
ild
lBu
pp
BA
ild
in g
s
lname
DDheat
DDcool
latitude
PK
PK
Ap
p
PK
Buildings
PK
N
Locations
1
1
N
Appliances
PK
N
aid
BuildAppliances
aconsumption
atype
PK
baid
baconsumption
batype
Figure 2. ER diagram
42
dbid
dEnergyYear
dApplMethod
dApplCons
dLightMethod
dLightCons
dSepBill
dSepOil
dSepGas
dSepElCon
dSepOilCon
dSepGasCon
dOilFurnace
dGasFurnace
dOutFile
Chapter 5 – Description of the Platform
5.1.3 Explanation of the Relationships
After presenting the ER diagram and the Relational Scheme (see Appendix G)
of the database system, the analysis of the relations between the tables is:
-
The relationship between Buildings and Zones is 1:N as each building can
contain one or more than one zones.
-
The relationship between Buildings and ZonesBuildings is partial because it is
not necessary for a building to have any zone(s).
-
The relationship between Zones and ZonesBuildings is total because a zone
must belong to a building.
-
The relationship between Buildings and Appliances is M:N as each building
can contain one or more appliances and an appliance can be contained in more
than one buildings.
-
The relationship between Buildings and Lighting is M:N since a building can
contain more than one lighting devices and a lighting device can be contained
in more than one buildings.
-
The relationship between Buildings and BuildAppliances is M:N as each
building can contain one or more than one of this type of appliances and such
appliances can be contained in more than one buildings.
-
The relationship between Locations and Buildings is 1:N since there might be
more than one buildings in a location, but a specific building is located in a
specific location.
-
The relationship between Buildings and Locations is total because a building
must be located in a location.
-
The relationship between Buildings and SimplifiedEnergyMethod is 1:1 since
a specific building can be evaluated only once by using CSI and Degree – days
methods.
-
The relationship between SEMBuildings and SimplifiedRatingMethod is total
since the existence of such a certificate depends on the existence of a building.
-
The relationship between Buildings – DetailedEnergyMethod is 1:N. This
means that a building can be evaluated by many energy certificates but a
specific energy certificate is assigned to a specific building. Moreover, the
43
Chapter 5 – Description of the Platform
relationship between DetailedRatingMethod and DEMBuildings is total since
this method can be used only when a building exists.
5.1.4 Presentation and Analysis of the tables
Buildings:
-
bid: is an integer number and the primary key of the table. It
indicates the number of a building and the corresponding record.
-
bdescription: is an attribute in string format and indicates a short
description of the building.
-
bcategory: is an attribute in string format and presents the category
of the building (shop, office, hotel and school).
-
blocation: is referred to the location where the corresponding
building exists.
-
bAddress: keeps information about the place that a building exists.
-
bArea: is a double number concerning the area in m 2 .
-
bFloor: is an integer number informing about the number of the
floors in a building.
-
bInsulation: is an integer flag taking 1 or 0 values. When this
attribute is equal to 1, this means that the building’s walls contain
insulation materials. Otherwise, the walls do not contain insulation
material.
-
bConditioned: is also an integer flag taking 1 or 0 values. Value 1
indicates that the building has air – conditioning devices, otherwise
it does not.
-
bNewBuilding: is a flag with values 1 or 0. Value 1 indicates that
the building is a new building, otherwise it is not.
44
Chapter 5 – Description of the Platform
Zones:
-
zid: is an integer number and the primary key of the table referring
to the number of records and the id of the zone.
-
zDescription: is a string attribute referring to a short description of
the building.
-
zFrom: indicates the time when users start using the building.
-
zTo: indicates the time that users stop using the building.
-
username: is a string attribute keeping the username of the user.
-
password: string attribute referring to the password.
-
Userid: is an integer number and the primary key of the table that
User:
indicates the number of the record.
Locations:
-
lname: indicates the name of the location.
-
DDheat: is a double number that keeps the value of the heating
degree – days of the specific location.
-
DDcool: is a double number that keeps the value of cooling degree
– days.
-
Lid: integer number and the primary key of the table.
-
Latitude: presents the latitude of the Greek location.
45
Chapter 5 – Description of the Platform
Appliances:
-
applID: is the primary key of the table referring to the number of
the record.
-
Description: provides a short description of the corresponding
appliance.
-
applWatts: is a double number and presents the energy
consumption of the appliance.
BuildAppliances:
-
baid: primary key of the table.
-
baconsumption: is a double number referring to the consumption
in watts for a specific equipment.
-
batype: is a string referring to the type of the equipment.
Lighting:
-
light_id: is an integer number and the primary key of the table.
-
lconsumption: is a double number referring to the consumption in
watts for a specific lighting device.
-
ltype: is a string referring to the type of the lighting device.
-
lhours: keeps the total hours that a lighting device is used.
The above analysis is referred to the tables joining ER diagram. In Appendix
G,
the
relational
DetailedRatingMethod
scheme
and
is
presented
as
SimplifiedRatingMethod
well.
keep
Furthermore,
all the
tables
necessary
information about the energy certificates and the method of energy classification that
was used which took place for a specific building.
46
Chapter 6 – Case Study and Results
Chapter 6 – Case Study and Results
6.1 Generally
In this chapter, a short presentation of the building under study, is presented
along with the results extracted after applying energy classification methods. The
building, which is classified, is the laboratory of Electric Circuits and Renewable
Energy Sources (ECRESL) and it is constituted by two zones. The first zone is the
ground floor and the second zone refers to the first floor of the lab. The ground floor
is the main lab space and the first floor contains office staff. Both zones are going to
be classified separately. The methodology used for energy classification of both zones
is based on the European prEN standard 15217:2006 including methodology without
weather correction. Measured data refer to the years 2005, 2006 and 2007.
6.2 Ground Floor
This floor accommodates three different labs: Electronic and Electric Circuits
and Sensors. The following table presents all the devices, along with their
consumptions, used for lab experiments.
Laboratory of Electronic and Sensors Circuits
Devices
Quantity
Power Consumption (W)
Oscilloscope (HM1005)
11
43
Multi – meter (HM8011)
11
4.5
Triple Power Supply
11
95
11
9.8
4
350
Monitors
4
80
UPS Xpower μnet
2
500
(HM8040)
Function Generator
(HM8030)
Personal Computer
Tower
Table 1. Devices, including their consumptions for Electronic and Sensors Circuit laboratory
47
Chapter 6 – Case Study and Results
Laboratory of Electric Circuits
Devices
Quantity
Power Consumption (W)
Oscilloscope
11
37
Multi – meter
11
4.5
Triple Power Supply
11
160
Function Generator
11
20
Table 2. Devices, including their consumptions, for Electric Circuits laboratory
Furthermore, the lab contains a large air – conditioned device with power
consumption equal to 7kW along with 12 Fluorescence lambs of 25W each.
6.3 1st Floor
This floor contains office staff of the lab. It’s a single space so it is considered
as one zone. The following table presents all the devices used in the office along with
their consumptions.
1st Floor of ECRESL
Devices
Quantity
Power Consumption (W)
Personal Computer –
4
450
Monitors
4
75
Air – conditioned device
3
800
UPS system
3
500
Printer
2
180
Fax Machine
1
100
Tower
Table 3. Devices which are included in the 1st floor of ECRESL
48
Chapter 6 – Case Study and Results
6.4 Experimental Results
6.4.1 Energy Class and Results of Ground floor
The data used for the classification, have been measured for three years (2005,
2006 and 2007). The classification procedure took into account both periods under
study (heating and cooling). The following table presents overall energy
consumptions per year including consumptions for lighting and equipment devices.
2005( KWh / year )
2006( KWh / year )
2007( KWh / year )
Equipment
5232.45
5132.45
5132.45
Lighting devices
633.6
633.6
633.6
Heating
514.24
536.16
544.06
Cooling
1721.66
285.6
285.83
Table 4. Consumptions per heating and cooling periods.
The following table presents the values of the Energy Performance indicator for both
periods using regulation reference parameter equal to 24 kW / m 2 and the stock
reference parameter equal to 65 kW / m 2 for heating period and 12.5 kW / m 2 for
cooling period, respectively.
EP indicator
Heating Period
Cooling Period
( KWh / m 2 )
( KWh / m 2 )
26.22
32.63
Table 5. Values of EP indicator
The Energy Classification procedure was based on the methodology not including
weather correction, since data have been measured for three years. So, it takes into
account the values of EP indicator for both periods and the energy consumptions
referring to lighting devices, equipment and heating/cooling devices. After
completing evaluation the results that arise, for 2005, 2006 and 2007 years, are
presented by the following figures.
49
Chapter 6 – Case Study and Results
Figure 1. Consumptions for heating for 2005
Figure 2. Consumptions for cooling for 2005
50
Chapter 6 – Case Study and Results
Figure 3. Consumptions for heating for 2006
Figure 4. Consumptions for cooling for 2006
51
Chapter 6 – Case Study and Results
Figure 5. Consumptions for heating for 2007
Figure 6. Consumptions for cooling for 2007
52
Chapter 6 – Case Study and Results
Figure 7. Class of the building for heating
Figure 8. Class of the building for cooling
53
Chapter 6 – Case Study and Results
6.4.2 Energy Class and Results for 1st floor
In the 1st floor of the laboratory four offices are placed. Each office has its
own equipment such as personal computer, printer, fax machine, etc. The application
calculates energy consumptions based on equipment, lighting devices and
heating/cooling devices, separately. Similarly tot the ground floor, there are data that
have been measured for three years. This means that energy classification was
achieved by using the methodology not including weather correction. Also, the energy
performance indicator is calculated from the given data.
The following table presents overall energy consumptions per year including
consumptions for lighting and equipment devices
2005( KWh / year )
2006( KWh / year )
2007( KWh / year )
Equipment
11064.3
11064.24
11064.24
Lighting devices
633.6
633.6
633.6
Heating
2507.97
2891.65
891.18
Cooling
1493.45
1614.26
1819.59
Table 6. Overall energy consumption for the 1st floor
The following table presents the values of EP indicator for heating and
cooling.
EP indicator
Heating Period
Cooling Period
( KWh / m 2 )
( KWh / m 2 )
64.55
62.43
Table 7. Values of EP indicator for heating and cooling periods
The values for Regulation reference and stock building reference parameters are the
same to those used for the ground floor. The following figures present the results of
the energy classification and the class of the 1st floor for both periods under study.
54
Chapter 6 – Case Study and Results
Figure 9. Consumptions for heating for 2005
Figure 10. Consumptions for cooling for 2005
55
Chapter 6 – Case Study and Results
Figure 11. Consumptions for heating for 2006
Figure 12. Consumptions for cooling for 2006
56
Chapter 6 – Case Study and Results
Figure 13. Consumptions for heating for 2007
Figure 14. Consumptions for cooling for 2007
57
Chapter 6 – Case Study and Results
Figure 15. Building class for heating period
Figure 16. Building class for cooling period
58
Chapter 7 – Conclusions and Future Work
Chapter 7 – Conclusions and Future Work
7.1 Generally
This chapter presents useful conclusions referring to the analysis of the results
of the ground floor and the 1st floor of the laboratory. Also, several additional
operations are presented, in order to improve the performance of Java application
platform. Although, the analysis of the results for the 1st and the ground floor are
presented separately, it is essential to be pointed out that, regulation reference
parameter ( Rr ) was considered equal to 24 kWh / m 2 for both cases. The value of the
Regulation reference parameter is not provided by the Greek energy policy and it
concerns the mean value for energy policy in Italy per year.
7.2 Analysis of results for the 1st Floor
The classification methodology used for the 1st floor of the laboratory is
defined by prEN European standard 15217:2006. For the specific building, only the
Measured method was applied, since there was no proper data (such as maximum
hours of sunlight) in order for climatic conditions methodology to be used. So,
measured data refer to a three – year period: 2005, 2006 and 2007. This means that,
the method used for the classification is based on the calculation of the Energy
performance indicator not including weather correction.
However, by studying all pie charts for both periods, the conclusion, which
arises, is that 1st floor’s energy consumption for heating and cooling depends
exclusively on electricity, as gas and oil percentages are equal to 0. In this case, data
were taken from electrical bills concerning lighting devices, the equipment of the
office and air – conditioning devices. Furthermore, the energy consumption which is
stated in the electrical bills derives from various devices, after considering that the
office was occupied by the staff of the laboratory, for 8 hours per day (from 09:00am
to 17:00pm).
After the assumption that the office’s equipment does not change during the
assessment period, the energy consumption referring to the equipment has the same
value during the 3 – year period. Along with equipment, the percentages of lighting,
during assessment period, are the same as well. On the contrary, several changes have
occurred in the case of air- conditioning devices for heating and cooling. These
changes may occur because of the unstable climatic conditions sustained in the
59
Chapter 7 – Conclusions and Future Work
location of Chania. The term «unstable» refers to the case when warm climatic
conditions occurred, during heating period and quite cold conditions occurred during
cooling period and reversely.
Finally, figures 15 and 16 present the classes of the 1st floor for heating and
cooling periods. In the case of heating period, the building belongs to D class. This
energy classification is satisfying despite the fact that the roof of the floor is
constructed by Plexiglas material. So, the roof has no insulation and the contact
between warm and cold air masses is direct. For cooling period, the building belongs
to G class which presents the lowest barrier of the classes, since cold air masses,
afforded by air – conditioning devices, will not occur few hours after the devices stop
functioning.
7.3 Analysis of results for Ground Floor
The walls of this floor do not contain insulation material and a large
percentage of them is covered by windows. This floor is the main space of the
laboratory. It is used for three times per week and four weeks per month. Similarly to
the 1st floor, the method used for energy classification is the one not including
weather correction. However, Climate Severity Index and Degree – days methods are
not used as well, since there are no data available, such as maximum hours of
sunlight. Naturally, the analysis includes pie charts for both periods.
Analyzing these pie charts for heating and cooling periods, it is easy to realize
that the percentage of lighting for the whole period of 3 years does not modify. On the
other hand, it is essential to point out that the percentage of the lab’s equipment varies
according to the use. That is, the percentage of the equipment during heating period
differs from this during cooling period. Actually, equipment’s energy consumption
per day depends on the hours where the lab is used by occupants. The lab is used four
hours additionally per week, during heating period than during cooling period. In any
case, the energy consumption for both periods is equal to a mean value by dividing
the total lab’s devices consumption to the total hours of use. Furthermore, a large air –
conditioning device is used for heating and cooling demands. The percentages
60
Chapter 7 – Conclusions and Future Work
referring to heating and cooling respectively, varies according to the climatic
conditions of the location.
Similarly to the 1st floor, data are collected by electrical bills and this explains
why the percentages of gas and oil are negligible. Moreover, by studying figures 8
and 9, the class of the building during heating period is C and the class during cooling
is F. This means that, the building stores warm air masses, which are provided by the
air – conditioning devices, during heating period, against its behavior during cooling
period.
7.4 Future Work
Despite the fact that the Java software platform takes into account large
amounts of data and uses them without any difficulty, there are several possibilities
which are not covered by the application. One of the functionalities, which will be
added to the platform, is environmental classification methodologies based on
European standards or other methodologies. The extension of the platform by running
environmental procedures as well makes the existing application more completed.
In addition, Renewable Energy Sources tab in the interface, in which energy
classification takes place, would be developed by adding operations and data
collecting systems in the case where a building uses renewable energy sources.
Furthermore, in the specific platform, each floor of a new building is discerned by one
zone, which in reality does not exist. A new improved version of the application
would be to take into account more than one zones of the building. Moreover, in State
of the Art chapter, three applications for energy rating were presented. One of them
was developed by using a 3D application developer. Naturally, the software used is
different to Java programming language. Despite this fact, there are 3D Java libraries
providing 3D interfaces. By using them a building simulation platform may be
developed.
61
References
References
[1]
[2]
[3]
[4]
[5]
[6]
[7]
[8]
[9]
[10]
[11]
[12]
[13]
[14]
[15]
[16]
[17]
CEN Members, 2006, ‘Energy performance of buildings – Methods for
expressing energy performance and for energy certification of buildings’, GTR
Work
CEN Members, 2006, ‘Energy performance of buildings – Overall energy use,
CO2 emissions and definition of energy ratings’,
Patxi Hernadez, Kevin Burke, J. Owen Lewis, 2007, ‘Development of energy
performance benchmarks and building energy ratings for non-domestic
buildings: An example for Irish primary schools’, University College Dublin,
Dublin
E. Shaviv, A. Yezioro, I.G. Capeluto, 2007, ‘Energy code for Office Buildings
in Israel’ , Technion – Israel Institute of Technology, Haifa
Lamberto Tronchin, Kristian Fabbri, 2007, ‘Energy performance building
evaluation in Mediterranean countries: Comparison between software
simulations and operating rating simulation’, University of Bologna, Bologna
Jan F. Kreider, Peter S. Curtiss, Ari Rabl, ‘Heating and Cooling of Buildings
Design for Efficiency, Second Edition’, The McGraw-Hill Companies, Inc
2002 ISBN 0-7-07-237341-5
Raghu Ramakrishnan, Johannes Gehrke, 2000, ‘Database Management
Systems Volume A (2nd Edition))’, The McGraw-Hill Companies,
Raghu Ramakrishnan, Johannes Gehrke, 2000, ‘Database Management
Systems Volume B (2nd Edition)’, The McGraw-Hill Companies,
Apache Software Foundation, 2008,’Java DB Developer's Guide Version 10.4’,
Sun Microsystems, Inc.
Apache Software Foundation, 2008,’Java DB Reference Manual Version 10.4’,
Sun Microsystems, Inc.
Apache Software Foundation, 2008, ‘Getting Started with Derby Version 10.4’,
The Apache Software Foundation.
Jonathan Knudsen, Patrick Niemeyer, 2005, ‘Learning Java 3rd Edition’,
Cay S. Horstmann, Gary Cornell, 2001, ‘Core Java TM 2: Volume II Advanced
Features’, Prentice Hall
David Gilbert, 2007, ‘The JFreeChart Class Library Version 1.0.4 Developer
Guide’, Object Refinery Limited
David R. Heffelfinger, 2006, ‘JasperReports for Java Developers
Create,
Design, Format, and Export Reports with the World's Most Popular Java
Reporting Library’
David Faour, 2001, ‘Database Normalization’ [On-line]
http://www.serverwatch.com/tutorials/article.php/1549781
Greg Hendricks, 2001, ‘Database Normalization’ [On-line]
http://www.devhood.com/tutorials/tutorial_details.aspx?tutorial_id=95
[18] National Instruments, 2000, ‘NI – DAQ User Manual for PC Compatibles’, part
number 321644G – 01
[19] National Instruments, 1998, ‘NI – DAQ Function Reference Manual for PC
Compatibles, part number 321645D – 01
[20] e – Building Energy Classification Manual
62
Appendix A
Appendix A
A.1 Energy Classification using Calculated Method
A.1.1 Climate Severity Index and Degree – days Methods analysis
In this appendix, the functionality and the use of energy classification using
Climate Severity Index and Degree – days methods are described. In figure 1, the
application – interface used for the classification of a building using CSI method, is
presented.
Figure 1. Interface using CSI method for Energy Classification
A user must take into consideration a certain number of inputs which vary
depending on the period of year (heating or cooling). First of all, the interface
provides information about a building which is going to be classified.
This
information concerns the location, the type of the building, the presence or absence of
insulation and the heating and cooling degree – days of the specific location. It also
63
Appendix A
offers the possibility of choosing the desired method for classification. There are two
options: C.S.I. or Degree – days method. For C.S.I. methodology the input data
concern Annual Consumption and Real Sunlight hours which vary for each period.
On the contrary, Degree – days method (see figure 2) uses only the Annual
Consumptions for both periods of study.
The classification (in both methods) is achieved by calculating the normalized
form of energy consumption. The calculation process begins by pressing a button
named Calculate Consumption. Resulted information about the building, such as the
classification method used, the value of the normalized energy consumption and the
class of the building, for each period of year, is presented in a text field. By using
button, named Save Data, all the proper information is stored in the corresponding
table of a database system, so that the user can retrieve data for a specific building at
any time (changing or checking the calculations).
Figure 2. Interface using Degree – days method for Energy Classification
64
Appendix A
A.1.2 Explanation of Building’s Data
Classifying a building using CSI or Degree – days methods demands the
knowledge of certain and appropriate information.
-
Annual heating or cooling energy consumption: defines the energy
a building consumes for heating or cooling, respectively. This
parameter used for normalization is defined by the user.
-
Real Sunlight hours: this input parameter defines the total number
of sunlight hours of a location.
-
Max Latitude Sunlight hours: total number of hours of sunlight
according to a location’s latitude.
-
Heating and Cooling Degree – days: are calculated by using Greek
temperature base (19 0 C ) and external temperature measurements.
Latitude sunlight hours and Heating/Cooling degree – days are stored
in a database’s table.
65
Appendix B
Appendix B
B.1 Energy Classification using Measured Method
This method is more analytical than the Calculated Method (see Appendix A),
since it takes into account electrical, oil or gas bills presenting a building’s energy
consumptions precisely. The figures, below, present the miscellaneous interfaces used
for the energy classification by using Measured method.
B.1.1 Heating Consumption Calculation
Figure 1. Interface used for the calculation of heating needs
The specific method takes into account four ways of energy consumption:
Heating, Cooling, Lighting and Appliances. Energy consumption for heating can be
achieved by using electricity, oil or gas. This consumption concerns the range of
months from September to February. The user must fill all the required fields in case
of classifying the specific building. The units of energy consumption by using
66
Appendix B
electricity, oil or gas are KWh and lt respectively. In case that a building is supplied
with oil and gas, the oil and gas furnace types must be selected as well. Since bills
provide overall information about a building’s consumption, energy consumption
used for lighting and appliances must be calculated first. Removing these two
consumptions the remaining value defines the consumption caused by electricity for
heating and cooling needs. Calculate button executes an algorithm which evaluates
electrical, oil and gas heating consumptions.
B.1.2 Cooling Consumption Calculation
Figure 2. Interface used for the calculation of cooling needs
In case of cooling period, a building’s energy consumption for cooling is
calculated. In Greece, cooling needs are provided, wholly, by electricity. The
calculation procedure for cooling energy consumption is similar to the procedure
described in heating tab. There is a message in red, informing the user that the
calculations of lighting and appliances consumptions must precede. After that, the
user gives inputs concerning the cooling consumptions per month. Calculate button
begins a process which calculates the corresponding energy consumption per month.
67
Appendix B
B.1.3 Lighting Consumption Calculation
Figure 3. Interface used for the calculation of lighting consumptions
The energy need for lighting can be calculated by selecting one of the two
options offered. Calculated Method is the default option for this application.
Calculating energy needs using this method, requires a certain number of a building’s
lamps including their power value in watts, the total hours of usage and the number of
lamps available for the specific type. At the right side of the interface, there is a list
which is filled by records describing the available lamps of a building.
The other method is named Measurements and requires the existence of a
file, stored by a Building Energy Management System, containing data with lighting
consumptions. The file contains hourly records, which refer to the time and the date of
the record and the total consumption in watts.
Insert button, enters a new lamp type into the list (right side) and Delete
button removes from the list a selected record. Each lamp insertion updates a table
named Lighting which stores the proper information for lamps. Calculate
Consumption button calculates energy needs for lighting for both periods of study.
The execution algorithm, which begins when the button is pressed, depends on the
selected method. In case of the Measurements method the algorithm runs through a
68
Appendix B
file summing all the consumptions for the available lamps. When Calculated Method
is selected, the algorithm runs through the table Lighting and sums all the lighting
consumptions available for the specific building.
B.1.4 Appliances Consumption Calculation
Figure 4. Interface used for the calculation of appliances’ consumptions
Similarly to lighting interface, the appliances’ energy consumption can be
calculated by using two different methods. The method named Calculate from the
table, runs through the table, on the left side, and calculates the consumptions of each
partial appliance which exists in the specific building. On the other hand, the method
named I know the daily consumption is activated when the user knows the total
energy consumption for all the appliances. In both cases the result is referred to a text
field and concerns the daily energy consumption for the appliances.
69
Appendix B
B.1.5 Outdoor Temperature File
Figure 5. Additional information required for weather correction
The operation which is presented in the image above is used when a weather
correction procedure must begin. This operation refers to the energy classification
based on Measured method and when the assessment period concerns less than three
years. In this case, the interface loads a file of the outdoor temperature for the specific
location and for the current year.
70
Appendix C
Appendix C
C.1 Communication between Sensors and a Personal Computer
A Building Energy Management System (BEMS) constitutes a convenient
way of controlling and monitoring environmental data which come from sensors.
These sensors, which are placed either in internal or external environment of a
building, communicate with BEMS. By using this system makes the control of
reliable and accurate but few buildings use such a system in Greece. An alternative
way of monitoring and processing data is offered by Nidaq Measurements Company
which designs electronic cards that are connected directly to the personal computer
(National Instruments 2000, 1998). In this case the sensors are connected to an
external interface and this is connected to the card. After that and using proper
software everyone can process and use environmental data. This appendix presents
such communication system.
C.1.1 Use of Java Native Interface
All necessary functions, described before, for reading an analogue voltage
value from a PCI card output are contained in an existing native library, nidaq32.lib.
This library comes with the drivers of the PCI card and is implemented in C language.
In order to get access to this native library, from the java code, we use the java native
interface which allows Java applications to invoke native code and vice versa. The process
of writing native methods that allow Java applications to call functions implemented in native
libraries is described in the next chapter.
C.1.2 Java Native Interface (JNI)
C.1.2.1 Java Platform and Host Environment
The Java platform is a programming environment consisting of the Java
virtual machine (VM) and the Java Application Programming Interface (API). Java
applications are written in the Java programming language, and compiled into a
machine-independent binary class format. A class can be executed on any Java virtual
machine implementation. The Java API consists of a set of predefined classes. Any
71
Appendix C
implementation of the Java platform is guaranteed to support the Java programming
language, virtual machine, and API.
The term host environment represents the host operating system, a set of
native libraries, and the CPU instruction set. Native applications are written in native
programming languages such as C and C++, compiled into host-specific binary code,
and linked with native libraries. Native applications and native libraries are typically
dependent on a particular host environment. A C application built for one operating
system, for example, typically does not work on other operating systems.
Java platforms are commonly deployed on top of a host environment. For
example, the Java Runtime Environment (JRE) supports the Java platform on existing
operating systems such as Solaris, Linux and Windows. The Java platform offers a set
of features that applications can rely on independent of the underlying host
environment.
C.1.2.2 The Role of JNI
When the Java platform is deployed on top of host environments, it may
become desirable or necessary to allow Java applications to work closely with native
code written in other languages. The JNI is a powerful feature that allows us to take
advantage of the Java platform, but still utilize code written in other languages. As a
part of the Java virtual machine implementation, the JNI is a two-way interface that
allows Java applications to invoke native code and vice versa.
Figure 1. Role of JNI
The JNI is designed to handle situations where we need to combine Java
applications with native code. As a two-way interface, the JNI can support two types
of native code: native libraries(our case) and native applications.
·
We can use the JNI to write native methods that allow Java
applications to call functions implemented in native libraries. Java
72
Appendix C
applications call native methods in the same way that they call
methods implemented in the Java programming language. Behind the
scenes, however, native methods are implemented in another language
and reside in native libraries.
·
The JNI supports an invocation interface that allows us to embed a
Java virtual machine implementation into native applications. Native
applications can link with a native library that implements the Java
virtual machine, and then use the invocation interface to execute
software components written in the Java programming language.
C.1.2.3 Implications of Using the JNI
Once an application uses JNI, it takes the risk of loosing two benefits of the
Java platform.
·
First, Java applications that depend on the JNI can no longer readily
run on multiple host environments.
·
Second, while the Java programming language is type-safe and secure,
native languages such as C or C++ are not. A misbehaving native
method can corrupt the entire application.
C.1.2.4 Using JNI based on our application
In our Java application we need to call NIDAQ functions, implemented in C,
in order to read a value from an analogue PCI card output. The process consists of the
following steps:
1. Creation of the class NIDAQConnector.java that declares the native
method.
2. Compilation of the NIDAQConnector source file, resulting in the class
file NIDAQConnector.class.
3. Generation of the C header file (NidaqAinput.h) containing the
function prototype for the native method implementation. For the
generation of the header file we use the javah tool provided with JDK
releases.
4. Writing the C implementation (nidaqdllAinpt.c) of the native method.
5. Compilation of the C implementation into a native library, creating
NIDAQdll.dll.
73
Appendix C
6. Running the java application using the java runtime interpreter. Both
the class file (NIDAQConnector.class) and the native library
(NIDAQdll.dll) are loaded at runtime.
Figure # illustrates the pre described process.
Figure 2. Steps in writing JNI method
74
Appendix C
C.1.2.5 Declare the native method
In our program the class named NIDAQConector contains the native method
NIDAQ_AInput(short ch,short gn).
public class NIDAQConnector {
public NIDAQConnector() {}
public double returnvoltage(short channel, short gain){
double voltage;
voltage = NIDAQ_AInput(channel,gain); NATIVE FUNCTION
return voltage;
}
private native double NIDAQ_AInput(short ch,short gn) ; NATIVE METHOD
static {System.loadNIDAQdll.dll");}
}
The NIDAQConector class definition begins with the declaration of a function
(returnvoltage) that calls the native method in order to return the voltage
measurements. This is followed by the declaration of the native method. The last part
of the class definition is a static initializer that loads the native library containing the
implementation of the NIDAQ_AInput native method. Before the native method can
be called, the native library that implements NIDAQ_AInput must be loaded. In this
case, we load the native library in the static initializer of the NIDAQConector class.
The Java virtual machine automatically runs the static initializer before invoking any
methods in the NIDAQConector class, thus ensuring that the native library is loaded
before the NIDAQ_AInput native method is called.
C.1.2.6 Compile the NIDAQConector class
After the definition of the NIDAQConector class, we save the source code in a
file called NIDAQConector.java. Then we compile the source code file and the result
is the generation of NIDAQConector.class file.
C.1.2.7 Create the native method header file
Afterwards we use the javah tool to generate a JNI-style header file, useful to
implement the native method in C. The most important part of the header file is the
function prototype for
75
Appendix C
Java_NDMeasurements_NIDAQConnector_NIDAQ_1AInput, which is the C function
that implements the NIDAQConnector.NIDAQ_1AInput method:
JNIEXPORT jdouble JNICALL Java_NDMeasurements_NIDAQConnector_NIDAQ_1AInput
(JNIEnv *, jobject, jshort, jshort);
The first argument of the native method implementation is a JNIEnv interface pointer.
The second argument is a reference to the NIDAQConnector object itself. The two
last arguments are the arguments of the native method declared in the java file
(function’s inputs).
C.1.2.8 Write the Native Method Implementation and Create the Native Library
For the C implementation of the native method we used Microsoft Visual
Studio 6. The function follows the prototype specified in the generated header file.
The C file nidaqdllAinpt.c contains the implementation of NIDAQConnector.
NIDAQ_1AInput as follows (National Instruments 1998):
#include <jni.h>
#include <stdio.h>
#include "NidaqAInput.h"
#include "nidaqex.h"
JNIEXPORT jdouble JNICALL Java_NDMeasurements_NIDAQConnector_NIDAQ_1AInput
(JNIEnv * env, jobject thisobject, jshort channel, jshort gain){
i16 iStatus = 0;
i16 iRetVal = 0;
i16 iDevice = 1;
i16 iChan = channel;
i16 iGain = gain;
f64 dVoltage = 0.0;
i16 iIgnoreWarning = 0;
iStatus = AI_VRead(iDevice, iChan, iGain, &dVoltage);
iRetVal = NIDAQErrorHandler(iStatus, "AI_VRead", iIgnoreWarning);
if (iStatus == 0) {
return(dVoltage);
}
}
76
Appendix C
The implementation of this native method uses the NIDAQ AI_VRead() function to
read the analogue channel iChan and returns the voltage value according to the gain
iGain. The C program includes four header files:
·
jni.h - This header file provides information the native code needs to
call JNI functions.
·
NidaqAInput.h - The header file that we generated using javah. It
includes
the
C/C++
prototype
for
the
NDMeasurements_NIDAQConnector_NIDAQ_1AInput function.
·
nidaqex.h - This header file provides all information for the NIDAQ
functions we use and it comes with the PCI card drivers.
·
stdio.h - This library provides all the input/output operations for C/C++
Now that all the necessary C code is written, we compile nidaqdllAinpt.c and build
the native library. We generated a dynamic link library (DLL) NIDAQdll using the
Microsoft Visual C++ compiler.
C.2 Measurement Java platform for PCI-6024E
C.2.1 Platform Interface
The interface of the platform consists of two parts, the PCI card's
measurements settings and the measurement procedure settings.
The first part is responsible for the selection of the analogue channels' pairs,
the gain of measurements for each pair of channels, the mathematical expression
which converts the measured volts to the desirable unit (e.g. Celsius degrees), and the
names of the txt files where measurements will be saved. It consists of eight similar
rows, one for each pair of channels. Each row includes the following objects:
·
A checkbox (Use), responsible for the selection of the channels’ pair.
·
A label (Channel Pair), which describes the pair of channels.
·
A Gain combo box which contains all possible gains of the PCI card.
·
A Range field which describes the range of measurement and depends
on the selected gain.
·
A Description field which holds the description of measurements (e.g.
CO2 ).
77
Appendix C
·
A Conversion field which holds the mathematical expression used for
the conversion of voltage value to the desired unit (e.g. Celsius
Degrees).
·
A Name field which holds the name of the txt file where measurements
will be saved.
Finally, this part of the interface includes two buttons: a) the save settings
button which is responsible to save card’s measurement setting into a property file, b)
the clear settings button which clears all platform’s fields.
The second part of the interface is responsible for the measurements
procedure. It consists of the following objects:
·
The Sample Rate field which holds the measurements sample rate, in
seconds.
·
The start button which starts the measurements procedure.
·
The stop button which stops the measurements procedure.
Figure 3. Application Interface
78
Appendix C
C.2.2 Platform Operation
This section describes the platform operation and gives a little explanation of
the java files which implement this application.
The user has to select which channels are connected to sensors in order to take
measurements with this platform. Also, he has to select the measurement gain for
each pair of channels, give the descriptions of the channels' measurements and give
the mathematical expressions for each channels' pair. Furthermore, he has to give the
names of the files, where measurements will be saved, for each pair of channels.
Finally, he has to give the sample rate (T) of measurements, in seconds, and press the
start button in order to start the measurements procedure. The program measures all
selected channels' outputs (volts) every T seconds, converts them into the desirable
units, and saves these values in the txt files respectively. The format of each line in
the txt files is as follows: DATE TIME MEASUREMENT (e.g.: 25/02/2004 12:35
25.4). In order to stop measurements, he has to do is to press Stop button. In order to
start the measurement procedure, all fields for the selected channels must have been
filled. Also sample rate field must contains a number (seconds).
C2.2.1 Presentation of application’s java files
NIDAQConnector.java
As mentioned in the previous chapter, this java file is responsible for the
declaration of the native method that measures the analogue card’s outputs. It contains
the class NIDAQConnector which declares the native method and the function
returnvoltage(channel, gain). This function calls the native method and returns the
measured voltage value for channel “channel” with gain “gain”.
RangeGainCon.java
This java file declares the class RangeGainCon which is responsible for two
operations:
·
First, to change the value of the range field, according to the gain
combo box selection. RangeChange(combobox,textfield) function is
responsible for this operation.
·
Second, to return the short value of the gain according to the gain
combo box selection. ReturnShort(combobox) function is responsible
79
Appendix C
for this operation. The returned short value is inserted as the second
argument of the returnvoltage() function, described before.
Gain Selection Short value
0.5
-1
1
1
10
10
100
100
Table 1. Gain to short values
Pfileoperations.java
This java file declares the class Pfileoperations which is responsible for the
write and read operations of the property file PCI6034E.properties. This property file
stores the platform’s settings when save settings button is pressed. The structure of
the file is as follows: property = value. SetProperties() function is responsible for
writing into the property file. It takes as input an array of properties and is called
when the save settings button is pressed. Returnproperty() function is responsible to
read and return the stored information from the property file. This function is called,
each time the application starts.
GlobalTimer.java
This java file declares the class GlobalTimer. This class sets a timer (class
Timer) and contains two timer functions:
·
Settimer(Timetask, delay, period): this function initializes the timer and
starts a periodical procedure after a delay of time. It repeats the task
(Timetask) every period (seconds).
·
Stoptimer(): this function stops the timer.
Filewriter.java
This java file declares the class Filewriter which is responsible for the write
operation of the txt files that hold the measurements. It contains the function
FileWriter(name, value) which appends the value to the txt file with name, name.
80
Appendix C
Conversion.java
This java file is responsible for the conversion of data. The sensor’s output
varies between 0 to 10 volts. The technical manual of this sensor reports that when the
output is equal to 0 volts then the temperature is -10 and when it is equal to 10 volts
then the temperature is 40 0 C . So, this java file reads the output of the sensor and
converts it to the corresponding temperature value.
MeasureSettings.java
This java file is the main file of our application. It contains the main function
and implements the interface of the platform. Also, it contains the measurement
operation.
The measurement operation starts when the start measurement button is
pressed. A new GlobalTimer is declared and a number of checks are performed.
These checks examine if all fields for the selected channels have been filled. Also a
check, if sample rate field contains a number, is performed. If all checks are passed,
the Timetask for the GloobalTimer is declared. This contains a block of operations for
each pair of channels, as shown below:
if(usebox.isSelected()==true){ //if channel is selected
String conversion = conversionfeild.getText().toString(); //conversion expression
String txt = filepathfield.getText().toString(); //name of the output txt file
short gain = RGConn.Returnshort(gaincombobox); //The short value for the selected
gain
short channel = #; //number of channel
double voltage = NIDAQAI.returnvoltage(channel,gain); //voltage measured value
voltage = conver.ReturnConversion(conversion,voltage); //Conversion voltages
® desired unit
fw.Filewriter(txt,voltage); //write the converted value to the txt file
}
After the declaration of the Timetask, the settimer() function is perfomed, and
the measurement procedure starts.
gt.settimer(nt,delay,period);
where nt is the Timetask, delay is 3 seconds and period is the sample rate field’s
value(sample rate in seconds).
81
Appendix C
C.3 Description of PCI – 6024E
C.3.1 Features of PCI – 6024E Device
The 6024E hardware card is constituted by 16 channels of analog input, two
channels of analog output, a 68-pin connector and eight lines of digital I/O (National
Instruments 2000, 1998). The specific device uses the NI – DAQ STC system
including timing controller for time – related functions. The DAQ-STC consists of
three timing groups that control analog input, analog output, and general-purpose
counter/timer functions. These groups include a total of seven 24-bit and three 16-bit
counters and a maximum timing resolution of 50 ns.
C.3.2 NI – DAQ Driver Software
The software driver offered makes the NI – DAQ device compatible to any
Personal Computer. It contains libraries and functions which can be used in a
programming environment. Furthermore, the software is quite consistent among the
different versions in order minimal modifications of the programming code to be
achieved.
C.3.3 Block Diagram of 6024E
This part of the appendix presents the block diagram of National Instrument’s
PCI Card 6024E.
Figure 4. Block diagram of 6024E
82
Appendix C
C.3.4 Measurement Precision
PCI 6024E device has a bipolar range which modifies according to the gain. In
this case, each channel of the card can be programmed with gains (see the following
table) maximizing the resolution.
Table 2. The various gains supported by the card including the range of the voltage per gain
C.3.5 I/O Connector
The following image presents the I/O connector for the 6024E device.
Figure 5. I/O Connector for 6024E device
83
Appendix C
C.3.6 Differential Connection
The connection used for the communication between the temperature sensor
and the NI – DAQ device 6024E is presented below.
Figure 6. Differential Connection between sensor and 6024E
From the image above, it is obvious that a Resistor R has been inserted
between the sensor and the device. This resistor is equal to 100KΩ. But it is essential
to point out that this was not the first connection which had been used. Another
connection similar to this had been used but without a resistor. In this case, the system
(programming code and device) did not behave very well. Although the programming
code read the inputs of the sensor, these values were not accurate and compatible with
the real measurements of the temperature that prevailed in that day. Moreover, the
values of the inputs varied and were not constant.
This phenomenon led to the conclusion that a resistor should have been used.
The role of the resistor was essential since after using it, the measurements
approached the real ones without any variance and they were constant.
84
Appendix D
Appendix D
D.1 User Manual
D.1.1 Login Security System
After installing the .exe file, the application starts with the following form:
Figure 1. Login Form.
This form allows a user to enter the system. Two settings are required for a successful
login. The first one is the username and the other is the password of the user. The
correct insertion of those settings leads to the main menu (see fig. 2) of the
application. In case of invalid insertion of the settings, warning messages appear and
inform the user about the setting which was inserted incorrectly.
D.1.2 Main Menu
This form is the main form of the application and permits the user to choose
the desired operation. The following figure presents the form of the main menu.
Figure 2. Main Menu
It is constituted by two buttons and three additional options on the menu bar.
85
Appendix D
·
Buildings Data button: leads to another form which is responsible for
building processing (see below).
·
Buildings Grading button: leads to a list of buildings and a user can execute
either environmental or energy classification.
As it was mentioned above, menu bar contains three options: File, Settings and
Application. File option contains a button named Exit which terminates the
application. The components of button Settings are presented in figure 3 below.
Figure 3. Components of Settings option.
-
New User: adds a new user in the system (see fig. 4). Verify Password field
checks if the user has chosen the desired password.
-
Database: informs about the settings of the existed database (see fig. 5). The
password of the database is not visible. However, the user of the system can
change the settings of the specific database by using button Edit. After that, the
database’s settings are updated when button Save is pressed.
-
Locations: inserts or changes the data of a specific location (see fig. 6). A
location is described by its name, the heating and cooling degree – days and the
latitude. Moreover, a location can be removed from the system if button Delete
Location is pressed. The deletion is achieved when the user selects and marks a
location from the list.
-
Appliances Consumptions: adds or changes an appliance of a building (see fig.
7). The information needed for appliances, concerns the name and the
consumption in watts. Similarly to Locations, the user marks the appliance that
86
Appendix D
he/she desires to delete and afterwards he/she presses the button Delete
Appliance.
-
Equipment Gains: inserts, updates or deletes the building’s heating or cooling
gains concerning different types of equipment (see fig. 8).
Figure 4. New User form
Figure 5. Database settings definition.
87
Appendix D
Figure 6. Locations
Figure 7. Appliances
Figure 8. Building’s Equipment
Application Option informs about the developers of the Java application and the
version of it.
88
Appendix D
D.1.3 Buildings Data operation
After using this operation the user can be informed about all the proper
information of a building. However, this information is not visible until the user clicks
on one of the buildings in the list (see fig. 9).
Figure 9. Building’s Menu
When a building in the list is marked and the user presses Delete button then
the marked record is removed from the system and the database. This part of the
application is divided to three parts. The first one in named Insert and it is responsible
for the insertion of a new building in the system. View part can be considered as a
monitor of the building’s data and the last part allows a user to update one or more
data for the building.
89
Appendix D
In Building’s zones (see fig. 10), a user can insert, delete and update a zone of
a building similarly to the previous operation. The other operation, entitled Energy
Grading, reports a message and allows a user to make a decision about the method
that he/she wishes to use for energy classification (see fig. 11).
Figure 10. Building’s Zones
90
Appendix D
Figure 11. Energy classification method selection.
Figure 11 presents both of the energy classification methods that are implemented by
this application.
D.1.4 Measured Method
This method, whose form is presented in figure 12, takes into account
electrical, oil or gas bills for the specific building. It uses two methodologies based on
measured data. If data have been taken for three or more years then the system
decides whether the energy classification methodology that should be used, is the one
without Weather Correction. Otherwise, this means that the measured data refer to
less than three years of measurements and then the system decides to use energy
classification methodology including Weather Correction.
Figure 12. Form used for Measured method
This form informs about the duration of measurements. If the measurements
are referred to less than three years then the option «Number of years less than three»
is activated. Moreover, a list appears and presents in which year the energy
91
Appendix D
classification has been realized. View button presents a form with existed data for the
building. Delete button removes a classified year from the system and New button
inserts a new year to the system. However, the proper use of this method requires an
additional parameter. This parameter is called Regulation Reference and depends on
each nation’s policy about energy certifications. Heat Gains option is used only when
energy classification with Weather Correction methodology is used. The following
figure presents the main form of Measured method.
Figure 13. Energy classification form based on Measured method
This form is divided in 4 categories: Heating, Cooling, Lighting and Appliances.
-
Heating: is referred to the energy needs for heating and depends on electricity,
oil or gas bills. The user defines energy consumptions during heating period.
-
Cooling: is referred to energy needs for cooling and depends only on electricity
for buildings located in Greece. The user defines energy consumptions during
cooling period
-
Lighting: concerns energy needs used for lighting.
-
Appliances: concerns energy needs for building’s appliances.
92
Appendix D
Figure 14. Input for outdoor Temperature file when measures are less than 3 years.
When the measured data have been taken for less than three years, then the
weather correction procedure must be executed. This procedure requires the existence
of a file with outdoor temperature data referring to a whole year. Outdoor
Temperature File tab (see fig. 14) allows a user to insert a new file.
93
Appendix D
D.1.5 Calculated Method
The form, which appears when the Calculated Method is used, is presented below.
Figure 15. Calculated method.
From the figure above, it’s obvious that the calculated method uses two different
methodologies: Climate Severity Index (C.S.I.) and Degree – days methodology.
Climate Severity Index methodology constitutes the default methodology.
-
C.S.I.: this methodology calculates the normalized energy consumption for a
building for both periods of interest. The data used for the calculations are the
annual consumption for heating and cooling, the real sunlight hours and the
maximum sunlight hours for a specific location.
-
Degree – days: this methodology uses only the annual consumption for heating
and cooling.
94
Appendix D
Both methodologies use heating and cooling degree – days of the location of
the building. Calculate Consumption button starts a procedure which calculates the
normalized energy consumption, depending on the selected method, for a building
and uses it for the class definition. The results are reported in a text field. Finally,
Save Data button saves the data used and the calculations in the corresponding table
of the database system.
D.1.6 Building Grading
In this part of the application, the user selects the desired building to be
classified and executes the procedure for energy classification (see fig. 16).
Figure 16. Energy classification menu
Energy classification procedure begins after pressing button, named, Energy.
95
Appendix E
Appendix E
E.1 Features of European Standard prEN 15203/15315
This appendix provides some general information about the standard prEN
15203/15315:2006 (CEN Members 2006). This information includes terms and
definitions that can be used in order a new building to be evaluated.
E.2 Terms and Definitions
Building
Construction as a whole, including its envelope and all technical building
systems, for which energy is used to condition the indoor climate.
New Building
Building at design stage or under construction or (for measured energy rating)
too recently constructed to have reliable records of energy use.
Existing Building
Building that is erected and (for measured energy rating) for which actual data
necessary to assess the energy use are known or can be measured.
Technical Building System
Technical equipment for heating, cooling, ventilation, domestic hot water,
lighting and electricity production.
Conditioned Space
Part of building which is heated or cooled
Conditioned Zone
Part of a conditioned space with a given set-point temperature or set-point
temperatures, throughout which the internal temperature is assumed to have
negligible spatial variations and which is controlled by a single heating
system, cooling system and/or ventilation system.
96
Appendix E
Dehumidification
Process of removing water vapor from air to reduce relative humidity.
Humidification
Process of adding water vapor to air to increase relative humidity.
Energyware
Tradable commodity used mainly to produce mechanical work or heat, or to
operate chemical or physical processes, and listed in Annex A of ISO 13600.
[ISO
13600].
Delivered Energy
Total energy, expressed per energy carrier, supplied to the building through
the system boundary, to satisfy the uses taken into account (heating, cooling,
ventilation, domestic hot water, lighting, appliances etc.) or to produce
electricity.
Primary Energy
Energy that has not been subjected to any conversion or transformation
process. Primary energy includes resource energy and renewable energy. If
both are taken into account it can be called total primary energy.
Total Primary Energy Factor
Resource and renewable primary energy divided by delivered energy, where
the primary energy is that required to supply one unit of delivered energy,
taking account of the energy required for extraction, processing, storage,
transport, generation, transformation, transmission, distribution, and any other
operations necessary for delivery to the building in which the delivered energy
will be used
Primary Resource Energy Factor
Primary resource energy divided by delivered energy, where the resource
energy is that required to supply one unit of delivered energy, taking account
97
Appendix E
of the resource energy required for extraction, processing, storage, transport,
generation, transformation, transmission, distribution, and any other
operations necessary for delivery to the building in which the delivered energy
will be used.
E.3 Symbols, Units and Subscripts
Table 1. Symbols and Units
98
Appendix G
Appendix F
F.1 Description of Java Files
This appendix presents a description of the java files including the functions
used in the application.
F.1.1 MyDBConnection.java file
This java file includes the following functions:
l
int initre(): reads the settings which are included in the properties file and
it is responsible for the connection to the database. If the connection is
successful then the function returns 1.
l
Connection getMyConnection(): returns a parameter which indicates the
connection to the database.
l
void destroy(): terminates the connection with the database system.
F.1.2 Pfileoperations.java file
This java file is responsible for processing the properties file. The functions
included in this file are:
l
String [] ReturnDatabase(): reads properties file and stores 4 properties in
a string array.
l
void SetDatabase(String [] drivers): writes three of the four properties in
the property file and uses data coming from the string drivers.
99
Appendix G
F.1.3 SimplifiedRatingMethod.java file
This file includes the following functions:
l
double round(double value, int decimalPlace): reads decimal numbers and
returns a number with decimal digits which is defined by the value of
decimalPlace parameter.
l
String findBuildingCategory(String bcateg, String insulation, String prd,
double energy): is responsible for the class definition of a building using
climatic conditions methodology. It takes into account some parameters
such as the building's category, if the building has or has not insulation and
the period of interest. Energy parameter keeps the value of the normalized
energy consumption for the specific building. This value is used for the
classification.
l
void getAllAppropriateData(int build_id): returns all the proper data used
for the calculation of the normalized energy consumption and the
classification.
l
void FillFieldsandArea(): presents all the results into a text field.
F.1.4 CalculateLoads.java file
This file includes the following functions:
l
ResultSet getallenvelope(): returns all the records of table Envelope and
stores them in a ResultSet parameter.
l
void SaveEquipTable(): stores the appliances of a building into the
corresponding table.
100
Appendix G
F.1.5 EnergyYear.java file
This file includes the following functions:
l
int ValidateYear(String d): checks if the format of the date is valid.
l
int YearExists(String y): when a new year is going to be inserted for a
specific building then the function checks if the building has been
evaluated before, for the same year.
l
String [] ReturnRR(int bid): returns the values for Rr parameter for heating
and cooling for a specific building.
l
int ReturnYears(): checks if there are data for three or less than three years.
This function is very important because it defines the method of
classification that must be used.
F.1.6 EnergyRating.java file
This file includes the following functions:
l
int IsHeatDouble(): checks if the electrical, oil and gas bills for the heating
period are in double format. If they are empty then they can be considered
as zero.
l
int IsHeatEmpty(): checks if the fields of electricity, oil and gas for heating
are empty.
l
int IsHeatConEmpty(): checks if the calculations of heating consumption
have been realized.
l
void CalculateHeat(): calculates energy consumption for the heating
period.
l
int IsCoolDouble(): checks if the bills for the cooling period are in double
format. If they are empty then they are equal to zero.
l
int IsCoolEmpty(): checks if the fields of electricity, oil and gas for cooling
are empty.
l
void CalculateCool(): calculates energy consumption for the cooling
period.
l
int IsCoolConEmpty(): checks if the calculations of cooling consumption
have been realized.
l
void LightingConsumptionPerMonth(String month, String consumption):
101
Appendix G
calculates the lighting consumption per month for a whole year.
l
int ValidateAppliancesQuantityHoursCell(): checks if hour and quantity
fields of appliances' table are integer numbers. Otherwise, it informs about
the false.
l
void FillEverything(): loads all the saved information into the
corresponding forms and fields.
F.1.7 EnergyResults.java file
The functions included in this file are presented below:
l
JFreeChart ReturnenergyChart(int zonenum): returns the energy chart for
the specific zone for the heating period.
l
JFreeChart ReturnenergyChartCooling(int zonenum): returns the cooling
energy chart for the specific zone.
F.1.8 EnergyGradingResults.java file
This file includes the following functions:
l
void EnergyGrading(): checks if there are proper data for the classification
and the method chosen.
l
void EPclass(int bid): calculates the Energy Performance Indicator for
heating and cooling for the specific building according to the selected
method (measured method, including or not including weather correction).
l
String EPClassification(double ep, double rr, double rs): defines the class
of
a
building
by
the
comparison
of
the
EP
indicator
to
the Rs and Rr parameters.
l
Double ReturnRS(int ins, String type, int heatcool): returns the value
of Rs parameter according to the type of building, the presence or absence
of insulation material and the period of study.
l
void ReturnDDFromFile(String file): calculates the average daily value of
102
Appendix G
outdoor temperature.
l
int ReturnBuildingMethod(int bid): returns the method used for the
classification.
l
int SearchForData(int bid,int method): returns 1 if the proper data for
evaluation exist.
l
JRDataSource createReportDataSource(): creates the format of the report.
The following table presents .java files used for general operations in order for
the classification to be achieved.
java files
Description
NewUser
adds a new user to the system
DatabaseSettings
database settings such as name, username and
password can be defined
Locations
adds, changes or deletes a location from the system
Appliances
adds, removes or updates an appliance for a
building
Login
allows a user to enter to the main menu of the
system
MainFrame
is the main menu of the system
Buildings
adds, removes or updates information about a
specific building
Zones
adds, removes or updates information about a
specific zone
Table 1. Basic java files including a short explanation about their functionality
103
Appendix G
Appendix G
G.1 Relational Scheme and Tables
This appendix presents the tables, including their attributes, deriving from the
relational database analysis. The database system’s tables are presented by the
following tables.
Zones
zid
PK
Integer
zDescritpion
-
String
zFrom
-
String
zTo
-
String
zCO2
-
File
zMRT
-
File
zHum
-
File
zLux
-
File
zTemp
-
File
bid
FK
Integer
Buildings
bid
PK
Integer
bDescritpion
-
String
bSurface
-
Double
bFloors
-
Integer
bAddress
-
String
bInsulation
-
Integer
bAC
-
Integer
bNB
-
Integer
bTout
-
File
lid
FK
Integer
104
Appendix G
ApplBuildings
aid
FK
Integer
bid
FK
Integer
BApplBuildings
baid
FK
Integer
bid
FK
Integer
LightBuildings
light_id
FK
Integer
bid
FK
Integer
SimplifiedRatingMethod
sbid
PK
Integer
sMethod
-
String
sAnnualH
-
Double
sSunH
-
Double
sMSunH
-
Double
sAnnualC
-
Double
sSunC
-
Double
sMSunC
-
Double
sNormQH
-
Double
sNormQC
-
Double
sCategoryH
-
String
sCategoryC
-
String
bid
FK
Integer
105
Appendix G
DetailedRatingMethod
dbid
PK
Integer
dEnergyYear
PK
String
dApplMethod
-
String
dLightMethod
-
String
dLightCons
-
Double
dLightYear
-
String
dLightDay
-
String
dLightFile
-
File
dSepBill…dFebBill
-
Double
dMarBill…dAugBill
-
Double
dSepOil…dFebOil
-
Double
dSepGas…dFebGas
-
Double
dSepElCon…dFebElCon
-
Double
dMarElCon…dAugElCon
-
Double
dSepOilCon…dFebOilCon
-
Double
dSepGasCon…dFebGasCon
-
Double
dOilFurnace
-
String
dGasFurnace
-
String
dOutFile
-
File
Where PK and FK labels are referred to the primary and foreign keys
respectively.
106