1
BDGM Table of Contents
I.
Program Abstract . . . . . . . . . . . . . . . . . . . . . . . . . . . . . . . . . . . . . . . . . . . . . . . . . . . . . . . . 1
II.
Description of Program . . . . . . . . . . . . . . . . . . . . . . . . . . . . . . . . . . . . . . . . . . . . . . . . . . . 2
Horizontal Alignment . . . . . . . . . . . . . . . . . . . . . . . . . . . . . . . . . . . . . . . . . . . . . . . 4
Vertical Alignment . . . . . . . . . . . . . . . . . . . . . . . . . . . . . . . . . . . . . . . . . . . . . . . . . 6
Bridge Cross Section . . . . . . . . . . . . . . . . . . . . . . . . . . . . . . . . . . . . . . . . . . . . . . . 7
Using the Program . . . . . . . . . . . . . . . . . . . . . . . . . . . . . . . . . . . . . . . . . . . . . . . . . . 8
Method of Solution . . . . . . . . . . . . . . . . . . . . . . . . . . . . . . . . . . . . . . . . . . . . . . . . . 9
Solution Sequence . . . . . . . . . . . . . . . . . . . . . . . . . . . . . . . . . . . . . . . . . . . . . . . . 10
III.
Preparing the Input Data . . . . . . . . . . . . . . . . . . . . . . . . . . . . . . . . . . . . . . . . . . . . . . . . . . 12
Form of Input Data . . . . . . . . . . . . . . . . . . . . . . . . . . . . . . . . . . . . . . . . . . . . . . . . 12
Sequence of the Input Data . . . . . . . . . . . . . . . . . . . . . . . . . . . . . . . . . . . . . . . . . . 13
Input Data Requirements . . . . . . . . . . . . . . . . . . . . . . . . . . . . . . . . . . . . . . . . . . . . 14
Layout Data . . . . . . . . . . . . . . . . . . . . . . . . . . . . . . . . . . . . . . . . . . . . . . . . . . . . . . 15
A.
Identification . . . . . . . . . . . . . . . . . . . . . . . . . . . . . . . . . . . . . . . . . 15
B.
Location Data . . . . . . . . . . . . . . . . . . . . . . . . . . . . . . . . . . . . . . . . 16
Example 1: Layout Data . . . . . . . . . . . . . . . . . . . . . . . . . . 18
C.
Horizontal Curve Data . . . . . . . . . . . . . . . . . . . . . . . . . . . . . . . . . 21
Example 2: Layout Data . . . . . . . . . . . . . . . . . . . . . . . . . . 23
D.
Vertical Curve Data . . . . . . . . . . . . . . . . . . . . . . . . . . . . . . . . . . . 24
Example 3: . . . . . . . . . . . . . . . . . . . . . . . . . . . . . . . . . . . . 27
E.
Crown and Lane Definitions . . . . . . . . . . . . . . . . . . . . . . . . . . . . . 30
Example 4: Parabolic Crown . . . . . . . . . . . . . . . . . . . . . 32
Superelevation . . . . . . . . . . . . . . . . . . . . . . . . . . . . . . . . . . . . . . . . . . . . . . . . . . . 33
Level Crown . . . . . . . . . . . . . . . . . . . . . . . . . . . . . . . . . . . . . . . . . . . . . . . . . . . . . 36
Example 5: Superelevation . . . . . . . . . . . . . . . . . . . . . . . 36
F.
Superelevation Data . . . . . . . . . . . . . . . . . . . . . . . . . . . . . . . . . . . 42
Example 6: Constant Superelevation . . . . . . . . . . . . . . . . 43
Transition Superelevation . . . . . . . . . . . . . . . . . . . . . . . . . . . . . . . . . . . . . . . . . . . 44
Example 6: Transition Superelevation . . . . . . . . . . . . . . . 46
Longitudinal Lines . . . . . . . . . . . . . . . . . . . . . . . . . . . . . . . . . . . . . . . . . . . . . . . . 51
A.
Chord . . . . . . . . . . . . . . . . . . . . . . . . . . . . . . . . . . . . . . . . . . . . . . 53
B.
Arc . . . . . . . . . . . . . . . . . . . . . . . . . . . . . . . . . . . . . . . . . . . . . . . . 54
C.
Railing . . . . . . . . . . . . . . . . . . . . . . . . . . . . . . . . . . . . . . . . . . . . . 56
D.
Parallel . . . . . . . . . . . . . . . . . . . . . . . . . . . . . . . . . . . . . . . . . . . . . 59
E.
Parallel thru Intersect Ahead . . . . . . . . . . . . . . . . . . . . . . . . . . . . 62
F.
Parallel thru Intersect Back . . . . . . . . . . . . . . . . . . . . . . . . . . . . . . 63
G.
Curve Offset . . . . . . . . . . . . . . . . . . . . . . . . . . . . . . . . . . . . . . . . . 65
H.
Straight Taper . . . . . . . . . . . . . . . . . . . . . . . . . . . . . . . . . . . . . . . . 67
I.
Curve Taper . . . . . . . . . . . . . . . . . . . . . . . . . . . . . . . . . . . . . . . . . 69
J.
Coordinate . . . . . . . . . . . . . . . . . . . . . . . . . . . . . . . . . . . . . . . . . . 71
Example 7-1: CRD, ARC, RLG . . . . . . . . . . . . . . . . . . . . 73
Example 7-2: PIA, PIB, CRD . . . . . . . . . . . . . . . . . . . . . 74
Example 7-3: STP, PAR, COR . . . . . . . . . . . . . . . . . . . . 76
Example 7-4: CTP, COS, ARC . . . . . . . . . . . . . . . . . . . . 77
Summary of Longitudinal Line Input Requirements (Table) . . . . . . . . . . . . . . . . . 78
Span Data . . . . . . . . . . . . . . . . . . . . . . . . . . . . . . . . . . . . . . . . . . . . . . . . . . . . . . . 78
A.
Span Identification . . . . . . . . . . . . . . . . . . . . . . . . . . . . . . . . . . . . 79
B.
Bent Data . . . . . . . . . . . . . . . . . . . . . . . . . . . . . . . . . . . . . . . . . . . 80
1.
?SKEW” Bent . . . . . . . . . . . . . . . . . . . . . . . . . . . . 83
2.
?PARL” Bent . . . . . . . . . . . . . . . . . . . . . . . . . . . . 83
3.
?PSTA” Bent . . . . . . . . . . . . . . . . . . . . . . . . . . . . 84
4.
?PREV” Bent . . . . . . . . . . . . . . . . . . . . . . . . . . . . 85
5.
?SAME” Bent . . . . . . . . . . . . . . . . . . . . . . . . . . . . 86
Summary of Bent Input Data (Table) . . . . . . . . . . . . . . . . . . . . . . . . . . . . . . . . . . 88
Bent Data . . . . . . . . . . . . . . . . . . . . . . . . . . . . . . . . . . . . . . . . . . . . . . . . . . . . . . . 89
Example 8-1: SKEW, PARL . . . . . . . . . . . . . . . . . . . . . . 89
Example 8-2: PSTA, PREV . . . . . . . . . . . . . . . . . . . . . . . 90
Example 8-3: SAME, PREV . . . . . . . . . . . . . . . . . . . . . . 91
C.
Transverse Lines (T-Lines) . . . . . . . . . . . . . . . . . . . . . . . . . . . . . 93
1.
?PARL” T-Line . . . . . . . . . . . . . . . . . . . . . . . . . . . . . . . . . 96
2.
?ANGL” T-Line . . . . . . . . . . . . . . . . . . . . . . . . . . . . . . . . 97
3.
?PTPT” T-Line . . . . . . . . . . . . . . . . . . . . . . . . . . . . . . . . 100
4.
?SKEW” T-Line . . . . . . . . . . . . . . . . . . . . . . . . . . . . . . . 103
5.
?CONS” T-Line . . . . . . . . . . . . . . . . . . . . . . . . . . . . . . . 104
T-Line Input Data Summaries (Tables) . . . . . . . . . . . . . . . . . . . . 106
T-Lines . . . . . . . . . . . . . . . . . . . . . . . . . . . . . . . . . . . . . . . . . . . . . . . . . . . . . . . . . . . . . . 109
Example 9-1: PARL/DIST, PARL/PROP, PARL/NORM . . . . . 109
Example 9-2: PTPT/COOR, PTPT/DIST, PTPT/PROP . . . . . . 110
Example 9-3: SKEW/STAT, ANGL/PROP, ANGL/DIST . . . . 111
Example 9-4: CONS/PROP, CONS/DIST, PTPT/COOR . . . . . 112
Coordinate Type Input . . . . . . . . . . . . . . . . . . . . . . . . . . . . . . . . . . . . . . . . . . . . . . . . . . 113
IV.
The Output Data . . . . . . . . . . . . . . . . . . . . . . . . . . . . . . . . . . . . . . . . . . . . . . . . . . . . . . . . . . . . . 115
Span Output Data . . . . . . . . . . . . . . . . . . . . . . . . . . . . . . . . . . . . . . . . . . . . . . . . . . . . . . 115
Bent Data . . . . . . . . . . . . . . . . . . . . . . . . . . . . . . . . . . . . . . . . . . . . . . . . . . . . . . 115
Longitudinal Line Output . . . . . . . . . . . . . . . . . . . . . . . . . . . . . . . . . . . . . . . . . . 115
Coordinate Output Data . . . . . . . . . . . . . . . . . . . . . . . . . . . . . . . . . . . . . . . . . . . . . . . . . 122
V.
Error Messages . . . . . . . . . . . . . . . . . . . . . . . . . . . . . . . . . . . . . . . . . . . . . . . . . . . . . . . . . . . . . . 123
VI.
Example Problems . . . . . . . . . . . . . . . . . . . . . . . . . . . . . . . . . . . . . . . . . . . . . . . . . . . . . . . . . . . 126
Example Problem 1 . . . . . . . . . . . . . . . . . . . . . . . . . . . . . . . . . . 126
Example Problem 2 . . . . . . . . . . . . . . . . . . . . . . . . . . . . . . . . . . 143
Example Problem 3 . . . . . . . . . . . . . . . . . . . . . . . . . . . . . . . . . . 159
Example Problem 4 . . . . . . . . . . . . . . . . . . . . . . . . . . . . . . . . . . 172
Blank Input Sheets . . . . . . . . . . . . . . . . . . . . . . . . . . . . . . . . . . . . . . . . . . . . . . . . . . . . . 182
FOREWORD
The “Bridge Geometry” computer program is referred to more commonly as the “Skewed Bridge” program,
primarily for the sake of brevity. In fact, this is the name that is shown on the input data forms and in the output
data of the program.
This write-up is primarily a user manual and does not include flow charts, a program listing, nor a comprehensive
report on the method of solution. However, the method of solution is discussed in general terms so that the user
will be able to get a general idea of the method of solution used by the program. Since the source code can be
obtained by request, a program listing can be obtained by listing or compiling the source. Also, since the program
is written in Fortran IV programming language, and contains numerous comments that describe the program
functions, the flow charts really are not essential in order to understand the procedure of the program solution.
It is assumed that the reader is familiar with the standard terminology of Highway Engineering, and such terms as
Station, Superelevation, Transition, Survey line, Degree-of-Curvature, etc., will not be defined in this report. It
should be noted that the term “Mainline” as used in this report is synonymous with the survey line, and the term
“Bent” is used to designate a substructure unit, i.e., pier, abutment, etc.
This report, then, explains in detail the functions of the program and how the program can be applied effectively in
order to solve the geometric requirements of a highway bridge.
i
BDGM TABLE OF CONTENTS
APPENDIX I
1.0
2.0
USING MERLIN-BDGM
1.1
BEFORE YOU BEGIN . . .
1.2
ACCESSING THE MAIN MENU
1.3
THE WIN-BDGM MAIN MENU
INPUT UTILITY
FILE SUBMENU
NEW FILE
OPEN FILE
SAVE FILE AND SAVE FILE AS
CLOSE ALL SCREENS
EXIT
EDIT SUBMENU
USING THE KEYBOARD WITH INPUT SCREENS
INPUT SCREENS
OPENING INPUT SCREENS
EDITING DATA FIELDS
CLOSING INPUT SCREENS
THE GO TO SUBMENU
THE INPUT SCREEN INDEX
OPENING INPUT SCREENS USING THE INPUT SCREEN INDEX
MOVING THE INPUT SCREEN INDEX
HELP MENU
CONTENTS
FILE SUBMENU
OPEN
PRINT TOPIC
PRINT SETUP
EXIT
EDIT SUBMENU
ii
COPY
ANNOTATE
BOOKMARK SUBMENU
DEFINE
MORE
HELP SUBMENU
HELP BUTTONS
ABOUT MERLIN-BDGM
3.0
RUN UTILITY
EXITING THE RUN UTILITY
OPENING DATA FILES IN THE RUN UTILITY
RUNNING WIN-BDGM
4.0
GRAPHICS UTILITY
5.0
PRINT UTILITY
FILE
OPEN
EXIT
VIEWING A RESULT FILE
FILE VIEWER
EXIT
FIND
FIND STRING
PRINTING A RESULT FILE
TABLE VIEWER
iii
I. PROGRAM ABSTRACT
TITLE: BRIDGE GEOMETRY
PURPOSE/DESCRIPTION:
The purpose of this program is to solve the geometrics that are required in the
design, detailing, and construction of highway bridges, thereby relieving the Engineer of this time consuming task
and removing the geometric limitations in the design of bridge structures. The program solves the geometrics by
intersecting a series of longitudinal lines that run basically parallel to the bridge with a series of transverse lines
that lie basically across the bridge. The computed data (including the finished grade elevation) at each intersection
point is reported as the output data. The longitudinal lines may be composed of beams, gutters, curbs, railings,
etc., whereas the transverse lines can be bents, centerline bearings, diaphragms, construction joints, splice points,
etc. The input data is entered on forms provided for the Engineer.
METHOD OF SOLUTION:
The bridge is oriented on a user defined coordinate system of X and Y axes.
The longitudinal and transverse lines are set up in equation form and intersected by computing the solutions of
simultaneous equations. The data given in the output at the intersection points of the longitudinal and transverse
lines is computed using the basic concepts of analytic geometry.
RESTRICTIONS/RANGE:
The bridge may be located in one, two, or three combinations of horizontal
curves and tangents. The horizontal curves may be compound but not reverse curves (work as two problems). The
survey line cannot be a spiral for the purpose of computing stations. Vertical alignment is limited to two vertical
curves with corresponding tangents. The surface of the bridge may be level, superelevated (with one to six lanes in
constant or transition superelevation), or parabolic. The maximum number of T-lines is twenty per span with no
limitation on the number of spans.
- 2 -
II. DESCRIPTION OF PROGRAM
“Bridge Geometry” (BDGM) is a problem oriented computer program that can be used effectively to compute
the geometric requirements for the design, detailing and construction of highway bridges. In addition, the program is
not limited to highway bridges since the geometry of railroad and pedestrian bridges is easily solved by this program.
The geometric solution of a problem fundamentally consists of intersecting a series of longitudinal lines that run
basically parallel to the bridge, with a series of transverse lines that run basically across the bridge. In practice, the
transverse lines may be series of points (centerline of bearings, etc.) located on the longitudinal lines (beams, etc.)
and do not necessarily have to lie on a straight line. At the intersections of the longitudinal and transverse lines, the
program computes the following types of data.
Stations
The station of each intersection point computed by the program is given in the output data. In addition to the
station, the output data will contain the radial or perpendicular distance from the point to the survey line. This
distance, together with the station, locates each intersection point for the Engineer.
Elevations
The elevations computed by the program at the intersection points are finished grade elevations, i.e., top of
bridge surface elevation at the intersection points. These elevations which are essential in all phases of Bridge
Engineering form an important part of the output data of each problem.
Distances and Lengths
The distances or lengths between intersection points measured along the longitudinal and transverse lines are
computed by the program and listed in the output. This information is of considerable benefit in the detailing process.
Angles
The angles between the longitudinal and transverse lines, or skew angles, are computed by the program and
listed in the output data. These angles can also be of considerable benefit when detailing the bridge.
Coordinates
The X and Y Coordinates of each point of intersection are computed by the program in the solution of the
longitudinal and transverse line equations in order to compute the aforementioned data. These coordinates are the
result of the orientation of the bridge on a system of coordinate axes in order to facilitate the solution of the problem.
- 2 -
BRIDGE LAYOUT
In order to solve the geometric requirements, the bridge must be placed on a coordinate system of X and Y
axes. After the Engineer has defined the orientation of the bridge in the input data, the longitudinal and transverse
lines can be set up in equation form by the program, and the solution of the problem then becomes basically one of
solving simultaneous equations.
Bridge Location
The location of the bridge on the coordinate system is defined by a Distance, Angle, and Station. In addition,
the range or extent of the problem is controlled by the Limiting Stations, i.e., a protection feature. The data used to
define the location of the bridge is shown in the sketch below. Note that by varying the Distance, Angle, and Station,
the bridge can be placed in almost any position on the coordinate system. However, the location of the bridge must be
defined so that the survey line does not pass through the origin. Note also that the portion of the coordinate system in
which a program solution is valid is designated by the sketch.
- 3 -
Horizontal Alignment
The horizontal alignment is defined by giving the degree-of-curvature of each range of horizontal curve, and the
P.C. and P.T. Stations that separate the range of the curves. The program has the capacity for three ranges of
horizontal curves and tangents. Following is a list of the possible combinations of tangents and circular curves that
may be used to define the horizontal alignment.
One Range:
1.
Tangent
2.
Curve
1.
Tangent-Curve
2.
Curve-Tangent
3.
Curve-Curve (compound curve)
1.
Tangent-Curve-Curve
2.
Curve-Tangent-Curve
3.
Curve-Curve-Tangent
4.
Tangent-Curve-Tangent
5.
Curve-Curve-Curve
Two Ranges:
Three Ranges:
A tangent is defined as a curve with a degree-of-curvature equal to zero.
The horizontal alignment defines the line along which the stations are measured, commonly called the survey
line or mainline. Only one survey line can be defined with each problem, and that survey line must be a tangent
(straight), circular curve, or a combination as shown above. The program has no provision for a spiral survey line,
although the longitudinal lines may be defined as spirals (curve taper). The horizontal alignment may be composed of
compound curves; however, the program has no provision for reverse curves. This presents no problem, however,
since a bridge on a reverse curve can be solved by dividing the bridge at the point of reverse curvature into two
problems.
- 4 -
The program solves a problem with a curved mainline regardless of whether the mainline is curving to the left
or right. Actually, the solution of the problem is independent of the direction of the curve since a left curve is a
mirror image of a right curve and vice versa. In the sketch on the following page, a right curve is shown at the top and a
left curve is shown at the bottom. Note that the directions of the plus and minus Y-axes have been reversed in the
sketch of the left curve and, in addition, the positions of the normally first and fourth quadrants have been
interchanged. If the sketch is rotated about the X-axis and viewed from the back, the left and right curves will appear
to have reversed their directions. In other words, when a right curve is viewed from
underneath it appears as a left curve. Therefore, since the direction from which a bridge is viewed has no physical
effect on the alignment, the solution of the problem should be, and is, completely independent of the direction of the
curve.
- 5 -
Vertical Alignment
In order for the program to compute the elevation of the various points on the bridge, the vertical alignment
(Grade Data) must be defined as part of the input data. The bridge may be entirely on a tangent (constant slope), partly
or wholly in a vertical curve, or may occupy a portion of two vertical curves. The Grade Data consist of the lengths of
existing vertical curves, slopes of the tangents, station and elevation of an origin point, and the stations at which the
tangents intersect to form a vertical curve.
The vertical alignment defines the profile grade line which is also referred to as the pivot point line. In
contrast to the limitation of the horizontal alignment to one survey line, the vertical alignment may consist of two
pivot lines, provided the bridge cross section is made up of superelevated lanes. However, the two pivot lines have the
same elevation, and both are defined by the vertical alignment input data. This makes it possible for the Engineer to
set up so called twin or double bridges as one problem (rather than solving the bridges individually) provided, of
course, that the vertical alignment is the same for both bridges. Following are the three possible variations in the
vertical alignment.
1.
Tangent
2.
Tangent-Curve-Tangent
3.
Tangent-Curve-Tangent-Curve-Tangent
It should be noted that any of the tangent portions may have a zero length (range). Following is a sketch showing the
vertical alignment.
- 6 -
Bridge Cross Section
The “Bridge Geometry” computer program provides for three types of bridge cross sections: superelevation,
level, and parabolic crown. The user must define one of these types in order for the program to be able to compute the
finished grade elevations. No other type of cross section is allowed by the program.
The program has the capacity for one, two, or three lanes of superelevation with each pivot line when the bridge
is superelevated. The lanes of superelevation must be defined and the rate of superelevation given for each lane, as
part of the input data. Each lane of superelevation must have a constant width throughout the range of the bridge;
however, the width and rate of superelevation of any lane is completely independent of any other lane. One of the
most important functions of the program is the ability to compute finished grade elevations within a varying rate of
superelevation, commonly called transition. Like the width and superelevation rate, the transition of any superelevated
lane is completely independent of any other lane.
The program has the capacity to compute finished grade elevations when the roadway surface is a parabolic
crown. However, a parabolic crown cannot be defined in the same problem with superelevated lanes, and only one
parabolic crown is allowed per problem.
In lieu of the superelevation or parabolic crown, the bridge cross section can be defined as level. In this case,
the program ignores the crown corrections, and the elevations given in the output data will be profile grade elevations.
LONGITUDINAL LINES
The beams, gutters, curbs, railings, structure lines, center lines, etc. of the bridge are defined in the input data
as longitudinal lines. These lines may extend throughout the range of the problem, or the longitudinal lines may be
defined for one or more particular spans. In other words, the longitudinal lines may vary from span to span. A
minimum of one longitudinal line must be defined in each problem. The maximum number of longitudinal lines is
thirty. There are ten types or codes by which the longitudinal lines may be defined. These will be discussed in detail
in the section on “Preparing the Input Data.”
TRANSVERSE LINES
The bents, substructure lines, center-of-bearings, diaphragms, splice points, construction joints, etc. of the
bridge are defined as transverse lines. These transverse lines are defined in units of a span. That is, a span will consist
of two transverse lines representing the two bents defining the span and a number of transverse lines within the span.
The number of transverse lines may vary from zero to twenty per span, excluding the two bent lines. There is no limit
on the number of spans that may be defined in a problem.
- 7 -
- 8 -
USING THE PROGRAM
The Engineer can use the “Bridge Geometry” computer program effectively in the preliminary and final design
of a bridge. In the preliminary phase, stations, skew angles, distances, etc., that are unknown can be computed by the
program to assist in the preliminary layout. In the final design phase, the lengths of beams and diaphragms, positions
of diaphragms, elevations for determining beam seat elevations, and many other types of pertinent data can be
computed by this program, thereby assisting the Engineer in the design and detailing of the bridge. In the construction
phase, the Engineer can easily use the program to obtain the elevations used to set the construction forms, etc.
It is important to note that any bridge may be set up as a number of separate problems and processed at
different times. For example, the geometric requirements in the design stage are quite different from the geometry
that an Engineer requires in the construction of the same bridge. However, it is usually more beneficial to have all the
geometric requirements in the design process computed in a single run of the problem. Later, the Construction
Engineer can compute his geometric requirements in another run of the problem.
The information required by the program in order to process the problem must be given by the Engineer on a
set of input data forms. First, it is important to determine all the different types of information the user desires the
program to compute. This may eliminate the possibility of having to run the problem again to compute data not
included in the first run. Next, the input data required by the program to compute the desired output must be
determined. This involves choosing the number and types of longitudinal and transverse lines, etc. Finally, this data
must be entered on the input data forms and forwarded to the Data Processing Center.
The output data which include a listing of the input data are fully edited with numerous headings for ease in
interpretation. The accuracy of the output data depends directly on the accuracy of the input data. That is, if an error
is made with the input data, erroneous answers will surely appear in the output data. It cannot be overemphasized that
the entire input data should be thoroughly checked before processing and it is suggested that, as a further check, the
input data forms be compared to the listing of the input data that is given in the output data.
- 9 -
METHOD OF SOLUTION
The geometric solution of a problem is based on the concepts of analytic geometry, i.e., coordinate system,
line equations, etc. The program solution has three basic functions; a discussion of each function follows.
1.
Compute Line Equations.
The mainline, longitudinal lines and transverse lines are set up in equation form by the program. Three
basic types of line equations are used to describe these lines: straight, circular curve, and spiral.
Straight Lines
The equation of a straight line is set up in slope intercept form
Y=M•X+B
where 'M' is the slope of the line and 'B' is the Y-Coordinate of the point where the line crosses the Y-axis.
However, if the absolute value of the slope (M) is greater than one (1), the equation of the straight line
is in the following form
X=N•Y+C
where 'N' is the slope of the line in relation to the Y-axis (N = 1/M), and 'C' is the X-Coordinate of the point
where the line intersects the X-axis (C = -B/M).
Circular Curve Lines
The equation of a circle is set up in the following form
(X-Xo)2 + (Y-Yo)2 = R2
where 'Xo' and 'Yo' are the coordinates of the center of the circle, and 'R' is the radius of the circle.
- 10 -
Spiral Lines
The equation of a spiral (curve taper) is set up in polar coordinate form as follows
R=K•2
where 'R' is the radius of the curve when a radial line is rotated an angle equal to '2', and 'K' is a constant
representing the change in radius per unit of angle rotation.
2.
Intersect Lines.
The program intersects each longitudinal line with the transverse lines. In addition, the mainline is
intersected with all bent lines. The equations are solved simultaneously and, thereby, the X and Y coordinates
are determined. When solving for the intersection of a spiral and straight line, the program uses a process of
"approximations."
3.
Compute Intersection Data.
After solving for the X and Y coordinates, the program computes the station of the point and the
distance from the point to the mainline. Using this data, the elevation of the point can be computed. In
addition, other distances and angles are computed and printed in the output data.
Solution Sequence
Following is a brief outline of the sequence of the program solution with comments to indicate the functions
of each part of the program solution.
1.
Read and Process Layout Data (one time per problem).
a.
Location Data.
The coordinates of the Reference Point Station are computed and stored along with the Limiting
Stations, Reference Angle and Reference Point Station.
b.
Horizontal Data.
The equations of the mainline, P.C. and P.T. Station coordinates, and Reference Angles are
- 11 -
computed and stored along with the degree-of-curvature and radius of each range of horizontal curve.
c.
Vertical Curve Data.
The vertical curve alignment is divided into ranges of parabolic curves and tangents, and the
equation of the profile grade line is computed for each range and stored for future reference.
d.
Crown and Lane Definitions.
If the roadway is a parabolic crown, the program computes the parabolic constant and stores this
constant along with the limits and position of the parabolic crown. When the bridge surface is
superelevated, the program computes the width of each lane and stores this data along with the position
of the lanes and profile grade lines.
e.
Superelevation Data.
If the bridge surface is superelevated, the rate of superelevation of each lane is read and stored.
If the bridge is in a varying rate of transition, the rates of change of the superelevation rates are
computed for each lane and stored along with the stations of the breaks in the transition rates. This
enables the program to compute the rate of superelevation in any lane at any station.
2.
Read and Process Longitudinal Lines.
The program reads the longitudinal line data and computes and stores the equation of each longitudinal
line that does not vary within the range of the problem. This is repeated each time a set of longitudinal lines is
defined in the input data.
3.
Read and Process Span.
The following program steps are repeated for each span in the bridge.
a.
Span Identification.
- 12 -
The program reads and prints the information used to describe the span, i.e., remarks, etc.
b.
Bent Data.
The input data of each bent are read and printed. Then, the program computes the equation of
each bent and intersects the two bents with the mainline in order to find the bent station and skew angle
(if this data is not given in the input data). The bent station and skew angle are stored for future listing.
4.
Intersect Bents with Longitudinal Lines.
The program solves for the intersection of each bent with each longitudinal line. The intersection data
(coordinates, angles, stations, etc.) are stored for future reference and listing. In addition, the equations of the
variable longitudinal lines are computed, i.e., chords, etc.
5.
Read and Process Transverse Lines in Span.
The program reads and prints the input data of each transverse line in
6.
the span. At the same time,
the equations of the
transverse lines are
computed. These equations
are stored temporarily so that
these lines can be intersected
with the longitudinal lines.
Intersect Longitudinal and Transverse Lines.
Beginning with the first longitudinal line, the program intersects the longitudinal lines with each
transverse line. After each intersection point is found, the program computes the various output data (station,
elevation, distances, angles). After processing all longitudinal lines, the program proceeds to a new span or
terminates operation.
- 13 -
III. PREPARING THE INPUT DATA
In the following discussion, refer to the blank input data forms in Attachment A.
FORM OF INPUT DATA
The input data required by the program are entered on four types of input forms. Following is a discussion of
each type of input form.
A.
LAYOUT DATA (page 1 of Attachment A). H.D. 498-D
The LAYOUT DATA must be the first input sheet of each problem. Only one sheet of this type is
required per problem. The LAYOUT DATA input form consists of the following input data:
B.
1.
Identification
2.
Location Data
3.
Horizontal Curve Data
4.
Vertical Curve Data
5.
Crown and Lane Definitions
6.
Superelevation Data
LONGITUDINAL LINES (page 2 of Attachment A). H.D. 498-L
This input data form is used to define the LONGITUDINAL LINES (beams, gutters, curbs, railings, etc.)
that are to be intersected with the bent and transverse lines of each span. At least one sheet of this type must
be used with each problem.
Usually, only one sheet of LONGITUDINAL LINES is required per problem. However, on some
occasions the longitudinal lines will not be continuous from span to span (for instance, when one span has five
beams and an adjacent span has six beams), and it will be advantageous to enter a LONGITUDINAL LINE input
sheet preceding each span that has a different set of longitudinal lines.
- 14 -
C.
SPAN DATA (page 3 of Attachment A). H.D. 498-S
The SPAN DATA input data form is used to describe a span, the bents that define the span, and the
transverse lines that are in the span. One sheet of this type is used with each span in the bridge. However, it is
possible in some cases to combine several spans of the bridge and enter then as one span, thus eliminating a
number of SPAN DATA input sheets. In this case, the intermediate bents can be defined and entered as
transverse lines.
D.
COORDINATE INPUT (page 4 of Attachment A). H.D. 498-C
The COORDINATE INPUT form may be used in lieu of or in conjunction with the SPAN DATA input
forms. This type of input sheet is used when the coordinates of the points on the bridge are known, and the
stations, elevations, etc. are desired. Since the coordinates must be known (computed by some other method
or program), this type of input will have limited use.
Sequence of the Input Data
The input data forms for each problem should be in the following order:
1.
LAYOUT DATA (one sheet)
2.
LONGITUDINAL LINES (one* sheet)
3.
SPAN DATA and/or COORDINATE INPUT (variable number of sheets)
- 15 -
* An exception has been noted on page 50.
- 16 -
INPUT DATA REQUIREMENTS
In the following discussion, the required input data will be described in detail and examples used to illustrate
the data that is entered on the input forms. Refer to the example problems for more illustrations.
Each line on the input data forms represents a data type; and this write-up will refer to the data columns (c.c.)
of each line. Note that the data column numbers are given in the formats (headings) on the input forms. Each position
(data column) of the input line is for entering one character, a number, letter, or special character; and a group (field)
of these positions is used to enter an item of data.
A negative quantity is indicated by placing a minus sign (-) before the first significant digit of the data field. In
the absence of a minus sign, all quantities are considered positive. The entire data field to the right of the first
significant digit should be filled in even though all the digits may be zero, i.e., the data columns to the right of a digit
or digits in a data field should not be left blank.
The position of the decimal is shown on the input forms. Note that the decimal does not occupy a data column.
However, the position of the decimal may be overridden by entering a decimal in the desired data column as part of the
input data. This may be done to enter greater accuracy in the input data.
Plus signs (+) are shown in the data fields, where stations are required, to facilitate the entering of stations on
the input forms. Note, however, that the plus sign does not occupy a data column.
Stations and distances are to be given in feet to four decimal positions unless noted otherwise. The first
digit(s) in the first data column(s) of each input data line is for identification purposes and of no significance to the
Engineer.
- 17 -
LAYOUT DATA
The LAYOUT DATA input form must always be filled in as the first sheet of each problem.
A.
IDENTIFICATION (* in c.c. 1).
The Identification line is used to enter any pertinent identifying remarks about the bridge that the
Engineer wishes to head the output listing. The project number, county, data, and name or initials should
always be entered.
Data columns 2-5 of the first line are reserved for the problem number. This space should always be
left blank by the Engineer since a number will be assigned to the problem from the log book of computer runs.
The problem number will be associated with any error messages and will appear in the output listing.
Any number of Identification lines may be used to enter remarks, etc. However, when an additional line (data
type) is to be used, the code "CONT" must be entered in data columns 77-80 to indicate to the program that another
Identification Data Type is to follow. Therefore, the last Identification line will not require the continuation code.
Also, if only one Identification line is used for remarks, the code "CONT" is not required.
- 18 -
B.
LOCATION DATA (1 in c.c. 1).
The Location Data consists of the data required to locate the bridge on a system of coordinate axes.
1.
Limiting Stations (c.c. 2-11, 12-21). Form: xxxx+xx.xxxx feet (or m).
The Back and Ahead Limiting Stations define the range of the problem; that is, every point
computed on the bridge must lie on or between these two stations. Both of these stations are always
required as part of the input data. The purpose of the Limiting Stations is to protect against errors in
the input data. For example, if an error is made when entering a transverse line (or key-punch error),
the intersection of the transverse line and some longitudinal line might fall outside the Limiting
Stations, thus causing an error message and bringing it to the attention of the Engineer. In order for this
safety feature to function properly, the Limiting Stations should be placed near the ends of the bridge.
The Limiting Stations serve other purposes that will be discussed more conveniently on subsequent
pages. The Limiting Stations may be of negative magnitude.
2.
Station of Reference Point (c.c. 22-31). Form: xxxx+xx.xxxx feet (or m).
The Reference Point Station is an arbitrary station used to orient the bridge on a system of
coordinate axes. This point is usually on the bridge; however, this is not a program requirement.
Whenever the bridge crosses a road, it is common practice to use the point of intersection of the two
survey centerlines as the Reference Point.
It is an absolute program requirement that the Station of Reference Point be in the range of
horizontal curve two. This requirement will be noted in more detail in the discussion of the Horizontal
Curve Data. In addition, the Reference Point must be on the survey centerline, i.e., mainline. The
Reference Point Station may have a negative value.
- 19 -
3.
Reference Angle
"
(c.c. 32-40).
Form:
xxx deg.,xx min.,xx.xx sec.
The Reference Angle is the angle between the X-axis and the
radial line from the origin to the Reference Point. This is an
arbitrary angle that may be varied from zero (0) to ninety (90)
degrees. However, in order to keep the entire bridge in the first
quadrant, Reference Angle values of zero or ninety degrees can be used
only when the Reference Point is ahead or back of the bridge,
respectively. The Reference Angle is entered by giving the degrees,
minutes, and seconds of the angle according to the input data format.
The degrees and minutes are entered as whole numbers, and the seconds
are entered to the nearest hundredth. The Reference Angle cannot be
entered in radians or decimals of degrees. Although the program will
accept a negative Reference Angle, under normal circumstances the
Reference Angle should always be positive.
If horizontal curve range two (curve that contains the Reference
Point) is actually a tangent (straight), a Reference Angle value of
zero places curve two parallel to the Y-axis. A value of ninety
degrees orients curve two parallel to the X-axis. If the bents of the
bridge are parallel, a Reference Angle value can be entered so that
the bents will be parallel to either the X or Y-axis. This will be
discussed further in the discussion of SPAN INPUT DATA. However, it
should be understood that the Reference Angle is completely
independent of any bent or reference line skew angle.
4.
Distance from Origin to Reference Point (c.c. 41-50).
Form:
xxxxxx.xxxx feet (or m).
The Reference Distance is the radial distance from the origin to
the Reference Point. If horizontal curve two is a circular curve,
this distance need not be given since the program will automatically
assign the radius of the curve to this distance, thus placing the
center of the curve at the origin.
If horizontal curve range two is a tangent, the Reference
Distance should always be given a value greater than zero. If a value
of zero is entered, or the space is left blank, the program will
assume a value of ten thousand feet (10,000.0000). A negative
Reference Distance is not acceptable. Note that the line from the
origin to the Reference Point is always perpendicular to the tangent.
The Reference Distance is actually an arbitrary distance that is used
in conjunction with the Reference Angle and Reference Point Station to
- 20 -
orient the bridge on a system of coordinate axes.
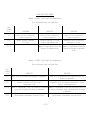
Location Data Examples
Three examples of the Location Data required to orient a bridge on a
system of coordinate axes are shown on the following three pages.
- 21 -
EXAMPLE:
1-1.
Layout Data
This example shows how a bridge is
oriented on a system of coordinate axes.
All the stations, distances, etc., are
assumed and used for the purpose of
illustrating the Layout Data input
requirements. Note that the major portion
of the bridge is on a tangent, and the
remaining portion is on a circular curve.
The tangent portion which contains the
majority of the bridge will be set up as
curve two. Therefore, the Reference Point
must be in the tangent portion. The
Reference Point will be arbitrarily defined
as the intersection point of the survey
lines of the bridge and road underneath.
Note that the skewed corners at the ends of
the bridge must be taken into account when
selecting the Limiting Stations.
- 22 -
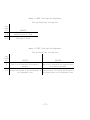
EXAMPLE 1-2.
Layout Data
This example shows how a bridge that
is entirely on a tangent can be oriented
parallel to the Y-axis. Note that the
Reference Angle is zero in this case. The
Station of the Reference Point is ahead of
the bridge so that all the bridge will lie
in the first quadrant. The Reference
Distance is assumed to be 1,000 feet, and
the assumed stations are shown in the
sketch.
- 23 -
EXAMPLE 1-3.
Layout Data
This example shows how the bents of a
bridge may be set up parallel to the Y-axis
provided, of course, the bents are
parallel. In this case, all the bents are
parallel to the road underneath, which is
common practice. Note that if the Ref.
Angle (") is made equal to the complement
of the skew angle (2), the bents and survey
line underneath will be parallel to the Yaxis. The skew angle should be known in
each case. In this example, a value of
thirty (30) degrees is assumed. Therefore,
the Reference Angle (") should have a value
of sixty (60) degrees. Note that the
Reference Distance is not required in this
case, i.e., the radius of the curve will be
used as the Reference Distance.
- 24 -
C.
HORIZONTAL CURVE DATA (2 in c.c. 1).
Since the bridge may be located in as many as three horizontal
curves, the Horizontal Curve Data is used to enter the degree-ofcurvature of each curve, and the P.C. and P.T. Stations that separate the
curve ranges. Note that any of the three curves may actually be a
tangent (straight), i.e., a curve with an infinite radius.
The degree-of-curvature of each range is entered on the input form
in degrees, minutes, and seconds. Note that the curvatures may be
entered to a hundredth of a second. A tangent range of horizontal curve
is defined by entering a degree-of-curvature of zero (0). In actual
practice, the bridge very rarely will be on three ranges of horizontal
curves, and bridges on two ranges of horizontal curves are infrequent.
The vast majority of bridges will be completely in only one range of
horizontal curve. Therefore, in order to save the Engineer's time, it is
necessary to define only the ranges of curvature in which the bridge is
located. For example, if the bridge is entirely in one curve (or
tangent), only one degree-of-curvature is required. Likewise, if the
bridge is located in two curves (or curve and tangent), it is necessary
to define only two degrees-of-curvature, etc.
Adjoining curves, or adjoining curve and tangent, are assumed to be
tangent at the P.C. and P.T. Stations.
If there is only one range of curvature, it must always be defined
as Curve No. 2. In this case, Curve No. 1 and Curve No. 3 would not
exist. If there are two ranges of curvature, one of the ranges must
always be defined as Curve No. 2 and the other curve as either Curve No.
1 or Curve No. 3. For greater program efficiency, Curve No. 2 should be
the range that contains the major portion of the bridge. This is the
reason that the tangent portion of the bridge in example 1-1 (page 17)
was selected as Curve No. 2.
1.
Curve No. 1 (c.c. 2-9).
Form:
xx deg.,xx min.,xx.xx sec.
The degree-of-curvature of curve range one should be entered in
this space. If this curve does not exist, leave the space blank.
The beginning station of Curve No. 1 is assumed to be the Back
Limiting Station, and the ending station is the P.C. Station of
curve range two.
2.
P.C. Station (c.c. 10-19).
Form:
xxxx+xx.xxxx feet (or m).
The P.C. Station is the station that begins Curve No. 2 and,
therefore, ends Curve No. 1. This station is not required if only
one range of horizontal curve exists. The program will assign this
- 25 -
station the value of the Back Limiting Station, i.e., the P.C.
Station in this case is arbitrary. However, the P.C. Station should
always be given if two or three ranges of horizontal curvature
exist. If Curve No. 1 does not exist when Curve No. 3 does exist,
the P.C. Station conveniently can be set equal to the Back Limiting
Station since the P.C. Station is in this instance an arbitrary
station.
3.
Curve No. 2 (c.c. 20-27).
Form:
xx deg.,xx min.,xx.xx sec.
This space is for entering the degree-of-curvature of
horizontal curve range two. Curve No. 2 is considered the main
curve and, therefore, must always be defined. The range of Curve
No. 2 must always contain the Reference Point Station that is given
in the Location Data. The range of Curve No. 2 is from the P.C.
Station to the P.T. Station.
4.
P.T. Station (c.c. 28-37).
Form:
xxxx+xx.xxxx feet (or m).
The P.T. Station is the station that ends the range of Curve
No. 2 and begins Curve No. 3. If only one range (Curve No. 2) of
horizontal curve exists, this station is not required, i.e., leave
blank. The program will assign this station the value of the Ahead
Limiting Station, i.e., the P.T. Station in this case is arbitrary.
However, the P.T. Station should always be given if two or three
ranges of horizontal curvature exist. If curve range three does not
exist when Curve No. 1 does exist, the P.T. Station can conveniently
be set equal to the Ahead Limiting Station since the P.T. Station
is, in this instance, an arbitrary station.
5.
Curve No. 3 (c.c. 38-45).
Form:
xx deg.,xx min.,xx.xx sec.
Enter in this space the degree-of-curvature of horizontal curve
range three. If this range of mainline curve does not exist, this
space should be left blank. The beginning station of Curve No. 3 is
the P.T. Station, and the ending station is assumed to be the Ahead
Limiting Station.
Horizontal Curve Data Examples
The following page contains the Horizontal Curve Data required for
the three examples (1-1, 1-2, 1-3) shown to illustrate the Location Data.
- 26 -
- 27 -
EXAMPLE 2-1.
Layout Data
This example shows the Horizontal Curve Data requirements of Example 1-1 on page 17.
FORM OF INPUT
EXAMPLE 2-2.
Layout Data
This example shows the Horizontal Curve Data requirements of Example 1-2 on page 18.
FORM OF INPUT
EXAMPLE 2-3.
Layout Data
This example shows the Horizontal Curve Data requirements of Example 1-3 on page 19.
- 28 -
FORM OF INPUT
- 29 -
D.
VERTICAL CURVE DATA
The Vertical Curve Data consists of two lines on the input form.
The first line is for entering P.V.I. Stations; the second line is used
to enter the beginning Elevation, Grades (slopes) and Length of Vertical
Curves.
1.
P.V.I. Stations (3 in c.c. 1).
The P.V.I. Station is defined as the station of the
intersection of the tangents of a parabolic vertical curve. These
stations are required in order to position the vertical curves
properly. The P.V.I. Stations may be of negative magnitude. These
stations should be given on the input form according to the
following requirements.
a.
P.V.I. Z Station (c.c. 2-11).
Form:
xxxx+xx.xxxx feet (or m).
The P.V.I. Z Station is not actually a P.V.I. Station, but
rather the station of the beginning of the Vertical Curve Data.
Therefore, this station must be located before the beginning of
the bridge since the program will not compute the elevation of
a point located back of this station. In essence, this station
is the origin of the grade data. The P.V.I. Station should be
on a tangent grade and not within a vertical curve. The P.V.I.
Z Station is an arbitrary station and always should be defined
by entering a value on the input form.
The end of the Vertical Curve Data is assumed to be the
Ahead Limiting Station.
b.
P.V.I. 1 Station (c.c. 12-21).
m).
Form:
xxxx+xx.xxxx feet (or
If a portion (or all) of the bridge is in a vertical
curve, it is necessary to give as the P.V.I. 1 Station the
station of the intersection of the two grades (G1 and G2) that
define the first vertical curve. This station is not required
if the entire bridge is on a tangent.
c.
P.V.I. 2 Station (c.c. 22-31).
m).
Form:
xxxx+xx.xxxx feet (or
The program has the capacity for two vertical curves. If
a portion of the bridge lies in a second vertical curve, it is
- 30 -
necessary to give as the P.V.I. 2 Station the station of the
intersection of the two grades (G2 and G3) that define the
second vertical curve. This station is not required if the
entire bridge is on a tangent, nor when there is only one
vertical curve.
- 31 -
2.
Elevation, Grades and Lengths of Vertical Curves (4 in c.c. 1).
The Grades (slopes) that define the Vertical Curve Data are
given by percentage, i.e., one hundred times the tangent of the
slope angle. Each slope may be positive or negative. A positive
grade increases the profile grade elevation as the station
increases. A negative slope decreases the profile grade elevation
as the station increases. The Grades can be entered to six decimal
positions of percentage. A Vertical Curve Length equal to zero is
invalid.
The Lengths of Vertical Curves can be entered to three decimal
positions. A negative Vertical Curve Length has no meaning and,
therefore, a negative value is not permitted.
a.
Elevation P.V.I. Z (c.c. 2-9).
Form:
xxxx.xxxx feet (or m).
Enter in this space the profile (pivot point or elevation
control line) grade elevation of the P.V.I. Z Station. This
Elevation of the beginning of the grade data must always be
given on the input form. The Elevation of the P.V.I. Z Station
can be given to the nearest ten-thousandth of a foot (four
decimal positions) and may be of negative magnitude.
b.
% Grade Z-1 (c.c. 10-18).
Form:
xxx.xxxxxx %.
This grade (G1) is the slope of the tangent from the
P.V.I. Z Station to the P.V.I. 1 Station. This grade should
always be given on the input form. If the P.V.I. Station is
not defined (no vertical curve) the requirements of this grade
are unchanged, and this grade is then assumed to hold true from
the P.V.I. Z Station to the Ahead Limiting Station.
c.
L.V.C. 1 (c.c. 19-25).
Form:
xxxx.xxx feet (or m).
Enter in this space the length of the first (or only)
vertical curve. This vertical curve is assumed to be
symmetrical about the P.V.I. 1 Station. Leave this space blank
if the grade data contain no vertical curves.
d.
% Grade 1-2 (c.c. 26-34).
Form:
xxx.xxxxxx %
This grade (G2) is the slope of the tangent from the
P.V.I. 1 Station to the P.V.I. 2 Station. Enter this grade
only when the grade data contain a vertical curve(s). In the
- 32 -
case of one vertical curve, this grade is continuous from the
P.V.I. Station to the Ahead Limiting Station.
- 33 -
e.
L.V.C. 2 (c.c. 35-41).
Form:
xxxx.xxx feet (or m).
The length of the second vertical curve is entered in this
space. However, if there is no requirement for a second
vertical curve, this space should be left blank. This vertical
curve is assumed to be symmetrical about the P.V.I. 2 Station.
f.
% Grade 2-3 (c.c. 42-50).
Form:
xxx.xxxxxx %.
This grade (G3) is the slope of the tangent from the
P.V.I. 2 Station to the Ahead Limiting Station and should be
entered on the input form only when the grade data contain two
vertical curves.
Vertical Curve Data Examples
Three examples of the input data necessary to define the Vertical
Curve Data are shown on the following three pages.
- 34 -
Ahead Limiting Station
EXAMPLE 3-1.
22+00
P.V.I. Z Station
18+00
Elev. 1000.0
In this example, the bridge is assumed to be entirely on a tangent (straight grade). The only data that
will be required are the P.V.I. Z Station, the Grade (G1), and the beginning Elevation. Note that the grade
is assumed to extend to the Ahead Limiting Station.
FORM OF INPUT
- 35 -
EXAMPLE 3-2.
P.V.I. Z Station
Ahead Limiting Station
142+00
Elev. 500.0
This example shows the required input data when the bridge is located in a vertical curve, either partly or
wholly. Note that the beginning station of the actual vertical curve is 144+00, and the ending station is 14800.
FORM OF INPUT
- 36 -
EXAMPLE 3-3.
This example shows the required input data when the bridge is
located in a portion of two vertical curves. Note that the tangent
portion between the two vertical curves can be zero (0); however,
the curves must not overlap.
FORM OF INPUT
- 37 -
E.
CROWN AND LANE DEFINITIONS (5 in c.c. 1).
The Crown and Lane Definitions input line is used to enter the data
that is necessary to completely define the type and limits of the
transverse bridge surface (finished grade). The bridge roadway surface
may be parabolic, superelevated, or level (no crown correction). The
input form has two formats for reference when entering the input data.
The format used to enter a parabolic crown is the topmost format to the
left, and the superelevated format is immediately below the parabolic
format and encompasses the entire line on the input data form. Since the
required input to define a parabolic crown is entirely different from the
data that is required to define superelevated lanes, the two types of
roadway surfaces will be discussed separately. A level crown is a
special case and will be discussed separately also.
No provision is made for a circular crown; however, a circular crown
can be defined in most cases as a parabola with negligible error.
PARABOLIC CROWN
The program has the capacity for only one parabolic roadway crown,
and all points outside the range of the parabolic surface will be leveled
off from the edge or extent of the parabola. The profile grade control
line is assumed to be along the crown point, i.e., apex of the parabola.
The parabolic crown is assumed to be symmetrical about a vertical axis
through the parabola apex.
Data columns 45-79 and 5-12 of the input form should be ignored
since no data is required in these spaces. Also, the Superelevation Data
(6 in c.c. 1) which follows the Crown and Lane Definitions is not
required and should be completely ignored. Following is the required
input data for a parabolic crown.
1.
Crown Code (c.c. 2-4).
In order to indicate to the computer the type of finished grade
surface the program is to consider, a Crown Code must be given in
data columns 2-4 of the input form. If the roadway crown is
parabolic, the Crown Code required is “PAR.”
2.
Distance from Crown to R/L Gutter (c.c. 13-20).
(or m).
Form:
xxxx.xxxx feet
This dimension is the distance from the apex of the parabola to
the extent of the parabolic surface, usually the gutter line. The
distance is measured perpendicular to the center line of the bridge.
- 38 -
This distance is assumed to be the same for both left and right
sides of the bridge and should never be given a negative value, nor
a value of zero. A negative value is meaningless, and a zero
dimension indicates a level crown which can be defined by an easier
method.
- 39 -
3.
)R from ML to Crown (c.c. 21-28). Form: xxxx.xxxx feet (or m).
This dimension is the distance from the mainline (survey
control line) to the apex (crown point) of the parabolic crown. The
distance is measured perpendicularly to the center line of the
bridge. This dimension may be negative, zero, or of positive
magnitude. Therefore, the survey line is not required to be along
the crown point of the surface. If the distance from the mainline
to the crown point is toward the origin, the dimension is negative;
otherwise (away from origin), the dimension is positive. Probably
in most cases the survey line will be along the center line of the
crown surface and, therefore, this dimension will usually be zero.
4.
Distance from Crown to Control Point (c.c. 29-36).
Form:
xxxx.xxxx feet (or m).
This dimension is the perpendicular distance (horizontal) from
the crown point to a point on the parabolic surface at which the
vertical ordinate (drop from crown point) of the curve is known.
This usually turns out to be the gutter line since most parabolic
crowns are detailed at this point. This distance should never be
negative or zero.
5.
Drop from Crown to Control Point (c.c. 37-44).
(or cm).
Form:
xxxx.xxxx inches
This dimension is the vertical ordinate from the crown point to
the point on the surface at the dimension, "Distance From Crown To
Control Point". This dimension should always be given in INCHES. A
value of zero should not be used because this would define a level
crown. A negative value will produce a concave parabola (sag), and
a positive value will produce a convex parabola (hump).
Parabolic Crown Example
An example of a parabolic crown roadway and the required input data
is shown on the following page.
- 40 -
EXAMPLE 4-1.
PARABOLIC CROWN
This example shows a typical
parabolic roadway crown and the
input data requirements. Note
that if the origin had been to the
right of the mainline, the
dimension from the mainline to the
crown point (4 feet) would have
been positive.
FORM OF INPUT
- 41 -
SUPERELEVATION
The program has the capacity for six lanes of superelevation which are
grouped into two bands, each containing three adjoining lanes. Each band is
controlled independently by a pivot line; therefore, the bands will not
necessarily be adjoining. However, the vertical curve data is the same for
both pivot lines. Three lanes are always associated with each pivot line even
though only one or two may actually exist. When the bridge is being defined
as superelevated, it is required that at least one pivot line and three lanes
be defined. If three lanes are not sufficient, then two pivot lines and six
lanes must be defined. Each pivot line can have no more, or less, than three
lanes. When lanes that do not actually exist must be defined, they
conveniently can be given a width of zero, thus effectively eliminating the
lanes.
The innermost (nearest to origin) band of three lanes and pivot line are
defined on the left side of the input form (c.c. 5-44), and the outermost
(furthest from origin) band of three lanes and pivot line are defined on the
right side of the input form (c.c. 45-79). If only three lanes of
superelevation are to be defined, the data to define these lanes should always
be entered on the left side of the form, even though all lanes may be outside
the mainline. The terms "inside" and "outside" used on the input form do not
refer to the mainline but rather to the relative position of the bands to the
origin. For instance, both bands of superelevated lanes may be totally inside
(toward origin) the mainline or outside (away from origin) the mainline.
The width and position of the lanes of superelevation are defined by
giving the perpendicular or radial distances from the mainline to the edges of
the lanes. The distances are negative if they are measured toward the origin
from the mainline, and positive if they are measured away from the origin from
the mainline. All lanes are assumed to be of constant width throughout the
range of the problem, i.e., lanes with varying widths are not allowed.
However, the width of any lane may be different from the width of any other
lane. The pivot line may be in any one of its associated three lanes of
superelevation; however, the pivot line must not be located outside the three
lanes.
The position of the mainline relative to the two bands of superelevation
is not restricted. That is, the mainline can be outside, inside, between, or
within the two bands of superelevation. If only one band of three lanes is
defined, the relative position of the mainline is likewise unrestricted.
Each lane of superelevation may have a constant or varying (commonly
called transition) rate of superelevation which is independent of any other
lane. The superelevation rates and transition input data requirements are
discussed on page 42. Following is the input data required to define the
lanes of superelevation.
- 42 -
1.
Crown Code (c.c. 2-4).
In order to indicate to the program that the crown is
superelevated, this space should be left blank, i.e., no particular
code is required to define a superelevated roadway.
2.
)R to Begin Inside S.E. (c.c. 5-12). Form: xxxx.xxxx feet (or m).
This dimension is the distance from the mainline to the inside
edge of the innermost (nearest to origin) lane of superelevation.
This distance should always be given on the input form when the
roadway is superelevated. The innermost lane will be defined as
lane one (1) for the purpose of explanation, and each subsequent
lane, moving outward, will be assigned a number in like sequence.
3.
S.R. 1 (c.c. 13-20).
Form:
xxxx.xxxx feet (or m).
The "S.R.1" dimension is the distance from the mainline to the
outside edge of the innermost lane (lane one) and, therefore, to the
inside edge of the adjoining lane (lane two) of superelevation.
This dimension is always required with a superelevated roadway crown
and should never be less than the dimension “)R to Begin Inside
S.E.,” i.e., overlapping lanes would result in this case. Note that
if two dimensions, “S.R.1” and “)R to Begin Inside S.E.,” are made
equal, the width of lane one will be zero and, in essence, lane one
will not exist.
4.
Inside Pivot (c.c. 21-28).
Form:
xxxx.xxxx feet (or m).
This dimension is the distance from the mainline to the
innermost pivot line. This pivot point must be in lane one, two or
three. Since this pivot point must be within the innermost band of
superelevated lanes, the "Inside Pivot" dimension should not be less
than the “)R to Begin Inside S.E.” dimension, nor greater than the
"S.R.3" dimension. The pivot point is that point on the
superelevated surface where the Vertical Curve Data holds true.
This point or line is also commonly called the “profile grade line.”
This dimension should always be given a value on the input form.
As mentioned before, the bridge roadway may have two pivot
lines (twin bridges, for instance). The pivot line entered here is
the one nearest the origin and, in the case of only three lanes, the
only pivot line that needs to be defined.
5.
S.R. 2 (c.c. 29-36).
Form:
xxxx.xxxx feet (or m).
- 43 -
The "S.R. 2" dimension is the distance from the mainline to the
outside edge of lane two and, therefore, to the inside edge of the
outside adjoining lane (lane three). This dimension should always
be defined, and the value of the dimension must never be less than
the "S.R. 1" dimension. If the dimensions “S.R. 1” and “S.R. 2” are
made equal, the width of lane two would then be zero and, therefore,
lane two would not actually exist.
6.
S.R. 3 (c.c. 37-44).
Form:
xxxx.xxxx feet (or m).
The “S.R. 3” dimension is the distance from the mainline to the
outside edge of lane three. This dimension defines the outer limit
of the innermost (or only) bend of superelevated lanes. The “S.R.
3” dimension can be made equal to the “S.R. 2” dimension to
effectively eliminate lane three, but the value of “S.R. 3“ should
never be less than “S.R. 2.” The “S.R. 3” dimension should always
be defined on the input form with superelevated roadways.
The preceding dimensions are required to define the position of the
inner band (three lanes) of superelevation. If these three lanes are
adequate to describe fully the roadway surface, the outer band of three
lanes need not be defined, i.e., the remainder (c.c. 45-79) of the input
data line should be ignored (left blank). However, sometimes more than
three lanes of superelevation, or two pivot lines, are required to
describe the roadway surface adequately. In this case, the outer band of
three superelevated lanes can be used as follows:
7.
)R to Begin Outside S.E. (c.c. 45-51). Form: xxx.xxxx feet (or
m).
This dimension is the distance from the mainline to the inside
edge of the innermost lane of the outer band of superelevated lanes
and, therefore, the inside limit of the outer band. This innermost
lane of the outer band will be lane four. Note that lanes three and
four are not adjoining lanes. This dimension when defined must
always be equal to, or greater than, the “S.R. 3” dimension
previously discussed.
8.
S.R. 4 (c.c. 52-58).
Form:
xxx.xxxx feet (or m).
The “S.R. 4” dimension is the distance from the mainline to the
outside edge of lane four and, therefore, to the inside edge of the
outside adjoining lane (lane 5). This distance should not be less
- 44 -
than the “)R to Begin Outside S.E.” dimension; however, the two
dimensions can be made equal in order to eliminate lane four when
desired.
9.
Outside Pivot (c.c. 59-65).
Form:
xxx.xxxx feet (or m).
This dimension is the distance from the mainline to the
outermost pivot line. Since the outside pivot point must be within
the outer band (lane 4, 5 or 6) of superelevated lanes, this
dimension should not be less than the “)R to Begin Outside S.E.”
dimension, nor greater than the “S.R. 6” dimension.
10.
S.R. 5 (c.c. 66-72).
Form:
xxx.xxxx feet (or m).
The “S.R. 5” dimension is the distance from the mainline to the
outside edge of lane five and, therefore, to the inside edge of the
outside adjoining lane (lane six). This distance should never be
less than the “S.R. 4” dimension; however, the two dimensions may be
equal in order to eliminate lane five.
11.
S.R. 6 (c.c. 73-79).
Form:
xxx.xxxx feet (or m).
The “S.R. 6” dimension is the distance from the mainline
outside edge of lane six and, therefore, the outside limit of
outermost band of superelevated lanes. This dimension may be
to the “S.R. 5” dimension in order to eliminate lane six, but
less than that dimension.
to the
the
equal
never
For a quick check of the input data (Crown and Lane Definitions)
required to define the superelevated lanes, it should be noted that all
dimensions, except the two pivot dimensions, entered on the input form
should be of increasing (or equal) magnitude from left to right.
NOTE:
Superelevation cannot be used in conjunction with Parabolic Crowns.
Superelevation Examples
Six examples of superelevation lane orientation and the required
input data are shown on the next six pages. Note that the input data are
- 45 -
also shown on the input form for further illustration. It is suggested
that these examples be studied thoroughly since this is perhaps the most
difficult aspect of the program to understand.
LEVEL CROWN
If the roadway surface is level, or the crown correction for
finished grade elevation is to be ignored, the only required input is the
Crown Code of “LVL” in data columns 2-4. The rest of the Crown and Lane
Definitions input data line should be left blank. In addition, the
Superelevation Data (6 in c.c. 1) input data lines that immediately
follow the Crown and Lane Definitions line should be completely ignored.
Note that the number and position of the lanes of superelevation are
immaterial in this instance.
- 46 -
CROWN AND LANE DEFINITIONS
EXAMPLE 5-1.
SUPERELEVATION
This example shows a cross section of the superelevated lanes of twin bridges on a divided highway.
The dimensions are assumed and symmetrical about the mainline. The actual bridge roadway surface will
probably not exist as shown; however, the purpose of this illustration is to show the relative position of
the lanes. The input data are shown below.
FORM OF INPUT
- 47 -
- 48 -
CROWN AND LANE DEFINITIONS (continued)
EXAMPLE 5-2.
SUPERELEVATION
The example given here
shows the actual roadway
surface (gutter to gutter) of
double bridges on a divided
highway.
Note that only three
lanes are required to define
the roadway surface; however,
since two pivot lines are involved, six lanes with the two
pivot lines must be given.
Lanes one, four and six, however, will be given a zero
width since they do not actually
exist.
Lane five could have been defined
as lane four or six, and lane two and
three could have been defined as lanes
one and two.
The input data is shown below.
FORM OF INPUT
- 49 -
- 50 -
CROWN AND LANE DEFINITIONS (continued)
EXAMPLE 5-3.
SUPERELEVATION
This example shows the required
input data for the case of three lanes
and one pivot line.
Note that the three
lanes are defined as the inner band of
superelevation, i.e., entered on the
left side of the input form.
In this
case, there is no outer band and the
right side of the input form (c.c. 4579) should be left blank.
All dimen-
sions in the sketch are assumed for the
purpose of illustration.
The data
entered on the input form is shown below.
FORM OF INPUT
- 51 -
- 52 -
CROWN AND LANE DEFINITIONS (continued)
EXAMPLE 5-4.
SUPERELEVATION
The example shown here consists of
two lanes of superelevation totally outside the mainline.
Note that three lanes
must be defined (lane three will be given
a width of zero), and these lanes should
be considered as the inner band for input
purposes.
Lane one and two (shown in
sketch) could have been set up as lane two
and three with lane one given a zero width.
The data given in the sketch is shown on
the input form below.
- 53 -
FORM OF INPUT
- 54 -
CROWN AND LANE DEFINITIONS (continued)
EXAMPLE 5-5.
SUPERELEVATION
The example shown here consists of only one
lane of superelevation.
However, the program
requires that a minimum of three lanes be defined.
So, lanes one and three will be given a width of
zero.
Note that lane two could have been defined
as lane one or lane three.
The outer band of super-
elevated lanes is not required in this example.
The input data is shown on the input form below.
FORM OF INPUT
- 55 -
CROWN AND LANE DEFINITIONS (continued)
EXAMPLE 5-6.
SUPERELEVATION
This example shows how the curb
face and top of sidewalk are entered
as lanes of superelevation so that
finished grade elevations may be obtained on these surface planes.
There-
fore, it will probably be of benefit
to the Engineer if he became thoroughly
familiar with this example.
Six lanes of superelevation are
required (Pivot point cannot be outside
its associated three lanes, nor can there
be overlapping lanes) and, therefore, two
pivot lines are also required.
However,
since only one pivot line actually exists,
the two pivot lines required must be defined as the same line.
This, in effect,
makes the two bands join at the pivot lines which
are at the inside edge of lane four and at the outside
edge of lane three.
of lane three.
Lane four actually will be a continuation
The input data is shown below.
- 56 -
FORM OF INPUT
- 57 -
F.
SUPERELEVATION DATA (6 in c.c. 1).
The Superelevation Data input form line is used to enter the rates
of superelevation of the various superelevated lanes. This data is not
required with Level and Parabolic Crowns and, therefore, this part of the
input form would be left blank. Two types of superelevation may be used
to describe the roadway surface: Constant or Variable (transition)
Superelevation. Constant superelevation indicates that the
superelevation rate of each lane remains constant throughout the entire
range of the problem. Transition superelevation indicates that the
superelevation rate of a lane, or lanes, varies lineally between two
known stations.
It is extremely important that the correct sign be used when
entering the superelevation rates on the input form. If the elevation of
the roadway surface increases as the perpendicular or radial distance
from the origin increases, the superelevation rate is positive. If the
elevation decreases as the distance from the origin increases, the
superelevation rate is negative. Note that the superelevation rates are
given in inches per foot. Since the input requirements are somewhat
different, the two types of superelevation will be discussed separately.
CONSTANT SUPERELEVATION
If the rate of superelevation of all lanes remains constant
throughout the entire bridge, the Superelevation Data should be defined
as Constant. Only one line of the Superelevation Data is required to
enter the necessary data.
1.
Description (c.c. 2-6)
To define Constant Superelevation, the Description Code “CONST”
should be entered on the first line of the Superelevation Data under
the Description heading.
2.
At Station (c.c. 7-16).
This part of the Superelevation Data line should be ignored,
i.e., left blank. The “At Station” data is required only when
entering transition superelevation.
3.
Superelevation Rates (c.c. 17-52).
(or m/m).
Form:
xx.xxxx inches per foot
The input form provides six columns for entering the rate of
superelevation of the lanes. The columns are headed by “S.E. n”,
where n is the lane number. For example, the superelevation rate of
lane one should be entered under the column heading “S.E. 1” (c.c.
17-22), etc. The superelevation rate should be given for each lane
- 58 -
defined (three or six) in the Crown and Lane Definitions input line.
All rates must be entered on the first line of the Superelevation
Data, i.e., same line as the Description code “CONST”. The rates of
superelevation must be given in units of inches per foot (or cm/m).
Constant Superelevation Examples
The two examples of Constant superelevation are given on the next
page for the purpose of illustration.
SUPERELEVATION DATA
EXAMPLE 6-1.
CONSTANT SUPERELEVATION
This example shows the Superelevation Data for Example
- 59 -
5-1 (page 36).
Note that the superelevation rates of the
lanes in the outer band are negative.
FORM OF INPUT
EXAMPLE 6-2.
CONSTANT SUPERELEVATION
The example given here shows the Superelevation Data
of Example 5-4 (page 39).
Note that the outer band of lanes
(4, 5 and 6) have not been defined; therefore, the rates of
lanes 4, 5 and 6 are ignored, i.e., left blank.
Lane 3 has
been defined but does not actually exist (zero width).
So,
the rate of lane 3 can be given a value of zero or left blank.
FORM OF INPUT
- 60 -
TRANSITION SUPERELEVATION
In order to define Transition Superelevation, the superelevation rate of
each defined lane is required at two or more stations. The rates of
superelevation are assumed to hold true at the defining station only and vary
lineally between the stations. It is required that the station and rate of
superelevation for each lane be given at each point where the rate of
transition changes in each lane. In other words, if the rate of transition
changes at a point in any lane, the station and superelevation rate of all the
lanes must be given at that point. The station and superelevation rates at
that station are entered on one line of the Superelevation Data. The input
form provides six lines for entering up to six stations. However, the program
capacity is ten stations. Should more than six stations be required, extra
lines may be added to the bottom of the input form. The input requirements
are as follows:
1.
Description (c.c. 2-6).
In order to indicate to the program that Transition Superelevation
is to be entered in the Superelevation Data, the Description code “START”
must be entered on the first line of the Superelevation Data under the
heading “Description.” The Description code “FINIS” is required on the
last line of data (station and superelevation rates) entered in the
Superelevation Data. The Description code should be left blank on all
lines used to enter intermediate stations, i.e., stations between the
first (beginning) station and the last (ending) station. Therefore, the
Description codes “START” and “FINIS” are entered only once. The
Description code “CONST” should not be used with Transition
superelevation. No other Description codes are valid.
2.
At Station (c.c. 7-16).
Form:
xxxx+xx.xxxx feet (or m).
This column is for entering the station of each break (change) in
superelevation transition. The initial station which is entered on the
first line must be back of the beginning of the bridge since the
superelevation rates are not known back of the initial station, i.e., the
program does not assume that the superelevation rates back of the initial
station are the same as the rates at the initial station. The last
station entered must be ahead of the end of the bridge since the
superelevation rates are not known ahead of the last station, i.e., the
program does not assume that the superelevation rates ahead of the last
station are the same as the rates at the last station.
A maximum of ten stations can be used to define the transition
sequence. However, only six lines are provided on the input form. The
stations may be of negative magnitude.
3.
Superelevation Rates (c.c. 17-52).
Form:
- 61 -
xx.xxxx inches per foot (or
m/m).
The rate of superelevation of each lane defined in the crown and
Lane Definitions input data must be given at each station of transition
break that is entered in the Superelevation Data, i.e., “At Stations.”
Six columns are provided on the input form to enter the rate of
superelevation of the lanes. The number in each heading indicates which
lane of superelevation is to be entered in that column. For example, the
superelevation rates of lane five are entered in the column headed by
“S.E. 5.”
NOTE:
Superelevation defined as Constant cannot be used in conjunction with
superelevation defined as Transition.
Transition Superelevation Examples
Four examples of the method of entering Transition superelevation on
the input data form are given on the following four pages for the purpose
of illustration only. The examples do not represent actual cases of
bridge transition.
- 62 -
SUPERELEVATION DATA (continued)
EXAMPLE 6-3.
TRANSITION SUPERELEVATION
The example shown here is the Superelevation
Data for Example 5-3 (page 38).
The entire bridge
is assumed to be located within the transition
range from station 18+00 to station 22+00.
The
sketch shows the given rates of superelevation of
each lane at the stations where the rate of transition changes.
Note that the rates of superelevation
of lanes 1 and 3 are the same at both stations (no
transition); however, it is required that these rates
be given at both stations.
The input data is shown below.
FORM OF INPUT
- 63 -
SUPERELEVATION DATA (continued)
EXAMPLE 6-4.
TRANSITION SUPERELEVATION
This example is the Superelevation
Data for Example 5-2 (page 37).
The
stations and rates of superelevation are
assumed and shown in the sketch.
The
bridge is assumed to start at station
10+50.
This is the reason that two
stations (10+00 and 11+50) with the same
rates of superelevation are required, i.e.,
the bridge began before the transition
started.
The initial station (10+00) is
an arbitrary station in this case where
the superelevation rates are constant
back of station 11+50.
However, the
initial station was required to be back
of the beginning bridge station.
A sta-
tion equal to 10+25 could have been used
for the initial station.
The input data
is shown below.
- 64 -
FORM OF INPUT
- 65 -
SUPERELEVATION DATA (continued)
EXAMPLE 6-5.
TRANSITION SUPERELEVATION
This example shows the Superelevation Data
for Example 5-5 (page 40).
Note that the super-
elevation rate is constant between station 21+00
and station 22+00, i.e., full superelevation.
However, these are stations of change (break) in
the rate of transition and, therefore, the rates
of superelevation must be given at these stations.
The bridge is assumed to be located between
station 20+00 and station 23+00.
The input data
is shown below.
- 66 -
FORM OF INPUT
- 67 -
SUPERELEVATION DATA (continued)
EXAMPLE 6-6.
TRANSITION SUPERELEVATION
This example shows the Superelevation Data
for Example 5-6 (page 41).
The top of the side-
walks slopes (lanes 1 and 6) are constant at
¼ in./ft.
The curb face slopes (lanes 2 and 5)
are constant at 80 in./ft.
The roadway (lanes 3
and 4) slopes are shown in the sketch.
For sim-
plicity, the curb and sidewalk lanes are shown
only once.
Note that when a superelevation rate
of minus eighty inches per foot is entered on the
input form, the position of the decimal must be
overridden by inserting the decimal in a data
column.
This is required because the input form
does not provide enough data columns to the left
of the implied decimal position.
The input data
is shown below.
- 68 -
FORM OF INPUT
- 69 -
LONGITUDINAL LINES
The LONGITUDINAL LINES input form is used to define longitudinal lines
that the Engineer desires to be intersected with the bents and transverse
lines of each span. This input form must always be used with each problem,
and at least one longitudinal line must be defined on the sheet. This input
form is required as the second sheet of each problem, immediately following
the LAYOUT DATA input form. Usually only one sheet of this type is required
per problem. However, on occasions the need will arise for a different set of
longitudinal lines within the same problem. For example, the number of beams
may vary from span to span. For illustration, let's assume a bridge has five
spans, and the first two spans have five beams and the remaining three spans
have four beams. A set of longitudinal lines will be used with the first two
spans and a different set of longitudinal lines with the last three spans. In
this example, the second set of longitudinal lines must immediately follow the
SPAN DATA input sheet of span two and immediately precede the SPAN DATA input
form for span three. In other words, the longitudinal lines for a span or
spans must immediately precede the input data for those spans. Whenever a set
of longitudinal lines is given in the input data of a problem, the lines
completely replace the previous longitudinal lines. Any lines common to both
sets of longitudinal lines must be redefined.
The program has the capacity for thirty (30) longitudinal lines. Each
longitudinal line is defined by entering the required input data on one line
of the input form. Note that a Sequence Number is given in data columns 2 and
3. These numbers will be assigned to the longitudinal lines. For instance,
the longitudinal line entered on the fourth line (04 in c.c. 2, 3) of the
input form will be longitudinal line number four (4). The longitudinal lines
should be defined by entering the first longitudinal line on the first input
line and continuing with one longitudinal line per input line. Lines on the
form should not be skipped, i.e., no blank lines are allowed between the
longitudinal lines defined on the form. This is required because the
longitudinal lines must be in numerical sequence.
Immediately after entering the last longitudinal line, the code “END”
must always be entered in data columns 4-6 (Type Code) of the next input line.
The total number of lines of the input form that must contain data is the
number of longitudinal lines (which may vary from one to thirty) plus one (the
line that contains the “END” code). All remaining lines of the input form
should be left blank.
The order in which the longitudinal lines are listed on the input form is
immaterial. However, as a general rule, the longitudinal lines should be
given in some sort of location sequence, i.e., from left to right, or right to
left, across the bridge. After the user becomes familiar with the program, he
will be able to give the longitudinal lines in the order that will be most
beneficial to him. The Engineer should be thoroughly familiar with the
“Distance to Previous Point” dimension (page 120) that is given in the output
data before selecting the order of the longitudinal lines.
- 70 -
- 71 -
Ten types of longitudinal lines are available to the user.
a list of the different types of longitudinal lines:
1.
Chord
2.
Arc
3.
Railing
4.
Parallel
5.
Parallel thru Intersect Ahead
6.
Parallel thru Intersect Back
7.
Curve Offset
8.
Straight Taper
9.
Curve Taper
10.
Coordinate
Following is
Following is a discussion of the input data that is common to all
longitudinal lines.
1.
Skip Code (c.c. 49).
Sometimes a longitudinal line must be defined solely for the
purpose of being a reference line, i.e., a line from which some
other longitudinal line is referred (dimensioned). In this case, it
may not be desirable to have the intersection data of this
longitudinal line in the output data. Therefore, to eliminate a
longitudinal line from the output data, the digit one (1) should be
entered in the Skip code column. Otherwise, this data column should
be left blank to obtain this intersection data in the output.
2.
Remarks (c.c. 50-60).
This space is for entering any identifying and pertinent
- 72 -
Remarks which describe each longitudinal line. These Remarks will
appear with the longitudinal line in the output data. It is
suggested that Remarks be used freely so that the longitudinal lines
may be readily recognized in the output data.
Following is a discussion of each type of longitudinal line which
includes the usage, the required input data, a sketch, and example of each
type.
- 73 -
A.
CHORD
A Chord is by definition a straight line that joins two points on a
circle. Therefore, a Chord longitudinal line is a straight line between
two points on a curve that is concentric with the mainline. The two
points that define the chord longitudinal line are the points of
intersection of the concentric circle with the two defining bents (Ahead
and Back) of each span. Therefore, the chord longitudinal line will vary
from span to span if the mainline is a circular curve, i.e., the chord
longitudinal line will not be a continuous straight line, but rather a
series of straight segments (chords). If the mainline is a tangent, the
chord becomes a continuous straight line parallel to the mainline. Note
that a chord longitudinal line is directly dependent on the type of
mainline curve (tangent or circular).
If a bridge is on a curve, it is common practice to place the beams
on chords of concentric circles with the mainline. The primary purpose
of the chord longitudinal line is to define such a beam line. A chord
longitudinal line may also be used solely as a reference line, i.e., so
other lines may be made parallel to the chord. An example of this is
when all the beams in a span are made parallel to a chord of the
centerline arc. In this case, a chord longitudinal line of the
centerline must be set up so that the beam lines may be referenced (made
parallel) to the chord. If there is no beam on the centerline arc, then
the chord is actually being used for reference only. If the mainline is
a tangent, the chord longitudinal line may be used to represent other
lines, i.e., gutter, curb, centerline, and structure limit lines.
Structure limit lines are such lines as the outside edges of the
roadway slab or the outside edge of the sidewalks, etc.
Any number (thirty or less) of chord longitudinal lines may be
defined and used in conjunction with all other types of longitudinal
lines. Following are the required input data for defining chord
longitudinal lines.
1.
Type Code (c.c. 4-6).
The code “CRD” is used to define a chord longitudinal line.
This code is required with every chord line entered on the input
form.
2.
Ref. Call (c.c. 7, 8).
The Reference Call is not required with longitudinal lines
defined as chords. The chord longitudinal line is always assumed to
be referenced from the mainline. Therefore, the Reference Call
- 74 -
should be left blank.
3.
)R from Mainline (c.c. 9-18). Form: xxxxxx.xxxx feet (or m).
This dimension is the radial or perpendicular distance from the
mainline to the concentric circular arc of which the longitudinal
line is a chord. If the concentric arc is inside (toward origin)
the mainline, the dimension is negative. If the concentric arc that
defines the chord is outside (away from origin) the mainline, this
dimension is positive.
Data columns 19-48 of the input form should be left blank when
defining a chord longitudinal line, i.e., no input data is required in
these data columns. The Skip code (c.c. 49) and Remarks (c.c. 50-80) are
discussed on page 51. An example showing how the chord longitudinal line
data is entered on the input form is shown on pages 74 and 75.
Following is a sketch showing the characteristics of the chord
longitudinal line.
- 75 -
“CRD” LONGITUDINAL LINE
B.
ARC
An arc is by definition a portion of a circular curve. Therefore,
an arc longitudinal line is a circular curve that is concentric with the
mainline. The arc line will be a continuous line throughout the range of
the bridge. However, if the mainline is a tangent, the arc longitudinal
line will actually be a straight line parallel to the mainline. Note
that the arc line is always the same type line (circular or straight) as
the mainline.
If a bridge is on a curve, it is common practice to make the curb,
gutter, and structure lines concentric with the mainline curve. These
lines can be defined as arc longitudinal lines; in addition, the
centerline or survey line (mainline) may be defined as an arc. The arc
line may be used as a reference line by a Railing longitudinal line.
Curved girders can also be represented by arc lines.
- 76 -
Any number (thirty or less) of arc longitudinal lines may be defined
and used in conjunction with all other types of longitudinal lines.
Following is the required input data for defining arc longitudinal lines.
1.
Type Code (c.c. 4-6).
The code “ARC” is used to define an arc longitudinal line.
This code is required with every arc line entered on the input form.
2.
Ref. Call (c.c. 7, 8).
The Reference Call is not required with longitudinal lines
defined as arcs. The arc longitudinal line is always assumed to be
referenced from the mainline. Therefore, the Reference Call should
be left blank.
3.
)R from Mainline (c.c. 9-18). Form: xxxxxx.xxxx feet (or m).
This dimension is the radial or perpendicular distance from the
mainline to the concentric arc. If this dimension is measured
toward the origin, the distance is negative. Otherwise, the
distance is positive (outside mainline).
Data columns 19-48 of the input form
when defining an arc line. The Skip code
80) are discussed on page 51. An example
longitudinal line data are entered on the
should always be left blank
(c.c. 49) and Remarks (c.c. 50showing how the arc
input form is shown on page 74.
On the following page is a sketch showing the characteristics of the
arc longitudinal line.
- 77 -
- 78 -
C.
RAILING
The railing line is a longitudinal line that is the same type as
some other longitudinal line from which the railing line is referenced.
For example, if a railing line is referenced to an arc longitudinal line,
the railing line will be an arc line. If a railing line is referenced to
a curve taper longitudinal line, the railing line will be a curve taper
line, etc. However, there is one characteristic of the railing line that
is different from the longitudinal line from which it is referenced.
That is, the bent and transverse lines may be intersected with a railing
line, or the bent and transverse lines may be intersected with the
longitudinal line to which the railing is referenced and then turned
radially to intersect the railing line. The sketch clearly shows this
optional feature of the railing line. The option of which intersection
the program is to consider is controlled by the bent and transverse line
input data which will be discussed on subsequent pages.
The railing line is used to enter the sidewalk railing (for railing
post spacings) and structure lines (elevations for construction) since
the sidewalk construction joints are usually radial to the gutter line.
Therefore, if a railing line is referenced to the longitudinal line that
represents the gutter line, the bent and transverse lines may be
intersected with the railing by turning radially from their intersection
with the gutter line. If both points (see sketch) of intersection are
desired in the output data, the railing or structure line must be defined
twice, i.e., once as a railing longitudinal line and again as another
type of longitudinal line (arc, curve taper, etc.). Note that when a
bent or transverse line is coded to intersect a railing without turning
radially from another longitudinal line, the bent or transverse line will
intersect all railing lines in like fashion.
Any number of railing longitudinal lines may be defined and used in
conjunction with all other types of longitudinal lines. However, some
other type of longitudinal line must always be defined when using railing
lines so that the railing lines may be referenced to the other type of
longitudinal line. Railing lines should not be referenced to chord
longitudinal lines when the mainline is a circular curve. Following is
the required input data for defining railing longitudinal lines.
1.
Type Code (c.c. 4-6).
The code “RLG” is used to define a railing longitudinal line.
This code is required with every railing line entered on the input
form.
2.
Ref. Call (c.c. 7, 8).
Form:
xx.
The Reference Call is the Sequence Number (c.c. 2-3) of the
- 79 -
longitudinal line to which the railing line is referenced. The
Reference Call must always be given when defining a railing
longitudinal line. The Reference Call must not be the Sequence
Number of a longitudinal line that is referenced (has a Ref. Call)
to some other longitudinal line. Therefore, the railing line cannot
be referenced to the following types of longitudinal lines:
1.
Railing
2.
Parallel
3.
Parallel thru Intersect Ahead
4.
Parallel thru Intersect Back
No other type of longitudinal line may be referenced to a railing
longitudinal line because the railing longitudinal line has a
Reference Call. The railing line Reference Call cannot be zero or
blank, nor can the Reference Call be greater than the total number
of longitudinal lines. In addition, the Reference Call cannot be
equal to the Sequence Number of the railing line.
3.
)R from Reference Line (c.c. 9-18). Form: xxxxxx.xxxx feet (or
m).
This dimension is the radial or perpendicular distance from the
reference line of the railing (another longitudinal line) to the
railing line. Note that the railing line is not referenced from the
mainline. If the distance is measured toward the origin from the
reference line, the dimension is negative; otherwise (away from the
origin) the dimension is positive.
Data columns 19-48 of the input form should be ignored when defining
railing longitudinal lines. The Skip code (c.c. 49) and Remarks (c.c.
50-80) are discussed on page 51. An example showing how the railing
longitudinal line data is entered on the input form is shown on page 74.
On the following page is a sketch showing the characteristics of the
railing longitudinal line.
- 80 -
NOTE: The same railing can be defined more than one time in one set of
longitudinal lines, and each time the railing is defined a different
reference line can be used. This may be advantageous when the transverse
lines turn radially from different railing reference lines to intersect
the railing line.
- 81 -
“RLG” LONGITUDINAL LINE
D.
PARALLEL
- 82 -
A parallel longitudinal line is a straight line that is parallel to
some other longitudinal line (reference line). The reference line of the
parallel longitudinal line must be a straight line, i.e., chord, straight
taper or coordinate longitudinal line. If the parallel line is
referenced to a chord longitudinal line, the parallel line will be a
series of straight lines parallel to the chord line segments. If the
parallel line is referenced to a straight taper or coordinate, the
parallel line will be a straight line continuous throughout the range of
the problem.
A parallel line cannot be referenced to a longitudinal line that is
referenced to some other longitudinal line. Therefore, the following
types of longitudinal lines cannot be used as reference lines for
parallel longitudinal lines, since each line requires a reference line or
the line is always a curve.
1.
Railing
2.
Parallel
3.
Parallel thru Intersect Ahead
4.
Parallel thru Intersect Back
5.
Curve Offset
6.
Curve Taper
A parallel line may be referenced to an arc longitudinal line provided
the mainline is a tangent throughout the range of the problem, i.e., the
arc line in this case would be a straight line.
It is common practice to make all the beams in a span on a
horizontal curve parallel for simplicity in detailing and construction.
The parallel longitudinal line can be used to define such beam lines.
However, it is important to note that the parallel lines of adjacent
spans if referenced to chords will not necessarily join at the bent that
separates the spans. Parallel lines may also be used for curb, gutter
and structure lines if the mainline is a tangent throughout the range of
the bridge.
Any number of parallel longitudinal lines may be defined and used in
conjunction with all other types of longitudinal lines. However, some
other type of longitudinal line must always be defined when using
parallel lines so that the parallel lines can be referenced to the other
- 83 -
type of longitudinal line. Following is the required input data for
defining parallel longitudinal lines.
1.
Type Code (c.c. 4-6).
The code “PAR” is used to define a parallel longitudinal line.
This code is required with every parallel line entered on the input
form.
2.
Ref. Call (c.c. 7, 8).
Form:
xx.
The Reference Call is the Sequence Number of the longitudinal
line to which the parallel line is referenced (parallel to). The
Reference Call must always be given when defining a parallel
longitudinal line, i.e., it cannot be zero or left blank. The
Reference Call cannot be greater than the total number of
longitudinal lines, nor equal to the Sequence Number of the parallel
line.
3.
)R from Reference Line (c.c. 9-18). Form: xxxxxx.xxxx feet (or
m).
This dimension is the perpendicular (normal) distance from the
reference line of the parallel line (another longitudinal line) to
the parallel line. Note that the parallel line is not referenced
(dimensioned) from the mainline. If the distance is measured toward
the origin from the reference line, the dimension is negative;
otherwise (away from the origin), the dimension is positive.
Data columns 19-48 of the input form
parallel longitudinal lines. See page 51
code (c.c. 49) and Remarks (c.c. 50-80).
parallel longitudinal line input data are
shown on page 77.
should be ignored when defining
for a discussion of the Skip
An example showing how the
entered on the input form is
On the following page is a sketch showing the characteristics of the
parallel longitudinal line.
- 84 -
- 85 -
“PAR” LONGITUDINAL LINE
- 86 -
E.
PARALLEL thru INTERSECT AHEAD.
This type of longitudinal line, which will be coded “PLA,” is a
straight line parallel to some other longitudinal line (reference line).
The position of the PLA longitudinal line is determined by the
intersection of a concentric circle and the Ahead bent. The radial
distance from the mainline to the concentric circle that defines the PLA
line is the sum of the “)R” dimensions of the reference line and the PLA
line. Note that the PLA longitudinal line is not a chord line because
the intersection of the PLA line and Back bent is not the same point as
the intersection of the concentric circle with the Back bent.
The reference line of the PLA longitudinal line must be a straight
line, i.e., chord or straight taper longitudinal line. If the PLA line
is referenced to a chord line, the PLA line will be a series of straight
lines parallel to the chord segments. If a straight taper is used as a
reference line, the PLA line will be a straight line continuous
throughout the range of the problem. A coordinate longitudinal line
should not be used as a reference line for a PLA longitudinal line. The
PLA line may only be referenced to chord, straight taper and arc (when
mainline is a tangent throughout range of bridge only) longitudinal
lines.
It is common practice to make all beams in a span parallel to some
reference line whenever the span is in a horizontal curve. The PLA line
can be used to define such beam lines. The PLA lines can be used in
conjunction with PIB longitudinal lines (see page 75) in order to make
the parallel lines of adjacent spans meet at a common point at the bent
common to both spans.
Any number of PLA longitudinal lines may be defined and used in
conjunction with all other types of longitudinal lines. Note that some
other type of longitudinal line must always be defined for reference.
Following is the required input data for defining PLA longitudinal lines.
1.
Type Code (c.c. 4-6).
The code “PLA” is used to define a Parallel thru Intersect
Ahead longitudinal line. This code is required with every PLA line
entered on the input form.
2.
Ref. Call (c.c. 7, 8).
Form:
The Reference Call is
line to which the PLA line
Reference Call must always
line, i.e., cannot be zero
xx.
the Sequence Number of the longitudinal
is referenced (parallel to). The
be given when defining a PLA longitudinal
or left blank. The Reference Call cannot
- 87 -
be greater than the total number of longitudinal lines, nor equal to
the Sequence Number of the PLA line.
- 88 -
3.
)R from Reference Line (c.c. 9-18). Form: xxxxxx.xxxx feet (or
m).
This dimension is the radial distance from the concentric
circle that defines the reference line to the concentric circle that
locates the intersection of the PLA line with the Ahead bent. If
the distance is measured toward the origin, the dimension is
negative. If the distance is measured away from the origin, the
dimension is positive.
Data columns 19-48 of the input form should be left blank when
defining PLA longitudinal lines. See page 51 for a discussion of the
Skip code (c.c. 49) and Remarks (c.c. 50-80). An example showing how the
PLA longitudinal line input data is entered on the input form is shown on
page 76.
Following is a sketch showing the characteristics of the PLA
longitudinal line.
- 89 -
“PLA” LONGITUDINAL LINE
F.
PARALLEL thru INTERSECT BACK
This type of longitudinal line, which will be coded “PIB,” is a
straight line parallel to some other longitudinal line (reference line).
The position of the PIB longitudinal line is determined by the
intersection of a concentric circle and the Back bent. The radial
distance from the mainline to the concentric circle that defines the PIB
line is the sum of the “)R” dimensions of the reference line and PIB
line. Note that the PIB longitudinal line is not a chord line because
the intersection of the PIB line and Ahead bent is not the same point as
the intersection of the concentric circle with the Ahead bent.
The reference line of the PIB longitudinal line must be a straight
line, i.e., chord or straight taper longitudinal line. If the PIB line
is referenced to a chord line, the PIB line will be a series of straight
lines parallel to the chord segments. If a straight taper is used as a
reference line, the PIB line will be a straight line continuous
throughout the range of the problem. A coordinate longitudinal line
should not be used as a reference line for a PIB longitudinal line. The
PIB line may only be referenced to chord, straight taper and arc (only
when mainline is a tangent throughout range of bridge) longitudinal
lines.
It is common practice whenever the span is in a horizontal curve to
make all beams in a span parallel to some reference line. The PIB lines
can be used to define such beam lines. The PIB lines can be used in
conjunction with PIA longitudinal lines (see page 75) in order to make
the parallel lines of adjacent spans meet at a common point at the bent
common to both spans.
- 90 -
Any number of PIB longitudinal lines may be defined and used in
conjunction with all other types of longitudinal lines. Note that some
other type of longitudinal line must always be defined for reference.
Following is the required input data for defining PIB longitudinal lines.
1.
Type Code (c.c 4-6).
The code “PIB” is used to define a Parallel thru Intersect Back
longitudinal line. This code is required with every PIB line
entered on the input form.
2.
Ref. Call (c.c. 7, 8).
Form:
xx.
The Reference Call is the Sequence Number of the longitudinal
line to which the PIB line is referenced (parallel to). The
Reference Call must always be given when defining a PIB longitudinal
line, i.e., cannot be zero or left blank. The Reference Call cannot
be greater than the total number of longitudinal lines nor equal to
the Sequence Number of the PIB line.
- 91 -
3.
)R from Reference Line (c.c. 9-18). Form: xxxxxx.xxxx feet (or
m).
This dimension is the radial distance from the concentric
circle that defines the reference line to the concentric circle that
locates the intersection of the PIB line with the Back bent. If the
distance is measured toward the origin, the dimension is negative.
If the distance is measured away from the origin, the dimension is
positive.
Data columns 19-48 of the input form should be left blank when
defining PIB longitudinal lines. See page 51 for a discussion of the
Skip code (c.c. 49) and Remarks (c.c. 50-80). An example showing how the
PIB longitudinal line input data is entered on the input form is shown on
page 76.
Following is a sketch showing the characteristics of the new PIB
longitudinal line.
- 92 -
“PIB” LONGITUDINAL LINE
G.
CURVE OFFSET
A curve offset longitudinal line is a circular curve that is
independent of the mainline, i.e., not concentric with the mainline. The
curve offset line is a continuous curve throughout the range of the
problem. The curve offset is always referenced from the mainline. The
mainline can be a circular curve or tangent; that is, a curve offset can
be referenced from a tangent mainline as well as a circular mainline.
Occasionally, a portion of one side of a bridge will be on a curve
that is not concentric with the mainline; for instance, when a ramp or
lane separates from the mainline roadway. The curve offset longitudinal
line can be used to define curb, gutter and structure lines in such a
portion or side of the bridge. The program does not have the capacity to
compute a chord of the curve offset longitudinal line. However, the
coordinates of the intersections of the curve offset lie with the bents
of each span and can be used to define longitudinal lines (coordinate
lines) in another run of the problem. Therefore, beams can be set up as
chords of curve offsets by running the program twice.
Any number (thirty or less) of curve offset longitudinal lines may
be defined and used in conjunction with all other types of longitudinal
lines. Following is the required input data for defining curve offset
longitudinal lines.
1,
Type Code (c.c. 4-6).
- 93 -
The code “COS” is used to define a curve offset longitudinal
line. This code is required with every curve offset line entered on
the input data form.
2.
Ref. Call (c.c. 7, 8).
The Reference Call is not required with longitudinal lines
defined as curve offsets. The curve offset longitudinal line is
always assumed to be referenced from the mainline. Therefore, the
Reference Call should be left blank.
3.
)R from Mainline (c.c. 9-18). Form: xxxxxx.xxxx feet (or m).
This dimension is the common radial distance from the mainline
to the curve offset line when the mainline is a curve. When the
mainline is a tangent, this distance is the perpendicularr distance
from the mainline to a tangent of the curve offset that is parallel
to the mainline. Actually, both definitions given for this
dimension are synonymous. If the distance is measured toward the
origin, the dimension is negative. Otherwise (away from origin),
the dimension is positive.
4.
Mainline Control Station (c.c. 19-28).
m).
Form:
xxxx+xx.xxxx feet (or
The Control Station is the mainline station of the point where
the “)R from Mainline” dimension is given. This station is always
required when defining curve offset longitudinal lines. The Control
Station may be of negative magnitude, and this station is completely
independent of any other station given in the input data. Note that
this station must be a mainline station and not a station along the
curve offset line. A tangent to the curve offset line at the
Control Station will be parallel to a tangent of the mainline curve
at the Control Station.
5.
Radius (c.c. 29-38).
Form:
xxxxxx.xxxx feet (or m).
Enter in this column the radius of the curve offset
- 94 -
longitudinal line. This dimension should always be given and it is
required that this dimension be greater than zero.
Data columns 39-48 of the input form should be left blank when
defining a curve offset longitudinal line. The Skip code (c.c. 49) and
Remarks (c.c. 50-80) are discussed on page 51. An example showing how
the curve offset longitudinal line data are entered on the input form is
shown on page 78.
Following is a sketch showing the characteristics of the curve
offset longitudinal line.
“COS” LONGITUDINAL LINE
- 95 -
H.
STRAIGHT TAPER
A straight taper is defined as a line whose distance from the
mainline varies lineally. If the main line is a circular curve, the
straight taper varies lineally from a tangent to the mainline curve.
Therefore, the straight taper longitudinal line will always be a straight
line that is continuous throughout the range of the bridge and which is
completely independent of a change in the mainline from tangent to curve
or vice versa.
Occasionally, one side of a bridge will be on a straight taper from
the mainline, i.e., the beginning of a new lane or ramp, etc. The
straight taper longitudinal line can be used to represent the curb,
gutter and structure lines in this case. In addition, straight taper
lines may be used to enter splayed beams, i.e., non-parallel beams.
There is a special case of straight taper line usage when the rate
of taper is set equal to zero. In this case, the straight taper is
parallel to the main line. For example, assume a four-span bridge with a
short portion of one end span in a circular curve — the rest of the
bridge is on a tangent. The aim is to make this a continuous unit and
extend the beams straight into the curve portion. The beams can be set
up as straight taper longitudinal lines with a zero taper rate. No other
type of longitudinal line can be set up for this type of usage except the
coordinate longitudinal line. However, to define a coordinate line, the
coordinates have to be computed, making this alternative somewhat
cumbersome.
Any number (thirty or less) of straight taper longitudinal lines may
be defined and used in conjunction with all other types of longitudinal
lines. Following are the required input data for defining straight taper
longitudinal lines.
1.
Type Code (c.c. 4-6).
The Code “STP” is used to define a straight taper longitudinal
line. This code is required with every straight taper line entered
on the input data form.
2.
Ref. Call (c.c. 7, 8).
The Reference Call is not required with longitudinal lines
defined as straight tapers. Since the straight taper line is always
referenced from the main line, the Reference Call should be left
blank.
- 96 -
3.
)R from Mainline (c.c. 9-18). Form: xxxxxx.xxxx feet (or m).
This dimension is the distance from the mainline to a point on
the straight taper line and is measured normal (perpendicular) to
the mainline (or mainline tangent). If the distance is measured
toward the origin, the dimension is negative; otherwise, the
dimension is positive.
4.
Mainline Control Station (c.c. 19-28).
m).
Form:
xxxxxx.xxxx feet (or
The Control Station is the mainline station of the point where
the “)R from Mainline” dimension is given. This station is always
required when defining straight taper longitudinal lines. The
Control Station may be of negative magnitude; this station is
completely independent of any other station given in the input data.
Note that this station must be on the mainline and not a station
along the straight taper line.
5.
Taper Rate (cc. 29-38).
Form:
xxxxxx.xxxx ft./100 ft (or m/100 m).
The Taper Rate is the variation of the distance from the
mainline to the straight taper line per one hundred feet along the
mainline. The Taper Rate is actually the tangent of the angle
between the mainline and straight taper line multiplied by one
hundred. The Taper Rate sign convention is shown in the sketch
below.
Data columns 39-48 of the input form should be left blank when
defining a straight taper longitudinal line. The Skip code (c.c. 49) and
Remarks (c.c. 50-80) are discussed on page 51. An example showing how
the straight taper longitudinal line data is entered on the input form is
shown on page 77.
Following is a sketch showing the characteristics of the straight
taper longitudinal line.
- 97 -
“STP” LONGITUDINAL LINE
I.
CURVE TAPER
A curve taper longitudinal line is a curved line that varies
lineally from a circular curve. This actually makes the curve taper line
an Archimedes spiral, i.e., the radius varies lineally with the distance
along a circular arc. This takes the form: r = k × 2, in polar
coordinates. The curve taper will be continuous throughout the range of
the bridge and, therefore, is completely independent of any change in the
mainline from curve to tangent or vice versa.
The curve taper longitudinal line can be used to represent curb,
gutter, and structure lines if a portion of the bridge is in this type of
taper. Occasionally, this type of taper is used when the roadway is
being widened in a circular curve. A railing line can be referenced to a
curve taper line. The program does not have the capacity to compute a
chord of the curve taper longitudinal line. However, the coordinates of
the intersection of the curve taper line with the bents of each span can
be used to define longitudinal lines (coordinate lines) in another run of
the problem. Therefore, beams can be set up as chords of curve taper
longitudinal lines by running the program twice.
- 98 -
Any number (thirty or less) of curve taper longitudinal lines can be
used in conjunction with all other types of longitudinal lines.
Following is the required input data for defining curve taper
longitudinal lines.
1.
Type Code (c.c. 4-6).
The code “CTP” is used to define a curve taper longitudinal
line. This code is required with every curve taper line entered on
the input data form.
2.
Ref. Call (c.c. 7, 8).
The Reference Call is not required with longitudinal lines
defined as curve tapers. The curve taper longitudinal line is
always assumed to be referenced from the mainline. Therefore, the
Reference Call should be left blank.
3.
)R from Mainline (c.c. 9-18). Form: xxxxxx.xxxx feet (or m).
This dimension is the radial distance from the mainline to a
point on the curve taper longitudinal line. This distance must be
given at a known station. If the distance is measured toward the
origin, the dimension is negative. Otherwise, the dimension is
positive.
4.
Mainline Control Station (c.c. 19-28).
Form:
xxxx+xx.xxxx feet (or
m).
The Control Station is the mainline station of the point where
the “)R from Mainline” dimension is given. This station is always
required when defining curve taper longitudinal lines. The Control
Station is completely independent of any other station given in the
input data and may be of negative magnitude. Note that this station
must be a mainline station and not a station along the curve taper
line. This station must be in a circular curve mainline, i.e., the
mainline cannot be tangent at this station. Note that a tangent to
the mainline curve of any station will be parallel to a tangent to
the curve taper at the same station.
5.
Taper Rate (c.c. 29-38).
m).
Form:
- 99 -
xxxxxx.xxxx ft./100 ft (or m/100
The Taper Rate is the change in radius of the curve taper
longitudinal line per one hundred feet along the mainline. The
Taper Rate must always be defined when entering curve taper
longitudinal lines, i.e., cannot be left blank or given a value of
zero. If the radius of the curve taper line increases as the
stations increase, the taper rate is positive. If the radius of the
curve taper line decreases as the stations increase, the taper rate
is negative.
Data columns 39-48 of the input form should be left blank when
defining a curve taper longitudinal line. The Skip code (c.c. 49) and
Remarks (c.c. 50-80) are discussed on page 51. An example showing how
the curve taper longitudinal line data are entered on the input form is
shown on page 78.
Following is a sketch showing the characteristics of the curve taper
longitudinal line.
- 100 -
“CTP” LONGITUDINAL LINE
J.
COORDINATE
A coordinate longitudinal line is a straight line throughout the
range of the bridge and, therefore, is completely independent of the
mainline. The coordinate line is defined by entering the X and Y
coordinates of two points on the coordinate line. The coordinates are
assumed, or computed by hand or another program. Note that this program
can be used to compute coordinates that can be used to define coordinate
longitudinal lines in subsequent runs of the problem.
This type of longitudinal line can be used to represent most any
kind of straight line on the bridge, provided, of course, the coordinates
are known, i.e., curbs, gutter, beam and structure lines.
Any number (thirty or less) of coordinate longitudinal lines may be
defined and used in conjunction with all other types of longitudinal
lines. Following is the required input data for defining coordinate
longitudinal lines.
1.
Type Code (c.c. 4-6).
The code “COR” is used to define a coordinate longitudinal
line. This code is required with every coordinate line entered on
the input data form.
2.
Ref. Call (c.c. 7, 8).
The Reference Call is not required with longitudinal lines
defined as coordinate lines. Therefore, the Ref. Call should be
left blank.
3.
Coordinates (c.c. 9-48).
Form:
xxxxxx.xxxx feet (or m).
Note that the input form has a separate heading (format) for
- 101 -
use when entering a coordinate defined longitudinal line. The Xcoordinate of point one is entered in c.c. 9-18, and the Ycoordinate of point one is entered in c.c. 19-28. The X-coordinate
of point two is entered in c.c. 29-38, and the Y-coordinate of point
two is entered in c.c. 39-48.
The Skip code (c.c. 49) and Remarks are discussed on page 51. An
example showing how the coordinate longitudinal line data are entered on
the input form is shown on page 77.
On the following page is a sketch showing the characteristics of the
coordinate longitudinal line.
- 102 -
“COR” LONGITUDINAL LINE
- 103 -
LONGITUDINAL LINES
EXAMPLE 7-1.
CRD,ARC,RLG
This example shows the longitudinal line input data for a twospan bridge with four beams.
The
beams are placed on chords of circles
concentric to the mainline.
The
railing and gutter lines will also
be defined in this example for
illustration.
Note that the main-
line (survey line) is also entered
as a longitudinal line.
The dimen-
sions required to define the longitudinal lines are shown in the sketch.
Shown below is the longitudinal line
input data entered on the input form.
FORM OF INPUT
- 104 -
LONGITUDINAL LINES (continued)
EXAMPLE 7-2.
PIA,PIB,CRD
In this example, the beams of each
span are placed parallel to a chord of
the centerline arc.
In order for the
beams' lines to meet at the intermediate
bent, the beams of span “n” must be
coded as PIA longitudinal lines and the
beams of span “n + 1” must be coded as
PIB longitudinal lines.
For the purpose
of illustration, two sets of longitudinal
lines will be given.
The first set will be
used with span “n”, and the other set used
with span “n + 1”.
The input data are shown
on the following page.
However, it should be noted that all the
longitudinal lines could be given in one set.
For
example, beam A could be defined twice in the same group
of longitudinal lines, as a PIA and PIB longitudinal line.
- 105 -
In this case, the PIA longitudinal lines should be skipped when defining the
bents and T-lines of span “n + 1”, and the PIB longitudinal lines would be
skipped in span “n”.
This would keep the output data from containing extraneous information.
- 106 -
EXAMPLE 7-2.
Continued
FORM OF INPUT
These longitudinal lines are used with span “n” only.
This input should immediately precede span “n” (assuming the
lines are not common to some previous span).
These longitudinal lines are used with span “n+1”
only. This input would follow immediately behind the span
“n” input data and immediately precede the input data of
span “n+1”.
- 107 -
LONGITUDINAL LINES (continued)
EXAMPLE 7-3.
STP,PAR,COR
This example shows a threespan continuous unit that has a
portion of the last span in a
curve.
The tangent portion has
been set up parallel to the
X-axis, and the beams are to
extend straight into the curve
portion.
The beams will be set
up as PAR longitudinal lines that
are parallel to the mainline tangent.
The mainline will be defined
as an STP longitudinal line for
reference.
For the purpose of illus-
tration, the mainline tangent will also
be defined as a COR longitudinal line.
The input data are shown below.
- 108 -
FORM OF INPUT
- 109 -
LONGITUDINAL LINES (continued)
EXAMPLE 7-4.
CTP,COS,ARC
This example shows a span in a
bridge of varying width.
The left
side is controlled by a curve taper,
and the right side is controlled by
a curve offset.
The CTP and COS
longitudinal lines will be used to
define the gutter lines.
Note that
the curve taper and curve offset are
tangent to the concentric arc at their
Control Station.
The distances, etc.
required to define the longitudinal
lines are shown in the sketch.
Below
is shown the input form with the required input data.
FORM OF INPUT
- 110 -
- 111 -
SUMMARY OF LONGITUDINAL LINE INPUT REQUIREMENTS
DATA COLUMNS
TYPE
(c.c.46)
7 - 8
9 - 18
19 - 28
29 - 38
)R From
ARC
Mainline.
PIA
PIB
PAR
Number of
)R From
Ref.line.
Ref. line.
Number of
)R From
Ref.line.
Ref. line.
Number of
)R From
Ref.line.
Ref. line.
Number of
Normal dis-
Ref.line.
tance from
50 - 80
Skip Code
Remarks
Skip Code
Mainline.
RLG
49
(1 or
blank)
)R From
CRD
39 - 48
Remarks
(1 or
blank)
Remarks
Remarks
Remarks
Remarks
Ref. line.
STP
)R From
Station of
Mainline.
)R dimen-
Taper Rate
Skip Code
(1 or
blank)
sion.
- 112 -
Remarks
CTP
)R From
Station of
Mainline.
)R dimen-
Taper Rate
Skip Code
(1 or
blank)
sion.
COS
COR
Remarks
)R From
Station of
Mainline.
)R dimen-
X-Coordi-
Y-Coordi-
X-Coordi-
Y-Coordi-
nate of
nate of
nate of
nate of
point 1.
point 1.
point 2.
point 2.
Radius
Skip Code
Remarks
(1 or
blank)
Skip Code
Remarks
(1 or
blank)
SPAN DATA
The SPAN DATA input form is used to define each span of the bridge. One input sheet is required for
each span. However, exceptions can occur if more than eleven transverse lines are used in a span, or if
several spans are combined and entered as one span. The program computes the output data in units of spans;
that is, the first span is computed and the answers printed before the second span is considered, etc.
Therefore, there is no limitation on the maximum number of spans that can be processed with each problem.
Normally, the SPAN DATA input form(s) should always be used. However, when the coordinates of all the
points on the bridge are known, i.e., computed by some other method, the COORDINATE input form can be used
in lieu of the SPAN DATA form. Note that the SPAN DATA input can also be used in conjunction with the
COORDINATE input data.
The solution for each span is completely independent of the solution for any other span. The spans can
be given in any sequence, but it is common practice to enter the spans in the same order that they are
positioned in the bridge.
Each span consists of two bents and from zero to twenty transverse lines. Actually, the bents are
transverse lines but, since the bent lines define the span, the bent and transverse lines must be defined
separately. The bents and transverse lines of each span are intersected with each longitudinal line unless
a line is coded to skip the intersection.
The Span Input Data consists of the following data:
- 113 -
1.
Span Identification (one input line).
2.
Bent Data (two input lines).
3.
T-Line Data (zero to twenty* input lines).
The data listed above will be discussed in detail on the following pages.
Examples and sketches will also be given.
* An exception will be noted in the discussion of the T-Lines.
A.
Span Identification (8 SPAN in c.c. 1-5).
The Span Identification consists of data pertinent to the processing
of the span and Remarks that identify the span. The Span Identification
data are entered on one line of the input form, and this line is the
first input line of the SPAN DATA input form. The Span Identification
should always contain data except as noted on page 95. An example of the
Span Identification input is not given since it is felt that the
instructions are adequate. Following are the input data requirements.
1.
Span Number (c.c. 7, 8).
Form:
- 114 -
xx
Enter in this space the span number. Either numbers or
characters may be used, i.e., 1, 2, 3L, 4R, etc. This number will
be given in the output data of the span. There is no sequence check
on the order of the Span Numbers.
2.
Number of Transverse Lines (c.c. 10, 11).
Form:
xx
The Number of Transverse Lines that are going to be defined in
the span should be given in this space. If no T-lines are going to
be defined, this number may be left blank or given a value of zero.
Since the maximum number of T-lines is twenty per span, this number
cannot exceed twenty. Therefore, the Number of Transverse Lines
will vary from zero (0) to twenty (20). Note that this number is
the total number of T-lines in the span and not necessarily the
number of T-lines defined on one SPAN DATA input form, i.e., two
sheets can be used when more than eleven T-lines are defined.
3.
Last Span Code (c.c. 13-16).
The code “LAST” should be entered in this space when filling in
the input data for the last span of the problem. This space should
be left blank in all preceding spans. This code indicates to the
program that no further input data is going to be given after the
present (last) span. Whenever coordinates are used as input data
(on COORDINATE input data form) after the last span, the Last Span
Code should be left blank since additional input data must be
processed.
4.
Remarks (c.c. 16-73).
This space is provided so that the Engineer can enter any
pertinent Remarks describing the span. These Remarks will appear in
the output data of the span.
5.
Code for Additional Longitudinal Lines (c.c 74-76).
Whenever another set of longitudinal lines are going to be
defined immediately after a SPAN DATA input sheet, the code “YES”
should be given in data columns 74-76 of the Span Identification.
Otherwise, these data columns can be used for Remarks. Therefore,
if “YES” is given in these data columns, the program will expect the
next sheet of input data after the span input data to be
LONGITUDINAL LINES.
B.
Bent Data (B or A in c.c. 1).
- 115 -
Two lines on the SPAN DATA input form are provided so that the two
bents that define each span can be defined. The bent that begins the
span will be referred to as the Back bent and should always be defined
first, i.e., on the input line with the letter “B” in data column one.
The bent that terminates the span will be referred to as the Ahead bent
and should always be defined next on the input line with the letter “A”
in data column one. The Back and Ahead bents must always be given when
defining a span. Note that a bent common to two spans must be defined
twice, once with each span.
Except as noted otherwise, the procedures for defining the Back and
Ahead bents are identical. Following is the input data required to
define the bents.
1.
RLG Intersect Code (c.c. 2).
This code is used to indicate to the program which point of
intersection the program is to consider when intersecting the bent
line with the railing longitudinal lines of the span. If the bent
line is to extend straight and intersect the railing lines, the
digit one (1) should be entered as the RLG Intersect Code. However,
if the bent line is to turn at the intersection of the bent line
with the reference line of the railing line and extend radially from
the reference line to intersect the railing longitudinal line, the
RLG Intersect Code should be left blank or given a value of zero.
Note that the bent line will intersect all railing longitudinal
lines in the same fashion. A sketch showing this optional point of
intersection is shown on page 58. This code has no effect on the
intersection of the bent line with other types of longitudinal
lines, nor on any longitudinal lines located between the railing
line and its reference line.
2.
Bent Number (c.c. 3, 4).
Form:
xx.
This space is for entering the number of the bent. This number
can be in numeric or alphabetic characters and will appear in the
output data.
3.
Remarks (c.c. 37-50).
This space is provided so that the user can enter any pertinent
Remarks that describe the bent. These Remarks will appear in the
output data to assist in the interpretation of the output.
4.
Longitudinal Line Skips (c.c. 51-80).
- 116 -
The Longitudinal Line Skip is used to instruct the program to
by-pass the intersection of the bent line with some particular
longitudinal line. The digit one (1) is used to indicate that the
intersection is to be skipped. Otherwise, the Longitudinal Line
Skip is left blank. For example, if the intersection of the bent
with longitudinal line four (4) is not desired in the output data,
the digit “1” should be entered in data column 54. Note that
immediately below the Longitudinal Line Skip heading there are
numbers that correspond to the longitudinal line number (1-30), and
immediately below the longitudinal line numbers are the data column
numbers (51-80).
It is important to note that if the Longitudinal Line Skip is
coded to skip a longitudinal line when defining the Ahead bent, the
length of that longitudinal line from the Back bent to the Ahead
bent will not be given in the output data. Also, when a bent is
coded to skip a longitudinal line, the “Distance to Previous Point”
dimension given in the output data will be zero in the output data
of the intersection of the bent with the next longitudinal line.
For example, the distance from the point of intersection of the bent
with longitudinal line “n-1” to the point of intersection of the
bent with longitudinal line “n+1” is not given in the output data
when longitudinal line “n” is skipped. If a longitudinal line has
been coded to skip all intersections (the digit one entered in data
column 49 of the Longitudinal Line input data) the bent Longitudinal
Line Skip for that longitudinal line is meaningless, since the bent
will not be intersected with the longitudinal in any event.
5.
Type Code (c.c. 5-8).
The Type Code is used to indicate to the program how the bent
is going to be defined. There are five codes available to the
Engineer with which the bent can be defined. They are:
1)
SKEW (Skewed at a station)
2)
PARL (Parallel to reference line at a normal distance)
3)
PSTA (Parallel to reference line at a station)
4)
PREV (Parallel to bent B at a normal distance or a station)
5)
SAME (Same as bent JA of preceding span)
- 117 -
It is left to the user to select the code and data that can be used
most conveniently to define the bent. Following is a discussion and
sketch of each Type Code, the required input data of each type, and
examples (pages 90-92) showing how the data are entered on the input
data form.
- 118 -
1.
“SKEW” Bent
A SKEW type bent is defined by giving the Skew Angle and
Station of the bent and mainline intersection. Therefore, the Skew
Angle and Station of Bent must be known before this Type Code can be
used to define a bent. This Type Code can be used to define both
the Back and Ahead bent. The SKEW code is not used exclusively to
define bents that are skewed with the bridge, i.e., the other Type
Codes can be used to define bents that are not perpendicular or
radial to the mainline. Data columns 27-36 of the input line should
be left blank when using the SKEW code. Following is the additional
input data required to define a SKEW bent.
a.
Station of Bent (c.c. 9-18).
Form:
xxxx+xx.xxxx feet (or m).
The station of the point of intersection of the bent with
the mainline should be entered in this space of the input form.
This station may be of negative magnitude.
b.
Skew Angle of Bent (c.c. 19-26).
Form:
xxx deg., xx min.,
xx.x sec.
The angle between the bent line and a line that is radial
to the mainline at the Station of Bent should be entered on the
input form as the Skew Angle of Bent. The angle is entered in
degrees, minutes, and seconds (to tenths). The sign convention
of the Skew Angle is given on page 93. A negative angle is
indicated by entering a minus sign (-) before the first
significant digit of the degrees.
- 119 -
“SKEW” BENT
2.
“PARL” Bent
A PARL type bent is defined by first defining a reference
line. The bent is defined to be parallel to this reference
line at a given normal distance from the reference line. The
reference line can be another bent or any arbitrary line;
however, the skew angle and mainline station of the reference
line must be known. The reference line will not be intersected
with any of the longitudinal lines. The Back and Ahead bents
may be defined by this Type Code. Following is the additional
input data required to define a PARL bent.
a.
Station of Reference Line (c.c. 9-18).
Form:
xxxx+xx.xxxx feet (or m).
Enter in this space the station of the intersection
of the reference line with the mainline. This station may
be of negative magnitude.
b.
Skew Angle of Reference Line (c.c. 19-26).
Form:
xxx deg., xx min., xx.x sec.
The angle between the reference line and a line
radial to the mainline at the Station of Reference Line
should be entered on the input form as the Skew Angle of
Reference Line. The angle is entered in degrees, minutes,
and seconds (to tenths). See page 93 for the Skew Angle
sign convention. A negative angle is indicated by placing
a minus sign (-) before the first significant digit of the
degrees.
- 120 -
c.
Normal Distance (c.c. 27-36).
m).
Form:
xxxxxx.xxxx feet (or
Enter in this space the Normal Distance from the
reference line to the bent line. If the bent is ahead of
the reference line, the distance is positive. Otherwise
(bent back of the reference line), the distance is
negative.
“PARL” Bent
3.
“PSTA” Bent
A PSTA type bent is defined by first defining a reference line.
The bent is defined to be parallel to this reference line at a given
station. The reference line can be another bent or any arbitrary
line; however, the skew angle and mainline station of the reference
line must be known. The reference line will not be intersected with
any of the longitudinal lines. The Back and Ahead bents may be
defined by this Type Code. Following is the additional input data
required to define a PSTA bent.
a.
Station of Reference Line (c.c. 9-18).
(or m).
Form:
xxxx+xx.xxxx feet
Enter in this space the station of the intersection of the
reference line with the mainline. This station may be of
negative magnitude.
- 121 -
b.
Skew Angle of Reference Line (c.c. 19-26).
Form:
xxx deg., xx min., xx.x sec.
The angle between the reference line and a line radial to
the mainline at the Station of Reference Line should be entered
on the input form as the Skew Angle of Reference Line. The
angle is entered in degrees, minutes, and seconds (to tenths).
See page 93 for the Skew Angle sign convention. A negative
angle is indicated by placing a minus sign (-) before the first
significant digit of the degrees.
c.
Station of Bent (c.c. 27-36).
Form:
xxxx+xx.xxxx feet (or m).
Enter in this space the station of the intersection of the
bent with the mainline. This station may be of negative
magnitude.
“PSTA” Bent
A PREV type bent can only be used to define the Ahead bent (A
in c.c. 1). The PREV code indicates that the Ahead bent (being
- 122 -
defined) is parallel to the Back bent (already defined). The Ahead
bent is defined further by giving the normal distance from the Back
bent to the Ahead bent OR (not both) the mainline station of the
Ahead bent. Data columns 19-26 of the input data line should be
left blank. Following is the additional input data required to
define a PREV bent.
a.
Station of Bent (c.c. 9-18).
Form:
xxxx+xx.xxxx feet (or m).
If the station of the Ahead bent is known (Normal Distance
is unknown), that station should be entered in this space. The
station may be of negative magnitude. If the station is not
known, the Normal Distance must be given, and this space is
left blank. If both the Station and Normal Distance are known,
either one may be given in its proper place.
b.
Normal Distance (c.c. 27-36).
Form:
xxxxxx.xxxx feet (or m).
If the Normal Distance from the Back bent to the Ahead
bent is known (Station of Bent is unknown), that distance
should be entered in this space. The distance should always be
positive since the Ahead bent is ahead of the Back bent by
definition. If the Normal Distance is not known, the Station
of Bent is given and this space is left blank.
- 123 -
“PREV” Bent (Use to define Ahead bent only)
5.
“SAME” Bent
The SAME type bent can only be used to define the Back bent (B
in c.c. 1). This code indicates that the back bent is identical to
the Ahead bent of the previous span. Therefore, this code cannot be
used to define the Back bent of the first span of the problem, i.e.,
there is no previous span of that problem. The only input data
required are the Longitudinal Line Skips and Type Code (SAME). The
other input data (RLG Intersect Code, Bent Number, Remarks, etc.)
are not required.
The SAME Type Code can be used even though a new set of
longitudinal lines may have been defined immediately before the Span
Data, i.e., the previous Ahead bent is not affected. The
Longitudinal Line Skips are required since the previous Ahead bent
skips may not be valid.
- 124 -
“SAME” Bent (Use to define Back bent only)
- 125 -
SUMMARY OF BENT INPUT DATA
Data
TYPE Code (c.c. 5-8) and Input Data
Columns
2
3,4
9-18
SKEW
PARL
PSTA
PREV
RLG INT.
RLG INT.
RLG INT.
RLG INT.
code
Code
Code
Code
Bent
Bent
Bent
Bent
Number
Number
Number
Number
Station
Station
Station
Station
of Bent
of Refer-
of Refer-
of Bent
ence Line
ence Line
if Normal
SAME
Distance
is
unknown
19-26
Skew
Skew
Skew
Angle of
Angle of
Angle of
Bent
Reference
Reference
Line
Line
Normal
Station
Normal
Distance
of Bent
Distance
27-36
from Ref-
if
Station
erence
of Bent
is
Line
unknown
37-50
Remarks
Remarks
Remarks
Remarks
51-80
Longi-
Longi-
Longi-
Longi-
Longi-
tudinal
tudinal
tudinal
tudinal
tudinal
Line
Line
Line
Line
Line
Skips
Skips
Skips
Skips
Skips
- 126 -
- 127 -
BENT DATA
EXAMPLE 8-1.
SKEW, PARL
This example shows the input data
that is required to define “SKEW”
and “PARL” type bents.
The Skew Angle
and Station of the Back bent are unknown; however, this bent is parallel
to a line that has a known (given)
Skew Angle and Station.
Therefore,
the Back bent will be defined as “PARL”
since the Normal Distance is known.
Note that the Normal Distance is negative, i.e., Station of Bent is less
than Station of Reference Line.
The
Skew Angle and Station of the Ahead
bent are known (given); therefore, the
Ahead bent can conveniently be defined
as a “SKEW” bent.
The Railing longitudinal lines and their reference line are shown for the purpose of
illustrating the RLG Intersect Code.
Note that the Back bent is coded (RLG Intersect Code = 1) to extend
straight and intersect the Railing line.
Bent 5 (Ahead) has been coded (RLG Intersect Code left blank) to
turn radially at the reference line of the Railing and extend to intersect the Railing.
Any other type (not
Railing) of longitudinal line, whether located between the Railing line and its reference line or not, is
intersected with the bent extended straight (no turn).
intersection with longitudinal line four (4).
of the Longitudinal Line Skips.
Note that both bents have been coded to skip the
This is done by entering the digit one (1) in data column 54
The input data is shown below on the input form.
- 128 -
FORM OF INPUT
- 129 -
BENT DATA (continued)
EXAMPLE 8-2.
PSTA, PREV.
This example shows the input data
that is required to define a “PSTA”
and “PREV” type bent.
The Skew Angle
of the Back bent is unknown; however,
this bent is parallel to a line that
has a known Station and Skew Angle
(given).
Therefore, the Back bent
can be defined as “PSTA” since the
Station of the bent is known (given).
The Ahead bent is at a known Station
(given) and parallel to the Back bent.
Therefore, the Ahead bent can be defined
as a “PREV” bent.
The input data is
shown on the input form below.
- 130 -
FORM OF INPUT
- 131 -
BENT DATA (continued)
EXAMPLE 8-3.
SAME, PREV
This example shows the span
(n+1) immediately after the span
(n) of Examkple 8-2.
Since the
Back bent of this span (n+1) has
already been defined as the Ahead
bent of span “n”, this bent can be
assigned as the Back bent of this
span (n+1) by using the “SAME”
code.
The only other data that
is required with the “SAME” code
is the Longitudinal Line Skips.
The Ahead bent is parallel to the
Back bent, but the Station and Skew
Angle are unknown.
However, the
Normal Distance from the Back bent
is known (given) and, therefore, the
Ahead bent can be defined as a “PREV”
type bent.
Note that the Normal Distance
is positive, i.e., the Ahead bent station
is greater than the Back bent station.
The
input data are shown on the input form below.
- 132 -
FORM OF INPUT
- 133 -
- 134 -
SKEW ANGLE (2) SIGN CONVENTION
- 135 -
C.
Transverse Lines (T-Lines).
Transverse lines are lines that normally run across the bridge and are
not classified as bent lines. The program has the capacity for twenty such
lines per span. T-Lines usually lie between the Ahead and Back bent.
However, this is not a program requirement since the T-Lines are allowed to
be outside the range of the span. Each T-Line along with the Ahead and Back
bent will be intersected with each longitudinal line and the various data of
each intersection point given in the output. T-Lines can be used to
represent most any type of transverse line. Following is a list that shows
several examples of T-Line usage, and the purpose for each usage.
1.
Centerline of bearings
The finished grade elevations (output) at the centerline of
bearings can be used for substructure elevations when adjusted for slab,
beam depth, etc. During construction, these elevations can be used to
check the top of beam elevation for any adjustment in the coping depth.
2.
Diaphragms
The length, distance from bent, and angle between the diaphragm and
various longitudinal lines, which are given in the output, can be used
for detailing purposes.
3.
Substructure lines
Other substructure lines can be used to compute elevations in order
to obtain the substructure elevations, i.e., face of substructure cap.
The face of the substructure cap in the case of the end bent can be used
in many instances to assist in computing railing post spacings.
4.
Construction joints
The finished grade elevations at the construction joints can be
used by the field Engineer during construction to set screed elevations.
5.
Splice points of beams
The finished grade elevations at the splice points can be used to
determine beam slopes. This is particularly true if a continuous unit
is used in a vertical curve or transition superelevation.
- 93 -
6.
Span division lines
The span can be arbitrarily divided by lines in order to compute
elevations for construction purposes, i.e., quarter points, third
points, tenth points, etc.
7.
Road underneath lines
The edge of paving, shoulder, etc. of the road underneath can be
entered as a T-Line of the bridge above in order to assist in computing
clearances.
The list of T-Line usage given on the preceding page is by no means
a complete list. However, the lines listed are probably used most often
and they are listed for the purpose of illustrating how and why T-Lines
are used.
The input data necessary to define each T-Line is entered on one
line of the input form (an exception will be noted later). The SPAN DATA
input form provides eleven input data lines for entering the T-Lines. If
more than eleven T-Lines are going to be entered in any one span,
additional lines can be attached to the bottom of the input form, or an
additional SPAN DATA input form can be used to enter the additional TLines. However, when an additional input form is used, the Span
Identification and Bent Data should be left blank on the second SPAN DATA
input form of the span since a new span is not being defined, i.e., used
solely to enter T-Lines. Note that when using an additonal sheet for TLines, or attaching T-Lines to the bottom of the SPAN DATA input form,
the Line Number (c.c. 2, 3) which is given on the input form will have to
be changed so that two T-Lines will not have the same number, i.e., TLines must be defined in numerical sequence.
The letter “T” is required in data column one of each T-Line input
data line. This is used by the program for identification purposes. A
Line Number is required in data columns 2 and 3 of the input data lines.
This number is assigned to the T-Line and will be associated with the
output data of the T-Line. When more than eleven T-Lines are used per
span, make sure that the letter “T” and Line Number have already been
entered on eleven lines of the input form. Following is the input data
common to all types of T-Lines.
1.
RLG Intersect Code (c.c. 36).
The RLG Intersect Code for the T-Line functions in the same
manner as the RLG Intersect Code for the bent lines. See the
discussion on page 82 and the sketch on page 58. Note that the
intersection of a T-Line and any type of longitudinal other than a
- 94 -
railing longitudinal line is found by extending the T-Line straight
regardless of the position of that longitudinal line. When defining
a “CONS” First Code T-Line, the RLG Intersect Code has no meaning
and should be left blank.
2.
Remarks (c.c. 37-50).
This space is provided so that the user can enter any pertinent
Remarks that describe the T-Line. The Remarks given here will
appear in the output data to assist in the interpretation of the
output.
3.
Longitudinal Line Skips (c.c. 51-80).
The Longitudinal Line Skips for the T-Lines function in the
same manner as the Longitudinal Line Skips for the bent lines. See
the discussion on page 82. Note that when an intersection is
skipped, the output will contain no data relating to that point of
intersection.
Two codes are used to indicate how the T-Line is going to be
defined: First Code and Second Code. The First Code denotes how the
direction or slope of the T-Line is defined, and the Second Code denotes
how the position of the T-Line is going to be defined. There are five
available First Codes. From one to three different Second Codes are
available in conjunction with each First Code. Following is a list of
the five First Codes and the Second Codes that are available with each.
First Code
Second Code
1.
NORM
PARL
DIST
PROP
2.
ANGL
DIST
PROP
3.
PTPT
DIST
PROP
COOR
- 95 -
4.
SKEW
STAT
5.
CONS
DIST
PROP
From the above list, it can be seen that there are eleven possible
combinations of First and Second Codes. For every T-Line that is
defined, the user must decide how that line can be defined most
conveniently. That is, what data is available to define the line and
what Codes can best be used with the available data to define the T-Line.
The five available First Codes are discussed in detail on the following
pages. The required input data for each available Second Code is given
in the discussion of each T-Line First Code. Examples of T-Lines defined
on the input form are given on pages 110 to 113.
- 96 -
1.
“PARL” T-Line
The “PARL” First Code defines a straight T-Line that is parallel to
either the Ahead or Back bent. A T-Line cannot be defined as being
parallel to any other type of line, i.e., another T-Line or reference
line. A T-Line is designated as parallel to a bent when the Code “PARL”
is entered in data columns 4-7 of the T-Line input data line. The
position of the “PARL” T-Line can be defined by any one of three
available options. The option or method that is used must be indicated
by the Second Code. The three Second Codes and the required input data
for each are as follows.
a.
First and Second Code
Required Input Data
PARL/NORM
Reference Bent, Normal distance
PARL/DIST
Reference Bent, Distance, Reference Line
PARL/PROP
Reference Bent,Proportion,Reference Line
Reference Bent (c.c. 12).
A or B
The Reference Bent indicates the bent to which the “PARL” TLine is parallel. Therefore, this Reference Bent designation is
always required with a “PARL” First Code, regardless of the Second
Code that is used. Enter the letter “A” to indicate that the “PARL”
T-Line is parallel to the Ahead bent, and the letter “B” is used to
orient the “PARL” T-Line parallel to the Back bent. Any other
character or number entered in this data column will cause an Error
Message and terminate the processing of the problem. The program
will not assign a bent by default when an invalid character is
found.
b.
Normal, Distance, or Proportion (c.c. 13-22).
Form:
xxxxxx.xxxx feet (or m) or ratio.
The data entered in this space on the input form depends on the
Second Code used with the “PARL” T-Line.
If the Normal distance from the bent to the T-Line is known,
the Second Code can be given as “NORM” and the Normal distance
entered in this space on the input form. The Normal distance can be
given in either direction from either bent.
- 97 -
If the Distance, measured along a longitudinal line, from the
bent to the T-Line is known, the Second Code can be given as “DIST”
and the Distance entered in this space on the input form. This
Distance can be measured in either direction from either bent and
along any type of longitudinal line (curve or straight).
If the distance from the bent to the T-Line is to be a
Proportion of the length (from the Back bent to the Ahead bent) of
the longitudinal line along which the distance is measured, the
Second Code can be given as “PROP” and the Proportion (ratio)
entered in this space on the input form. The Proportion distance
can be measured in either direction from either bent and along any
type of longitudinal line.
c.
Reference Line (c.c. 23, 24).
Form:
xx
If the Second Code is “DIST” or “PROP,” the number of the
longitudinal line along which the Distance or Proportion distance is
measured must be entered in this space. If the Second Code is
“NORM,” this space should be left blank.
Data columns 25-35 should be left blank when defining “PARL” T-Lines.
Following is a sketch showing “PARL” T-Lines and the sign convention for the
various data.
“PARL” T-LINES
- 98 -
2.
“ANGL” T-Line
The “ANGL” First Code defines a straight T-Line that is at a known
angle with a longitudinal line. A T-Line cannot be defined as being at
an angle with a curved longitudinal line, i.e., the longitudinal line
must be straight. A T-Line is defined at an angle with a longitudinal
line by entering the Code “ANGL” in data columns 4-7 of the T-Line input
data line. The position of the “ANGL” T-Line can be defined by either
one of two available options. The option or method that is used is
indicated by the Second Code. The two Second Codes and the required
input data for each are listed as follows.
First and Second Code
Required Input Data
ANGL/DIST
Reference Bent,Distance,Reference Line,Angle
ANGL/PROP
Reference Bent,Proportion,Reference Line,Angle
- 99 -
a.
Reference Bent (c.c. 12).
A or B
The Reference Bent is the bent from which the Distance of
Proportion distance is measured to locate the “ANGL” T-Line. This
Reference Bent is always required with an “ANGL” First Code,
regardless of the Second Code. Enter the letter “A” to indicate
that the “ANGL” T-Line is going to be located by measuring from the
Ahead bent, and the letter “B” is used to designate that the
distance (absolute or proportional) is measured from the Back bent.
All other characters are invalid and will cause an Error Message and
terminate the processing of the problem.
b.
Distance of Proportion (c.c. 13-22).
or ratio.
Form:
xxxxxx.xxxx feet (or m)
The data entered in this space of the input form depends on the
Second Code used with the “ANGL” T-Line.
If the Distance (must be measured along a longitudinal line and
from the Ahead or Back bent) from a bent to the T-Line is known, the
Second Code can be given as “DIST” and the Distance must be along
the same longitudinal line from which the Angle is going to be
measured. Therefore, the Distance must be measured along a straight
longitudinal line. However, the Distance can be measured in either
direction for either bent.
If the Distance from the Reference Bent to the T-Line is to be a
Proportion of the length of the longitudinal line along which the
distance is to be measured, the Second Code can be given as “PROP”
and the Proportion (ratio) entered in this column of the input form.
All other criteria are the same as for the “DIST” Second Code.
c.
Reference Line (c.c. 23, 24).
Form:
xx.
The number of the longitudinal line along which the Distance or
Proportion distance is measured, and from which the Angle is
measured, should be entered as the Reference Line. Only the number
of a straight longitudinal line is valid.
d.
Angle (c.c. 25-32).
Form:
xxx deg., xx min., xx.x sec.
Enter in this space the Angle between the T-Line and the
longitudinal line (Reference Line). This Angle always should be
given in degrees, minutes, and seconds (to tenths) and always should
be measured from the same longitudinal line that the Distance or
Proportion distance is measured along. The Angle always should be
- 100 -
an acute ( # 90o) angle. However, the Angle may be of negative
magnitude. Note that an Angle equal to zero makes the T-Line
colinear with the longitudinal line and, therefore, a value of zero
is invalid. Note that a dotted line on the input form separates the
columns for degrees, minutes, and seconds.
Data columns (33-35) should be left blank when defining “ANGL” TLines.
- 101 -
Following is a sketch showing “ANGL” T-Lines and the sign convention of the
required input data.
- 102 -
“ANGL” T-LINES
- 103 -
3.
“PTPT” T-Line
The “PTPT” (Point) First Code is used to indicate that the T-Line is
going to be defined by identifying two points on the T-Line, i.e., a straight
line between two points. Such a T-Line is indicated by entering "PTPT" in
data columns 4-7 of the T-Line input data line. The two points, if not
defined by coordinates, must be located on the longitudinal lines. The points
that determine the T-Line can be defined by any one of three available
options. The option or method that is used is indicated by the Second Code.
The three Second Codes and the required input data for each type are as
follows:
First and Second Code
a.
Required Input Data
PTPT/DIST
(Point 1)
(Point 2)
Reference Bent,Distance,Reference Line
Reference Bent,Distance,Reference Line
PTPT/PROP
(Point 1)
(Point 2)
Reference Bent,Proportion,Reference Line
Reference Bent,Proportion,Reference Line
PTPT/COOR
(Point 1)
(Point 2)
X-Coordinate, Y-Coordinate
X-Coordinate, Y-Coordinate
Reference Bent (c.c. 12 and c.c. 33).
A or B
The Reference Bents are the bents from which the Distances or
Proportion distances are measured in order to locate the points that
define the T-Line. The Reference Bents are not required when defining a
“COOR” Second Code T-Line since the input actually will be coordinates,
i.e., independent of the Ahead or Back bent.
Each point (except coordinate point) is identified by measuring a
Distance or Proportion distance from the Reference Bent (Back or Ahead
bent) along a Reference Line (longitudinal line). Either point of the
T-Line can be located from either bent. That is, each of the two points
that define the “PTPT” T-Line is independent of the other. “A” is used
to indicate that the point is located from the Ahead bent, and “B” is
used to indicate that the point is located from the Back bent. Any
character other than “A” or “B” is used to indicate that the point is
located from the Back bent. Any character other than “A” or “B” will
cause an Error Message and terminate the problem. Note that two
Reference Bents (one for each point) must be given. The Reference Bent
(A or B) for point one is given in data column 33. Whichever point is
designated as point one, or point two, is arbitrary.
b.
Distance, Proportion, or X-Coordinate (c.c. 13-22).
Form: xxxxxx.xxxx feet (or m) or ratio.
The data entered in this space of the input form depends on the
Second Code that is used with the “PTPT” T-Line.
If the points that define the T-Line are located by Distances from
the Reference Bents (Ahead or Back) along the Reference Lines
(longitudinal lines), the Second Code should be given as “DIST” and the
Distance from the Reference Bent (c.c. 12)
to point one given in
this column of the input
form. The Distance can
- 104 -
be measured from either bent, in either direction, and along any type of
longitudinal line.
If the distances from the Reference Bent to the points that define
the T-Line are given as Proportions of the length (from the Back bent to
the Ahead bent) of the Reference Lines (longitudinal lines), the Second
Code should be given a “PROP” and the Proportion (ratio) for point one
entered in this column of the input form. The Proportion distance can
be measured from either bent, in either direction, and along any type of
longitudinal line.
If the T-Line is defined by the coordinates of two points,
the Second Code should be given as “COOR” and the X-coordinate of
point one entered in this column of the input form.
c.
Reference Line (c.c. 23, 24 and 34, 35).
Form:
xx
If the Second Code is “DIST” or “PROP,” the number of the
longitudinal line (Reference Line) on which each point is located
must be given in these input data columns. The number of the
longitudinal line on which point one is located is given in data
columns 23 and 24, and the number of the longitudinal line on
which point two is located is given in data column 34 and 35.
Note that both points of a “PTPT” T-Line cannot be located on the
same longitudinal line.
If the Second Code is “COOR,” these columns should be left
blank, i.e., the coordinate input data is independent of the
longitudinal lines.
d.
Distance, Proportion, or Y-Coordinate (c.c. 25-32).
Form: xxxx.xxxx feet (or m) or ratio.
The data required in this column depend on the Second Code
and the data that is entered in data column 13-22, i.e., the same
type of data should be entered in this column that was entered in
data columns 13-22.
If the Second Code is “DIST,” the Distance (along the
longitudinal line given in data columns 34, 35) from the Reference
Bent (c.c. 33) to point two should be entered in this column of
the input form. This Distance can be measured from either bent,
in either direction, and along any type of longitudinal line.
If the Second Code is “PROP,” the Proportion used to locate
point two should be entered in this column. This Proportion
distance can be measured from either bent, in either direction,
and along any type of longitudinal line.
- 105 -
If the T-Line is defined by coordinates, the Y-Coordinate of
point one should be entered in this column of the input form.
If the T-Line is defined by coordinates, an additional input
line is required to enter the coordinates of point two. The X and
Y Coordinates of point 2 are entered in the same data columns of
the second line that was used to enter the coordinates of point
one, i.e., the X-Coordinate is entered in data columns 13-22, and
the Y-Coordinate is entered in data columns 25-32. It is
suggested that the blank space between the input lines be used to
enter these coordinates. The only other data required in the
second coordinate input line is the letter “T” which should be put
in data column one. However, the next T-Line input data line can
be used to enter the coordinates of the second point. But, if
additional T-Lines are used, the Line Number (c.c. 2, 3) must be
adjusted on the subsequent T-Lines, i.e., the two lines required
to enter the coordinates of the two points define only one T-Line.
Following is a sketch showing the “PTPT” T-Lines.
SPAN
“PTPT” T-LINES
- 106 -
4.
“SKEW” T-Line
The “SKEW” First Code defines a straight T-Line that is at a known
Station and Skew Angle with the mainline. Therefore, the “SKEW” T-Line
is completely independent of the bent and longitudinal lines. There is
only one type of “SKEW” T-Line available, and the Second Code for this
T-Line is “STAT,” Actually, since there are no alternate Second Codes,
the “STAT” Second Code is not required. The required input data is as
follows:
First and Second Code
Required Input Data
SKEW/STAT
a.
Mainline Station of T-Line,Skew Angle of T-Line
Station (c.c. 13-22).
Form:
xxxx+xx.xxxx feet (or m).
The mainline Station of the intersection of the T-Line and
mainline should be given in this column. The Station may be of
negative magnitude.
b.
Skew Angle (c.c. 25-32).
Form:
xxx deg., xx min., xx.x sec.
The Skew Angle that should be entered in this column of the
input form is the angle between a line radial (or perpendicular)
to the mainline, at the Station of the T-Line, and the T-Line.
The Skew Angle is given in degrees, minutes and seconds (to
tenths). Note that a dotted line on the input form separates the
degree, minute, and second columns. The sign convention for the
Skew Angle is the same as for the bents.
Data columns 12, 23, 24, 33-35 should be left blank when defining
“SKEW” T-Lines. Following is a sketch showing the “SKEW” T-Line.
“SKEW” T-LINE
- 107 -
5.
“CONS” T-Line
The “CONS” T-Lines are not straight lines but rather a series of
points that may or may not lie in a straight line. These points are
located on the longitudinal lines. Each “CONS” T-Line locates one point
on each longitudinal line that has been defined. The locations of the
points are determined by a given Distance, or Proportion ratio for
distance, from either the Ahead or Back bent. The Distance or
Proportion is constant to all points. Note that although the Proportion
remains constant for all longitudinal lines, the actual distances
(Proportion multiplied by the lengths of the longitudinal lines) from
the bents to the points can vary since the length of the longitudinal
lines (from bent to bent) may vary. If the actual Distance is given,
the variation in the lengths of the longitudinal lines has no effect on
the location of the points. Since the “CONS” T-Line is a series of
points, the RLG Intersect Code is meaningless and should be left blank.
Following are the input data requirements.
First and Second Code
Required Input Data
CONS/DIST
CONS/PROP
a.
Reference Bent, Distance
Reference Bent, Proportion
Reference Bent (c.c. 12).
A or B
Enter the letter “A” if the Distance of Proportion distance
is measured from the Ahead bent. The letter “B” will indicate
that the Distance or Proportion distance is to be measured from
the Back bent. All other characters are invalid, i.e., cause an
Error Message.
b.
Distance or Proportion (c.c. 13-22).
Form:
xxxxxx.xxxx feet (or m) or ratio
The data that is entered in this column of the input form
depends on the Second Code used with the “CONS” T-Line.
If the Distance (constant for all longitudinal lines)
measured along the longitudinal lines from the bent to the points
is known, the Second Code can be given as “DIST” and the Distance
entered in this column of the input form. This Distance can be
measured in either direction from either bent and along any type
of longitudinal line.
If the distance from the bent to each point is to be a
Proportion of the length of the longitudinal line that the
distance is measured along, the Second Code can be defined as
“PROP” and the Proportion (ratio) entered in this column of the
input form. This Proportion distance can be measured in either
direction from either bent along any type of longitudinal line.
Data columns 23-36 should be left blank when defining “CONS” TLines. On the following page is a sketch showing the “CONS” T-Line and
the sign convention of the input data.
- 108 -
"CONS" T-LINES
- 109 -
T-LINE INPUT DATA SUMMARY
Summary of "PARL" T-Line Input Data Requirements
First and Second Codes, and Input Data
Data
Columns
4-11
PARL/NORM
PARL/DIST
PARL/PROP
12
Bent (A or B) to which the
T-Line is parallel.
Bent (A or B) to which the
T-Line is parallel.
Bent (A or B) to which the
T-Line is parallel.
13-22
Normal distance from bent
to T-Line.
Distance from bent to T-Line
along a longitudinal line.
Proportion ratio for distance
from bent to T-Line.
Number of longitudinal lines that
Distance is measured along.
Number of longitudinal lines that
Proportion distance is measured
along.
23, 24
Summary of "ANGL" T-Line Input Data Requirements
First and Second Codes, and Input Data
Data
Columns
4-11
ANGL/DIST
ANGL/PROP
12
Bent (A or B) from which the Distance is measured.
Bent (A or B) from which the Proportion ratio for
distance is measured.
13-22
Distance from bent to T-Line along a
longitudinal line.
Proportion ratio for distance from bent to T-Line
along a longitudinal line.
23, 24
25-32
Number of longitudinal lines that Distance is measured Number of longitudinal lines that Proportion ratio for
along, and from which the Angle is measured.
distance is measured along, and from which the Angle
is measured.
Angle between longitudinal line and T-Line.
- 110 -
Angle between longitudinal line and T-Line.
Summary of "PTPT" T-Line Input Data Requirements
First and Second Codes, and Input Data
Data
Columns
4-11
PTPT/DIST
PTPT/PROP
12
Bent (A or B) from which the
Distance to point 1 is measured.
Bent (A or B) from which the
Proportion ratio for distance to
point 1 is measured.
13-22
Distance to point 1 along a
longitudinal line.
Proportion ratio for distance to
point 1 along a longitudinal line.
23,24
Number of the longitudinal line that Number of the longitudinal line that
the Distance to point 1 is measured the Proportion ratio for distance to
along.
point 1 is measured along.
25-32
Distance to point 2 along a
longitudinal line.
Proportion ratio for distance to
point 2 along a longitudinal line.
33
Bent (A or B) from which the
Distance to point 2 is measured.
Bent (A or B) from which the
Proportion ratio for distance to
point 2 is measured.
34,35
X-Coordinate of point 1 (first line)
X-Coordinate of point 2 (second
line)
Number of the longitudinal line that Number of the longitudinal line that
the Distance to point 2 is measured the Proportion ratio for distance to
along.
point 2 is measured along.
- 111 -
Y-Coordinate of point 1 (first line)
Y-Coordinate of point 2 (second
line)
Summary of "SKEW" T-Line Input Data Requirements
First and Second Codes, and Input Data
Data
Column
4-11
SKEW/STAT
13-22
Mainline Station of T-Line
25-32
Skew Angle of T-Line
Summary of "CONS" T-Line Input Data Requirements
First and Second Codes, and Input Data
Data
Column
4-11
12
CONS/DIST
CONS/PROP
Bent (A or B) from which the Distance is
measured.
Bent (A or B) from which the Proportion ratio
for distance is measured.
13-22 Distance from the bent to the various points on Proportion ratio for distance from the bent to
the longitudinal lines.
the various points on the longitudinal lines.
- 112 -
T-LINES
EXAMPLE 9-1.
PARL/DIST, PARL/PROP
PARL/NORM
This example shows how the
"PARL" T-Lines are defined. By
definition these T-Lines are parallel
to the Back or Ahead bent. T-Line 1
has been defined as a "PARL/PROP"
T-Line that is parallel to the Back
bent and located at 1/4th the distance
from the Back bent to the Ahead bent
along Longitudinal Line 4. Note that
the length of Longitudinal Line 4
does not have to be known. In the
Remarks, this line is identified as a
construction joint. For the purpose
of illustration, T-Line 1 has been
coded to extend straight to intersect the
Railing lines 1 and 8. T-Line 2 is a "PARL/DIST"
T-Line that is parallel to the Back bent and located
at a Distance of 25 ft. from the Back bent along
Longitudinal Line 3. This line is identified as a
diaphragm in the Remarks column. Note that this T-Line has been coded to skip Longitudinal Lines 1 and 8. T-Line 3 is
a "PARL/NORM" T-Line that is parallel to the Ahead bent and located at a Normal Distance of 12'-6" from the Ahead bent.
Note that this type of T-Line is independent of the Longitudinal Lines. T-Line 3 has been labeled a construction joint
in the Remarks column. Following is the input data shown on the input form.
FORM OF INPUT
- 113 -
T-LINES (continued)
EXAMPLE 9-2.
PTPT/COOR, PTPT/DIST, PTPT/PROP
This example illustrates the
"PTPT" T-Lines. This type of T-Line
is defined by identifying two points
on the T-Line. T-Line 1 (PTPT/COOR)
is defined by giving the X and Y
Coordinates of two points which were
computed by some other means. These
coordinates must be from the same
axis system on which the bridge is
oriented. Note that two T-Line input
lines are used to enter the coordinates.
This necessitates changing the Line
Number on the following T-Line input
lines. T-Line 2 is a "PTPT/PROP" T-Line
that joins the midpoints of Longitudinal
Lines 1 and 4. T-Line 3 is a "PTPT/DIST"
T-Line that is defined by a point located
twenty feet from the Back bent along
Longitudinal Line 1, and a point located twenty-five
feet from the Back bent along Longitudinal Line 3.
The input data for all three T-Lines is shown on the
input form below.
FORM OF INPUT
- 114 -
T-LINES (continued)
EXAMPLE 9-3.
SKEW/STAT, ANGL/PROP,
ANGL/DIST
The example shown here
illustrates the "ANGL" and "SKEW"
T-Lines. Transverse line 1 is
defined as a "SKEW/STAT" T-Line.
This line intersects the mainline
at Station 20+25.0 and at an angle
of 8o with a radial line. Transverse
line 2 is an "ANGL/PROP" T-Line defined
as being at an angle of 77o-30'-19.1"
with Longitudinal Line 4, and at a
Proportion (0.5439) of the length (from
bent to bent) of Longitudinal Line 4
from the Back bent. Transverse line 3
is an "ANGL/DIST" T-Line defined by a
Distance of twenty-one feet from the
Ahead bent along Longitudinal Line 1, and at an angle of 85o with that same Longitudinal line.
the sketch is shown on the input form below.
FORM OF INPUT
- 115 -
The input data given in
T-LINES (continued)
EXAMPLE 9-4.
CONS/PROP, CONS/DIST, PTPT/COOR
This example shows how the
"CONS" T-Lines are defined. The
"PTPT/COOR" type T-Line is also
shown. Transverse line 1 is defined
as a "CONS/PROP" T-Line which will
locate a series of points on the
Longitudinal Lines at a Proportion
of the length of each Longitudinal
Line from the Back bent. If the
lengths of the Longitudinal Lines
vary, the distance from the Back bent
to the points will vary since the
Proportion remains constant. The T-Line
shown here locates the first tenth point
of each Longitudinal Line. Transverse
line X3 is defined as a "CONS/DIST" T-Line
which locates a series of points a Distance
of six inches from the Ahead bent along each
Longitudinal Line. Here the centerline of
bearing of each beam at the Ahead bent is being
located. T-Line X2 (PTPT/COOR) is shown here for
the purpose of illustrating how the Coordinates of
the second point can be entered on the input form between the T-Line input lines.
input form.
FORM OF INPUT
- 116 -
The input data is shown below on the
COORDINATE TYPE INPUT
The COORDINATE input form is used to enter the coordinates of known
points on the bridge. Therefore, the coordinate input must be computed by
hand or by some other program. The program requires that the bridge and the
coordinate input data be oriented on the same X and Y coordinate axis system.
The Coordinate input data can be used in lieu of, or in conjunction with, the
Span input data. That is, the program can compute the intersections of TLines and longitudinal lines of a span and then compute the various output
data from Coordinate input data, or vice versa, all in the same problem. If
the point defining input data consists solely of coordinates (no Span Data),
the first Coordinate input sheet should follow the Longitudinal Line input
data sheet. Although the longitudinal lines are not used when computing the
output data for the coordinate input data, at least one Longitudinal Line must
always be defined when using point defining input data that consists entirely
of coordinates. When Coordinate and Span input data are used in the same
problem, the sequence of the Coordinate and Span input data is immaterial.
The program has the capacity for related coordinate points to be grouped
into units, analogous to the Span input data, by using two or more sheets of
Coordinate input data. The program will skip to the beginning of a new page
when a new unit (another input sheet) is given.
The COORDINATE input data form consists of two types of input data
lines. They are: Coordinate Identification and Coordinate Point.
A.
Coordinate Identification (8COOR in c.c. 1-5).
The Coordinate Identification is used to identify each unit of
related points. This input line should always be filled in except in
the following case. If more than thirty points are in a unit, a second
Coordinate input sheet can be used to enter the remaining points after
thirty points have been entered on the first Coordinate sheet. The
Coordinate Identification of the second sheet of Coordinate input would
be left blank.
The total Number of Points in the unit should be entered in data
columns 10, 11. This number should not be zero nor greater than ninetynine. Whenever the last unit of coordinates are entered and no Span
Data are to follow, the code "LAST" should be entered in data columns
13-16. This signifies that after processing the unit of coordinate
points the problem is to be terminated. Any pertinent Remarks that
describe the unit of coordinate points are entered in data columns 1848. These Remarks will head the output listing of each unit.
B.
Coordinate Point (CP in c.c. 1,2).
Each COORDINATE input form contains thirty (30) Coordinate Point
input lines. The X and Y coordinates of each point are entered on one
Coordinate Point input line. There is no limitation on the number of
points that can be entered except that only ninety-nine are allowed per
unit. However, any number of units may be used. A Sequence Number is
given in data columns 3, 4. However, the sequence of the points is not
checked by the program. This number will appear in the output data of
each point.
- 117 -
1.
Point Identification (c.c. 5-8).
This space is provided so that each point can be labeled
with a short alphabetic or numeric code. This information will be
given in the output data of each point. If the Sequence Number is
sufficient to identify the point, this space can be left blank.
2.
X-Coordinate (c.c. 9-18).
Form:
xxxxxx.xxxx feet (or m).
Enter in this column the X-Coordinate of the point. This
coordinate can be zero only when the Y-Coordinate is not zero.
3.
Y-Coordinate (c.c. 19-28).
Form:
xxxxxx.xxxx feet (or m).
Enter in this column the Y-Coordinate of the point. This
coordinate can be zero only when the X-Coordinate is not zero.
4.
Remarks (c.c. 29-48).
Enter in these data columns any pertinent Remarks that
describe the point. These Remarks will be given in the output
data of each point.
The output data of each point consists of the following information:
1.
Sequence Number of point.
2.
Station of point.
3.
Finished grade elevation of point.
4.
Distance (radial or perpendicular to mainline) from point to
mainline.
5.
X-Coordinate of point.
6.
Y-Coordinate of point.
7.
Point Identification.
8.
Remarks.
- 118 -
IV.
THE OUTPUT DATA
In the following discussion of the Output Data, refer to the output data
of one of the example problems. All dimensions (Distances), Stations,
Elevations, and Coordinates are given in feet. Angles are given in degrees,
minutes, and seconds (to tenths).
The output data will contain, in addition to the data computed by the
program, the input data given on the input data forms. This input data
listing can be used to check against the data entered on the input forms and,
in addition, used as a permanent part of the record of the problem. The first
page of the output data is a listing of the Layout Data which is given on the
first page of the input data forms. Suitable headings are given so that this
output is easily recognized. All blank numeric input data fields are listed
as zero.
The second page of the output data is a listing of the Longitudinal
Lines, also with headings. The heading “DR / X1” indicates that the data in
that column is a “)R” dimension or X-Coordinate. The heading “STA./ Y1”
identifies the data in that column as a Station or Y-Coordinate. The heading
“TR / R /X2” indicates a Taper Rate, Radius, or X-Coordinate listed in that
column. The data listed in the columns of the headings mentioned above depend
on the type of longitudinal line. Whenever more than one set of Longitudinal
Lines are used, the additional Longitudinal Lines are listed in the output
data when they appear in the input data, i.e., immediately following the
output data of the preceding span.
The input data of each span with headings is listed in the output data
immediately preceding the computed output data for that span. The heading
“STA./NORM.” given in the Bent Data identifies the data in that column as a
Station or Normal distance. The heading “S/N/D/P/X” given in the listing of
the T-Line input data indicates that the data in that column is a Station,
Normal distance, Distance, Proportion, or X-Coordinate, depending on the type
of T-Line being listed. The heading “A/S/D/P/Y” identifies the data in that
column as an Angle, Skew Angle, Distance, Proportion, or Y-Coordinate, again
depending on the type of T-Line being listed.
THE SPAN OUTPUT DATA
The Span Output Data will contain the various computed data for each
point of intersection of the longitudinal lines with the T-Lines. The first
line of the Span Output will contain the Span Number and Problem Number for
identification.
Bent Data
The Bent Data of the Span Output Data contains the Bent designation (A
or B), Bent Number, Station, Skew Angle, Remarks, and Type for each of the two
bents that define the span. The Station of the bent is the station of the
point of intersection of the bent with the mainline. The Skew Angle is the
angle between a line radial to the mainline at the Bent Station and the bent
line. The same sign convention applies to the output Skew Angle that applies
to the input Skew Angles. If the Station and Skew Angle of the bent are not
given in the input data, the program will compute this data. Therefore, the
program can be used to compute bent Skew Angles and Stations when they are not
otherwise known. The Bent Number, Remarks, and Type are repeats of the input
data. The Bent designation "A" identifies the Ahead bent, and "B" identifies
the Back bent. The Bent Data of the Back bent is listed first, and the data
for the Ahead bent is listed immediately following.
- 119 -
Longitudinal Line Output
The data computed for the points of intersection of the bents and TLines with a Longitudinal Line are given in the output of that Longitudinal
Line. The heading for the output of each Longitudinal Line will contain the
Sequence Number, Type, and Remarks that were given in the input data when
defining the Longitudinal Line. Following is an example:
“LONG.
LINE
4
CRD
BEAM
C”
The next line of the output data contains the headings for the data computed
at the points of intersection of the bent and T-Lines with the Longitudinal
Line.
All intersections with longitudinal line one (1) are listed first. The
data for one intersection point is given on each line, and these data are
listed immediately below the Longitudinal Line and data headings. The number
of intersection points (lines) given in each Longitudinal Line output will
depend on the number of T-Lines, and the number of T-Lines coded to skip that
Longitudinal Line. For example, if T-Line two (2) has been coded to skip
Longitudinal Line one (1), T-Line (2) will not appear in the output of
Longitudinal Line one. The data for the Back bent intersection with the
Longitudinal Line is listed first. Next, the data for the intersections of
the T-Lines with the Longitudinal Line is given, and in the same order that
the T-Lines were defined in the Span Data input. After the T-Line
intersection data is listed, the data for the Ahead bent intersection with the
Longitudinal Line is given. This process of listing the intersection point
data for the Back bent, T-Lines, and Ahead bent with a Longitudinal Line is
repeated for each Longitudinal Line beginning with Longitudinal Line one (1).
Note that when a Longitudinal Line has been coded to be skipped (used as a
reference line only), the Longitudinal Line will not appear in the output data
and, therefore, the intersection point data of the bents and T-Lines with that
Longitudinal Line will be omitted from the output data. In contrast, when a
T-Line is coded to skip a Longitudinal Line, only one intersection point is
skipped in the output for each code used. For example, if T-Line two (2) is
coded to skip only Longitudinal Line four (4), the intersection data of this
T-Line with the other Longitudinal Lines will be given in the output data of
those Longitudinal Lines.
The Distances, Stations, Elevations, and Coordinates listed in the
output data are given to four decimal positions and have been rounded off to
the nearest ten-thousandth. If the fractional part is exactly equal to zero,
only one decimal position (a zero) is given. Beginning on the next page is a
discussion of the data given in the output of each point of intersection of a
T-Line or bent with a Longitudinal Line. The output data headings are shown
in parentheses.
1.
Transverse Line Notation (T-LINE).
The data for the intersection point of a T-Line or bent with the
Longitudinal Line is given on one output data line. The T-Line Notation
is used to identify the transverse line for which the data is given.
The Longitudinal Line will have been noted in the Longitudinal Line
heading. The letter "B" indicates the transverse line is a bent, and
the letter "T" identifies a T-Line. In addition to the letter Code (B
or T), the T-Line Notation will include the Bent Number or Line Number
of the T-Line, whichever the case may be. Following is an example of
the T-Line Notations. Assume that the intersection data being given is
for Longitudinal Line two (2). Explanations are given in parentheses.
T-LINE
B 1
(Output data headings listed on this line.)
(Bent 1 (Back) intersection with Longitudinal Line 2 data.)
- 120 -
T 1
(T-Line 1 intersection with Longitudinal Line 2 data.)
T 2
(T-Line 2 intersection with Longitudinal Line 2 data.)
B 2L
(Bent 2L (Ahead) intersection with Longitudinal Line 2 data.)
Note that T-Line 3 is not shown in the above example. This indicates
that T-Line 3 was coded to skip the intersection with Longitudinal Line
2.
In order to locate the output data for the intersection of T-Line
I with Longitudinal Line J, first locate the output data of Longitudinal
Line J. Then find the Transverse Line Notation for T-Line I in the
column headed by "T-LINE." The line on which the Transverse Line
Notation (T I) is found contains the desired data.
2.
Station of Intersection Point (STATION).
The output data in this column is the station (measured along the
mainline) of the point of intersection of the T-Line (or bent) with the
Longitudinal Line. Since the point usually will not be located on the
mainline, the mainline station is found by projecting the point radially
(or perpendicular) to the mainline. Note that a plus sign (+) has been
included in the station for clarity and consistence with normal
practice.
3.
Elevation of Intersection Point (ELEVATION).
The elevation listed in this column of output data is the finished
grade (bridge surface) elevation of the point of intersection of the TLine (or bent) with the Longitudinal Line. This elevation is computed
first by determining the profile grade elevation of the station of the
intersection point. Then the elevation is corrected for the bridge
crown whether the crown is a parabola or superelevated (constant or
transition).
If an asterisk appears with the elevation (immediately to the
right), this denotes that the intersection point is not located within
superelevated lanes or parabolic crown. If the point falls outside a
parabolic crown, the elevation is the same as the elevation at the edge
of the parabola, i.e., the crown is level from the edge of the parabola
to the point. When a point is not located within the superelevated
lanes, the elevation of the point is level with the edge of an exterior
lane. Since lanes one, two, and three are adjoining, and lanes four,
five, and six are adjoining, the point (if not located within a lane)
must be located either between the origin and lane one, between lane
three and four, or outside of lane six. If the point is located between
the origin and lane one, the elevation is level with the inside edge of
lane one. If the point is located between lanes three and four, the
elevation is always level with the outside edge of lane three. If the
point is located outside of lane six, the elevation is level with the
outside edge of lane six. In the following sketch, the dotted lines
show how the elevations are determined when points are not located
within the superelevated lanes or parabolic crown.
- 121 -
SUPERELEVATION
If a point is located exactly on the inside edge of lane four, it is
possible for the elevation of that point to be computed as if the point
was between lanes 3 and 4, i.e., level with the outside edge of lane 3.
For example, the distance from the mainline to the inside edge of lane 4
is given as 15.0000 feet. An intersection point on this line may be
computed by the program to be 14.99999999999999 feet (the program uses
sixteen significant digits for all computations) from the mainline. In
this case, the elevation of the point is level with the outside edge of
lane 3, i.e., the point is not located within the range of lane 4.
However, this type of error presents no problem if the Engineer is aware
of this possibility and adjusts the lane dimensions in the input data.
The program assumes that the width of each lane of superelevation
remains constant throughout the range of the problem and that the rate
of superelevation is given radial (or perpendicular) to the lane. If
the width of a lane actually varies, or for some reason the
superelevation rate is not radial (or perpendicular) to the mainline,
some elevations given in the output may have to be corrected. These
corrections would depend upon their location.
4.
Distance from Point to Mainline (DT TO ML).
The distance listed in this column is from the point of
intersection of the T-Line (or bent) with the Longitudinal Line to the
mainline. This distance is always measured on a radial or perpendicular
line to the mainline depending on the type (curve or tangent) of
mainline. If the distance is negative, the point is located on the
origin side of the mainline; otherwise (positive), the point is located
on the side of the mainline away from the origin. If the dimension is
zero, the point is located on the mainline.
5.
Distance from Point to Back Bent (DT TO BT).
The output data listed in this column is the distance from the
point of intersection of the T-Line (or bent) with the Longitudinal Line
to the Back bent. This distance is measured along the Longitudinal
Line, regardless whether the Longitudinal Line is a curve or straight
line, or a combination of both. If the distance is negative, this
indicates that the point is back of the Back bent and located on the
Longitudinal Line extended back from the Back bent (the point is not
necessarily located on the same Longitudinal Line of the previous span).
If the point is ahead of the Ahead bent, the point is located on the
Longitudinal Line extended forward from the Ahead bent. This distance
will be zero if the transverse line is the Back bent.
- 122 -
Note that the distance given for the Ahead bent intersection point
will be the length of the Longitudinal Line from the Back bent to the
Ahead bent. If the Ahead bent is coded to skip the Longitudinal Line,
the length of the Longitudinal Line will not be listed in the output.
6.
Distance from Point to Previous Point (DT TO PP).
This dimension is the distance from the point of intersection of
the T-Line (or bent) with the Longitudinal Line to the point of
intersection of the same T-Line (or bent) with the preceding
Longitudinal Line. This distance, then, is measured along the T-Line
(or bent) from Longitudinal Line to Longitudinal Line. All distances
given for Longitudinal Line one are zero since in this case there is no
preceding Longitudinal Line in the span.
If the T-Line is a “CONS/DIST” or “CONS/PROP” transverse line,
this distance will be given a value of zero, since these types of TLines are actually a series of unrelated points and not necessarily a
straight line. If the points fall on a straight line, then the "CONS"
T-Line can be defined as some other type of T-Line, and the distance
between the points would be given in the output.
If the T-Line (or bent) has been coded to skip the preceding
Longitudinal Line, this "DT TO PP" dimension is given as zero. That is,
the program will not compute the distance to the last point computed on
that T-Line unless it is the point of intersection with the immediately
preceding Longitudinal Line. Therefore, this dimension is the distance
between adjacent Longitudinal Lines. However, if the preceding
Longitudinal Line has been coded to skip all intersections (used as
reference line only), the distance given will be to the point of
intersection of the T-Line (or bent) with the Longitudinal Line
preceding the Longitudinal Line that is skipped completely.
Following is a sketch showing the characteristics of this
dimension.
- 123 -
In the example above, the dimensions A and B will be computed and
given in the output of Longitudinal Line two and four, respectively.
Note that Longitudinal Line three has been coded to skip all
intersections (used as reference only). The dimensions C, D, or E are
not computed since T-Line (or bent) one has been coded to skip
Longitudinal Line five.
If the Longitudinal Line is a Railing and the transverse line is
coded to intersect the Railing line by turning rapidly at the railing
reference line, the “DT TO PP” dimension may be meaningless since the
dimension may not be measured along the transverse line. In the sketch
below the dimension A would be given in the output data of Longitudinal
Line 2 if the transverse line is not coded to skip Longitudinal Line 1
or 2. Note that the Railing reference line, which is located between
Longitudinal Line 1 and 2, is defined out of location sequence as
Longitudinal Line 7 for illustration.
When the Engineer becomes more familiar with the above
characteristics of this dimension, “DT TO PP,” the sequence of the
Longitudinal Lines and the skips of the longitudinal or T-Lines (or
bent) can be used more effectively. In no case should the first
Longitudinal Line be coded to skip all intersections. It is suggested
that all Longitudinal Lines so coded be defined last in the input data
of the Longitudinal Lines.
7.
Angle or Skew Angle (ANGLE).
The angle listed in this column of the output data depends on the
type of transverse and Longitudinal Line. If the transverse line is a
"CONS/DIST" of "CONS/PROP" T-Line, the angle is always given as zero,
i.e., this type of T-Line is a series of points and not a straight line.
- 124 -
For all other types of T-Lines (and bents) the angle depends on the type
of Longitudinal Line. If the Longitudinal Line is straight at the point
of intersection with the T-Line (or bent), the angle given in this
column is the acute angle between the Longitudinal Line and the
transverse line. When the Longitudinal Line is a curve at the point of
intersection with the transverse line, the angle listed in this column
is measured between a line radial to the Longitudinal Line at the
intersection point and the transverse line, i.e., Skew Angle. However,
if the Longitudinal Line is a Railing line and the transverse line is
coded to turn radially at the Railing reference line and extend to
intersect the Railing line, the angle is always given a value of zero
for simplicity, i.e., the transverse line is always radial or
perpendicular to the Railing line at the point of intersection.
The sign convention for an output Skew Angle is the same as the
sign convention for a Skew Angle in the input data. An angle between
the transverse and Longitudinal Line has the same sign convention as the
angle required in the input data to define an “ANGL/DIST” or “ANGL/PROP”
T-Line.
8.
X-Coordinate (X).
The X-Coordinate of the point of intersection of the transverse
line with the Longitudinal Line is listed in this column of the output
data. This coordinate is dependent on the orientation of the bridge
given in the Location Data of the input data.
9.
Y-Coordinate (Y).
The Y-Coordinate of the point of intersection of the transverse
line with the Longitudinal Line is listed in this column of the output
data. This coordinate is dependent on the orientation of the bridge
given in the Location Data of the input data.
10.
Transverse Line Remarks (REMARKS).
The identifying remarks given in the input data of the transverse
lines are listed in this column so that the intersection point can be
easily recognized.
11.
Transverse Line Type or Code (TYPE LINE).
This column contains the First and Second Code of a T-Line, or the
Bent Type when the bent intersection point data is given.
This procedure of listing the data for the points of intersections
of the transverse lines (Bents and T-Lines) with a longitudinal line is
repeated for each Longitudinal Line beginning with Longitudinal Line 1.
After the last Longitudinal Line data are given, the processing of that
span is complete, and the program proceeds to process any subsequent
span or unit of coordinate input.
- 125 -
THE COORDINATE OUTPUT DATA
The output data given for the coordinate type input data are
similar to the Span Output Data. The input data for each point are
listed with the computed data for that point. The computed data output
(Station, Elevation, "DT TO ML") are the same as for the output data of
the spans except that the point is defined by input data coordinates
rather than by intersection two lines. Note that the “Distance to Bent”
and "Distance to Previous Point" dimensions and Angles are not given in
this type of output since the coordinate points are not associated with
any transverse or Longitudinal Lines.
- 126 -
V.
ERROR MESSAGES
The program checks the validity of the procedure used to enter the input
data and will print the following error message when an error is detected:
ERROR
i
PROB. NO. n
Where i is the error number and n is the number of the problem that was
entered in the Identification Card.
Following is a list of the error numbers and the possible causes of each
error.
ERROR NUMBER (i)
1
CAUSE OF ERROR
1.
The first card of the problem does not contain an
asterisk in c.c. 1.
2.
An additional ID. card has been indicated but not
found.
1.
The Location Data card is missing or not in correct
sequence.
2.
The Reference Station is not in curve 2.
1.
The Horizontal Curve Data card is missing or out of
proper sequence.
2.
The P.C. Station is ahead of the P.T. Station.
3.
A degree-of-curve is negative.
4
1.
The Vertical Curve Data station card is missing or in
improper sequence.
5
1.
The Vertical Curve Data grade and vertical curve
length card is missing or out of correct sequence.
2.
The length of a vertical curve is negative.
1.
The Crown and Lane Definitions card is missing or
out of proper sequence.
2.
The S.R. values are not in increasing sequence.
3.
The inside lanes are not used and the outside lanes
are used.
2
3
6
- 127 -
ERROR NUMBER (i)
7
9
10
11
CAUSE OF ERROR
1.
The Superelevation Data card is expected but not
found in proper sequence.
2.
An illegal Superelevation Data Description code has
been used.
3.
The Description code does not contain "CONST" or
"START" in the first Superelevation Data card.
4.
More than ten Stations of transition superelevation
are entered.
5.
The last Description code of "FINIS" is missing when
transition superelevation is being used.
6.
The Stations of transition superelevation have not
been entered in proper sequence.
1.
A Longitudinal Line card is missing or out of sequence.
2.
An illegal Longitudinal Line Type Code has been used.
3.
An illegal reference line has been used.
4.
A curve Taper Rate is zero (0).
5.
More than thirty (30) Longitudinal Lines have been
entered.
6.
An illegal Longitudinal Line skip has been used.
7.
The Control Station of a Curve Taper Longitudinal
Line is not located in a mainline curve.
1.
A "SPAN" or "COOR" type card is missing or out of
proper sequence.
2.
The number of T-Lines is negative or greater than
twenty (20).
1.
The Back bent is not the first bent of the Span input.
2.
An illegal bent Type Code has been used.
3.
The "PREV" code has been used with the Back bent.
4.
The "SAME" code has been used with the Ahead bent.
5.
The "SAME" code is used with the first span of the
problem.
6.
Bent A has not been found, or is out of proper
sequence.
7.
An illegal "RLG INT" code has been entered.
1.
A T-Line is expected but not found.
2.
A T-Line is out of sequence.
- 128 -
ERROR NUMBER (i)
11 (cont'd)
CAUSE OF ERROR
3.
An illegal First or Second Code has been found in a
T-Line card.
4.
The Referenced Bent is not A or B in a T-Line card.
5.
An illegal Reference Line has been used in a T-Line
card.
6.
An angle of zero magnitude has been used with an
"ANGL" First Code T-Line.
7.
More than twenty (20) T-Lines have been defined.
12
1.
A "COOR" type card is expected but not found.
13
1.
An elevation error has been found. A station
computed by the program is behind the P.V.I.Z.
Station.
2.
A station computed by the program is outside the
transition beginning and ending stations.
1.
A Coordinate Point input card is missing.
2.
The number of points in the "COOR" type card is
in error.
1.
The program has attempted to intersect two parallel
lines. Check the Longitudinal and Transverse Lines.
2.
An attempt has been made to intersect a straight line
and circle that do not intersect. Check the
Transverse Lines.
16
1.
This error is caused by an internal date error, i.e.,
an error that should not have happened. The actual
cause of this error is unknown.
17
1.
A station has been found outside the Limiting Stations.
Check the Limiting Stations, Bents, and Transverse
Lines.
14
15
- 129 -
VI.
EXAMPLE PROBLEMS
Four Example Problems are given on the following pages for the purpose
of illustrating the procedure used to enter the input data on the input forms.
In addition to the input forms that contain the input data, a sketch of the
bridge geometry and the output data will be given with each example. These
problems do not represent an actual bridge structure. The examples are
designed only to illustrate the numerous characteristics of the program.
Example Number One
Example 1 shows a two-span bridge located in a 3o curve. The four beams
of each span are placed parallel to a centerline chord of that span, and the
beams in the adjacent spans meet at a common point (concentric arc
intersection) at the centerline of Bent 2. Bents 1 and 3 are parallel to Bent
2 and located by the known normal distances from Bent 2.
The Station of Bent 2 will be chosen as the Reference Point Station.
Bents are placed parallel to the Y-axis by using a Reference Angle of 72o.
The Limiting Stations are arbitrarily chosen as 19+00 and 21+00. The roadway
surface is at a constant rate of superelevation. The curb faces and sidewalks
are set up as lanes of superelevation. This requires that six lanes of
superelevation be defined. The Vertical Curve Data and dimensions for
defining the lanes of superelevation are given in the sketch along with the
superelevation rates.
Two sets of Longitudinal Lines are defined in the problem. The beams of
Span 1 are defined as PIA, and the beams of Span 2 are defined as PIB. Note
that the centerline chord and beam lines are from the centerline of Bent 2 to
the B.F.P.R. (Back Face Paving Rest) line of the end bents. The centerlines
of the railings are defined for the purpose of computing lengths for rail
spacings. In addition, the finished grade elevations at the intersection of
the railing lines with the bents will be given. Since the centerline chord
and gutter lines are used only as reference lines in this problem, these lines
are coded to be skipped in the output data.
The centerline-of-bearings and diaphragms are set up as T-Lines in each
span. The diaphragms of Span 1 are located at the one-third points of the
centerline chord. The positions of the diaphragms in Span 2 are detailed in
the sketch. The centerline-of-bearings in Span 1 are defined as "CONS/DIST"
T-Lines. In Span 2 the centerline-of-bearings are defined as "PARL/DIST" TLines. Note that in many instances a T-Line can be defined by several
combinations of T-Line Codes.
The purpose of this problem, in addition to the ones already stated, is
to compute the following data.
1.
Finished grade elevations at centerline-of-bearings.
2.
Lengths of beams and diaphragms.
3.
Position of diaphragms along each beam.
4.
Distance between beams along bent lines.
- 130 -
EXAMPLE PROBLEM 1 (Continued)
The centerline-of-bearings are located 6 inches
from the centerline of Bent 2 and 1'-6" from the
B.F.P.R. of the end bents, along the beams.
Diaphragms are perpendicular to beams. Beams
are placed parallel to the centerline chord.
Beam spacings shown are concentric arc
dimensions. Entire bridge is in 3o curve.
- 131 -
Example Number Two
Example 2 is a three-span bridge located on a tangent and 2o curve. Note that Span 1 is located
entirely on a tangent; that Span 2 is located on the tangent and curve; and that Span 3 is located
entirely in the curve.
The Limiting Stations are chosen as 33+95 and 36+30. The P.C. Station is selected as the
Station of Reference Point, and a Reference Angle of 45o is arbitrarily used. A value of 3,000 is
assigned to the Reference Distance since the tangent portion will be defined as Curve No. 2. The 2o
curve will be defined as Curve No. 3. Therefore, Curve No. 1 will not exist. The Vertical Curve Data
is shown in the sketch.
In this problem, assume that the curb and railing lines are of no concern. Therefore, only one
lane of superelevation is required to represent the bridge roadway. Since at least three lanes must
be defined, lanes 1 and 3 will be given a zero width. Lane 2 will be the roadway surface. The
information required to define the lanes, and the superelevation transition, are given in the sketch
of this example.
All beams (4) are placed on chords of concentric circles. The mainline arc is defined as a
longitudinal line for use as a reference line and will be skipped in the output data. Note that if
the distance measured along the bent lines from the mainline to the beams is desired in the output
data, this Longitudinal Line should not be skipped.
The centerline-of-bearings and construction joints in each span are defined as T-Lines. The
construction joint in Span 1 is located at mid-span. The construction joint in Span 2 is located at
mid-span along the mainline and parallel to the adjacent bents. And, the construction joint in Span 3
is located on a line that connects the mid-points of the exterior beams.
The purpose of this problem is to compute the following data.
1.
Finished grade elevations at centerline-of-bearings and construction joints.
2.
Length of beam chords.
3.
Position of construction joints along each beam.
4.
Distances between beams along bent lines.
- 132 -
Note that the P.C. Station (35+00) is actually the P.C. Station of Curve No. 3 (2o curve) and,
therefore, the P.T. Station of Curve No. 2 (tangent).
- 133 -
EXAMPLE PROBLEM 2 (Continued)
Bent 1 is located at Station 34+00 with a zero skew angle.
Bent 2 is parallel to Bent 3 and located at Station 34+75.
Bent 3 has a zero skew angle at Station 35+50.
Bent 4 is located at Station 36+25 with a skew angle equal to
zero.
All centerline-of-bearings are located 6 inches from the bents
along the beam lines.
Beam spacings shown are concentric arc dimensions.
- 134 -
Example Number Three
Example 3 is a two-span bridge that is located on a tangent and 3o
curve. Span 1 is located entirely within the curve, whereas Span 1 occupies a
portion of the curve and tangent. The Limiting Stations are chosen as 19+00
and 21+50. The Station of Reference Point is selected as the P.C. Station,
and a Reference Angle of 90o is used in order to place the tangent parallel to
the X-axis. Therefore, a portion of Span 1 will be placed in the second
quadrant. Placing a bridge or portion of a bridge outside the first quadrant
is not recommended. However, this program solution will be valid. In this
example a working line is set up parallel to the tangent. The offset distance
from the working line to any intersection point given in the output can be
computed conveniently by subtracting a constant (Radius of 3o curve plus four)
from the Y-Coordinate of the intersection point. And, the distance along the
working line from the P.C. Station to the intersection point will be equal to
the X-Coordinate of the point of intersection. The 3o curve will be defined
as Curve No. 2, and the tangent will be defined as Curve No. 1. Curve No. 3
will not exist. Note that the Distance to Reference Point is not required
since Curve No. 2 is actually a circular curve.
In this example, it is assumed that the elevations are of no concern.
Therefore, all Grade Data are assigned values of zero, and the roadway crown
is defined as Level.
The left side of the bridge (looking ahead) is in a taper throughout the
entire length of the bridge. In the tangent portion the gutter will be a
Straight Taper, and in the curve the gutter will conform to a Curve Taper
(Spiral). The railing line is always at a constant distance from the gutter
line. The right gutter line in the tangent portion is parallel to the
mainline. However, in the curve portion the right gutter is a curve with a
radius of 1,500 feet and will be defined as a curve offset.
In this example, the gutter and railing lines must be defined twice,
i.e., defined for the tangent portion and again for the curve portion. The
longitudinal lines defined for the curve portion of the bridge will be skipped
in the tangent portion of the bridge, and vice versa. Note that if finished
grade elevations were being computed, the elevations in the shaded portion
(varying width) and/or on the curbs would have to be adjusted depending on the
width assigned to the lane of superelevation that represents the roadway.
The line separating the tangent and curve (P.C. Station) will be defined
as a T-Line in Span 1. (An alternate way to set up this problem is to divide
Span 1 into two spans with the radial line at the P.C. Station as a Bent Line.
Then define two sets of Longitudinal Lines.) No beams or additional T-Lines
are given in this example. The purpose of the example is to compute the data
necessary to define the curbs and railing in relation to a working line, and
the lengths along the railing lines.
- 158 -
Example Number Four
Example 4 is a three-span (continuous unit) bridge that is located on a
tangent. The bridge is placed parallel to the Y-axis by using a Reference
Angle equal to zero. The Reference Point Station is chosen as 25+00 in order
to place the entire bridge in the first quadrant. The Limiting Stations are
selected as 22+00 and 25+00. The mainline is placed at a distance of 1,000
feet from the Y-axis by the Reference Distance. The tangent is defined as
Curve No. 2 with a zero degree-of-curvature. Note that the bridge is in a
portion of two vertical curves. The Grade Data and parabolic crown dimensions
are given in the sketch of this example.
The centerline beam (B) is defined by coordinates since the coordinates
are readily known. This definition by coordinates is for illustration only,
since this beam could have been defined more conveniently as a Chord or Arc.
Beams A and C are defined as parallel to Beam B. These beams also could have
been defined as Chords or Arcs.
The purpose of this example is to compute the elevations at the
centerline-of-bearings of the end bents and splice points of the beams in
order to compute the slopes of the beam segments and top of beam elevations.
The entire bridge is set up as one span, and the centerline-of-bearings and
splice points are defined as T-Lines within that span. All the bent lines
will be skipped. For the purpose of illustration, the centerline-of-bearing
of Bent 4 is defined by coordinates.
Bents 2 and 3 and all splice points are parallel to Bent 1.
perpendicular to the mainline, i.e., a Skew Angle equal to zero.
Bent 4 is
The coordinates of the intersection points that will be given in the
Span Output Data have been computed beforehand and entered as Coordinate Type
Input. This is done in order to illustrate the usage of the Coordinate Type
Input.
- 170 -
EXAMPLE PROBLEM 4 (Continued)
- 171 -
- 172 -