1
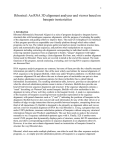
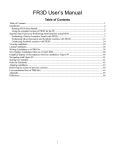
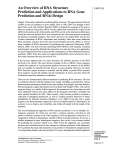
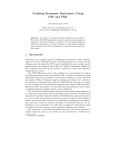
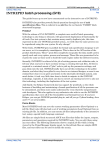
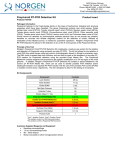
ISFOLD user manual
Page 1 of 10
ISFOLD: Structure prediction of non-helical RNA motifs from isostericity patterns observed in their
sequence alignments
User Manual
Table of Contents:
l
l
l
l
l
l
l
l
1. Introduction
¡ 1.1. Supported platforms and installation
¡ 1.2. Disclaimer
¡ 1.3. Contact information
¡ 1.4. Citation
2. Theory
¡ 2.1. Secondary structure prediction
¡ 2.2. ISFOLD and the prediction of tertiary interactions
¡ 2.3. Isostericity compliance score
¡ 2.4. Limitations
3. Using ISFOLD
¡ 3.1. Providing a FASTA alignment file
¡ 3.2. Entering nucleotide numbers
¡ 3.3. Entering mutation data
4. ISFOLD results
¡ 4.1. Results order and warnings
¡ 4.2. Base pair symbols
¡ 4.3. Arrow colors and annotations
5. ISFOLD options
6. Help menu
7. Case study: How are specific structure predictions made based on sequence alignment
References
1. Introduction
ISFOLD (ISosteric FOLDing) is a user-friendly program that predicts RNA base pair (bp) positions and types from variations seen in sequence alignments or
experimental mutations. The MATLAB file "BPpredictor.m" is the script version of the same program, which runs independently of the ISFOLD Graphical
User Interface (GUI).
1.1. Supported platforms and installation
ISFOLD is designed and fully tested under Windows XP. It is free and can be obtained from http://www.ucsf.edu/frankel/isfold/index.html. The program is
distributed in two forms: MATLAB source files capable of running on any PC or MAC with MATLAB version 7 SP2 or higher, or a stand-alone executable
capable of running on any PC platform after installation of a free compiler provided by Mathworks (details can be found here).
If you do not have MATLAB on your computer and want to use the stand-alone version (works on PC only, a MATLAB limitation not specific to our
software), you have to follow this procedure exactly:
Go to our download page at http://www.ucsf.edu/frankel/isfold/dnld.html, and go down to the section Stand-alone files (for PC). Then do the following:
1- Download “PC_compiler” and “ISFOLD” from the stand-alone section on the software download page.
2- Install PC_compiler first, follow all the prompts during the installation, and restart your PC.
3- Install / run ISFOLD by double-clicking isfold.exe found inside the “isfold” directory that you just downloaded and unzipped. The first time this file is
executed it may take a minute. To run ISFOLD in the future just double-click isfold.exe and the program GUI will start immediately.
1.2. Disclaimer
No guarantee, expressed or implied, is made as to the suitability of this software for any purpose, computer, or person. The author shall not be held
responsible, nor be liable for any damage occurring in any way to equipment or health while using this software.
1.3. Contact information
Ali Mokdad, M.D., Ph.D., Biochemistry and Biophysics Department, School of Medicine, University of California at San Francisco, Genentech Hall S574,
600 16th Street, San Francisco, CA 94158. Email: [email protected].
1.4. Citation
Mokdad, A. and Frankel, A. ISFOLD: Structure prediction of non-helical RNA motifs from isostericity patterns observed in their sequence alignments,
submitted.
2. Theory
2.1. Secondary structure prediction
Prediction of structure from sequence alignment is not a new idea. In fact, a great deal of the established RNA secondary structures (i.e., base-parings and
stackings in helical Watson Crick areas, otherwise known as secondary structures) are based on Comparative Sequence Analysis (CSA) [1-3]. This is not
surprising, since sequence alignments contain a vast wealth of structurally-useful information indeed, and it would have been surprising not to use this
information to predict some aspect of structure.
In the classical CSA method, sequence alignments are searched for patterns of recognizable Watson-Crick covariation (sequence variation occurring
ISFOLD user manual
Page 2 of 10
simultaneously at two nucleotide positions). When two or more covariation patterns such as AU, CG, GC, UA, GU, or UG are observed, the positions forming
these covariations would have positive evidence of cis Watson-Crick/Watson-Crick (cWW) base paring. The more such covariations, the stronger the
evidence. However, if other covariations are observed (such GG or AG etc...) this would be considered evidence against cWW base-paring. Obviously, if no
covariation at all is observed, then there is no evidence for or against cWW base-pairing. This method predicts cWW base-pairing when evidence for this type
of interaction overweighs evidence against it.
2.2. ISFOLD and the prediction of tertiary interactions
The CSA method and other methods for predicting secondary structure (such as energy minimization methods applied in mFold [4] and Dynalign [5]) would
have been accurate representations of 3D structure if cWW was the only possible bp interaction. However, the reality of RNA 3D structure is that about one
third of all edge-to-edge bp interactions are non cWW, and these may fall into anyone of a dozen or so possible interactions [6,7]. These non-WC bps make up
most of the interactive and dynamic motifs of RNA, such as internal loops and hairpin loops, that play major roles in inter and intra molecular contacts.
Fortunately, these non-WC interactions are well classified and documented, and they each have a specific and unique pattern of acceptable base substitutions
(see Figure 1). ISFOLD makes use of these known patterns (bp isostericity patterns) and looks for them in sequence alignments. It also makes use of actual
non-WC interaction frequencies observed in atomic resolution structures in different types of non-helical motifs (see the section 5 for more details). Recently,
a similar isosteric approach was applied by hand to predict the structure of an internal loop in Potato Spindle Tuber Viroid based on mutation data alone [8].
Figure 1: There are 12 main types or families of bp interactions and some intermediate ones (like family 13). Each of these families is further subdivided into isosteric subfamilies, indicated
by the different colors. Within the same bp family, boxes with the same color are isosteric, boxes with “similar” colors as defined in the lower right corner are near-isosteric, boxes with
different colors are heterosteric, and gray boxes are forbidden. Bp family nomenclatures: c: cis, t: trans, W: Watson-Crick edge, H: Hoogsteen edge, S: sugar edge.
2.3. Isostericity compliance scores
To decide which bp type fits best the variations observed in the alignment, an objective and meaningful way to score variations according to different bp
families is required. The same scoring scheme is used in RIBOSTRAL [9]. The individual weights in the score formula can be modified from ISFOLD options
(section 5), but this is its general form:
corc x (wi.I + wni.NI + wh.H + wf.F + wg1.G1 + wg2.G2) / num of seqs
ISFOLD user manual
Page 3 of 10
Where I, NI, H, F, G1, and G2 are the numbers of sequences at each potential bp position that, compared to the most common nucleotide identities occupying
that position, are either isosteric, near-isosteric, heterosteric, forbidden, deleted (gap) at one position, and deleted at both positions, respectively. wi, wni, wf,
wg1, and wg2 are the corresponding weights which can be changed by the user. Weights of favorable variations (such as I and NI) should be positive, and
those of unfavorable variations should be negative. corc is a correction coefficient = 100 / largest weight, so multiplying by corc and dividing by number of
sequences (num of seqs) guarantees that the maximum possible score is +100.
Since isostericity classes are comparative classes to some reference, usually a known atomic-resolution structure, it is necessary to define the reference in case
such a structure is not known. ISFOLD considers the most populated isosteric subfamily as the reference, so everything in it is counted as "isosteric".
Figure 2 shows an example calculation of isostericity compliance score.
Figure 2: This figure is a snapshot from RIBOSTRAL [9]. It shows how one viroid position-pair (PSTVd 99, 260), which is repeated in other examples on this manual, is scored according to
the tHS family. The formula used here is Score = 50 x (2I + NI - H - 5F -2G1 -3G2) / 31. From the figure, it can be determined that isosteric substitutions I = 25 (the majority of substitutions,
yellow), heterosteric substitutions H = 4 (green), and forbidden substitutions F = 2 (gray). there are no other subfamilies. Substitution of these counts into the formula yields a score of +58.
There are a few situations in which the score is not calculated according to the formula above:
1- One such situation is when bp family 11 (cSS) is being considered. This family is special because it is all made of one isosteric subfamily so all
substitutions in it are acceptable, meaning that a score of +100 would be always obtained if no gaps are involved. Thus this score can not be an indicator of
actual base-paring. To reduce this effect a score of +60 is assigned by default whenever family cSS is involved.
2- Another such situation is when there is absolutely no sequence variation at a potential bp position. This also is penalized and scored at 0 whenever a
positive score would be otherwise calculated.
3- When mutation data is used, scores of bps satisfying the mutations need to be boosted and scores of bps against mutations need to be penalized. This is
done by adding 10e5 to scores of bps satisfying the mutations, and subtracting 10e20 to scores of bps that contradict mutations.
These situations and others like them are well documented on the results screen, as described in section 4.3.
2.4. Limitations
There are a few limitations to our method that need to be well understood. It is important to note that, very often, compensatory mutations that satisfy non-WC
bp interactions are not really covariations, but just variation at one position while the other position remains conserved (e.g.: AA, AC, AG, and AU are all
acceptable variations in the trans sugar edge/sugar edge or tSS interaction). This means it is usually harder to spot and measure positive evidence for these
variations than it is with cWW covariations. This is why our method is especially sensitive to the quality and size of alignments (the more meaningful
variations are observed the more accurately a proper bp family can be specified).
Another limitation is that although the non-WC interactions compose a significant one third of all RNA interactions, there are still about a dozen of them, and
although they each have a unique pattern of acceptable nucleotide variations, some of them share some aspects of these patterns, and not all their acceptable
substitution patterns are filled equally. All of this makes it hard to pinpoint which specific type of base-paring occurs and where. Again, this limitation can be
minimized when the alignment used is accurate, has many sequences, and is rich with variations. It also helps if additional experimental information, such as
mutation data which pinpoints pairs of positions that behave as a unit, is used as well (see section 3.3). In case such additional data is not available, and the
alignment is not accurate, large, or rich enough, then ISFOLD should be used not as a tool for predicting existing interactions, but as a tool for refuting
improbable interactions that have clear evidence against them.
It is important to note at this point that, by definition, ISFOLD, like other alignment-based structure predicting methods, requires the alignment to be given in
advance and makes predictions based on it. At the same time, it is important to understand that the alignments available today are not MA'SOOM. That is
especially true at non-helical areas, where the most common alignment algorithms loose track of "meaningful" mutations. So all of this affects the quality of
our structure predictions. The best way to deal with this fundamental issue that all structure-predicting methods suffer from is by coupling structure prediction
with sequence re-alignment. The two procedures are in fact two halves of the same process that, through several repeated iterations, should result in the
accurate prediction of structure and at the same time enhancement of sequence alignment. For this purpose we suggest the use of ISFOLD together with
RIBOSTRAL [9], which is a tool for analyzing and evaluating sequence alignments based on structure.
Finally, it is important to note that ISFOLD analyzes and predicts bps independently of each other. In other words, it is not a tool for predicting full motifs but
a tool for predicting individual bps. The difference is that motifs usually have specific global arrangements or combinations of bps that tend to occur together
in specific manners. Since the motif arrangements and possible ranges are not yet defined or characterized, it is impossible to account for them in the current
method. When a complete database of 3D motifs would be available, their full profiles can be characterized and this method enhanced.
3. Using ISFOLD
ISFOLD predicts bp interactions supported by an input FASTA alignment file, or by experimental mutation data, or by both. Thus, there are two entry points
to start running the program: In case you want to analyze an alignment file, you should provide the alignment file first, and then enter NT numbers and the
optional mutation data. In case you do not have an alignment file, and you want to predict base-pairing based on mutation data alone, then skip entering the
ISFOLD user manual
Page 4 of 10
alignment file and start by entering NT numbers that represent your motif (the numbers themselves are not important in this case, they are just needed to
define the size of the motif). Figure 3 shows a snapshot of the first screen you see when you start ISFOLD.
Figure 3. Snapshot of ISFOLD principle Graphical User Interface (GUI). The MATLAB file "BPpredictor.m" is the script version of the same program.
3.1. Providing a FASTA alignment file
To provide a FASTA alignment file, click on "Browse for alignment" or directly write the filename (with path) in the top edit box. After that you will be
prompted to choose a reference sequence for the NT numbers. Universal numbers are used by default if no specific sequence is chosen.
l
l
Note 1: When a FASTA file is analyzed for the first time, a MATLAB data file with extension .mat is created in the same location and with the same
name. This data file contains the same information as the original FASTA file but loads faster, which may be advantageous in case of repetitive studies
on a large FASTA file.
Note 2: If you do not provide an alignment file the letter "M" will be automatically entered instead of a filename in the top edit box.
3.2. Entering nucleotide numbers
There are two edit boxes in the middle of the GUI for entering nucleotide numbers: use only the first if you are analyzing a hairpin loop, or use both if you are
analyzing an internal loop. The numbers should be separated by commas "," if discontinuous, or dashes "-" or colons ":" if continuous. This works if
nucleotide numbers are either in increasing or decreasing order.
Orientation of the results graph: Note that in case an internal loop is analyzed, the orientation of the results graph representing the motif depends on the
order in which nucleotide numbers are entered. The first strand nucleotides are positioned on the graph at the left side from bottom to top, and the second
strand are positioned at the right side from top to bottom.
3.3. Entering mutation data
You can specify viable and lethal mutation data between any pair of nucleotides. These do not need to be mutations per se, but may be the wild type bp
identities if known. Any additional experimental mutation data can help ISFOLD pinpoint and thus predict the interactions better.
How to enter this data: Just type the two bp letters (such as AC) in the box corresponding to the pair of nucleotides in question. If you enter the tilde sign (~)
before the two letters, then this means a lethal mutant. If no such sign precedes the letters, this means a viable mutant. You can enter several viable and lethal
mutants in any box if you separate them with commas. An example of such an entry is: ~CG, AA, ~GU, ~UC. Only the characters A, C, G, U, T, R (any
purine), Y (any pyrimidine), and N (any nucleotide) are allowed. You can also leave boxes empty. Just remember that the order of the letters entered must
correspond to row then column.
Figure 4 shows an example of acceptable mutation data.
Figure 4. Example of mutation data codes acceptable by ISFOLD. Acceptable nucleotide codes are A, C, G, U, T, R, Y, and N. The tilde sign (~) denotes lethal mutation.
ISFOLD user manual
Page 5 of 10
4. ISFOLD results
ISFOLD reports its predictions graphically on a new interactive Graphical User Interface (GUI) and also prints out the results on screen if instructed to do so
in its options (see section 5). There are a few things to understand about the way the predictions are reported: ISFOLD analyzes each nucleotide pair and
scores and ranks it with respect to all 13 bp families shown in Figure 1 above. It then reports the highest ranking "potential" interactions first, followed by the
next highest ranking, and so on. If several interactions score exactly the same (common if small or very conserved alignment is used) then the corresponding
results are scored by bp frequency in the context of the motif being analyzed (see section 5).
Figure 5 shows an example of such a result.
Figure 5. ISFOLD displays the results graphically using Leontis/Westhof representations for bps (explained below). The letter next to each nucleotide number corresponds to the most
common nucleotide at this position, and its size is proportional to its frequency at that position. ISFOLD also prints out the ordered scores on screen if instructed to do so under options. To
show a variety of bp scores and their corresponding arrow colors, the example shown here is an application of ISFOLD on an inaccurate and small sequence alignment. The lower portion of
this results GUI shows different warnings if any, such as the warning about low scoring bps in this example.
4.1. Results order and warnings
Following is a step-by-step explanation of how the results are displayed and ordered. Consider that an internal loop is analyzed (such as the one in Figure 5).
Each nucleotide from the first strand (left) is matched with each of the nucleotides from the second strand (right) and the corresponding isostericity
compliance score according to each family is computed. The scores are then ranked and the highest ranking results for each bp are displayed on the first result
screen (note the title Isfold Result 1 printed at the top of the results GUI). This does not necessarily mean that all such interactions from the first result screen
actually occur. It only means that these represent the highest ranking interactions that each nucleotide from the first strand (left) can have. If the score is very
low or negative then it would mean that most probably such an interaction does not occur. Note that the results of a big motif are the combination of results of
its individual constituent bps. This means that one part of a result screen may be correct while another part incorrect. Although ISFOLD ranking is expected to
work in many cases, it is not guaranteed to work every single time. Going to the next best results may be necessary to determine the motif structure. This can
be done by clicking the "Next >" button on the results GUI. Hairpin loops are treated in a similar way, where each nucleotide is checked against all others.
It is important to note that this program will keep displaying less and less probable results every time the "Next >" button is clicked, or until there are no more
possible bp interactions. The results are not prevented from appearing if a certain cutoff point is reached. Instead, bps that are not supported by sequence
alignments are still displayed after the better ones, but they are colored in a way to reflect their low probabilities. Depending on the context of the motif being
studied, such as its specific function, its interactions with external agents, etc..., bps colored in red or blue are usually not probable. In addition, interactions
with scores <+60 are displayed with a warning. We chose to display these interactions anyway instead of stopping when they are reached because for some
users it might useful to learn what are the interactions that are least supported. (See section 4.3 for more details about the colors used).
ISFOLD user manual
Page 6 of 10
In some instances, one or a few nucleotides from the second strand of an internal loop (right side) might end up pairing with two or more nucleotides from the
first strand (left side). This might not necessarily mean a base triplet or higher order complexes, but may simply be due to the fact that the particular variation
pattern observed with the common nucleotide makes it rank best with several partners. Obviously, if the common nucleotide is predicted to use the same edge
in several interactions, only one such interaction can occur at once. In such cases a warning on the lower portion of the results screen is displayed. Other
warnings may also appear on this reserved lower portion of the results screen. Such warnings are issued if the sequence alignment is too small, if it has little
variation, if a displayed bp scores too low, or if mutation data is not satisfied by any known interaction type, etc...
4.2. Base pair symbols
Figure 6 lists all the possible bp symbols that you can see on ISFOLD results screen. These symbols are based on Leontis/Westhof nomenclature [6], and uses
a new symbol for the bifurcated cWW/tWH family.
Figure 6. Based on Leontis/Westhof nomenclature and annotation [6], Watson-Crick (W) edge is represented by a circle, Hoogsteen (H) edge by a square, and sugar (S) edge by a triangle.
Solid symbols represent cis (c), and open symbols represent trans (t) orientations around the glycosidic bond. A new symbol is introduced for the bifurcated cWW/tWH family.
4.3. Arrow colors and annotations
As explained above, ISFOLD displays interactions in the order of how strongly they are supported by variations in the sequence alignment. If mutation data
are provided, bps that satisfy that data are displayed first, and those contradicting them are displayed last.
Colors:
The colors of the arrows representing the bp interactions depend on the isostericity compliance score of the alignment positions with that bp family. These
colors are as follows:
1- When substitutions at two positions are completely isosteric according to a certain bp family, the score of that potential bp is a perfect +100 (best), and the
arrow representing this interaction is displayed in black.
2- As substitutions become less compatible with a certain bp family by accumulating near-isosteric, heterosteric, or forbidden substitutions, or by
accumulating gaps (deletions), the score according to that bp family is penalized and becomes lower. The corresponding arrow is displayed in shades of gray,
the darkest being the ones with scores closer to +100, and the faintest being those with scores closer to 0.
3- When the score is penalized more and more, it may become negative. A negative score means that the interaction has strong evidence against it in the
sequence alignment, such as too many forbidden substitutions according to that bp family. Such interactions are displayed in blue to make them stand out as
improbable interactions.
4- Finally, bp families that are against mutation data are displayed last in red, in case the user wants to see what these are.
Annotations:
In addition to color coding the interaction arrows, some annotation may also appear on top of them to provide further clarification. Usually, the isostericity
compliance score appears on top of the interaction arrows, but sometime some other annotation may be used, as follows:
1- If a potential bp position does not show any sequence variation in the alignment, the annotation 'no var' appears on the interaction arrow (this means no
prediction can be made).
2- If a potential bp contradicts or is against the provided mutation data, the annotation 'ag muts' appears on the interaction arrow.
3- If a potential bp position is always forbidden according to a certain bp family, the number of forbidden cases is indicated followed by the word 'forbs'.
4- If a potential bp position is deleted (gap) in all sequences, either at one nucleotide position or both, the message 'all Gaps' appears on the interaction arrow.
5- If the sequence at a potential bp position is not determined (N) in all sequences, either at one nucleotide position or both, the message 'all Ns' appears on the
interaction arrow.
6- The text 'alw sat' meaning "always satisfied" appears on the interaction arrow representing family 11 (cSS), since this family is always satisfied no matter
what the sequence variations are.
5. ISFOLD options
ISFOLD options control the behavior of ISFOLD program. They can be changed either from MATLAB script, or from the options GUI. Figure 7 shows a
snapshot of the options GUI.
ISFOLD user manual
Page 7 of 10
Figure 7. ISFOLD options GUI.
Following is an explanation of each section of the options GUI:
Basepair frequency context: When ISFOLD makes its calculations, it sorts the results first by score, and then by actual bp frequencies seen in different
structural contexts, such as internal loops or internal loops. These statistics are extracted from the best ribosomal crystal structures to date (PDB 1s72
representing 23S and 5S H. marismortui at 2.4 A resolution [10], and PDB 2J00 representing16S T. thermophilus at 2.8A resolution [11]). If you set this
option to 'Automatic', ISFOLD will automatically use internal loop statistics when two sets of input NT numbers are provided, or hairpin loop statistics when
only one set of input NT numbers is provided. If this option is set to 'Unknown', then statistics from all RNA contexts will be used. If it is set to 'Non-helical',
then statistics from all non-helical areas, such as internal loops, hairpin loops, junctions, and long-range tertiary interactions are used. The last two options,
'Internal loop' and 'Hairpin loop' are self explanatory. The values of bp frequencies are defined in the file BPfreq.m. Current values are shown in Table 1
below.
Table 1. Bp frequencies in different contexts used in ISFOLD. These values are defined in the file BPfreq.m.
Print best scores on screen: There are 13 bp families with characterized isosteric subfamilies. Isosteric compliance scores are calculated for each one of these
families between each of the possible pairs of query nucleotides, and the best scoring ones are displayed on a results GUI. However, if a user would like to
inspect the scores on screen then all is needed is to choose the number of scores to view from this popup menu. These will appear on the MATLAB command
prompt if the MATLAB version of the program is used, or the DOS prompt if the stand-alone executable is used.
Score formula (weights of isosteric subfamilies): Here you can set your preferred weights for different isosteric subfamilies to be used in the score formula.
See section 2.3 for an explanation of this formula.
6. Help menu
Under the main GUI help menu, the manual, update information, and version information of ISFOLD can be found. Different GUIs like the options and
mutations GUIs link the user directly to relevant help sections.
7. Case study: How are specific structure predictions made based on sequence alignment
Following
is
a
case
study
on
a
specific
multiple
alignment
provided
with
the
program
(GeneratedAlignmentcWWtWWcWHtWHcWStWScHHtHHcHStHScSStSsbif1000.fasta). This alignment was generated automatically in a way to simulate
the variations seen in real alignments. The reason a generated alignment and not a real alignment is used is that the generated one contains a large number of
variant sequences (1000) that are accurately aligned with each other. In this manner this example will only concentrate on predicting bp interactions based on
this alignment, rather than questioning the quality of the alignment itself (it should be noted that the improvement of alignments and the prediction of structure
from them go hand by hand, we obtain both a good alignment and a good model by iterating several times through the two processes).
ISFOLD user manual
Page 8 of 10
This alignment has all 13 bp interactions with known isostericity matrices (shown in Figure 1), as seen in Figure 8:
Figure 8. The alignment used in this example and displayed by RIBOSTRAL Alignment Viewer [9]. This figure shows that the alignment (only first few sequences shown) is generally in
agreement with the designed structure, as most substitutions are colored in green, meaning they are isosteric substitutions to the most common bp seen at that position.
The structure masks shown on top of Figure 8 also show the designed structure of the generated alignment to be like this: nucleotides 1 and 26 form a cWW, 2
and 25 tWW, 3 and 24 cWH, 4 and 23 tWH, 5 and 22 cWS, 6 and 21 tWS, 7 and 20 cHH, 8 and 19 tHH, 9 and 18 cHS, 10 and 17 tHS, 11 and 16 cSS, 12 and
15 tSs, and finally 13 and 14 bif. A better way to show these interactions is graphically, as in Figure 9:
Figure 9. Representation of the interactions that gave rise to the generated alignment displayed in Figure 8. A perfect algorithm is one that can produce such a prediction based on the
alignment alone.
Now we can start testing ISFOLD. The actual structure is hidden from the program, the only thing it is given is the alignment. We can now attempt to predict
the structure of an area that simulates the size of an average internal loop motif. Predicting the whole artificial 13 x 13 nucleotide motif is not a usual task that
an average user will do. It is in fact possible to analyze the whole motif, but since this program is not limited to finding pairs of positions that covary (mutate
at two positions at once) like classical CSA method, it is inevitable in some cases to get false positive results. The larger the motif, the more we expect to see
false positive results, just because there is a larger pool of sequence positions that can be matched together and by random might satisfy the isostericity
signature of a certain bp family. Alternatively, the user can ask the program to predict a larger area if mutation data that limits possibilities is also provided.
For this particular example, we will ask the program to predict the interactions between 1-4 and 23-26, which simulates an internal loop motif with 4 stacked
bps. Figure 10 shows the first two ISFOLD results:
ISFOLD user manual
Page 9 of 10
Figure 10. First two ISFOLD results shown side by side. By comparing to Figure 9 above, one can see that most predictions reported in the first results screen (left panel) are correct, except
for the interaction between positions 4 and 23. This interaction is predicted correctly in the second results screen (right panel). The text "alw sat" that appears on two interaction arrows on the
right panel is to remind the user that the particular interaction shown by these arrows (cSs) is always satisfied, since all mutations in that family are allowed and isosteric to one another. For
this particular bp family the isostericity compliance score is not calculated, because it will always compute as +100 and will bias the results, but rather assigned to +60.
Note that the isostericity compliance score for the interaction cHS, which is wrongly predicted between positions 4 and 23 in the first results screen, is 87,
while the score for the actual interaction that is supposed to be between these two positions (tWH) is only slightly smaller (85). In fact, such difference in
scores is not enough to make significant distinction, so in such cases it is advisable to provide additional information, such as mutation data that might agree
with one of the two interactions and contradict the other.
In Figure 11, each of the 4 interacions of this example are analyzed with RIBOSTRAL [9] to show the observed substitutions and thus clarify how predictions
were made:
ISFOLD user manual
Page 10 of 10
Figure 11. RIBOSTRAL [9] results of the motif predicted by ISFOLD, showing substitutions on isosterically colored tables. The colors have the same meanings as in Figure 1 above.
Discussion: Panels a and b of Figure 11 represent the actual (and in these two cases also predicted) interactions between positions 1 & 26, and 2 & 25
respectively. The substitution patterns seen in these two panels only agree with the bp families cWW and tWW respectively. Panels c and d represent the
interaction between positions 3 & 24, c being the actual and best predicted interaction (cWH), and d is the next best predicted interaction (cHS). In this case
both cWH and cHS can be well satisfied by the observed substitutions, but no other bp family can be so well satisfied at these two positions. Similarly,
substitutions at positions 4 & 23 agree with bp types cHS (panel f) and tWH (panel e). In this case, ISFOLD's best prediction is cHS, which scores best (87),
but it happened that the actual interaction is tWH, which scores slightly lower (85). As seen by both panel groups c, d and e, f, the two families tWH and cHS
share similar isostericity patterns, so it is sometimes difficult to differentiate between them based on observed subsititutions alone. If there was additional
mutation data that shows that AC mutations for example are lethal at positions 4,23, then that would have completely overruled cHS interactions since such a
mutation there would have been allowed, and the only possible interaction in that case would be tWH.
References
1. Gutell, R.R., Weiser B., Woese C.R., and Noller H.F. (1985). Comparative anatomy of 16-Slike ribosomal RNA. Prog Nucleic Acid Res Mol Biol 32: 155216.
2. Michel, F., and Westhof, E. (1990). Modelling of the three-dimensional architecture of group I catalytic introns based on comparative sequence analysis. J
Mol Biol 216(3): 585-610.
3. Gutell, R.R., Lee, J.C. and Cannone, J.J. (2002) The accuracy of ribosomal RNA comparative structure models. Curr. Opin. Struct. Biol., 12, 301-310.
4. Zuker, M. (2003). Mfold web server for nucleic acid folding and hybridization prediction. Nucleic Acids Res 31(13): 3406-15.
5. Mathews, D.H,. and Turner D.H. (2002). Dynalign: an algorithm for finding the secondary structure common to two RNA sequences. J Mol Biol 317(2):
191-203.
6. Leontis, N.B. and Westhof, E. (2001). Geometric nomenclature and classification of RNA base pairs. RNA, 7, 499-512.
7. Leontis, N.B., Stombaugh, J. and Westhof, E. (2002). The non-Watson-Crick base pairs and their associated isostericity matrices. Nucleic Acids Res, 30,
3497-3531.
8. Zhong, X., Leontis, N., Qian, S., Itaya A., Qi, Y., Boris-Lawrie, K., and Ding, B. (2006). Tertiary structural and functional analyses of a viroid RNA motif
by isostericity matrix and mutagenesis reveal its essential role in replication. J Virol, 80(17): p. 8566-81.
9. Mokdad, A., and Leontis, N. (2006). Ribostral: An RNA 3D alignment analyzer and viewer based on basepair isostericities. Bioinformatics, 22(17): 216870.
10. Ban, N., Nissen P., Hansen J., Moore P.B., and Steitz T.A. (2000). The complete atomic structure of the large ribosomal subunit at 2.4 A resolution.
Science 289(5481): 905-20.
11. Selmer, M., Dunham, C.M., Murphy, F.V., Weixlbaumer, A., Petry, S., Kelley, A.C., Weir, J.R., and Ramakrishnan, V. (2006). Structure of the 70S
Ribosome Complexed with Mrna and tRNA. Science v313 pp.1935.