1
Limitation of Liability
Information in this document is subject to change without notice.
THE TRADING SIGNALS, INDICATORS, SHOWME STUDIES, PAINTBAR STUDIES,
PROBABILITYMAP STUDIES, ACTIVITYBAR STUDIES, SEARCH STRATEGIES, MODELS,
FUNCTIONS AND TRADING STRATEGIES (AND PARTS THEREOF) IN THIS BOOK ARE
EXAMPLES ONLY, AND HAVE BEEN INCLUDED SOLELY FOR EDUCATIONAL PURPOSES.
OMEGA RESEARCH DOES NOT RECOMMEND THAT YOU USE ANY SUCH TRADING SIGNALS,
INDICATORS, SHOWME STUDIES, PAINTBAR STUDIES, PROBABILITYMAP STUDIES,
ACTIVITYBAR STUDIES, SEARCH STRATEGIES, MODELS, FUNCTIONS, OR TRADING
STRATEGIES (OR ANY PARTS THEREOF), AS THE USE OF ANY SUCH TRADING SIGNALS,
INDICATORS, SHOWME STUDIES, PAINTBAR STUDIES, PROBABILITYMAP STUDIES,
ACTIVITYBAR STUDIES, SEARCH STRATEGIES, MODELS, FUNCTIONS AND TRADING
STRATEGIES DOES NOT GUARANTEE THAT YOU WILL MAKE PROFITS, INCREASE PROFITS,
OR MINIMIZE LOSSES. THE SOLE INTENDED USES OF THE TRADING SIGNALS, INDICATORS,
SHOWME STUDIES, PAINTBAR STUDIES, PROBABILITYMAP STUDIES, ACTIVITYBAR
STUDIES, SEARCH STRATEGIES, MODELS, FUNCTIONS, AND TRADING STRATEGIES
INCLUDED IN THIS BOOK ARE TO DEMONSTRATE HOW EASYLANGUAGE CAN BE USED TO
DESIGN THEM.
OMEGA RESEARCH, INC. IS NOT ENGAGED IN RENDERING ANY INVESTMENT OR OTHER
PROFESSIONAL ADVICE. IF INVESTMENT OR OTHER PROFESSIONAL ADVICE IS REQUIRED,
THE SERVICES OF A LICENSED PROFESSIONAL SHOULD BE SOUGHT.
Copyright © 2000 Omega Research, Inc. All rights reserved. No part of this publication may be reproduced,
stored in a retrieval system, or transmitted in any form or by any means, electronic, mechanical, photocopying,
recording, or otherwise, without prior written permission of Omega Research, Inc. Printed in the United States
of America.
TradeStation®, SuperCharts®, OptionStation®, Omega Research ProSuite®, PowerEditor®, and
EasyLanguage® are registered trademarks of Omega Research, Inc. RadarScreen, ProbabilityMap, ActivityBar,
PaintBar and ShowMe are trademarks of Omega Research, Inc. Microsoft is a registered trademark of Microsoft
Corporation and MS-DOS and Windows are trademarks of Microsoft Corporation.
Contents
CHAPTER: 1 - Introduction ...................................................................1
What is EasyLanguage? ..................................................................................................... 2
What Can You Create? ....................................................................................................... 2
Additional Resources .......................................................................................................... 3
CHAPTER: 2 - The Basic EasyLanguage Elements ..............................5
How EasyLanguage is Evaluated ....................................................................................... 6
About the Language ......................................................................................................... 10
Referencing Price Data ..................................................................................................... 11
Expressions and Operators ............................................................................................... 12
Referencing Previous Values ........................................................................................... 17
Manipulating Dates and Times ......................................................................................... 20
Using Variables ................................................................................................................ 25
Using Inputs ...................................................................................................................... 30
EasyLanguage Control Structures .................................................................................... 33
Writing Alerts ................................................................................................................... 39
Understanding Arrays ....................................................................................................... 45
Understanding User Functions ......................................................................................... 50
Output Methods ................................................................................................................ 64
Drawing Text on Price Charts .......................................................................................... 76
Drawing Trendlines on Price Charts ................................................................................ 89
Understanding Quote Fields ........................................................................................... 109
Multimedia and EasyLanguage ...................................................................................... 110
CHAPTER: 3 - EasyLanguage for TradeStation ..............................115
Writing Trading Signals ................................................................................................. 116
The Trading Strategy Testing Engine ............................................................................. 117
Trading Verbs ................................................................................................................. 131
Understanding Built-in Stops ......................................................................................... 144
ii
Contents
Writing Indicators and Studies .............................................................................................. 148
Writing ShowMe and PaintBar Studies ................................................................................ 154
Writing ProbabilityMap Studies ............................................................................................ 159
Writing ActivityBar Studies .................................................................................................. 166
CHAPTER: 4 - EasyLanguage for RadarScreen .....................................179
Writing RadarScreen Indicators ............................................................................................ 180
Writing Indicators for SuperCharts SE ................................................................................. 185
Specifying Availability of Indicators .................................................................................... 191
CHAPTER: 5 - EasyLanguage for OptionStation ...................................193
OptionStation Data Analysis ................................................................................................. 194
Reading OptionStation Data .................................................................................................. 195
Writing OptionStation Indicators .......................................................................................... 204
Writing Indicators for SuperCharts SE ................................................................................. 208
Writing Search Strategies ...................................................................................................... 214
Writing OptionStation Models .............................................................................................. 221
OptionStation Global Variables ............................................................................................ 233
CHAPTER: 6 - EasyLanguage and Other Languages ............................235
Defining a DLL Function ...................................................................................................... 236
Using Functions from DLLs ................................................................................................. 238
More About the EasyLanguage DLL Extension Kit ............................................................. 239
APPENDIX A: - EasyLanguage Syntax Errors .......................................241
APPENDIX B: - EasyLanguage Colors, Widths & Codes ......................273
APPENDIX C: - Reserved Words Quick Reference ...............................275
Index..............................................................................................................337
CHAPTER 1
Introduction
This book is a comprehensive reference for EasyLanguage, Omega Research’s industrystandard computer language. It explains in detail the capabilities of the language and its
structure, using examples throughout to illustrate the concepts and syntax presented.
This book first covers the basic elements of EasyLanguage common to the Omega
Research products—TradeStation, RadarScreen, and OptionStation—and then delves
more deeply into the EasyLanguage specifically for use with each.
This book covers EasyLanguage concepts in the context of the products; it does not
provide procedural information on using the EasyLanguage PowerEditor or the Omega
Research products or the user interface. All procedural instructions are covered in the
Online User Manual.
The appendixes at the back of the book contain two useful references: a reserved word
quick reference and the EasyLanguage syntax errors. The reserved word quick reference
is a complete list of the EasyLanguage reserved words, listed alphabetically. The syntax
error list is a complete list of the verification syntax errors generated by the PowerEditor,
listed by error number. You’ll find this useful when troubleshooting your EasyLanguage.
In This Chapter
What is EasyLanguage? ........................... 2
What Can You Create?............................. 2
Additional Resources ............................... 3
2
What is EasyLanguage?
CHAPTER 1
What is EasyLanguage?
EasyLanguage is a simple, but powerful, computer language that enables you to create
your own custom trading and technical analysis tools. By combining common trading
terminology with simple decision statements, EasyLanguage makes it easy for you to
write your own trading rules and actions in a clear and straightforward manner.
Simply put, TradeStation, RadarScreen, or OptionStation reads your EasyLanguage
statements, evaluates them based on the price data that has been collected, and performs
the specified actions.
What Can You Create?
EasyLanguage enables you to create your own trading signals, indicators, studies, search
strategies, models, and functions. Or, if you choose, you can copy and modify any of the
hundreds of built-in trading signals, analysis techniques, and functions that are included
with the Omega Research products.
The types of trading and technical analysis tools you can create for each Omega Research
product are:
TradeStation
Indicators (chart-based)
ShowMe Studies
PaintBar Studies
ActivityBar Studies
ProbabilityMap Studies
Trading Signals (to form Trading Strategies)
Functions
RadarScreen
Indicators (grid-based)
Functions
OptionStation
Indicators (grid-based)
Search Strategies
Pricing Models
Volatility Models
Bid/Ask Models
Introduction
Additional Resources
3
Functions
SuperCharts SE (included with RadarScreen and OptionStation)
Indicators (chart-based)
Your Omega Research product can store a total of 1,000 ActivityBar studies, 1,000
functions, 1,000 trading signals and trading strategies (combined), and 1,000
indicators, ShowMe studies, PaintBar studies, ProbabilityMap studies, search
strategies, and models (combined). Keep this limit in mind when creating your trading
signals, analysis techniques, and functions.
Additional Resources
To reduce your EasyLanguage learning curve, Omega Research provides the following educational and support resources:
Learning to Use EasyLanguage Book
It is easiest to learn a computer language step by step, following a structured outline, building upon examples, and practicing what you’ve learned along the way. The Learning to Use
EasyLanguage book included with your Omega Research product provides step-by-step
learning, and we strongly suggest you use it as your introduction to EasyLanguage, or as a
refresher before delving into this reference.
EasyLanguage Support Center
The EasyLanguage Support Center provides various resources to help you create your trading and technical analysis tools, including access to technical support, a list of
EasyLanguage solution providers, and analysis techniques you can download and import
into your EasyLanguage PowerEditor.
To access the EasyLanguage Support Center, visit:
www.omegaresearch.com/support/easylanguage_support/
Strategy Trading and Development Club (STAD)
The STAD Club is a recurring publication that provides trading ideas and the
EasyLanguage to implement them.
Whether you're new to strategy testing and development and need some help creating
your strategies and techniques, or you're a seasoned pro looking for ways to refine your
ideas and maximize your returns, this club will help you master the process of
developing and perfecting your own trading ideas.
For more information on the club, visit our web site:
www.omegaresearch.com
4
Additional Resources
CHAPTER 1
CHAPTER 2
The Basic EasyLanguage Elements
EasyLanguage is the industry standard language used to describe trading ideas, and it is the
most powerful, versatile, and easy to use customization tool used by traders world wide.
But how does it work? This chapter answers that question, and introduces you to the
syntax, grammar, control structures, and general concepts that are the foundation for
EasyLanguage.
This chapter discusses how EasyLanguage performs its calculations, and provides a solid
foundation for you to begin working with one or more Omega Research products—
TradeStation, OptionStation, or RadarScreen.
In This Chapter
How EasyLanguage is Evaluated............. 6
Writing Alerts......................................... 39
About the Language ............................... 10
Understanding Arrays ............................ 45
Referencing Price Data........................... 11
Understanding User Functions ............... 50
Expressions and Operators ..................... 12
Output Methods...................................... 64
Referencing Previous Values ................. 17
Drawing Text on Price Charts................ 76
Manipulating Dates and Times .............. 20
Drawing Trendlines on Price Charts ...... 89
Using Variables ...................................... 25
Understanding Quote Fields................. 109
Using Inputs ........................................... 30
Multimedia and EasyLanguage............ 110
EasyLanguage Control Structures.......... 33
6
How EasyLanguage is Evaluated
CHAPTER 2
How EasyLanguage is Evaluated
Regardless of what type of trading or technical analysis tool you’re writing—an indicator,
trading signal, search strategy, etc.—the first step is understanding how EasyLanguage
evaluates data.
EasyLanguage and Price Charts
A price chart typically consists of a number of bars built from price data associated with a
specified trading instrument. Each bar summarizes the prices for a trading interval—most
commonly a time period such as five minutes or one day—and includes values such as the
open, high, low, and closing prices for that period. Other bar data such as the date and time
of the bar’s close, the volume, and the open interest is also available for each bar.
One of the main uses of EasyLanguage is to evaluate price data from one bar and compare
it to data from other bars; therefore, it is important to understand how an
EasyLanguage trading signal, analysis technique (i.e., indicator, study, search strategy or
model) or function evaluates the price data on a price chart and performs its analysis.
Let’s look at a simple one-line trading signal:
If the Close > High of 1 Bar Ago Then Buy at Market;
This simple statement is instructing EasyLanguage to compare the closing price of one bar
with the high price of another, and to generate a buy order for the open of the next bar when
the close is greater than the high. This comparison is made on the closing price of every bar
in the chart, each time referencing the high price of the preceding bar.
Assume you have incorporated the above trading signal into a trading strategy that you’ve
applied to a chart. Even though your trading strategy is applied to a chart filled with many
different bars, the information that is evaluated for each bar is always the same (i.e., close
price, volume, high price, etc.). Remember, a chart is a visual representation of a period of
trading history for a symbol, where individual bars represent trading intervals.
To evaluate your chart, EasyLanguage evaluates the price data from the very first bar in the
chart to the most recent bar on the chart. In terms of your trading signal, analysis technique,
or function, the bar being evaluated is considered the current bar (thus, at some point, every
bar on the chart is considered to be the current bar). The EasyLanguage statements in your
procedure are always evaluated relative to the current bar.
Now, on the first bar of the chart, there are no previous bars so the comparison in the
example above cannot be performed. Thus, the trading strategy would have to wait until the second bar of the chart in order to perform any calculation. This is called ‘maximum number of bars the study will reference’ or MaxBarsBack. This concept is
discussed in detail on page 18.
When your procedure is done evaluating the current bar, EasyLanguage steps forward to
the next bar in the chart, making it the bar on which the statements in your procedure are
evaluated, or the current bar.
Typically, a trading signal, analysis technique or function includes a number of instructions, each of which can result in an action; for example, an indicator will display a value,
The Basic EasyLanguage Elements
How EasyLanguage is Evaluated
7
and a trading signal will generate a buy or sell order. Once all the EasyLanguage instructions are processed for the current bar, the price data from the next bar is read and the instructions are evaluated using the new prices. This continues across the chart from left to
right, until all of the bars from the chart are read and analyzed. Using the trading signal example, the result is that for a 500-bar chart, the instructions are evaluated a total of 499
times, once for each bar (except the first bar, when there is not enough data to perform the
calculation).
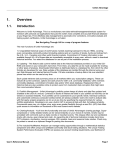
For example, look at the chart shown in Figure 2-1, consisting of bars A through H, to
which we applied an indicator named HiLoPlot. Each statement within the indicator is evaluated from the first line of EasyLanguage to the last, and for every bar of the chart, one at
a time, starting with the price data from bar A, then from bar B, etc. across all of the bars
in the chart.
Figure 2-1. Evaluating bars from the first line to the last, and left to right
Even though the EasyLanguage instructions might not be clear at this time, it’s
important that you understand that each instruction is evaluated, in order from the first
line to the last, for every bar of the chart, one at a time.
EasyLanguage and Grids
You can also apply indicators to grid windows, such as RadarScreen and the OptionStation
Position Analysis Window.
When thinking about analysis techniques on price charts, we think in terms of analyzing
past data in order to display information about the current market; applying indicators to
grids is no different.
A grid allows us to analyze and view the results of multiple trading instruments simultaneously. As with price charts, past values are available for the analysis. For example, a
8
How EasyLanguage is Evaluated
CHAPTER 2
10-bar moving average will be able to reference the close of the last 10 bars in any grid
window.
Because the objective of grid applications is to analyze multiple trading instruments at the
same time, they are optimized to use as little data as needed (to save memory and increase
calculation speed). Due to this optimization feature, most indicators are defaulted to calculate only on the most recent bar, or trading interval, and to load only the necessary data.
Let’s elaborate on this concept. When an indicator is applied to a grid window, EasyLanguage determines the maximum number of bars the indicator needs to perform its calculations, and passes this number to the application (i.e., RadarScreen or OptionStation). The
application then obtains as much data as necessary for the EasyLanguage indicator to perform its calculations. But again, it is important to remember that the application will only
obtain enough data to calculate the result of the indicator based on the most recent bar of
the trading instrument.
So, if a 10-bar moving average indicator is applied to RadarScreen, RadarScreen will load
10 bars worth of data for every symbol on the page, and it will calculate the 10-bar average
for each symbol for the last bar only.
This method works very well for most indicators, but it also implies that if you are calculating a cumulative or recursive indicator (i.e., one that uses a running total to calculate the
current value or references previous values of the indicator), you will not get the same results with a grid as you would on a price chart.
A simple example that illustrates this point is an indicator that keeps a running total of the
volume. If you apply this indicator to a price chart that has a year’s worth of bars, you will
end with the yearly trading volume, whereas if you apply it to a grid window that has only
one day’s worth, you will end with the daily trading volume.
Because of this, there is a setting in the Format dialog box for all indicators when applied
to grid windows that allows you to specify how many additional bars to use when calculat-
The Basic EasyLanguage Elements
How EasyLanguage is Evaluated
9
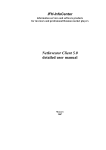
ing that particular indicator. This setting is under the General tab when formatting an indicator, and is called Load additional data for accumulative calculations (Figure 2-2).
Note: Enabling this feature affects
the calculation speed, as more data
must be loaded for all symbols in the
grid application.
Figure 2-2. Load additional data for cumulative calculations
When a number other than zero is specified for this setting, the grid window will load as
many bars as necessary to calculate the indicator, plus whatever number of bars specified
by this setting. Then, the indicator will be evaluated for every one of these bars starting
from the oldest bar and stepping forward to the most current bar, and displays the most recent value of the indicator.
Another and more complex example of where this setting is necessary is the Accumulation
Distribution Indicator. Essentially, the EasyLanguage instructions for this indicator read as
follows:
If the close of the current bar is greater than the close of the previous bar, then add the
volume to a running total. If not, then subtract the volume from the running total.
Display the result on every bar.
In order for this indicator to calculate and return a value, it needs the current bar’s data, and
the data of one bar ago (in order to find if the current bar is an up or down bar); therefore,
it needs a total of two bars. When this indicator is applied to a grid window without loading
any additional data, it loads two bars of data and compares the current close with the close
of one bar ago, and it displays the current bar’s volume as a positive or negative number.
In order for the indicator to step through a number of bars and calculate the value of the
indicator as it would on a price chart with the same data, the desired number of bars must
be specified under the Load additional data for accumulative calculations setting illustrated in Figure 2-2.
10
About the Language
CHAPTER 2
About the Language
There are certain basic elements in EasyLanguage that apply regardless of what type of
trading or technical analysis tool you are writing; you’ll use these elements whenever you
work with EasyLanguage. Once we cover these basics, we’ll move on to the specifics of
writing EasyLanguage trading signals, indicators, studies, search strategies, models, and
functions.
Statements
An EasyLanguage statement represents a complete instruction. Statements can contain reserved words, operators, and punctuation marks, and always end in a semicolon. For example:
Buy 100 Shares on the Next Bar at 100 Stop ;
Reserved Words
The basic vocabulary of EasyLanguage consists of a set of pre-defined words, which
we call reserved words. Reserved words each have a specific meaning or purpose; for
example, to display values or create objects in a window, perform a trading action, or
evaluate and manipulate data.
As we cover each topic, we will introduce and describe the reserved words required to
use the particular EasyLanguage feature.
Operators
Operators are symbols that represent an operation; for example, a plus sign is an
operator representing the addition of two values. There are many different kinds of
operators available for your use in EasyLanguage: mathematical, relational, string,
and logical. These are described in detail in the section titled, “Expressions and
Operators,” on page 12.
Punctuation Marks
There are a number of punctuation marks that you will use often as you write EasyLanguage to establish statements, define parameters, delimit words, and establish order of precedence.
For example, EasyLanguage uses the semicolon ( ; ) to mark the end of each statement.
Punctuation marks are considered reserved words, because they are a part of the structure
of the language. The following punctuation marks are recognized in EasyLanguage:
Symbol
Name
Description
;
Semicolon
Ends a statement.
( )
Parentheses
Groups values and forces them to be calculated first.
Also, surrounds the set of parameters or inputs
required by a reserved word.
The Basic EasyLanguage Elements
Referencing Price Data
Symbol
Name
Description
,
Comma
Separates each parameter or input in a set required by
a reserved word. Also, separates a list of declared
inputs or variables.
:
Colon
Used in declaration statements to begin the list of
inputs or variables. Also, used with Print statements
to format numeric expressions.
""
Quotation
Marks
Defines a text string.
[]
Square (Hard)
Brackets
Used as a modifier, to reference a value from a
previous bar. Also, specifies elements in an array
variable.
{}
Curly Brackets
Surrounds text that is to be ignored by EasyLanguage.
Enables you to include comments.
11
You will find examples of the usage of these punctuation marks throughout this book.
Referencing Price Data
The main objective of any trading or technical analysis tool is to evaluate price data. Therefore, EasyLanguage provides a set of reserved words to refer to the price data available for
each bar.
These reserved words match the common verbiage used in everyday trading (e.g., Open,
High, Low, Close, Volume). The following table lists the reserved words used to refer to
the prices and other bar data, along with the abbreviations you can use in place of the words:
Reserved Word
Abbreviation
Description
Close
C
Last traded price of a bar
Date
D
Date of the close of a bar
Time
T
Time of the close of a bar
Open
O
First traded price of a bar
High
H
Highest traded price of a bar
Low
L
Lowest traded price of a bar
Volume
V
Number of shares or contracts traded in a bar
OpenInt
OI
Number of outstanding contracts at the close of a
bar (available with futures only)
Ticks
--
Total number of trades in a bar
12
Expressions and Operators
CHAPTER 2
Reserved Word
Abbreviation
Description
UpTicks
--
Number of trades in which price was higher than
the previous trade, or unchanged tick after an uptick
DownTicks
--
Number of trades in which price was lower than the
previous trade, or unchanged tick after a downtick
You can use any or all of these reserved words in your trading signals, analysis techniques,
and functions to refer to information regarding the current bar being evaluated. Remember
that trading signals, analysis techniques and functions are evaluated for every bar, from oldest to most current, and results are obtained for every bar.
Also, since trading decisions are rarely made on just one bar’s worth of price information,
EasyLanguage makes it easy to obtain price data from any bar older than the current bar by
adding a modifier after the appropriate reserved word. For a detailed description of the
modifier to add, refer to the section titled, “Referencing Previous Values” on page 17.
Skip Words
There is a subset of reserved words called skip words. Skip words are optional words
that can be included in any statement with the intent of making the statement easier to
read. Skip words have no meaning and are in fact ‘skipped’ by EasyLanguage when
evaluating the trading signal, analysis technique, or function. Following is a list of the
EasyLanguage skip words.
a
an
at
based
by
does
from
is
of
on
place
than
the
was
For examples using these skip words, please refer to Appendix C, “Reserved Words
Quick Reference.”
Expressions and Operators
An expression is any combination of reserved words and operators that represent a value.
The value can be of three different types:
numeric
true/false (also called logical or boolean)
text string
As you work with EasyLanguage, you will use all three types of expressions extensively to
create your procedures.
Numeric expressions can be literal; in other words, a number. Or, they can be a reserved
word that represents a numeric value; for example, Close. The following are all examples
of numeric expressions.
The Basic EasyLanguage Elements
Expressions and Operators
13
15
Volume
(High + Low) / 2
True/false expressions can be either the value True or False, or an expression that evaluates
to True or False. True/false expressions invariably involve a comparison. The following is
a true/false expression; it evaluates to a value of True or False:
Close > Open
A text string expression is any characters within quotation marks. The following is an example of a text string expression:
“This is some text”
Operators
EasyLanguage provides a variety of operators that enable you to manipulate reserved words
and values to create more complex numeric, true/false, and/or text string expressions. The
four different types of operators available in EasyLanguage are string, mathematical, relational, and logical. Each is described next.
String Operator
There is only one operator available to manipulate text string expressions, and its purpose
is to concatenate two text string expressions. The symbol used is the plus sign ( + ), and it
is used as follows:
“This is expression 1 ” + “and this is expression 2”
The result will be one text string expression with the value of “This is expression 1 and this
is expression 2”.
Mathematical Operators
These operators are used to perform mathematical operations. The five mathematical
operators are:
Math Operator
Meaning
+
Addition
-
Subtraction
*
Multiplication
/
Division
( )
Parentheses
These operators are always evaluated in a specific order. Division and multiplication are
evaluated first, and addition and subtraction are evaluated second. If there is more than one
14
Expressions and Operators
CHAPTER 2
division and/or multiplication (or addition and/or subtraction) these are resolved from left
to right.
For example, the numeric expression:
High + 2 * Range / 2
...will multiply the range of the bar by two first, then divide that value by two. It will then
add the result to the high. In an effort to find the midpoint of a bar, you might try to write
the following numeric expression:
High + Low / 2
...but this will divide the low by two first, and then add the result to the high, giving a completely different result than what you intended.
In order to perform the calculation as expected and calculate the midpoint of the bar, you
need to use parentheses. Using parentheses allows you to control the order in which the calculations are performed. Anything inside parentheses is evaluated first, before all the operators and expressions outside of the parentheses. Therefore, to obtain the midpoint of the
bar, you can write:
(High + Low) / 2
This will result in the high and the low being added and then divided by two.
Advanced Tip: “Division by Zero”
Whenever EasyLanguage finds a division sign, it performs an internal check to
ensure that the trading signal, analysis technique, or function is not attempting a
division by zero.
In order to improve your trading signals, analysis techniques, and functions for
speed, whenever dividing by a fixed number (a literal), use multiplication instead of
division. This allows EasyLanguage to skip the division by zero check.
For example, when finding the midpoint of the bar, you can write:
(High + Low) / 2
Given that we know dividing by two forces EasyLanguage to check for division by
zero, we can use the following expression to improve the speed of the same
calculation:
(High + Low) * 0.5
Relational Operators
Relational operators enable the following standard comparisons: greater than, less than,
equal to, greater than or equal to, less than or equal to, and not equal to. EasyLanguage
also provides two trading-specific operators, crosses over and crosses under, which enable
you to identify the bar on which two numeric expressions cross.
The Basic EasyLanguage Elements
Expressions and Operators
15
The relational operators available in EasyLanguage are:
Relational
Operator
Meaning
<
Less than
>
Greater than
<=
Less than or equal to
>=
Greater than or equal to
=
Equal to
<>
Not equal to
crosses over
Greater than on current bar but less than or equal to on the
previous bar; you can also use crosses above
crosses under
Less than on current bar but greater than or equal to on the
previous bar; you can also use crosses below
Using these relational operators, you can compare two numeric or text string expressions.
For example, the following expression finds a bar that closed higher than the high of one
bar ago:
Close > High of 1 bar ago
When comparing text string expressions, each character is substituted with its equivalent
ASCII value and the first character of both expressions is compared, then the second character of each expression is compared and so on, until all characters of both expressions have
been evaluated.
Consider the following expression:
“abcd” < “zyxw”
The first character of the first text string expression is compared to the first character
of the second expression. The letter “a” has a smaller ASCII value than “z” so this
expression returns a value of True.
Logical Operators
Logical operators are used to combine two true/false expressions. There are two logical operators:
AND
OR
16
Expressions and Operators
CHAPTER 2
AND is used when both true/false expressions must be true; OR is used when either one or
both of the two expressions must be true. Following is a table that shows the possible resulting values of ANDs and ORs:
Expression 1
Expression 2
Expression 1 AND Expression 2
True
True
True
True
False
False
False
True
False
False
False
False
Expression 1
Expression 2
Expression 1 OR Expression 2
True
True
True
True
False
True
False
True
True
False
False
False
As seen in the tables, the use of OR increases the likelihood of the overall expression being
true as only one of the two expressions needs be true in order for the overall expression to
be true.
More complex true/false expressions can be written using logical operators. For example,
in order to find a key reversal bar, you can use the following expression:
Low < Low of 1 bar ago AND Close > High of 1 bar ago
Given that we are using AND, this expression is true only when both conditional expressions are true, these are: the current bar’s low is lower than the low of the previous bar,
AND the close of the current bar is greater than the high of one bar ago.
As another example, you can use the following expressions to look for stocks that have either a price equal to or greater than $50 a share or a volume greater than two million shares:
Close >= 50 OR Volume > 2000000
Given that we used OR, the above expression will be true when either the closing price is
greater than 50 OR the volume is greater than two million shares. It will only be false if the
closing price is under 50 and the volume is under two million shares.
When you use multiple ORs and ANDs in a expression, EasyLanguage will evaluate them
in the order they appear, from left to right. If necessary, use parentheses to group expressions and alter the order in which EasyLanguage evaluates the expressions.
For example, assume you write an indicator and want to find either a key reversal with volume greater than the previous bar’s volume, or an outside bar. You can accomplish this by
writing one expression using ANDs, ORs, and parentheses.
The portion highlighted in gray finds the key reversal with volume greater than the previous
bar’s, and the boxed portion finds the outside bar. Notice the placement of parentheses:
The Basic EasyLanguage Elements
Referencing Previous Values
17
(Low < Low[1] AND Close > High[1] AND Volume > Volume[1])
OR (High > High[1] AND Low < Low[1])
Notice that instead of writing out “of one bar ago”, we used the shorthand [1]. See the
next section, “Referencing Previous Values,” for more information.
Advanced Tip: “Writing Conditional Expressions”
EasyLanguage is optimized for speed, and one optimization relates to evaluating
true/false expressions that include logical operators. When an expression is being
evaluated and it is determined that regardless of the remainder of the expression, the
first part of the expression is false (or true), the remainder of the expression is not
evaluated. For example, in the following expression:
5 < 4 AND Close > Open
Because 5 < 4 is false, and we are using the AND operator, EasyLanguage will not
evaluate the second half of the expression because regardless of the result of this
second part, the entire expression will evaluate to False.
Similarly, if we have the expression:
5 > 4 OR Close > Open
The second half of the expression will not be evaluated because 5 > 4 is always true
and we are using the OR operator. Therefore, regardless of the result of the second
half of the operation, the expression will evaluate to True.
Therefore, to write your trading signals, analysis techniques, and functions as
efficiently as possible, place the most restricting criterion of your expression first.
Referencing Previous Values
You can reference the value of an expression for any previous bar by adding either of
the two qualifiers listed below after the expression:
of N bars ago
[N]
N is the number of bars ago to reference. For example, consider the following
EasyLanguage expression:
Low of 1 bar ago
This expression is referencing the low price of the previous bar. The reference is relative to
the current bar (bar currently being evaluated). For example, if your trading signal, analysis
technique, or function is being evaluated for the 12th bar of a chart, the following expression refers to the traded volume of the 9th bar, or 3 bars back from the current bar:
Volume of 3 bars ago
18
Referencing Previous Values
CHAPTER 2
The alternate method for referring to data from a previous bar is to enclose the number N
between square braces after a reserved word, input, or variable, where N is the number of
bars ago. For example, the following expression is referencing the opening price from 2
bars ago:
Open[2]
Keep in mind that when talking about trading signals, analysis techniques, or functions, we
are always referring to bars; all trading signals, analysis techniques, and functions are based
on bars and not on days, minutes, or ticks. This allows the trading signal, analysis technique, or function to analyze a daily, minute, or even tick chart without any modifications.
For example, a 10-bar average indicator will calculate a 10-day average if applied to a daily
chart, or a 10-minute average if applied to a 1-minute chart, or a 10-tick average if applied
to a 1-tick chart.
Maximum Number of Bars a Study will Reference, or MaxBarsBack
All trading signals, analysis techniques, and functions that refer to past data will need to
wait a certain number of bars before they can start performing calculations. This waiting
period can be adjusted for any analysis technique, and it is called Maximum number of bars
a study will reference, or MaxBarsBack.
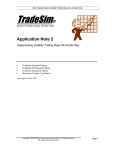
This concept is best explained through an example. Let’s use the Momentum Indicator,
which plots the difference between any price of the current bar and the same price N bars
ago. Using 10 as the number of bars ago, if we scroll all the way to the beginning of the
chart, we will see that we cannot calculate this indicator until we have 10 bars of data on
the chart. The indicator will start showing results on the 10th bar. Again, this is because it
needs to refer to the price of the previous 10 bars, as shown in Figure 2-3.
The Basic EasyLanguage Elements
Referencing Previous Values
19
Figure 2-3. Momentum indicator waiting 10 bars before returning a value
For grid applications, the MaxBarsBack setting is the number of bars the application loads
for each symbol to perform the calculation of the indicator and display the most current value. For example, assume you insert the Momentum Indicator in a RadarScreen window.
This indicator compares the current bar to the bar 10 bars ago. Therefore, the MaxBarsBack
setting for the indicator is 10, and 10 bars of data will be loaded for each symbol in the
RadarScreen window.
Refer to section in this chapter titled, “How EasyLanguage is Evaluated” on page 6 for information on how EasyLanguage performs its calculations.
Advanced Tips: “Understanding the Auto-Detect Loop”
When you apply a trading strategy or analysis technique to a price chart and use the
Auto-Detect MaxBarsBack setting, the application looks for the largest data offset
used by the trading strategy or analysis technique, and uses that number for the
MaxBarsBack setting. However, if the trading strategy or analysis technique uses a
variable offset (e.g., Close[Value1]), then it is possible that the value initially chosen
by the application will not be sufficient to apply the trading strategy or analysis
technique to all the data in the chart.
20
Manipulating Dates and Times
CHAPTER 2
For example, an indicator is applied to a chart, and the application initially
determines that the maximum offset is 5. However, as the application evaluates the
indicator on the chart, it determines that the analysis technique actually requires 25
bars to perform its calculation, so the application removes the analysis technique
from the chart, and applies it a second time with 25 as the MaxBarsBack setting. This
process is repeated until the indicator is evaluated for the entire chart without
having to be removed.
This can cause Print statements and other debugging tools, as well as DLL calls to
be executed repeatedly for the first few bars in the chart when the trading strategy
or analysis technique is first applied to the chart. If this behavior is not desired, you
will need to change the MaxBarsBack setting to User-defined.
For information on how the Auto-Detect and User-defined formatting settings work,
see the Online User Manual.
Manipulating Dates and Times
You’ll be using dates and times often when writing your trading signals, analysis
techniques, and functions. This section covers how to work with dates and times.
Working with Dates
Dates in EasyLanguage are represented as a numeric expression in the form YYYMMDD
where YYY are years since 1900, MM is a 2-digit month, and DD corresponds to the day
of the month. For example, the EasyLanguage date corresponding to December 17, 1999 is
991217, whereas January 13, 2000 is written as 1000113.
One of the advantages of representing dates as numeric expressions is that it allows the
comparison of dates. For example, 1000113 is greater (i.e., it is a later date) than 991217,
and the following comparison evaluates to True: 1000113 > 991217.
A second way of representing dates in EasyLanguage is Julian Dates. The Julian Date system assigns a date a number n, and the next calendar day has the Julian date n+1 (all calendar days, not just trading days). The Julian Date system begins on January 1, 1900, which
is assigned the number 2. January 2, 1900 becomes the number 3, December 31, 1999 is
36,525, and January 1, 2000 is 36,526, etc.
This allows us to perform mathematical calculations with dates—such as addition and subtraction—without having to worry about ‘rolling over’ months and years. For example, if
we have the EasyLanguage date 991013 (13 of October of 1999) and we want to find the
date of 20 days ago, we could (incorrectly) try to subtract 20 from the date:
991013 - 20
However, we would end up with 990993, which is not a valid EasyLanguage date. Instead,
we can subtract 20 from the Julian equivalent of the date:
36,446 - 20
The Basic EasyLanguage Elements
Manipulating Dates and Times
21
This results in 36,426, which is correct because it is the Julian Date that corresponds to September 23, 1999.
We strongly recommend you use the reserved words Date or ELDate whenever referring
to a date. This will ensure compatibility regardless of any future changes in date format.
The reserved words that will allow you to reference and manipulate dates are listed next.
Date
This reserved word returns a numeric expression representing the EasyLanguage date of the
closing price of the bar being analyzed. The date is an EasyLanguage date, so it is a numeric
expression of the form YYYMMDD, where YYY is years since 1900, MM is the month,
and DD is the day of the month.
Syntax:
Date
Parameters:
None.
Example:
See the example for the reserved word ELDate.
ELDate(YYYY, MM, DD)
This reserved word returns a numeric expression representing the EasyLanguage date
(YYYMMDD) equivalent to the standard date specified (YYYY, MM, DD).
Syntax:
ELDate(YYYY, MM, DD)
Parameters:
YYYY is the 4-digit numeric expression representing the year, MM is the 2-digit
expression representing the month, and DD is the 2-digit numeric expression
representing the day of the month.
Notes:
We highly recommend you use the reserved words Date or ELDate whenever referring to
a date. This will ensure compatibility regardless of any future changes in date format.
Example:
To verify that the date of the current bar is December 17, 1999, you can use the following
IF-THEN statement:
If Date = ELDate(1999, 12, 17) Then
{ EasyLanguage instruction } ;
22
Manipulating Dates and Times
CHAPTER 2
DateToJulian(eDate)
This reserved word returns a numeric expression representing the Julian Date equivalent to
the specified EasyLanguage date.
Syntax:
DateToJulian(eDate)
Parameters:
eDate is the EasyLanguage date (YYYMMDD format) to be converted into a Julian Date.
Example:
You can use the following statement to obtain the Julian Date equivalent to the
EasyLanguage date of the current bar and assign it to a variable (in this case Value1):
Value1 = DateToJulian(Date);
JulianToDate(jDate)
This reserved word returns a numeric expression representing the EasyLanguage date
equivalent to the specified Julian Date.
Syntax:
JulianToDate(jDate)
Parameters:
jDate is a numeric expression representing the Julian Date to convert into an EasyLanguage
date (YYYMMDD format).
Example:
The following statement obtains the Julian Date of the day 20 calendar days ahead of the
date of the current bar, and converts the result into an EasyLanguage date:
Value1 = JulianToDate(DateToJulian(Date) + 20);
The expression inside parentheses (the reserved word DateToJulian) is evaluated first.
It converts the date of the current bar to a Julian Date. Then, the number 20 is added to
the resulting Julian Date. This Julian Date is then the parameter for the reserved word
JulianToDate, which converts the Julian Date to an EasyLanguage date, in the format
YYYMMDD. This EasyLanguage date is stored in the variable Value1.
CurrentDate
This reserved word returns a numeric value representing the EasyLanguage date (YYYMMDD format) corresponding to the date and time of your computer (or datafeed, if you are
connected to a datafeed).
Syntax:
CurrentDate
Parameters:
None.
The Basic EasyLanguage Elements
Manipulating Dates and Times
23
Example:
To have a trading signal, analysis technique, or function perform its calculations only before January 1, 2000 (or any other date for that matter), you can write:
If CurrentDate < ELDate(2000, 01, 01) Then Begin
{ EasyLanguage instruction(s) }
End;
Working with Times
In EasyLanguage, times are expressed as numeric expressions in the form HHMM, where
HH is the hour and MM is the minutes. The hours are managed in what is commonly called
24-hour or military format, so 1:30pm is represented as 1330 and 10:05am is represented
as 1005.
In addition, when you work with time, to facilitate mathematical operations such as addition and subtraction, you can refer to the time as minutes past from midnight. For instance,
1:00am is 60 (60 minutes after midnight), and 10:30am is 630 (630 minutes after midnight).
For example, if the current time is 10:30am (or 1030), and you want to add 60 minutes to
the current time, you may think that you simply add 60 to 1030:
1030 + 60
However, doing so results in a total of 1090, which is not a valid time. Therefore, to add 60
minutes to a time, use minutes after midnight. You would write:
630 +
60
Doing so results in 690. When you convert this number back into time in 24-hour format,
the result is 1130, which is the desired value. Reserved words are provided for you to convert times back and forth automatically.
The reserved words used to reference and manipulate times are listed next.
Time
This reserved word returns a numeric expression representing the EasyLanguage time
(HHMM format) of the closing price of the current bar.
Syntax:
Time
Parameters:
None.
Example:
For example, you can write your trading signal, analysis technique, or function such that
it only evaluates the EasyLanguage instructions when the trade time is less than 11:00am:
If Time < 1100 Then
{ EasyLanguage instruction } ;
24
Manipulating Dates and Times
CHAPTER 2
TimeToMinutes(eTime)
This reserved word returns a numeric value representing the number of minutes elapsed
since midnight for the EasyLanguage time (HHMM format) specified.
Syntax:
TimeToMinutes(eTime)
Parameters:
eTime is a numeric expression representing the EasyLanguage time to be converted into
minutes past midnight.
Example:
The following statement converts the current bar’s time into minutes past midnight, and assigns the numeric value to a variable (in this case, Value1):
Value1 = TimeToMinutes(Time);
MinutesToTime(mTime)
This reserved word returns a numeric expression representing the EasyLanguage time
(HHMM format) equivalent to a specific number of minutes from midnight.
Syntax:
MinutesToTime(mTime)
Parameters:
mTime is a numeric expression representing the minutes past midnight to be converted into
the equivalent EasyLanguage time.
Example:
The following statement converts the current time into minutes past midnight, adds 20 to
it, and then converts the resulting number back into an EasyLanguage time:
Value1 = MinutesToTime(TimeToMinutes(Time) + 20);
The expression within parentheses is evaluated first (the reserved word
TimeToMinutes). It converts the time of the current bar to minutes past midnight. Then,
20 is added to the minutes past midnight, and the resulting number is used as the
parameter for the reserved word MinutesToTime, which converts the number back into
an EasyLanguage time (HHMM format).
CurrentTime
This reserved word returns a numeric value representing the EasyLanguage time (HHMM
format) corresponding to the time of your computer (or datafeed, if you are connected to a
datafeed).
Syntax:
CurrentTime
The Basic EasyLanguage Elements
Using Variables
25
Parameters:
None.
Example:
To have a trading signal, analysis technique, or function perform its calculations only if
it is before 2:00pm, you can write:
If CurrentTime < 1400 Then Begin
{ EasyLanguage instruction(s) }
End;
Using Variables
Variables are placeholders that hold a value; once you assign a value to the variable, you
can reference the value throughout the trading signal, analysis technique, or function by using the name of the variable. You can also recalculate the value of the variable within the
procedure.
The definition of variable by Webster is a symbol that may have an infinite number of values; that which is subject to change. Like the definition states, the value stored by the variables can change any number of times throughout the procedure, even from bar to bar.
The main use of a variable is to store the result of a calculation or comparison in order to
refer to the result of this operation later without having to repeat the formula or expression.
For example, in variable X you can store the value of the high price of the bar plus 33% of
the average true range. Once this value is calculated and assigned to the variable, there is
no need to type the formula again; you can use X instead to refer to this value.
Variables help with the speed and efficiency of the procedure. This is because the application does not have to reference repeatedly the values that compose the statement (e.g., prices and other values), or perform the math or comparisons that are required by the
expression. Therefore, using variables in place of frequently-used expressions speeds up
the procedure and uses less memory.
Another very important fact about variables is that the value of a variable at the end of a bar
is used as the initial value of the variable for the next bar. In other words, the values of all
variables are carried over from bar to bar, thus allowing an easier manipulation of information. For instance, you can use a variable to keep a counter of the number of bars that have
passed since a certain market condition, or the number of bars that you’ve been in a certain
market position.
For example, the following instructions keep a counter of the number of bars since the last
key reversal:
Variable: Counter(-1);
If Counter <> -1 Then
Counter = Counter + 1 ;
If Low < Low[1] AND Close > High[1] Then
Counter = 0 ;
26
Using Variables
CHAPTER 2
The variable Counter starts with a value of -1 (which is assigned in the Variable Declaration statement), and is incremented by one on every bar once its value changes from
-1.
This indicator changes the Counter variable from -1 to 0 the first time a key reversal is
found, and subsequently resets it to 0 each time a new key reversal is found. Note how the
instructions Counter = Counter + 1 assigns to the variable Counter its current value and
adds one. This would not be possible unless variables carried forward their values from bar
to bar.
Also, using variables helps avoid typing errors and makes your procedure more legible. For
example, consider the following statement:
If Close > High[1] + Average(Range,10) * 0.5 Then
Buy Next Bar at High[1] + Average(Range,10) * 0.5 Stop;
The expression highlighted in the gray boxes can be assigned to a variable. By using a variable (in this example the variable is Value1), we can simplify the statement to the following:
Value1 =
High[1] + Average(Range,10) * 0.5 ;
If Close > Value1 Then
Buy Next Bar at Value1 Stop;
This second example is much easier to read because of the use of a variable. If you are going
to use an expression throughout a procedure, you should assign it to a variable.
Note: If you use an expression very frequently and in more than one trading signal or
analysis technique, you may want to create a function. Variables can only be used in
the procedure where they are declared and are not shared between trading signals and
analysis techniques, whereas functions can be referenced by other trading signals and
analysis techniques, and even other functions. The section later in this chapter, titled,
“Understanding User Functions” on page 50 covers functions in detail.
When working with variables, you declare them, assign values to them, and reference their
values. How to do each is discussed next.
Declaring Variables
Before you can use a name as a variable, you must ‘tell’ EasyLanguage that the name
is to be used as a variable; this is known as declaring the variable(s). To declare a
variable, you use a Variable Declaration statement. When you declare a variable, you
also specify its type and initial value.
Syntax:
Variable: Name(Value) ;
The Basic EasyLanguage Elements
Using Variables
27
Name is the name of the variable. The name must start with a letter, and can be a maximum
of 20 characters in length. The name can contain letters, numbers, dashes, or periods. Value
is any numeric, true/false, or text string value; it is the initial value for the variable.
You can declare one or more variables using the same statement by separating the variables
with commas. For example, the following statement declares three variables, each of a different type:
Variables: Number(0), Condition(False), TextStr(“Text”);
There is no limit to the number of variables that you can declare with one statement, although if you prefer, you can use multiple variable declaration statements. There is no limit
to the number of Variable Declaration statements you can use, either.
Also, the reserved words Var, Vars, and Variables are synonyms to Variable and can be
used interchangeably. For example, you could re-write the statement above as:
Vars: Number(0), Condition(False) ;
Var: TextStr(“Text”);
The values in parentheses serves two purposes. First, it indicates the type of variable it is:
numeric, true/false, or text string. If you use a numeric expression, the variable is a numeric
variable; if you use a true/false expression, then it is a true/false variable; and likewise, if
you use a text string expression, the variable is a text string variable.
Second, the value in parentheses assigns the initial value to the variable. As explained earlier in this book, all the instructions in EasyLanguage are read from top to bottom, and they
are interpreted for every bar on the chart from left to right. The variable takes the value in
parentheses as its initial value.
Note: For your convenience, EasyLanguage provides a number of pre-declared
numeric and true/false variables. You can use these variables in your trading signals,
analysis techniques, and functions without declaring them or setting their initial value.
The numeric variables available for you to use are Value0 through Value99, and their
initial value is zero (0). You’ll notice that in most of our examples, we use Value1. The
true/false variables available for you to use are Condition0 through Condition99, and
their initial value is False. There are no pre-declared text string variables. The only
advantage to using pre-declared variables is that you don’t need to declare them. The
disadvantages are that the name(s) will be less intuitive and you cannot set their initial
values yourself.
Assigning Values to Variables
Once you have declared your variable(s) (or if you are using pre-declared variable(s)), you
can assign values to them throughout the trading signal, analysis technique, or function.
Syntax:
Name = Expression ;
28
Using Variables
CHAPTER 2
Name is the name of the variable and Expression is either a numeric, true/false, or text
string expression. The expression type must match the variable type. If the statement is assigning a value to a numeric variable, the expression must be a numeric expression.
For example, the following statement assigns the average true range of the last 10 bars to
the variable Value1:
Value1 = Average(TrueRange, 10);
The following statements declare a true/false variable called KeyReversal, and then assign
the result of a comparison to the variable:
Variable: KeyReversal(False);
KeyReversal = Low < Low[1] AND Close > High[1];
Referencing the Value of a Variable
Once you have declared a variable, and a value has been assigned to it, you can reference
its value by using the name of the variable in place of the expression. For example, the following statements calculate an entry price, assign it to a numeric variable called EntryPrc,
and then reference the value of the variable in the buy order:
Variable: EntryPrc(0);
EntryPrc = Highest(High,10);
If MarketPosition <> 1 Then
Buy Next Bar at EntryPrc Stop;
In the following example, the statements calculate the highest high of the last 10 bars, compare it to the current high, and assign the result to a true/false variable called Condition1.
We then use an IF-THEN statement to determine if Condition1 is true, and if it is, then an
alert is triggered:
Condition1 = High > Highest(High, 10)[1];
If Condition1 Then
Alert(“New 10-bar high”);
Notice that we do not have to use the comparison Condition1 = True; it is assumed. If, however, you want to find when the expression is false, then you must state the comparison, as
follows:
Condition1 = High < Highest(High, 10)[1] AND Low >
Lowest(Low,10)[1];
If Condition1 = False Then
Alert(“New high or low”);
The Basic EasyLanguage Elements
Using Variables
29
Normally, you would write the expression such that you want it to evaluate to true; however, it is up to you which way you want to write the expressions and statements.
It is also possible to refer to the value of a variable on a previous bar; to do so, include the
square brackets and number after the name of the variable. For example, the following
statements refer to the value of a variable called EntryPrc five bars ago:
Variable: EntryPrc(0);
EntryPrc = Highest(High, 10);
If EntryPrc > EntryPrc[5] Then
Buy Next Bar at Entryprc Stop;
Advanced Tip: “Working with Series Variables”
EasyLanguage will automatically determine if a previous value of a variable is
accessed at any point in the trading signal, analysis technique, or function, and will
store the historical values of the variable only if required (and then only as much
history as specified by the MaxBarsBack setting). For example, consider the
following indicator:
Value1 = Close * 1.05;
Value2 = Close - Close[10];
Value3 = Value1[5] + Value2;
Plot1(Value3);
A historical value of Value1 is referenced in the third line (the value of five bars ago);
also, the MaxBarsBack setting for the indicator is 10 (since the close of 10 bars ago
is referenced and that is the most history required). Therefore, the indicator will store
the values for Value1 for the last 10 bars. The variables Value2 and Value3 do not
require that history be saved (they are simple), thus historical values of these
variables are not stored.
Variables can be either series or simple. When they are series, history is stored for
them; when they are simple, history is not stored for them. This becomes important
when accessing the values of variables from third-party languages through DLLs,
because there may or may not be historical data stored for the variable, or not as
much as desired by the third-party developer. In this scenario, you can force a
variable to be a series variable by referencing a previous value of the variable in the
trading signal, analysis technique, or function (i.e., by using a ‘dummy’ statement).
Or, you may want to consider working with functions; you can force a function to be
a series function. See the section later in this chapter titled, “Understanding User
Functions” on page 50..
30
Using Inputs
CHAPTER 2
Using Inputs
Inputs are placeholders that hold a value; you can define the value of the input once at the
beginning of the procedure and then reference the value throughout the trading signal or
analysis technique by using the name of the input.
The value of an input cannot be changed within the EasyLanguage procedure; its value remains constant throughout the procedure. The advantage of using an input is that you can
redefine the value of the input when you use the trading strategy or analysis technique.
For example, the Moving Average 1 Line Indicator is written with an input called Length,
which is the number of bars to include in the average. This input is assigned the default value of 9, but you can change it to any number when you apply the indicator to a chart or
grid, thereby having the trading signal, analysis technique, or function calculate the moving
average using a different number of bars.
Inputs allow for maximum flexibility and user-control of the trading strategy or analysis
technique without having to go to the EasyLanguage PowerEditor or TradeStation
StrategyBuilder to modify the instructions themselves. Also, you can use the same
EasyLanguage procedure more than once in a chart window or grid application (or in different chart windows or grid applications), using different input values in each.
For example, you can apply the Moving Average 1 Line Indicator to a Microsoft chart to
calculate a 10-bar average, and you can apply the same indicator to an IBM chart to calculate an 18-bar average. Inputs allow the same indicator to perform these different calculations; you don’t have to create a new indicator or even modify it in the EasyLanguage
PowerEditor.
Another important advantage is that when you use inputs in your trading signals, you can
then use TradeStation’s optimization feature to fine tune your trading strategy(ies). For information on optimizing your trading strategies, search the Online User Manual Answer
Wizard for Understanding Optimization.
Input Types
Inputs can be one of three types: numeric, true/false, or text string. Numeric inputs represent numeric values, true/false inputs represent expressions that evaluate to True or False,
and text string expressions hold text strings.
Inputs can be literal expressions such as a specific number or a text string, or they can be
expressions whose values will change from bar to bar; for example, an input can be set to
the close of the bar, in which case, the value will change with each bar. Or, it can be set to
the range of the bar, using the function Range. The value of an input cannot change within
a bar.
To use inputs, you first have to declare them; once you declare them, you can reference
them in your trading signal or analysis technique. There is no Assignment statement for inputs (since their value cannot be changed within the procedure).
The Basic EasyLanguage Elements
Using Inputs
31
Declaring Inputs
Before using any name as an input, it is necessary to tell EasyLanguage that this name will
be used as an input, or to declare the inputs you will be using. To do so, you use an Input
Declaration statement.
Syntax:
Input: Name(value);
Name is the name of the input. The name has to start with a letter, and it can be a maximum
of 20 characters in length. The name can contain letters, numbers, dashes, or periods. Value
is any numeric, true/false, or text string value that will be used as the default value for the
input.
You can declare more than one input using the same statement by separating the inputs with
commas. For example, the following Input Declaration statement declares three different
inputs:
Inputs: MyNumber(0), MyCondition(False), MyText(“Text”);
There is no limit to the number of inputs that you can declare with one statement; however,
you can also use as many Input Declaration statements as you want in your procedure.
Note: The reserved word Inputs is a synonym to Input; they can be used
interchangeably.
The value provided in parentheses serves two purposes: first, it defines the type of the input.
If a numeric expression is used, it is a numeric input; if a true/false expression is used, it is
a true/false input; and, if a text string expression is used, the input is a text string input.
Second, it assigns the default value to the input. The value specified for each input can be
altered when you apply or format the trading strategy or analysis technique, but this is the
value for the input each time it is applied.
Referencing the Value of an Input
Once you have declared an input, you can reference its value simply by using the name of
the input in place of a numeric, true/false, or text string expression. For example, the following statements calculate an entry price using an input as the multiplying factor:
Input: Mult(1.3);
Variable: EntryPrc(0);
EntryPrc = Highest(High,10) * Mult ;
If MarketPosition <> 1 Then
Buy Next Bar at EntryPrc Stop;
First, we declare the input. Then, we declare a variable, to which we assign the highest high
price of the last 10 bars, multiplied by the input (whose value is set to 1.3). Once we have
calculated the entry price (EntryPrc), we place an order. If we are not currently in a long
32
Using Inputs
CHAPTER 2
position, we place a stop order to buy on the next bar at the entry price we’ve calculated or
higher. Notice that we reference the value of the input simply by using the input in place of
a value.
In EasyLanguage, you use true/false expressions in IF-THEN statements and in While
loops (these are described in the section titled “EasyLanguage Control Structures” on
page 33). These statements perform their actions when the true/false expression evaluates
to True. The following instructions show an example of referencing the value of a true/false
input:
Input: DrawLine(False);
Plot1(Momentum(Close, 10), “Momentum”);
If DrawLine Then
Plot2(0, “Zero”);
This indicator plots a momentum line using the closing price of the last 10 bars. In addition,
it allows for the plotting of a zero line, which by default, will not be drawn (the input DrawLine is set to False by default). If, however, you change the DrawLine input to True as you
apply the indicator or when you format it, then the zero line will be drawn on the chart.
It is also possible to refer to the value of an input on a previous bar; to do so, include the
square brackets and number after the name of the input. For example, the following statements calculate and plot a momentum value:
Inputs: Price(Close), Length(5) ;
Value1 = Price - Price[Length]
Plot1( Value1, "Momentum" );
We use an input to refer to the price we want to use to calculate the momentum as well
as the number of bars to use. In this case, the value of the input 5 bars ago may be
different because the input is a price, which varies from bar to bar. If the value of the
input does not vary, referencing a previous value is not necessary.
Advanced Tip: “Assigning Series Values to Inputs”
Inputs are evaluated every instance they are referenced in the body of a trading signal or analysis technique; this is similar to simple functions. However, series functions are NOT calculated each instance. For example, if you use the AverageFC
function (a series function) four times in your procedure, it is evaluated once and
then the resulting value is referenced during the procedure.
However, there may be instances where you want to use a series function but want it
to be recalculated every instance; to force it to recalculate, you can assign the series
function to an input. The function will be called (i.e., recalculated) every instance
that the input is used.
The Basic EasyLanguage Elements
EasyLanguage Control Structures
33
To illustrate how inputs are calculated, we wrote a simple indicator using the
function Random. When we write the indicator without inputs, both print statements
return different values (Random is a simple function):
Print(Random(1));
Print(Random(1));
When we write this indicator using an input, to which we assign the value
Random(1), and then print the value of the input twice, the result is the same as using
the function twice. Since the input is recalculated each time it is used, each print
statement returns a different result:
Input: Val(Random(1));
Print(Val);
Print(Val);
EasyLanguage Control Structures
EasyLanguage has three types of statements that control the actions that are performed under different circumstances. These statements enable you to perform actions: only when
certain conditions are true, for a period during which certain conditions are true, or for a
fixed number of iterations.
In EasyLanguage, the three main control structures are:
IF-THEN statement
While loop
For loop
Each is described next.
IF-THEN Statement
The IF-THEN statement allows you to specify operations that will be performed only
when a certain condition is true.
Syntax:
If Condition1 Then
{ EasyLanguage instruction };
Condition1 is any true/false expression, and {EasyLanguage instruction} is any
EasyLanguage statement.
For example, you can keep a count of how many times a gap up has occurred in a chart
(the open is greater than the previous bar’s high) by having an IF-THEN statement add
1 to a variable each time a gap up is found:
34
EasyLanguage Control Structures
CHAPTER 2
If Open > High[1] Then
Value1 = Value1 + 1 ;
In this example, every time a bar gaps up, the variable Value1 is incremented by one.
As another example, you can place a buy order only when the fast moving average
crosses over the slow moving average:
If Average(Close,10) Crosses Over Average(Close,20) Then
Buy Next Bar at Market ;
IF-THEN statements are used extensively in EasyLanguage; for example, ShowMe
studies are written exclusively with IF-THEN statements. The objective of a ShowMe
study is to identify a certain scenario, and mark any bar on which this scenario occurs.
The following example shows a typical one-statement ShowMe study, which finds and
marks each outside bar in a price chart:
If High > High[1] AND Low < Low[1] Then
Plot1(High, “Outside Bar”) ;
If an outside bar is found, a mark is placed at the high price of the bar.
Keep in mind that only the first EasyLanguage statement after the reserved word then
is included in the IF-THEN statement. For example, take the following ShowMe study:
If High > High[1] AND Low < Low[1] Then
Plot1(High, “Outside Bar”);
Alert;
The Alert statement is not included as part of the IF-THEN statement, and is therefore
executed on every bar. You can, however, include more than one statement in the
IF-THEN statement. To do so, use a Block IF-THEN statement.
Block IF-THEN Statement
Block IF-THEN statements enable you to specify any number of statements to be
executed by the IF-THEN statement. You include the statements by using the reserved
words Begin and End around them. For example, to have the ShowMe study mark the
bar and trigger an alert each time a gap up bar is found, you can use a Block IF-THEN
statement:
If High > High[1] AND Low < Low[1] Then Begin
Plot1(High, “OutSide Bar”);
Alert;
End ;
All statements within the Begin-End block must end with a semicolon. You can include
as many statements as you want within the block.
The Basic EasyLanguage Elements
EasyLanguage Control Structures
35
IF-THEN Else Statement
Also, you can structure an IF-THEN statement so that it performs a certain action if the
condition is met, and an alternate action if the condition is not met. You do this using
the IF-THEN Else statement. Consider the following statement:
If Close > Close[1] Then
Value1 = Value1 + Volume
Else
Value1 = Value1 - Volume;
In this example, Value1 will keep the summation of the volume of the days with a
positive net change minus the summation of the volume of the days with negative net
change. Notice that there is no semicolon used until the end of the last line; in effect,
the above example is one complete statement.
Combining Block IF-THEN and IF-THEN Else Statements
When you use an IF-THEN Else statement, you can also use a Block IF-THEN statement
for either the IF-THEN or the Else instructions (or both). The following three variations are
valid forms of these IF-THEN statements:
1. Block IF-THEN with Else
If Condition1 Then Begin
{ EasyLanguage instruction(s) } ;
End
Else
{ EasyLanguage instruction } ;
2. Block IF-THEN with Block Else
If Condition1 Then Begin
{ EasyLanguage instruction(s) } ;
End
Else Begin
{ EasyLanguage instruction(s) } ;
End;
3. IF-THEN with Block Else
If Condition1 Then
{ EasyLanguage instruction } ;
Else Begin
{ EasyLanguage instruction(s) } ;
End;
36
EasyLanguage Control Structures
CHAPTER 2
Nesting an IF-THEN Statement
You can also nest IF-THEN statements. Nesting is a term used when one control structure
is included within another; therefore, a nested IF-THEN statement simply means that there
are one or more IF-THEN statements within another IF-THEN statement.
For example, a trading signal might state that it will either buy or sell when the market gaps
up. If the market closes greater than the open, the signal places an order to buy 100 shares;
if the market closes lower than the open, the signal sells short 100 shares.
This instruction is written best using nested IF-THEN statements, as follows:
If Open > High[1] Then Begin
If Close > Open Then
Buy 100 shares This Bar on Close
Else
Sell 100 shares This Bar on Close ;
End ;
Notice that in order to nest an IF-THEN statement, we generally use the Begin-End
block, as highlighted by the gray boxes above.
While Loop
The While loop repeats the specified instructions as long as the control expression has a
value of True. When market conditions change and the control expression becomes False,
the loop is exited.
Note: When working with RadarScreen or OptionStation, where you are analyzing
multiple symbols simultaneously, keep in mind that using loops will add to the
processing time and the resources required, and the time and resources required is
multiplied by each symbol being analyzed.
Syntax:
While Condition1 Begin
{ EasyLanguage instruction(s) } ;
End;
Condition1 is any true/false expression and is called the control expression. { EasyLanguage instruction(s) } is any number of valid EasyLanguage statements.
For example, the following While loop is used to count the number of bars generating a total volume of 1,000,000 shares:
The Basic EasyLanguage Elements
EasyLanguage Control Structures
37
Variables: SumVolume(0), Counter(0) ;
SumVolume = 0 ;
Counter = 0 ;
While SumVolume < 1000000 Begin
SumVolume = SumVolume + Volume[Counter] ;
Counter = Counter + 1 ;
End ;
First, we declare two variables, SumVolume and Counter. Although we initialize the variables to zero (0) when we declare them, we also reset the variables to zero on each new bar.
This is so that once the total volume is reached, and the procedure moves to the next bar,
the values are reset and the loop starts over again.
The statements inside the While loop are repeated until the control expression
(SumVolume < 1000000) returns a value of False. In this particular example, the While loop
adds the volume of the historical bars, one at a time, starting with the current bar (Counter
= 0), and moving backward (Counter = 1, Counter = 2, and so on) until the summation is
greater than 1,000,000 shares.
Infinite Loops
When using a While loop, there is a possibility that the control expression may never evaluate to False, resulting in an infinite loop (i.e., one that never exits). To avoid this, when a
loop iterates for more than 5 seconds, your Omega Research product generates a runtime
error and the trading strategy or analysis technique is turned off.
Using the above example, if the summation of the volume does not reach 1,000,000, the
loop would continue indefinitely until it runs out of data. Therefore, it is always advisable
to provide a fail-safe way for the loop to exit.
Using the above example again, we can modify the control expression so it evaluates to
False after looking at 20 bars, thus forcing the loop out either when the volume reaches the
target number or when 20 bars have been evaluated:
Variables: SumVolume(0), Counter(0);
SumVolume = 0;
Counter = 0;
While SumVolume < 1000000 AND Counter < 20 Begin
SumVolume = SumVolume + Volume[Counter];
Counter = Counter + 1;
End;
38
EasyLanguage Control Structures
CHAPTER 2
For Loop
A For loop enables you to repeat the instructions a specified number of times.
Note: When working with RadarScreen or OptionStation, where you are analyzing
multiple symbols simultaneously, keep in mind that using loops will add to the
processing time and the resources required, and the time and resources required is
multiplied by each symbol being analyzed.
Syntax:
For Value1 = N To|Downto M Begin
{ EasyLanguage instruction(s) } ;
End;
Value1 is any numeric variable, N and M are any numeric expressions, and
{ EasyLanguage instruction(s) } is one or more valid EasyLanguage statements.
The number of times the loop iterates through the instructions is determined by the Value1
variable, which is called the control variable. Again, this can be any declared numeric variable.
The value of the control variable is set to N the first time the statement is evaluated, and the
value is then incremented or decremented automatically on every iteration. If the word To
is used in the syntax, the variable is increased by one on every iteration. If the word Downto
is used, then the variable is decremented on every iteration.
Internally, the expression that is evaluated each time the loop is about to start executing the
statements is Value1 <= M, when the word To is used, and Value1 >= M, when Downto is
used. Therefore, if the For loop is incrementing the control variable and N is greater than
M, the instructions in the loop will not be evaluated. Likewise, if the loop is decreasing the
control variable and N is lower than M, the instructions are not evaluated.
For example, the following loop iterates through the instructions a total of 5 times:
For Value1 = 1 To 5 Begin
{ EasyLanguage instruction(s) } ;
End;
Value1 will start at 1 for the first iteration, then 2, 3, 4, and 5 and before the sixth iteration
will exit from the loop since Value1 will then be greater than 5.
For loops are usually used to look back a specific number of bars. For example, the following loop is used to add the volume of the last 5 bars:
Variable: SumVolume(0);
For Value1 = 0 To 4 Begin
SumVolume = SumVolume + Volume[Value1];
End;
The Basic EasyLanguage Elements
Writing Alerts
39
Notice that this loop also uses the control variable as the bar offset for the reserved word
Volume, as highlighted in gray. Also, since we want to consider the volume of the current
bar (Volume[0]), we use the values 0 to 4 for our loop, instead of 1 to 5 as we did in the
previous example. This is a common and effective practice.
You can terminate the loop early by modifying the value of the control variable. Using the
previous example, if you want to stop the summation once it reaches 500,000, you can use
the following instructions:
Variable: SumVolume(0);
For Value1 = 0 To 4 Begin
SumVolume = SumVolume + Volume[Value1];
If SumVolume > 500000 Then
Value1 = 5;
End;
For loops are used in many of the trading signals, analysis techniques, and functions built
into the Omega Research products. Among the most common are the user functions (e.g.,
Average, Summation, Highest, Lowest, MRO).
Writing Alerts
Many of the analysis techniques built into Omega Research products provide the option of
enabling an audio/visual alert. When an alert is triggered, the alert is logged in the Tracking
Center window and a dialog box appears, as shown in Figure 2-4. A notification sound is
also played at the same time.
Figure 2-4. Alert Notification Dialog Box
The dialog box displays the name of the symbol, the name of the analysis technique, and
the workspace in which the alert was triggered. In addition, the dialog box has a field called
Additional Info that contains additional information provided by the analysis technique.
All this information is also logged in the Tracking Center.
40
Writing Alerts
CHAPTER 2
To include an alert in an analysis technique, you use alert statements. The description included in the Additional Info field is written in the EasyLanguage alert statement included
in the procedure that triggered the alert.
You can include alert statements in:
Indicators
ShowMe studies
PaintBar studies
ActivityBar studies
ProbabilityMap studies
You can use any of the reserved words described in this section with indicators and studies.
When the EasyLanguage criteria is met on the last bar in the price chart or grid, an alert is
triggered.
It is very important to remember that alerts are only triggered if the criteria specified by the
alert statement(s) are met on the last bar of the price chart or grid. Historical instances of
alerts are not logged in the Tracking Center window, nor is the Alert Notification dialog
box displayed.
Alerts can be thought of as a switch that can be turned on or off throughout the
analysis technique by using different statements. Once all instructions are read, the final
state of this switch determines if the alert is triggered or not.
For example, say that the fourth line of an indicator triggers an alert; however, the very last
line of the indicator is a statement that disables the alert. In this case, the indicator will not
trigger an alert.
Alerts are not triggered at the moment they are read, but after all the EasyLanguage statements have been analyzed for the last bar of the price chart or grid. This gives you the ability to enable and/or disable an alert based on changing market conditions.
Following are the alert-related reserved words you’ll be using to include alerts in your indicators and/or studies.
Alert
This reserved word triggers an alert and enables you to provide a description of the conditions that triggered the alert.
Syntax:
Alert(“Description”) ;
Description is any user-defined text string. You use the text string to provide information
about the alert such as the market conditions that triggered it. This text string appears in the
Additional Info field of the Alert Notification dialog box (shown in Figure 2-4) and in
the Tracking Center. You do not have to provide a description, in which case the
Additional Info field in the Alert Notification dialog box and the description for the alert
entry in the Tracking Center are left blank.
The Basic EasyLanguage Elements
Writing Alerts
41
If you include more than one Alert statement in your indicator or study, and more than one
alert is triggered, the description included with the last alert triggered is the description
shown. For example, assume the following indicator is applied to a price chart:
Plot1(Average(Close, 10), “Avg”);
If Close Crosses Over Plot1 Then
Alert(“Price crossed over average”);
If Volume > Average(Volume,10) Then
Alert(“Volume Alert”);
If on the last bar of the price chart both conditions are true, both alerts are evaluated. In this
case, only one alert is actually triggered and logged, and it will have the last description,
which in the above example is the alert with the description “Volume Alert”.
Cancel
This reserved word is used to cancel an alert; it turns off any alerts triggered during the current bar.
Syntax:
Cancel Alert
For example, if you write an indicator with two alert criteria, but you only want the alert to
be triggered after 11:00am, you can use the following statements:
If Close Crosses Over Average(Close,10) Then
Alert(“Average Cross Over”);
If Volume > Average(Volume, 10) Then
Alert(“Volume Spike”);
If Time <= 1100 Then
Cancel Alert;
If an alert is triggered by either one of the Alert statements, it is turned off by the
Cancel Alert statement unless it is after 11:00am. Once it is after 11:00am, the alert is
triggered when either Alert statement is true.
CheckAlert
This reserved word determines whether or not the current bar is the last bar on the price
chart (or grid) and whether or not the alert is enabled for the indicator or study.
When the alert is enabled and it is the last bar on the chart (or grid), this reserved word
returns a value of True. This reserved word will return a value of False for all other bars
on the price chart, and on the last bar of the price chart if the alert is not enabled.
42
Writing Alerts
CHAPTER 2
This allows you to optimize your indicators and studies for speed; you can have the
indicator or study skip all statements relating to the alert unless it is the last bar of the
price chart and the alert is enabled.
Syntax:
CheckAlert
For example, the following statements can be used to trigger an alert when the volume
is twice the average volume, and to display the ratio between the current volume and
the average. Because CheckAlert is used, the calculations are ignored for all historical
bars as well as when the alert is not enabled.
If CheckAlert Then Begin
Value1 = Volume / Average(Volume, 10);
If Volume >= 2 * Average(Volume, 10) Then
Alert (“Volume is" + Value1 );
End ;
Note: Using CheckAlert in an IF-THEN statement to optimize your analysis technique
is effective; however, even when the statements that follow are ignored, the indicator
or study still takes into account the statements in order to determine the number of bars
necessary for the indicator or study to perform its calculations (MaxBarsBack), and
any series functions are calculated. Refer to the section “Alert Compiler Directives”
for information on other reserved words you can use to have the statements ignored
completely.
AlertEnabled
This reserved word returns a value of True when the alert is enabled for the indicator
or study applied to a price chart or grid (and False when it is not). This allows you to
optimize the indicator or study for speed; the statements after this reserved word are
evaluated only when the alert is enabled.
The difference between this reserved word and the CheckAlert reserved word is that
AlertEnabled returns a value of True for all bars when the alert is enabled whereas
CheckAlert returns a value of True only for the last bar on the chart.
Syntax:
AlertEnabled
For example, the following statements calculate a cumulative advance/decline line and
an alert is triggered when the cumulative advance/decline line hits a 50-bar high:
The Basic EasyLanguage Elements
Writing Alerts
43
If AlertEnabled Then Begin
If Close > Close[1] Then
Value1 = Value1 + Volume
Else
Value1 = Value1 - Volume;
If Value1 > Highest(Value1,50)[1] Then
Alert(“New A/D line high”);
End;
In this example, the advance/decline line will only be calculated if the alert is enabled, and
it will be calculated for all bars on the price chart or in the grid, not just the last bar.
Note: Although the statements that follow this reserved word are sometimes ignored,
the indicator or study still takes into account the statements when it determines the
number of bars necessary for the indicator or study to perform its calculations
(MaxBarsBack), also any series functions within the statements are calculated. See the
section “Alert Compiler Directives” for information on additional reserved words you
can use to have the statements ignored completely.
Using Alert Compiler Directives
These reserved words are complier directives that cause your indicator or study to
completely ignore the statements that follow the reserved word unless the alert is
enabled for the indicator or study. The indicator or study will not take into account the
statements following these words when it determines the number of bars necessary to
perform its calculations (MaxBarsBack), nor will any series functions within the
statements be calculated.
#BeginAlert
The statements between this compiler directive (#BeginAlert) and the reserved word
#End are evaluated only when the alert is enabled for the analysis technique. You must
use the reserved word #End with this reserved word.
Syntax:
#BeginAlert ;
{EasyLanguage instruction(s) } ;
#End ;
For example, an indicator that calculates the 10-bar momentum of the closing price
needs ten bars in order to start plotting results. However, if an alert is added to this
indicator and the alert uses a 50-bar average of the volume, then the bar requirement is
upped to fifty. However, the 50-bar average is only used for the alert calculations, so
there is no need to have the indicator wait fifty bars before returning results unless the
alert is enabled.
44
Writing Alerts
CHAPTER 2
Therefore, to have the indicator plot results after ten bars and ignore the 50-bar
requirement, use #BeginAlert in your indicator, as follows:
Plot1(Close - Close[10], “Momentum”) ;
#BeginAlert ;
If Plot1 Crosses Over 0 AND Volume > Average(V, 50)* 2 Then
Alert(“Momentum is now positive”) ;
#End ;
The above indicator plots the momentum and triggers an alert if the momentum
becomes positive while experiencing volume that is greater than twice the 50-bar
average. When the indicator is applied without enabling the alert, it requires only ten
bars to start calculating. When the alert is enabled, the indicator is recalculated; the
statements within the compiler directives are evaluated and the new requirement is 50
bars.
#BeginCmtryOrAlert
When the commentary and alert statements are intertwined, and the commentary and
alert statements are not necessary for the normal plotting of the indicator or study, use
the reserved word #BeginCmtryOrAlert. The statements between this compiler
directive and the reserved word #End are evaluated only when either commentary is
generated or the alert is enabled. You must use the reserved word #End with this
reserved word.
Syntax:
#BeginCmtryOrAlert ;
{EasyLanguage instruction(s) } ;
#End ;
For example, the following indicator plots the 10-bar momentum of the close, and
triggers an alert when the momentum becomes positive while experiencing volume that
is greater than twice the 50-bar average. In addition, commentary is written to help
point out the market conditions bar by bar.
Plot1(Close - Close[10], “Momentum”);
#BeginCmtryOrAlert ;
If Plot1 > 0 Then
Commentary(“Momentum is positive, ”)
Else
Commentary(“Momentum is negative, ”);
The Basic EasyLanguage Elements
Understanding Arrays
45
If Volume > Average(Volume, 50) Then Begin
Commentary(“and volume is greater than average.”);
If Volume > Average(Volume, 50) * 2 Then
Alert;
End
Else
Commentary(“and volume is lower than average.”);
#End ;
Understanding Arrays
Arrays are variables that store multiple values simultaneously. Think of an array as
being like a spreadsheet, which has a predetermined number of cells. For example, an
array called MyArray that has 6 cells (which in an array are called elements) will look
like a one-column spreadsheet document, as shown in Figure 2-5.
Figure 2-5. Array with one dimension
The example array in Figure 2-5 is said to have one dimension and 6 elements; you reference the information in the array using one number. For example, in the above array, element 1 contains a value of 3, and element 2 contains a value of 5.
However, you can define arrays with multiple dimensions. For example, you can define a
two-dimensional array, which will look like multiple rows and columns in a spreadsheet
document, as shown in Figure 2-6.
Figure 2-6. Array with two dimensions
46
Understanding Arrays
CHAPTER 2
In this case, you use two numbers to reference each element [row, column]. For example,
the illustration above shows a two-dimensional array containing 27 elements. Element [1,
0] contains the value 980503, and element [5, 2] contains the value 103.125.
Or, you can define an array with three dimensions, which we can envision as looking more
like a cube, with rows, columns, and multiple layers. To reference the element of a three
dimensional array, you’ll use three numbers (e.g., element [1,0,1]).
You can define an array with up to 10 dimensions. It is hard to envision an array with more
than three dimensions, let alone 10 dimensions; instead, just understand that to reference
an element in a 4-dimensional array, you’ll need to specify four numbers (e.g., element [2,
1, 1, 3]) and to reference an element in a 10-dimensional array, you’ll need to specify 10
numbers (e.g., element [1, 3, 6, 1, 0, 4, 5, 2, 1, 1]). The numbers are the address where a
value is stored.
Like variables, arrays are place holders that can hold values, although instead of being able
to hold only one value, they can hold as many values as the number of elements they have
available.
Arrays are used for many different purposes, the most common being to store information about relevant market conditions during the analysis of price data—to store information about what happened during previous bars.
For example, Figure 2-6, illustrates a multi-dimensional array with four columns and seven rows that was used to store information on seven different bars; each row corresponds
to a bar, and each column corresponds to a piece of information for that bar (date, time,
price, and volume for each bar).
Arrays can store either numeric, true/false, or text string expressions, but they can only
store one type of expression at a time. Also, the values in all elements of the array are carried forward from bar to bar.
Note: When working with RadarScreen or OptionStation, where you are analyzing
multiple symbols simultaneously, keep in mind that using arrays will add to the
processing time and the resources required, and the time and resources required is
multiplied by each symbol being analyzed.
When working with arrays, you declare an array, assign values to the elements of the array,
and reference the values of the elements within an array. How to do each is discussed next.
Declaring Arrays
Before you can use a name as an array, you must ‘tell’ EasyLanguage that the name is to
be used as an array; this is known as declaring the array(s). To declare an array, you use an
Array Declaration statement. When you declare an array, you also specify the array’s
dimensions (and the number of elements in each dimension), and the initial value for all the
elements.
Syntax:
Array: MyArray[M](N);
The Basic EasyLanguage Elements
Understanding Arrays
47
MyArray is a user-defined name for the array, which can be a total of 20 characters in
length, M is a number (or numbers) specifying both the dimensions of the array and the
number of elements in each dimension, and N is the initial value of all the elements in
the array.
For example, the following statement declares a one-dimensional array with a total of
6 elements:
Array: MyArray[5](0);
The array called MyArray will have elements 0, 1, 2, 3, 4, and 5. The elements in this
array will start with a value of zero (0).
The following Array Declaration statement declares a 3-dimensional array with a total
of 726 elements:
Array: MyBigArray[10, 10, 5](0);
The array MyBigArray will hold a maximum of 726 elements (11x11x6) and all
elements will begin with a value of zero (0).
Once declared, the size of the array cannot be changed; whatever dimensions the array
is created with will be constant throughout the EasyLanguage trading signal, analysis
technique, or function.
You cannot use inputs, variables, or any other numeric expressions when defining the
size of the array in the Array Declaration statement. You must use a numeric literal
(i.e., a number).
Arrays can hold all three types of EasyLanguage expressions: numeric, true/false, and
text string. In order to create arrays that hold each different type of expressions, set the
initial value of the elements using the desired type of expression. For example, to create
an array that holds true/false values, you can use the following Array Declaration
statement:
Array: MyTFArray[10](False);
The above statement creates a single dimension array with a total of 11 elements, all of
which are set to False to begin with. Likewise, to create an array that will contain text
string expressions, you can use the following statement:
Array: MyTextArray[10]("");
Assigning Values to Elements in an Array
Once you have declared your arrays(s), you can assign values to the elements in the array
at any point in your trading signal, analysis technique, or function.
Syntax:
MyArray[M] = EasyLanguage expression ;
48
Understanding Arrays
CHAPTER 2
MyArray is the name of the array and M is a numeric expression representing the element
in the array to which you are assigning the value. EasyLanguage expression is the value
that you are assigning to the element.
For example, the following statement assigns a value of 10 to element 5 of the onedimensional array called MyArray:
MyArray[5] = 10 ;
The following instructions store the closing prices and volume for each of the last 10
bars in a two-dimensional array:
Array: MyArray[9, 1](0) ;
For Value1 = 0 To 9 Begin
MyArray[Value1, 0] = Close[Value1] ;
MyArray[Value1, 1] = Volume[Value1] ;
End ;
Loops are often used to populate arrays. In the above instructions, an array called
MyArray is declared. It is a two-dimensional numeric array, with a total of 20 elements,
all of which are initialized to a value of 0.
The loop uses the pre-declared variable Value1 as the control variable, and the loop will
iterate through the instructions 10 times (0 to 9). On the first iteration, the close of the
current bar (Close[0]) is assigned to MyArray[0,0], and the volume of the current bar
(Volume[0]) is assigned to MyArray[0,1]. Value1 is incremented to 1 for the second
iteration through the loop, so now the close and volume of one bar ago are stored in the
array, in MyArray[1, 0] and MyArray[1,1], respectively. Again, this loop iterates a total
of 10 times, and the result is that the closing prices and volume for the current and
previous 9 bars are stored in the array, for reference at any time.
Referencing Values of Array Elements
Once you have declared an array, and you have assigned values to elements in the array,
you can reference the values of the elements by using the name of the array and the element
number in place of the numeric, true/false, or text string expression.
For example, the following statement assigns the value held in element 10 to the
numeric variable Value1:
Value1 = MyArray[10];
Also, arrays can be used wherever an expression can be used. For example, you can
plot the value held in element 0 of an array:
Plot1(MyArray[0]);
Or, you can use the true/false value of an element in an array as the true/false
expression in an IF-THEN statement:
The Basic EasyLanguage Elements
Understanding Arrays
49
If MyConditionArray[7] Then
{EasyLanguage instruction } ;
You can also reference the previous value of an array. For example, the following
statement references the value that element 5 of an array called MyArray held 10 bars
ago:
Value1 = MyArray[5][10];
It is important to keep in mind the size of the array because the application to which you’ve
applied the trading signal or analysis technique will generate a runtime error and turn off
the analysis technique if you reference or assign a value to an element that does not exist in
the array.
For example, the indicator below uses a loop to reference element 11 in an array that only
has elements 0 through 8, the application to which you applied the indicator will generate
a runtime error and turn off the indicator:
Array: MyArray[8](0);
For Value1 = 1 To 11 Begin
MyArray[Value1] = Value1;
End;
Advanced Tip: “Working with Series Arrays”
As a memory optimization, EasyLanguage automatically determines if a prior value
of any element of an array is accessed at any point in the trading signal, analysis
technique, or function, and then, if required, stores the historical values for the array.
EasyLanguage stores only as much history as it needs to fulfill the MaxBarsBack
setting. For example:
Value1 = MyArray[5][10] * 1.05;
Value2 = MyOtherArray[6] - Value1 ;
Plot1( Value2 );
The indicator stores all the prior values of MyArray, given that a historical value of
the array is referenced in the first line. The variable Value2 and MyOtherArray are
both simple, thus historical values for this variable and array are not stored.
In other words, arrays can be either series or simple structures. This is important
when you want to access the values of array elements from third-party languages
through DLLs because depending on the state of the array, there will be more or less
historical data stored than you require. In this scenario, you can force an array to be
a series array by referencing a previous value of an element in the array in your
trading signal, analysis technique, or function (i.e., by using a ‘dummy’ statement).
Or, you may want to consider working with functions; you can force a function to be
a series function. Refer to the next section in this chapter titled, “Understanding User
Functions” on page 50 for more information.
50
Understanding User Functions
CHAPTER 2
Understanding User Functions
A user function is a defined set of instructions that you reference by name, and that return
a value. The value returned by functions can be numeric, true/false, or text string, and
you can use functions in any part of a statement that requires a value.
For example, in trading, it is very common to calculate the range of a bar (the high minus
the low). Every time EasyLanguage users need to calculate the range of a bar, they don’t
need to write out the expression (High - Low) because EasyLanguage provides a function
called Range. Whenever you need the calculation for the range of a bar, you can use the
EasyLanguage user function Range instead of writing out the expression. Range is one
of the simplest functions available in EasyLanguage; there are hundreds of functions
available for your use, plus you can write your own.
Another concept you need to understand when working with functions is the concept of
parameters. When necessary, user functions are written with parameters (also referred to
as inputs or arguments). Parameters allow the person using the function to provide pieces
of information that the function needs to perform its calculations.
For example, the user function Average is written with a parameter called Length.
Therefore, instead of having one function for a 10-bar average, another for a 12-bar
average, and another for a 15-bar average, etc., there is only one Average user function,
and the user can specify the number of bars the function will use to calculate the average.
Also, creating a function to calculate the average of the close, another for the average of
the open, another of the average of the volume, etc. would be very inefficient. Therefore,
the Average function also has a parameter called Price which enables the user to specify
the price or data that will be averaged.
The following statement calculates the average of the closing prices of the last 10 bars
and assigns the result to the variable Value1:
Value1 = Average(Close, 10);
The parameters for user functions are enclosed in parentheses after the function, and each
parameter is separated by a comma. Depending on the function, parameters can be required
or optional. Parameters are discussed in detail in “Understanding Parameters and Parameter
Types” on page 58.
Using Existing Functions
For your convenience, the EasyLanguage PowerEditor provides the EasyLanguage Dictionary—which is a tool that lists all the EasyLanguage reserved words and existing user functions, grouped by category. The EasyLanguage Dictionary allows you to browse and/or
search through the list of words and functions, and provides direct links to the Online User
Manual.
All Omega Research products are provided with a vast library of built-in user functions,
which range from commonly-used industry calculations (e.g., ADX, DMI, CCI) to common mathematical and statistical operations (e.g., AbsValue, Sine, Square). Whenever you
need to perform a calculation, instead of writing the calculation yourself in EasyLanguage,
The Basic EasyLanguage Elements
Understanding User Functions
51
first use the EasyLanguage Dictionary’s Find feature to search for an existing function that
will perform the calculation. You can also use the functions as a reference or learning tool
when writing your own functions.
If you are not sure if a function will do exactly what you want, highlight the function in the
EasyLanguage Dictionary and click the Define button for a description of the user function
and its usage.
The EasyLanguage Dictionary is an indispensable reference that you will be using often as
you work with EasyLanguage.
Referencing Previous Values of Functions
You can reference the values of functions on previous bars. For example, the following
statement refers to the value of the 10-bar average of the volume one bar ago:
Value1 = Average(Volume, 10)[1];
In the above example, the function itself is being offset.
Using Previous Values as Parameters
You can also offset the value that you pass as the parameter. For example, you can also
write the following statement:
Value1 = Average(Volume[1], 10);
What is offset is the value that is passed into the function as the parameter, not the function
itself. In the above example, the function will use the previous bar’s volume to perform the
calculation. In this instance, the results are the same for both of the above statements. However, the difference in the results can be significant depending on the calculation being performed.
For example, suppose there is a function called OpenDiff that calculates the difference between the open of the current bar and the value passed to the function through the parameter. The function takes the value passed and subtracts it from the open of the current bar
using the following formula: OpenDiff = Open - Price where Open is the opening price of
the bar and Price is the parameter for the function. Assume you write the following statement:
Value1 = OpenDiff(Close)[1];
EasyLanguage obtains the value of the function on the previous bar. The value returned is
equal to the open of the previous bar minus the close of the previous bar. However, assume
you write the following statement instead:
Value1 = OpenDiff(Close[1]);
The function will subtract the close of the previous bar from the open of the current bar,
yielding a completely different result than the previous statement.
52
Understanding User Functions
CHAPTER 2
Using Data Aliases
When applying a trading strategy or analysis technique to a price chart or grid, the procedure is applied to a data stream. This can be a data stream on a chart, one of the symbols
in a Position Analysis window, or a symbol in a RadarScreen window.
By default, all trading strategies and analysis techniques are based on the data stream to
which the procedure is applied and all calculations default to using the data from it. However, you can refer to any available data stream.
For example, you can apply an indicator to a price chart of OMGA and the Dow 30 Index
that references both symbols. Or, you can apply an indicator to the underlying asset in the
OptionStation Position Analysis window that refers to the prices of an option listed in the
window.
To refer to a data stream other than the one to which the trading strategy or analysis
technique is applied on a chart, you add the data alias of dataN after the function. For
example, the following statement calculates the 20-bar average of the close of the second
symbol in a price chart even though the indicator is applied to the first symbol:
Value1 = Average(Close, 20) of data2 ;
For example, when an indicator is applied to a stock that is plotted as Data1, and the second
data stream is the Dow 30, the indicator can calculate the 10-day average volume of the
Dow 30 and incorporate this calculation into the analysis of the stock. The statement would
be written as follows:
Value1 = Average(Volume, 20) of data2 ;
Again, when no data alias is specified, EasyLanguage assumes the function is meant to be
based on the data stream to which the procedure is applied. So, if an indicator is applied to
a price chart that has three stocks, and the following statement is used in an indicator:
Value1 = Average(Volume, 20);
...the average of the volume will be calculated based on the symbol to which the indicator
is applied.
Note: When formatting the indicator on a price chart, under the Properties tab there
is an option to choose what symbol the indicator is based on, as shown in Figure 2-7.
This selection displays the data stream to which the indicator is currently applied.
The Basic EasyLanguage Elements
Understanding User Functions
53
Figure 2-7. Indicator Properties tab
In RadarScreen and in OptionStation, when no data alias is specified, the symbol corresponding to the row in which the indicator is applied is the default data stream. For information on how to refer to other data streams in RadarScreen and OptionStation, read the
chapter on EasyLanguage specific to that product.
When working with price charts, you can also base only the parameter for a function on
another data stream as opposed to the entire function. Consider the following statement:
Value1 = Average(Volume of data2, 10);
In the above statement, the data alias is used in the parameter of the function.
As with bar offsets, the difference between using a data alias for the entire function versus
the parameter is subtle, but it can result in significantly different results depending on the
calculation being performed.
For example, let’s use the function we used earlier to discuss bar offsets, OpenDiff. This
function calculates the difference between the open of the bar and a value passed to the
function. The function subtracts the value from the open of the current bar: OpenDiff =
Open - Price. Assume we write the following statement:
Value1 = OpenDiff(Close) of data2;
EasyLanguage bases the entire calculation of the function on the second data stream; it uses
both the open and the close of the second data stream, and it returns the difference. Now,
assume we rewrite the statement as follows:
Value1 = OpenDiff(Close of data2);
54
Understanding User Functions
CHAPTER 2
The function is based on the first data stream, but will calculate the OpenDiff function using
the open of the current bar of data1 and the close of the current bar of data2. The value returned would be the value of the first data stream’s open minus the second data stream’s
close.
Writing User Functions
The only statement required in a function is the one that specifies what value the
function will return. This statement is called the Function Value Assignment statement,
and it consists of the name of the function followed by an equal to sign ( = ) and then
the expression representing the value of the function.
For example, if there is a function called One that returns the numeric value 1, all the
function needs is the statement:
One = 1;
Likewise, a function named HigherHigh that returns true if the current bar’s high is greater
than the previous bar’s high can be written using the following statement:
HigherHigh = High > High[1];
The value of True or False is assigned to the function HigherHigh by means of the Function
Value Assignment statement, and this value is returned as the value of the function.
Or, a function called TenBarAvg that calculates the 10-bar average of the volume using a
For loop would look like this:
Value2 = 0;
For Value1 = 0 To 9 Begin
Value2 = Value2 + Volume[Value1];
End;
TenBarAvg = Value2 / 10;
A function can return a numeric, true/false, or text string value. You specify what type
of value the function will return when you create the function or format its properties
in the EasyLanguage PowerEditor, as shown in Figure 2-8.
The Basic EasyLanguage Elements
Understanding User Functions
55
Figure 2-8. Function Properties in the EasyLanguage PowerEditor
Any of the EasyLanguage components explained in this chapter; for example, IF-THEN
statements, loops, variables, arrays, math and relational operators, and even other
EasyLanguage functions can be used to perform calculations within an EasyLanguage
function, and once you calculate the desired resulting value, you assign the value to the
function name using a Function Value Assignment statement.
Understanding Function Types: Simple & Series
Most functions are simple functions. These functions perform a calculation and return a value. However, some functions are series functions. Series functions reference previous values of the function itself, variables and/or arrays within the function. When the function
includes counters and accumulation operations from bar to bar, they are series functions.
Using a previous value of the function within the function itself is a commonly used technique, and in fact, many industry standard indicators—exponential averages, ADX,
MACD—use this technique, and the Larry Williams Accumulation-Distribution Indicator
accumulates values from bar to bar. Let’s look at the considerations involved with each
type of function.
Simple Functions
Simple functions cannot refer to previous values of the function itself, or previous values
of any variables or arrays declared in the function when performing its calculations.
Simple functions require less memory and calculate faster than series functions. This is because the resulting values of these functions, and all their variables and arrays, are not cal-
56
Understanding User Functions
CHAPTER 2
culated and stored on a bar by bar basis. These functions are calculated only when they are
called by the trading signal or analysis technique.
The function called Summation, included in your EasyLanguage PowerEditor and shown
below, is an example of a simple function:
Inputs: Price(NumericSeries), Length(NumericSimple) ;
Variables: Counter(0), Sum(0) ;
Sum = 0 ;
For Counter = 0 To Length - 1 Begin
Sum = Sum + Price[Counter];
End;
Summation = Sum ;
Even though the function references previous values of a parameter (Price), it is a simple
function because it does not reference previous values of itself, or of any variables or arrays.
Series Functions
A series function can refer to previous values of itself, or previous values of any variables
or arrays declared in the function when performing its calculations. Series functions are executed on a bar by bar basis even if the function is not explicitly called on each bar. When
variables or arrays are used as parameters, the series functions are calculated each and every time they are called. Otherwise, the function is calculated once per bar, at the end of the
procedure.
To illustrate why series functions are executed on each bar, let’s look at the BarNumber
function, which is included in the EasyLanguage PowerEditor. This function counts the
number of bars that have passed since the trading signal or analysis technique started its
calculations. This function is written using only one statement, as follows:
BarNumber = BarNumber[1] + 1;
To obtain the current bar’s value, this function will read the value of itself from one bar ago,
and add one to that value. This way the function will keep a running total of the number of
bars. Assume we use this function in an indicator, as follows:
If Close > Open Then
Plot1( BarNumber );
The Basic EasyLanguage Elements
Understanding User Functions
57
Following is a table that illustrates the first eight bars of a chart.
Figure 2-9. Series function example - BarNumber
As seen in Figure 2-9, the function is called during bars one through five (because the
close is greater than the open) yet the condition necessary to call the function is not true
for bars six and seven. If the function were not calculated during those bars, it could not
increment its value to keep an accurate count of the bar number. Furthermore, if on bar
eight, the function referred to BarNumber[1], it would not be clear to what value the
function is referring.
Again, if a series function is not called on a specific bar, it is executed at the end of the procedure in order to perform the calculations and store all values—of the function itself and
any variables and/or arrays in the function—for later reference by the function itself.
Also, if the same series function is called two or more times in a bar using the same parameters, and the function does not use variables or arrays as parameters, then the function is only calculated once per bar, and the value resulting from this initial calculation
is used for the other times the function is called (to maximize calculation speed). However, if a function uses a variable or array as a parameter, or has different parameters,
then the function is calculated each and every time it is called within the bar. For example, assume you wrote the following indicator:
MyValue1 = MySeriesFunction(Close, 25);
MyValue2 = MySeriesFunction(Close, 25);
MyValue3 = 10;
If Condition1 Then
Value1 = XAverage(Close, MyValue3);
MyValue3 = 20;
If Condition2 Then
Value1 = XAverage(Close, MyValue3);
58
Understanding User Functions
CHAPTER 2
The first two lines call the same series function, and they do not use variables or arrays
as parameters; therefore, the function MySeriesFunction is calculated only once and
the value is assigned both to MyValue1 and to MyValue2.
However, the function XAverage uses a variable as a parameter; therefore, the function
is calculated twice each bar. This is to make sure that the function is calculated with
the most current value of the variable that is used as the parameter. In the above
example, the value stored in MyValue3 does indeed change for the second calculation
of the function. Parameters are discussed in detail in the next section.
Also, when you’re receiving data on a real-time/delayed basis, and have the Update every tick option enabled for an analysis technique (or the Generate orders for next bar
option for trading strategies), EasyLanguage evaluates the analysis technique or trading
strategy as well as any series functions that are referenced by the analysis technique or
trading strategy, for each new tick. To keep accumulated values accurate, each time a
new tick is received, all variables, arrays and function values are “pushed-back” to their
values from the previous bar, and the calculation based on the most recent tick is performed. This ensures that the trading signals, analysis technique, and functions perform
their calculations as though each tick were the last tick of the bar.
Advanced Tip: Speeding Up Calculation Time
When you use a series function as a parameter for a simple function, and that
particular parameter is used repeatedly throughout the simple function, the
calculation time for the trading strategy or analysis technique can increase
noticeably. This situation produces an increase in overhead because the series
function must be calculated each time that the simple function is referenced. To avoid
this situation, assign the series function to a variable and then use the variable as
the parameter for the simple function. This simple adjustment eliminates the
overhead, since the series function is only called once, when it is assigned to the
variable.
Understanding Parameters and Parameter Types
Many functions are written such that they ask you provide certain information to them
when you use them. You provide information to a function by means of parameters.
There are three types of parameters: numeric, true/false, and text string:
Numeric - When a parameter is defined as numeric, the user of the function can pass
any number (e.g., 5, 10, or 100) or numeric expression as the parameter into the
function. This parameter will be used within the function as a numeric expression.
True/false - When a parameter is defined as true/false, the user of the function can
pass any true/false expression (or the words True or False) as the parameter into the
function. These parameters can then be used within the function as a true/false
expression.
Text string - Text string parameters allow the user of the function to pass any text
string value (e.g., “ABC”) or text string expression as a parameter into the function.
These parameters can then be used within the function as a text string expression.
The Basic EasyLanguage Elements
Understanding User Functions
59
Like the function itself, a parameter can be of subtype simple, series, or it can be of another
subtype, type reference. Each subtype is described next.
Simple Parameters
Simple parameters are constant values that are set in the trading signal or analysis technique
that calls the function. Simple parameters require less memory and improve speed. They
retain their values within the function; simple parameters cannot have values assigned to
them within the body of the function.
When the user is expected to provide a number, for instance (i.e., 10, 15, or 20), you should
define the parameter as numeric simple. For example, the Average function provides a parameter called Length, which enables you to specify the number of bars to use when calculating the average. Since this number does not change from bar to bar (it is a fixed number
such as 9, 18, or 50) there is no need to store previous values of it. Therefore, to improve
speed and memory usage of the function, Length is defined as a numeric simple parameter.
When the function calls for a simple parameter, the user can supply any value, function,
variable, or array.
Series Parameters
Like simple parameters, series parameters are constant values that are set in the trading signal or analysis technique that calls the function. However, when the function refers to previous values of the value you use as the parameter (e.g., Value1, Condition1, or Close), then
this parameter must be defined as a series parameter.
The values of series parameters are stored for each bar, and current and historical values
are accessible from within the body of the function. This allows the function to refer to the
previous bar’s value of the parameter (regardless of whether the function itself is of type
simple or series). Series parameters consume more memory and impact the speed of your
calculations to some extent, but they are needed to refer to historical values of the parameter.
For example, the Average function provides a parameter called Price, which enables you
to specify what value is going to be averaged. To calculate a 10-bar average of the close,
the function will need to access the last 10 closing prices of the symbol; therefore, the parameter Price is defined as a numeric series parameter.
However, series parameters cannot have values assigned to them within the body of the
function. When the function calls for a series parameter, the user can supply any value,
function, variable, or array.
Reference Parameters
Parameters can be passed by value or by reference. When the parameter passes information
by value, as is the case with simple and series type parameters, the function creates a copy
of the information passed into it, and whatever is done with the parameter in the function
does not affect the value of the parameter within the trading signal or analysis technique
that called the function.
However, when information is passed by reference, the function uses the original information from the trading signal or analysis technique that called the function, and any calculations the function performs on the parameter are reflected in the value of the parameter
60
Understanding User Functions
CHAPTER 2
within the trading signal analysis technique that called the function as well as within the
function.
This is best visualized using an example. Suppose that you have added a picture to a word
processor document. If a picture is added by value, a copy of the picture is created in the
word processor document. If the original picture is modified, the picture in the word processor document remains unchanged, and vice versa.
However, if the picture is inserted by reference, the document uses the original picture, and
if the picture is modified in the word processor document, the original picture is modified
as well. Also, if the original picture is modified, the picture in the word processor document
reflects the change.
When a parameter passes information by value, it can be either simple or series. When it
passes information by reference, it must be of type reference. You can use variables, functions, and arrays when the function calls for reference parameters.
When a variable is passed by reference, the function will use the variable from the trading
signal or analysis technique that called the function, so any operations the function performs on the parameters will be reflected in the variable in the trading signal or analysis
technique as well as in the function.
For example, suppose there is an indicator that calculates two numbers representing the upper and lower values of a channel. Instead of creating two functions, one to calculate the
upper band and one to calculate the lower band, a function can accept two variables by reference. Then, the function can calculate these two values and assign the result to each one
of the variables passed by reference. Once the function is called, the variables in the indicator will have the values corresponding to the upper and lower bands.
Figure 2-10 shows the EasyLanguage for the Bands Indicator. The function we wrote to
calculate the two bands is called MyBands. Notice how the variables for the indicator are
also the parameters we passed by reference to the MyBands function.
Figure 2-10. Indicator using a function with inputs passed by reference
The Basic EasyLanguage Elements
Understanding User Functions
61
The MyBands function is shown next. This function defines the upper band as the highest
high of the last 10 bars, and the lower band as the lowest low of the last 10 bars.
Inputs: UpperBand(NumericRef), LowerBand(NumericRef);
UpperBand = Highest(High, 10);
LowerBand = Lowest(Low, 10);
MyBands = 1;
Notice that the function assigns a value of 1 to MyBands. This is a required statement, and
in the indicator, the value (1) is assigned to the variable Value1. Remember that every function must contain an assignment statement, and will return the value assigned. However,
the purpose of the function in the example is to calculate and assign the values to the
UpperBand and LowerBand variables, and these values are used by the indicator.
Given that the values of variables and arrays are stored on a bar by bar basis, reference parameters allow the reference of previous values using bar offsets.
The first line in the above function is an Input Declaration statement, which specifies the
parameters that must be supplied by the user when using the function. The next section covers how to declare the parameters when writing a function.
Defining Parameters
As discussed in the previous section, parameters can be of type numeric, true/false, or
string, and they can be of subtype simple, series or reference.
When writing a function, you must define what parameters the function will require from
the user of the function. To do so, you use the Input Declaration statement. You can declare
multiple parameters (of same or different types) using one Input Declaration statement. For
example:
Input: MyNumber(NumericSimple);
The above Input Declaration statement declares a numeric simple parameter. To define
a numeric series parameter, you use:
Input: MyNumber(NumericSeries);
To define a numeric reference parameter, you use:
Input: MyNumber(NumericRef);
The prefix determines the type: Numeric, TrueFalse, or String, and the suffix determines
the subtype, Simple, Series, or Ref. For example, to define two true/false parameters, one
series and one reference, you would use the following Input Declaration statement:
Inputs: MyValue(TrueFalseSeries), MyValue1(TrueFalseRef);
Or, to define a string simple parameter:
Input: MyString(StringSimple) ;
62
Understanding User Functions
CHAPTER 2
Note: You can define the parameter as Numeric, TrueFalse, or String, without
specifying the subtype. In this case, EasyLanguage automatically detects whether the
parameter is simple or series (however, if the parameter is subtype reference, you must
explicitly define it as such).
Working with Arrays
Declaring a parameter as an array is a little different. To declare an array, you must
specify whether it is numeric, true/false, or string, that it is an array, and whether or not
it is of subtype reference.
Syntax:
Input: MyArray[M](Input Type);
MyArray is the name of your array, M is the expression representing the size and dimensions of the array, and Input Type is one of the array parameter types:
NumericArray
NumericArrayRef
TrueFalseArray
TrueFalseArrayRef
StringArray
StringArrayRef
Note: The suffix ‘Ref’ is used when you are passing the array by reference; those
without are expecting an array passed by value.
When the array used has more than one dimension, use a corresponding list of letters separated by commas. For example, the following Input Declaration statement means the function is expecting a numeric array with three dimensions:
Input: MyNumericArray[X,Y,Z](NumericArray);
When the array is sent from the trading signal or analysis technique to the function, these
letters (in the above example, the letters X, Y, Z) will take the numeric values corresponding to the size of the array, and you can use the words within the body of the function to
work with the array. For example, if a function receives a one dimensional true/false array,
the following statements can be used to traverse the array using a For loop:
Input: MyArray[M](TrueFalseArray);
Value2 = 0 ;
For Value1 = 0 To M Begin
Value2 = Value2 + MyArray[Value1] ;
End;
The Basic EasyLanguage Elements
Understanding User Functions
63
Given that the contents of the array are stored for every bar (to allow trading signals, analysis techniques, and functions to refer to previous values of the array elements), it is possible to refer to previous values of the array.
For example, assume you want the function to refer to value 10 bars ago of the first element
of an array passed into a function, in order to compare it to the current bar’s high. To do so,
you can use the following statements:
Input: MyArray[M](NumericArray);
If MyArray[0][10] > High Then
{ EasyLanguage instruction } ;
When an array is passed by value (i.e., when it is not passed by reference), it is not possible
to assign or modify the values of the elements of the array. However, the values can be read
and used within the body of the function, and you can refer to previous values of the elements.
For example, the following statements make up a function called MaxValArray, which will
find the maximum value stored in the array (but it doesn’t change the values of any of the
elements within the array):
Input: MyNumericArray[M](NumericArray);
Variable: Result(0);
Result = MyNumericArray[0];
For Value1 = 1 To M Begin
If MyNumericArray[Value1] > Result Then
Result = MyNumericArray[Value1];
End;
MaxValArray = Result;
When an array is passed by reference, all its values can be modified in the body of the function; any changes made in the function will be reflected in the trading signal or analysis
technique that called the function.
For example, the following statements make up a function called SortMyArray that accepts
an array and sorts it using the ‘bubble sort’ technique (i.e., drops the value in the last element of the array, fills each element with the value in the element before it, and places the
latest value in the first element):
64
Output Methods
CHAPTER 2
Input: MyArray[N](NumericArrayRef);
Variables: Done(False), Counter(0);
Done = False;
While Done = False Begin
Done = True;
For Counter = 0 To N - 1 Begin
If MyArray[Counter] > MyArray[Counter+1] Then Begin
Value1 = MyArray[Counter];
MyArray[Counter] = MyArray[Counter+1];
MyArray[Counter + 1] = Value1;
Done = False;
End;
End;
End;
SortMyArray = 1 ;
Notice that a dummy statement is included in the above function (highlighted in gray).
The function returns the value 1; however, in this example, the true purpose of the
function is the manipulation of the array that you pass by reference. This array is
changed by the function, and the change is reflected in the trading signal or analysis
technique that called the function, regardless of the value the function returns.
The following statement calls the function in the above example.
Value1 = SortMyArray(MyArray[12]) ;
This statement could be included in any trading signal or analysis technique. Again, in
this case, the value stored in Value1 is of no importance. However, once the function is
called, the array MyArray is modified (in this case, a value has been added to the array,
and the existing elements bubble sorted).
Output Methods
In addition to the conventional means of plotting information, EasyLanguage provides
many ways of displaying information about the data being analyzed. Among the most useful methods are Commentary, the Message Log window, the Debug window, and writing
to a file. This section discusses these four alternative output methods.
Working with Commentary
The objective of creating commentary for a trading signal, analysis technique, or
function is to send additional information about the specific price bar selected by the
user of the procedure to the Expert Commentary window. The information sent can be
The Basic EasyLanguage Elements
Output Methods
65
anything you want; for example, market commentary or debugging messages can be
included in the commentary text for the user to review. An example of commentary is
shown in Figure 2-11.
Figure 2-11. Chart with the Expert Commentary window
Note: In the case of grid applications, like the OptionStation Position Analysis
window, the commentary will always be based on the most current bar, since there is
no way to select a historical bar in a grid application.
It is important to remember that when commentary is requested for a bar, the trading
strategy or analysis technique is recalculated for the entire chart or symbol on the grid
(similar to turning the status of the trading strategy or analysis technique off and then
on). This is needed because due to the optimization routines used by EasyLanguage,
certain calculations are only performed when commentary is obtained; therefore, when
commentary is requested, these calculations need to be performed from the beginning
of the chart or entire data set.
The reserved words used to work with commentary are described next.
Commentary
This reserved word sends the expression (or list of expressions) to the Expert
Commentary window for whatever bar is selected on the price chart (or the last bar in
the case of a grid application).
You can use this reserved word multiple times, but it does not add a carriage return after
the expression or list of expressions.
66
Output Methods
CHAPTER 2
Syntax:
Commentary( MyExpression );
MyExpression is the numeric, text string, or true/false expression that is to be sent to
the Expert Commentary window. You can send multiple expressions; they must be
separated by commas.
To include a carriage return in your Commentary, use the reserved word NewLine as a
Commentary expression where needed. You can also use the reserved word
CommentaryCL instead (discussed next).
For example, the following statements produce the commentary shown in Figure 2-12
Commentary(“This is commentary ”);
Commentary(“written in one line”);
Figure 2-12. Expert Commentary window
As mentioned above, to include line breaks in the commentary, you need to use the
NewLine reserved word. For example, the following statements produce two lines of
commentary text:
Commentary(“The 10-bar avg of the close”, NewLine);
Commentary(“ is:”, Average(Close, 10));
Also, you can create links in your Commentary text to the Windows Media Player (to play
an audio clip) and to definitions in the Online User Manual. The links are words in your
Commentary that appear in a different color and that when clicked, play an audio clip or
bring up the specified definition in the Online User Manual. These words are referred to as
jump words.
The Basic EasyLanguage Elements
Output Methods
67
To create a jump word that plays a music (.WAV) file, enclose the complete file name and
path of the sound file using the following syntax:
\wb<path\filename>\we
For example, to link your commentary to the file c:\windows\ding.wav, you could write the
following statement:
Commentary(“This links to a file: \wbc:\ding.wav\we”);
To create a jump word that brings up the existing definition in the Online User Manual,
enclose the word using the following syntax:
\pb<word>\pe
or
\hb<word>\he
The Expert Commentary window uses the HELP_KEY WinHelp API call and retrieves
the specified topic from the Omega Research Online User Manual. The text string
between \pb and \pe is used as the keyword, and " , defined" (space, comma, defined)
is appended to the text string. For example, the following syntax retrieves the topic
Bottom, defined from the Online User Manual.
\pbBottom\pe
The text string between \hb and \he is used as the keyword, and " (Indicator)" (space,
open parenthesis, Indicator, close parenthesis) is appended to the text string. For
example, the following syntax retrieved the topic ADX (Indicator) from the Online
User Manual.
\hbADX\he
Before creating a jump word, make sure the definition exists in the Online User
Manual. To determine that it exists, search the Online User Manual index. You can
create jump words for any index entry that has the suffix " , defined" or " (Indicator)".
CommentaryCL
This reserved word sends the expression (or list of expressions) to the Expert
Commentary window for whatever bar is selected by the Expert Commentary pointer
(or for the last bar in the case of a grid application).
You can use this reserved word multiple times, and it will include a carriage return at
the end of each expression (or list of expressions) sent.
Syntax:
CommentaryCL( MyExpression );
MyExpression is a single or a comma separated list of numeric, text string, or true/false
expressions that are sent to the Expert Commentary window.
68
Output Methods
CHAPTER 2
For example, the following statements produce the commentary shown in Figure 2-13.
CommentaryCL(“The close of today is:”, Close);
CommentaryCL(“The 10-day average of the close is:”,
Average(Close,10));
Figure 2-13. Expert Commentary window
You can also create links in your Commentary text to the Windows Media Player (to play
a video or audio clip) using the CommentaryCL reserved word. Refer to the discussion of
jump words in the description of the Commentary reserved word.
AtCommentaryBar
This reserved word returns a value of True on the bar clicked by the user with the
Expert Commentary pointer. It will return a value of False for all other bars. This
allows you to optimize your trading signals, analysis techniques, and functions for
speed, as it will allow EasyLanguage to skip all commentary-related calculations for
all bars except for the one where the commentary is requested.
Syntax:
AtCommentaryBar
The difference between AtCommentaryBar and CommentaryEnabled (discussed next)
is that CommentaryEnabled returns a value of True for ALL bars when the Expert
Commentary window is open, while the AtCommentaryBar returns a value of True only
for the bar clicked with the Expert Commentary pointer.
The Basic EasyLanguage Elements
Output Methods
69
For example, the following statements display a 50-bar average of the volume in the
Expert Commentary window but avoids calculating this 50-bar average for every other
bar of the chart:
If AtCommentaryBar Then
Commentary(“The 50-bar vol avg: ”, Average(Volume, 50));
Note: Although the statements that follow this reserved word are sometimes ignored,
the trading signal, analysis technique, or function still takes into account the
statements when it determines the number of bars necessary for the indicator or study
to perform its calculations (MaxBarsBack), also any series functions within the
statements are calculated. See the section “Using Commentary Compiler Directives”
for information on additional reserved words you can use to have the statements both
ignored completely.
CommentaryEnabled
This reserved word returns a value of True only when the Expert Commentary window
is open and Commentary has been requested. This allows you to optimize your trading
signals, analysis techniques, and functions for speed, as it allows EasyLanguage to
perform commentary-related calculations only when the Expert Commentary window
is open.
Syntax:
CommentaryEnabled
The difference between CommentaryEnabled and AtCommentaryBar is that
CommentaryEnabled returns a value of True for ALL bars when the Expert
Commentary window is open, while the AtCommentaryBar returns a value of True only
for the bar clicked with the Expert Commentary pointer.
For example, the following statements calculate a cumulative advance/decline line to
be displayed in the Expert Commentary window:
If CommentaryEnabled Then Begin
If Close > Close[1] Then
Value1 = Value1 + Volume
Else
Value1 = Value1 - Volume;
Commentary(“The value of the A/D line is: ”, Value1);
End;
Note: Although the statements that follow this reserved word are sometimes ignored,
the trading signal, analysis technique, or function still takes into account the
statements when it determines the number of bars necessary for the indicator or study
to perform its calculations (MaxBarsBack), also any series functions within the
70
Output Methods
CHAPTER 2
statements are calculated. See the section “Using Commentary Compiler Directives”
for information on additional reserved words you can use to have the statements both
ignored completely.
Using Commentary Compiler Directives
These reserved words are complier directives that cause your trading signal, analysis
technique, or function to completely ignore the statements that follow the reserved
word unless the alert is enabled for the indicator or study. The trading signal, analysis
technique, or function will not take into account the statements following these words
when it determines the number of bars necessary to perform its calculations, nor will it
calculate any series functions.
#BeginCmtry
When the commentary statements are not necessary for the normal calculation of the
trading signal, analysis technique or function, use this reserved word, #BeginCmtry.
The statements between this compiler directive and the reserved word #End are
evaluated only when the commentary is requested. You must use the reserved word
#End with this reserved word.
Syntax:
#BeginCmtry ;
{EasyLanguage instruction(s) } ;
#End ;
For example, an indicator that calculates the 10-bar momentum of the closing price
needs ten bars in order to start plotting results. However, if commentary is added to this
indicator and the commentary uses a 50-bar average of the volume, then the
MaxBarsBack setting is increased to fifty. However, the 50-bar average is only used for
the commentary, so there is no need to have the indicator wait fifty bars before giving
results unless Commentary is requested.
To have the indicator plot after 10 bars and ignore the 50-bar requirement, the indicator
can be written as follows:
Plot1( Close - Close[10], “Momentum”);
#BeginCmtry;
If Plot1 > 0 Then
Commentary(“Momentum is positive, ")
Else
Commentary(“Momentum is negative, ");
If Volume > Average(Volume, 50) Then
Commentary(“ and volume is greater than average.”)
Else
The Basic EasyLanguage Elements
Output Methods
71
Commentary(" and volume is lower than average.”);
#End;
This indicator plots the momentum and the commentary states whether the momentum
is positive or negative, and if the volume is over or under the 50-bar average of the
volume. When the indicator is applied without using commentary, it will require only
10 bars to start calculating. When commentary is requested, the indicator is
recalculated, the statements within the compiler directives are evaluated, and the new
minimum number of bars required is 50. Any series functions within these reserved
words are also ignored.
#BeginCmtryOrAlert
When the commentary and alert statements are intertwined, and the commentary and
alert statements are not necessary for the normal calculation of the trading signal,
analysis technique, or function, use this reserved word, #BeginCmtryOrAlert. The
statements between this compiler directive and the reserved word #End are evaluated
only when either commentary is requested or the alert is enabled. The statements are
not considered when determining the MaxBarsBack setting, and any series functions
within these reserved words are ignored. You must use the reserved word #End with
this reserved word.
Syntax:
#BeginCmtryOrAlert ;
{EasyLanguage instruction(s) } ;
#End ;
For example, the following uses the same indicator as described in the previous
reserved word, but an alert is triggered when the volume is twice its average:
Plot1( Close - Close[10], “Momentum”);
#BeginCmtryOrAlert;
If Plot1 > 0 Then
Commentary(“Momentum is positive, ")
Else
Commentary(“Momentum is negative, ");
If Volume > Average(Volume, 50) Then Begin
Commentary(“ and volume is greater than average.”);
If Volume > 2 * Average(Volume, 50) Then
Alert;
End
Else
Commentary(“ and volume is lower than average.”);
72
Output Methods
CHAPTER 2
#End;
Using the Message Log Window
You can send any type of information to the Message Log window from trading signals,
analysis techniques, and functions. The Message Log window is an active document
that resides in the Omega Research Desktop within a workspace just like any other
Omega Research window. It has an extensive application program interface (API) that
allows other applications to interface with it and write requests to it.
Printing information into the Message Log should be done whenever additional
information that is not easily shown elsewhere is required from a trading signal,
analysis technique, or function. Examples of this type of information are specialized
reports or plain English messages that cannot be shown properly in a chart or grid
window. You can also send information to the EasyLanguage Debug window, which
resides in the EasyLanguage PowerEditor and is for use when debugging your trading
signals, analysis techniques, and functions. Refer to the next section for information on
sending text to the Debug window, file, or printer.
Note: As of Service Pack 3 of Version 2000i, the Message Log window is not installed
automatically (unless you are upgrading from a previous version). If you are not
upgrading, and you want to use the window, you must choose to install the window
from the Custom installation menu. This section assumes it is installed.
MessageLog
This reserved word sends an expression or comma-separated list of expressions to the
Message Log window.
Syntax:
MessageLog( Expression );
Expression is any EasyLanguage expression, or a comma-separated list of expressions.
The expressions can be numeric, true/false, or text string, or any combination.
As mentioned above, the resulting expressions are sent to the Message Log window and
are displayed real time in the window. The Message Log has a limit of 255 characters
per line.
For example, the following statements send the date and time, the last traded price, the
highest high and lowest low of the current year, the volume, and the average volume
for the last bar of the chart to the Message Log:
If LastBarOnChart Then Begin
MessageLog(“Average Volume: ”, Average(Volume, 50));
MessageLog(“Volume: ”, Volume);
MessageLog(“Highest High:", HighY(0),“Lowest Low: ”,LowY(0));
MessageLog(“Last: ”, Close);
The Basic EasyLanguage Elements
Output Methods
73
MessageLog(“Date: ”,ELDateToString(Date),“ Time: ”,Time);
End;
The Message Log updates from the top down, the most recent line sent to the Message
Log is displayed at the top of the window. Keep this in mind when you send
information to it.
You can also format numeric expressions sent to the Message Log, as follows:
MessageLog( Value1:N:M );
Value1 is any numeric expression, N is the minimum number of integers to use, and M
is the number of decimals to use.
If the numeric expression being sent to the Message Log has more integers than what
is specified by n, the MessageLog reserved word will use as many digits as necessary.
The decimal values will be rounded to the nearest value.
For example, assume Value1 is equal to 3.14159 and we have written the following:
MessageLog(Value1:0:4);
The numeric expression displayed in the Message Log would be 3.1416.
Sending Information to the Debug Window, File, or Printer
You can send information from any trading signal, analysis technique, or function to
the Debug window. This window resides in the EasyLanguage PowerEditor, and can be
used to send text that would help you see intermediate calculations that are not shown
in the end results of the trading signal, analysis technique, or function, or any message
that would help determine the exact behavior of an EasyLanguage statement.
The EasyLanguage Debug window does not offer an API, nor can it be included in a
workspace (it resides in the EasyLanguage PowerEditor), but it is very efficient and
easy to use for debugging purposes.
Note: The Debug window replaced the Print Log, which was available in previous
versions of the Omega Research products.
The same reserved word used to send information to the Debug window can be used to
send information to a file or printer instead.
Print
This reserved word sends information to the EasyLanguage Debug Window, a file, or
the default Windows printer. Regardless of where you send the information, the Print
reserved word always adds a carriage return at the end of the expressions, so each new
statement is placed on a new line.
74
Output Methods
CHAPTER 2
Syntax:
Print( [Printer, | File(“<File Name>”),] Expression );
<File Name> is the complete path and name of the file to which the Print statement is
to send the expression(s), and Expression is any expression, or a comma-separated list
of expressions. The expressions can be numeric, true/false, or text string (or any
combination).
To use the EasyLanguage Debug window as the output method, include the list of
expressions without any additional information. For example, the following statement
sends the date, time, and close to the Debug window:
Print(Date, Time, Close);
You can format the numeric expressions displayed using the Print reserved word. To
do so, use the following syntax:
Print( Value1:N:M );
Value 1 is any numeric expression, N is the minimum number of integers to use, and M
is the number of decimals to use. If the numeric expression being sent to the Debug
window has more integers than what is specified by N, the Print statement uses as many
digits as necessary, and the decimal values are rounded to the nearest value.
For example, assume Value1 is equal to 3.14159 and we have written the following
statement:
Print(Value1:0:4);
The numeric expression displayed in the Debug window would be 3.1416. As another example, to format the closing prices, you can use the following statement:
Print(ELDateToString(Date), Time, Close:0:4);
To send information to the default printer, Printer needs to be the first expression
included in the parentheses of the reserved word. For example, the following statement
sends the date, time, and the close of every bar of a chart to the default printer:
Print( Printer, Date, Time, Close);
Print statements for historical bars print multiple lines per page; however, Print
statements for data collected on a real-time/delayed basis print at the close of each bar.
For example, if the trading strategy or analysis technique is applied to a chart with 500
bars, and the trading strategy or analysis technique sends one line to the printer for
every bar on the chart, the first printout will consist of 500 lines, with as many lines
per page as each page can hold. Then, as data is collected on a real-time/delayed basis,
one line will be sent to the printer at the close of each bar (one line per page each time
the bar closes). The same holds true when sending the information to a file, and for all
applications.
The Basic EasyLanguage Elements
Output Methods
75
To send information to a file, the first expression included in parentheses of the
reserved word must be File along with the full path and name of the file enclosed in
quotation marks. For example, the following statement sends the EasyLanguage date,
time, and the close of every bar of a chart to a file instead of the printer:
Print( File(“c:\Omega Research\MyText.txt”),
Date, Time, Close);
Important: Every time the trading signal, analysis technique, or function is
recalculated, or deleted and reapplied to the chart, the target file is overwritten. Also,
you cannot use a text string expression as the file name, it must be the actual path and
name of the file. Refer to the discussion of the reserved word FileAppend (below) for
information on appending to the file instead of overwriting it. When sending
information to the printer or a file, we recommend you use the FileAppend reserved
word instead of Print.
FileAppend
This reserved word creates and appends text string expressions to the specified file.
When sending information to the printer or a file, we recommend you use this reserved
word instead of Print.
Syntax:
FileAppend( “<FileName>”, Text );
<FileName> is a text string expression representing the full path and name of the file
to write to, and Text is a text string expression to append to the file.
This reserved word accepts a text string expression for the file name, it will not delete
the target file when the trading strategy or analysis technique is applied to the chart (or
grid) or recalculated, it will not add a carriage return at the end of the expression sent
to the file, and finally, it only accepts text string expressions.
The fact that it will allow a text string expression as the file name enables users to
specify the file name to be written to through a variable and/or inputs. For example, the
following statements use the symbol name as a file name:
Variable: Txt(“ ”);
Txt = “c:\My Documents\” + GetSymbolName + “.txt”;
FileAppend( Txt, “This will be sent to a file” );
This reserved word provides an alternative to the Print statement that does not delete
the target file every time the trading strategy or analysis technique is applied or
recalculated. This target file grows until it is manually edited or deleted.
76
Drawing Text on Price Charts
CHAPTER 2
Note: You can use the reserved word FileDelete to delete the file and simulate the
behavior of the Print statement.
A carriage return is not added to the end of each expression sent; use the reserved word
NewLine whenever you want to include a carriage return. For example, the following
statement writes the text to the file, one line for each bar on the chart:
FileAppend(“c:\My Documents\text.txt”, “This text will be
sent to a file” + NewLine);
Also, because this reserved word accepts only text string expressions, any dates or
numbers must be converted to text strings. For example, the following statement sends
the date and the closing price of every bar to the file:
FileAppend(“c:\My Documents\text.txt”,
ELDateToString(Date) + NumToStr(Close,2));
Notice that the date of the current bar is included, but as a parameter to the reserved
word ELDateToString, which converts an EasyLanguage date (YYYMMDD format) to
a text string expression. Likewise, the closing price is included as the parameter for the
NumToStr reserved, which converts numbers to text string expressions.
Drawing Text on Price Charts
Another way to display information on screen is to write text on a price chart. The first concept you need to understand to start working with text is that each instance of a text drawing
object on a chart, called a text object, has a distinct identification (ID) number. All
EasyLanguage reserved words use the ID number to refer to a specific text object.
The Basic EasyLanguage Elements
Drawing Text on Price Charts
77
To view the ID number for a text object, double-click the text object to display the Format
Text dialog box; the caption will contain the ID number, as shown in Figure 2-14.
Figure 2-14. Formatting a text object on a chart
You can draw text objects using trading signals, analysis techniques (indicators and
studies) or functions, or by using the drawing object tool. When you use trading signals,
analysis techniques, or functions to draw text objects, they are added to a chart using the
default size, color, and alignment of the charting application. These attributes can be
modified using the EasyLanguage text object reserved words.
In order to place text on the chart, you need to define the specific point on the chart to
draw the text. You define the point by specifying a date and time (x-axis) and a price (yaxis). This is the basic information that you manipulate when working with text objects;
additional information that you manipulate with the reserved words is the color, text
string, and alignment of the text.
All of the reserved words used to work with text objects return a numeric value representing the result of the operation they performed. If the reserved word was able to carry
out its task successfully, it will return a value of 0; however, if an error occurred, the reserved word will return a numeric value representing the specific error. The following
table lists the possible return values of the text object reserved words.
Value
Explanation
-2
The identification number used was invalid (i.e., there is no object on
the chart with this ID number).
-3
The data number (Data2, Data3, etc.) passed to the function was
invalid. There is no symbol (or data stream) on the chart with this data
number.
78
Drawing Text on Price Charts
CHAPTER 2
Value
Explanation
-4
The value passed to a SET function was invalid (for example, an invalid
color or line thickness was used).
-5
The beginning and ending points were the same (only when working
with trendlines). Can occur when you relocate a trendline or change
the begin/end points.
-6
The function was unable to load the default values for the tool.
-7
Unable to add the object. Possibly due to an out of memory condition.
Your system resources have been taxed and it cannot process the
request.
-8
Invalid pointer.Your system resources have been taxed and it cannot
process the request.
-9
Previous failure.Once an object returns an error code, no additional
objects can be created by the trading signal, analysis technique, or
function that generated the error.
-10
Too many trendline objects on the chart.
-11
Too many text objects on the chart.
Whenever any of the text object reserved words is unable to perform its task and returns
an error, the trading signal, analysis technique, function will stop manipulating all text
objects from that bar forward. The trading signal, analysis technique, or function itself
will continue to be evaluated, but all statements that include text object reserved words
will return a value of -9 (Previous failure error) and will not perform the intended action.
Also, it is very important that you store the ID number of the text objects drawn in the
price chart; if you have any intention of modifying or referring to this object in any way,
you need the ID number. If you are adding multiple text objects to the price chart, we
recommended you use arrays to store their ID numbers (refer to “Understanding Arrays”
on page 45 for information on using arrays).
Text Object Reserved Words
Following is the list of all the text object reserved words available in EasyLanguage.
Text_New
This reserved word adds the specified text string to a price chart, at the specified bar and
price value. It returns a numeric expression corresponding to the ID number of the text
object added to the chart. If you want to modify the text object in any way, it is very
important that you capture and keep this number; the ID number is the only way of
referencing a specific text object.
Syntax:
Value1 = Text_New(BarDate, BarTime, Price, “MyText”)
The Basic EasyLanguage Elements
Drawing Text on Price Charts
79
Parameters:
BarDate and BarTime are numeric expressions corresponding to the date and time,
respectively, for the bar on which you want to anchor the text object, Price is a numeric
expression representing the price value at which to anchor the text object, and MyText is
the text string expression to add to the price chart.
All text objects are anchored at a specific bar and price value on the price chart. You need
to provide this information to the Text_New reserved word in order for the trading signal,
analysis technique, or function to add a text object to the chart.
Notes:
Value1 is any numeric variable or array, and holds the ID number for the new text object.
Text objects are added to the chart using the default color, and vertical and horizontal
alignment of the charting application. As you will see, you can change any of these
properties using the reserved words listed in this section.
Example:
For example, the following statements add a text string “Key” to a price chart every time
there is a key reversal pattern:
Variable: ID(-1);
If Low < Low[1] AND Close > High[1] Then
ID = Text_New(Date, Time, Low, “Key”);
Text_Delete
This reserved word removes from the chart the text object with the ID number that matches
the one specified. It is important to remember that if an invalid ID number is used, the reserved word will return a value of -2 and no additional operations will be performed on any
text objects by the trading signal, analysis technique, or function that generated the error.
Syntax:
Value1 = Text_Delete(Text_ID)
Parameters:
Text_ID is a numeric expression representing the identification number of the text object to
delete.
Notes:
Value1 is any numeric variable or array. You must assign the text object reserved word to
a numeric variable or array so that you can determine whether or not the reserved word performed its operation successfully.
Example:
The following statements write the text string “Key” wherever there is a key reversal pattern on the price chart, and delete old text from the chart as new key reversals are found:
80
Drawing Text on Price Charts
CHAPTER 2
Variables: OldKeyID(-1), ID(-1);
If Low < Low[1] AND Close > High[1] Then Begin
OldKeyID = ID;
ID = Text_New(Date, Time, Low, “Key”);
If OldKeyID <> -1 Then
Value1 = Text_Delete(OldKeyID);
End;
In the above example, we declare two variables to hold the Text IDs for the existing
and new text objects. When we find a new key reversal, we assign the ID number of
the current text object to the variable OldKeyID. We then create a new text object at the
new key reversal. Finally, we delete the text object with the ID number held in the
variable OldKeyID. We first check for OldKeyID to be -1, because it will be -1 until we
draw the second text object on the chart, and we don’t want to reference a text object
that doesn’t exist.
Text_GetColor
This reserved word returns a numeric expression corresponding to the color assigned to a
specified text object. It is important to remember that if an invalid ID number is used, it will
return a value of -2 and no additional operations will be performed on any text objects by
the trading signal, analysis technique, or function that generated the error.
Syntax:
Value1 = Text_GetColor(Text_ID)
Parameters:
Text_ID is a numeric expression representing the ID number of the text object for which to
obtain the color.
Notes:
Value1 is any numeric variable or array. You must assign the text object reserved word
to a numeric variable or array so that you can determine whether or not the reserved
word performed its operation successfully.
For a list of the supported colors, refer to Appendix B of this book.
Example:
For example, the following statements write the text string “Key” wherever there is a key
reversal pattern on the price chart, and compares the color of the text object with the background of the price chart. If the colors match, the indicator draws the text string using a different color:
Variables: ID(-1), TxtColor(0);
If Low < Low[1] AND Close > High[1] Then Begin
ID = Text_New(Date, Time, Low, “Key”);
TxtColor = Text_GetColor(ID);
The Basic EasyLanguage Elements
Drawing Text on Price Charts
81
If TxtColor = GetBackGroundColor Then
Value1 = Text_SetColor(ID, TxtColor + 1);
End;
In the above example, we first declare two variables, one to hold the text object ID
number, the second to hold the number representing the color of the text object. Then,
when we find a key reversal, we draw the text object at the low of the bar. We also
obtain the color of the text object, and then compare the text object color to the color
of the chart background. If it is the same, we change the color of the text object (add
one to the existing color number).
Text_GetDate
This reserved word returns a numeric expression corresponding to the EasyLanguage date
of the bar on which the specified text object is drawn. It is important to remember that if an
invalid ID number is used, it will return a value of -2 and no additional operations will be
performed on any text objects by the trading signal, analysis technique, or function that
generated the error.
Syntax:
Value1 = Text_GetDate(Text_ID)
Parameters:
Text_ID is a numeric expression representing the ID number of the text object whose date
you want to obtain.
Notes:
Value1 can be any numeric variable or array. The EasyLanguage date obtained is assigned
to this variable or array.
Example:
The following statement assigns to the variable Value1 the EasyLanguage date of the bar
where the text object with the ID number 5 is drawn:
Value1 = Text_GetDate(5);
Text_GetFirst
You can draw text objects using trading signals, analysis techniques (indicators and
studies) or functions, or by using the drawing object tool. EasyLanguage enables you to
search for text objects based on how they were created.
This reserved word returns the ID number of the oldest text object on the price chart (the
first drawn). It is important to remember that if an invalid ID number is used, the reserved
word will return a value of -2 and no additional operations will be performed on any text
objects by the trading signal, analysis technique, or function that generated the error.
Syntax:
Value1 = Text_GetFirst(Num)
82
Drawing Text on Price Charts
CHAPTER 2
Parameters:
Num is a numeric expression representing the origin type of the text object. The possible
values for num are:
Value of num
Description
1
Text created by a trading signal, analysis technique, or function
2
Text created by the text drawing object tool only
3
Text created by either the text drawing object tool or a trading
signal, analysis technique, or function
If a value different than 1, 2, or 3 is used, EasyLanguage will assume a value of 3.
Notes:
Value1 is any numeric variable or array that holds the ID number of the desired text object.
Example:
The following statements delete the oldest text object on a price chart drawn by a trading
signal, analysis technique, or function:
Value1 = Text_GetFirst(1);
Value2 = Text_Delete(Value1);
Note: When the oldest (first) text object is deleted, the next oldest (second) text object
becomes the first drawn on the price chart, and so on.
Text_GetHStyle
A text object is always anchored to a specific bar. Because of this, there are three
possible ways to horizontally align a text object: to the left of the bar where it is drawn,
to the right, or centered. This reserved word returns a numeric value indicating the
horizontal alignment of the text object.
Syntax:
Value1 = Text_GetHStyle(Text_ID)
Parameters:
Text_ID is a numeric expression representing the ID number of the text object whose
horizontal alignment value you want to obtain.
Notes:
Value1 is any numeric variable or array that holds the horizontal alignment of the
desired text object. The reserved word can return one of these three values:
The Basic EasyLanguage Elements
Drawing Text on Price Charts
Value
Placement
0
Left
1
Right
2
Centered
83
Example:
The following instructions obtain the horizontal alignment of text object #10 and align
it to right of the bar:
If Text_GetHStyle(10) <> 1 Then
Value1 = Text_SetHStyle(1);
Text_GetNext
You can draw text objects using trading signals, analysis techniques (indicators and
studies) or functions, or by using the drawing object tool. EasyLanguage enables you to
search for text objects based on how they were created.
The charting application stores the chronological order of all text objects added to a chart,
and this information is made available to EasyLanguage. This reserved word returns the ID
number of the text object on the price chart added immediately after the text object
specified. You can use this reserved word together with the reserved word Text_GetFirst
to traverse all the text objects in a price chart.
It is important to remember that if an invalid ID number is used, the reserved word will
return a value of -2 and no additional operations will be performed on any text objects by
the trading signal, analysis technique, or function that generated the error.
Syntax:
Value1 = Text_GetNext(Text_ID, Num)
Parameters:
Text_ID is a numeric expression representing the ID number of the text object, and
Num is a numeric expression representing the origin type of the text object. The
possible values for Num are:
Value of num
Description
1
Text created by a trading signal, analysis technique, or function
2
Text created by the text drawing object tool only
3
Text created by either the text drawing object tool or a trading signal, analysis technique, or function
If a value different than 1, 2, or 3 is used, EasyLanguage will assume a value of 3.
84
Drawing Text on Price Charts
CHAPTER 2
Notes:
Value1 is any numeric variable or array, and holds the ID number of the text object added
after the text object specified.
Example:
The following statements set the color of all text objects in the chart to yellow:
Value1 = Text_GetFirst(3);
While Value1 <> -2 Begin
Value2 = Text_SetColor(Value1, Yellow);
Value1 = Text_GetNext(Value1, 3);
End;
In the above example, we obtain the ID number for the first text object drawn on the
chart. Then, we set its color to yellow. We then obtain the ID number of the next text
object and set that to yellow. This loop continues until Text_GetNext returns -2
indicating that there are no more text objects on the chart. Keep in mind that once the
trading signal, analysis technique, or function returns -2, it cannot draw any more text
objects on the chart. In this situation, you may want to use one trading signal, analysis
technique, or function to draw the text objects, and another to change their color.
Text_GetString
This reserved word returns the text string expression corresponding to the text object
specified. It is important to remember that if an invalid ID number is used, the reserved
word will return a value of -2 and no additional operations will be performed on any text
objects by the trading signal, analysis technique, or function that generated the error.
Syntax:
MyText = Text_GetString(Text_ID)
Parameters:
Text_ID is a numeric expression representing the ID number of the text object whose text
string expression you want to obtain.
Notes:
MyText is any text variable or array, and holds the text string expression corresponding to
the text object with the ID number specified.
Example:
The following statements print the contents of text object #5 to the Debug window:
Variable: MyText (“ ”) ;
Print( Text_GetString(5) );
Text_GetTime
This reserved word returns a numeric expression corresponding to the EasyLanguage time
of the bar on which the specified text object is anchored. It is important to remember that
The Basic EasyLanguage Elements
Drawing Text on Price Charts
85
if an invalid ID number is used, the reserved word will return a value of -2 and no additional
operations will be performed on any text objects by the trading signal, analysis technique,
or function that generated the error.
Syntax:
Value1 = Text_GetTime(Text_ID)
Parameters:
Text_ID is a numeric expression representing the ID number of the text object for which
you want to obtain the time.
Notes:
Value1 is any numeric variable or array, and holds the time of the specified text object.
Example:
The following statement assigns the EasyLanguage time of the bar where the text object
with the ID number 5 is drawn to the variable Value1 :
Value1 = Text_GetTime(5);
Text_GetValue
Text objects are drawn at a specific price value on the price chart. This reserved word
returns a numeric value corresponding to the price at which the specified text object is
anchored. It is important to remember that if an invalid ID number is used, the reserved
word will return a value of -2 and no additional operations will be performed on any text
objects by the trading signal, analysis technique, or function that generated the error.
Syntax:
Value1 = Text_GetValue(Text_ID)
Parameters:
Text_ID is a numeric expression representing the ID number of the text object whose
price value you want to obtain.
Notes:
Value1 is any numeric variable or array, and holds the price value at which the specified
object is anchored.
Example:
For example, the following statement can be used to print to the Debug window the
value at which text object 10 is drawn:
Print( Text_GetValue(10) ) ;
Text_GetVStyle
A text object is always anchored at a specific price value on a price chart, and there are three
possible ways to align the text object vertically: the top being at the specified price, the
bottom being at the specified price, or centered. This reserved word returns a numeric value
representing the vertical alignment of the specified text object.
86
Drawing Text on Price Charts
CHAPTER 2
It is important to remember that if an invalid ID number is used, the reserved word will
return a value of -2 and no additional operations will be performed on any text objects by
the trading signal, analysis technique, or function that generated the error.
Syntax:
Value1 = Text_GetVStyle(Text_ID)
Parameters:
Text_ID is a numeric expression representing the ID number of the text object whose
vertical alignment you want to obtain.
Notes:
Value1 can be any numeric variable or array, and holds the price value at which the
specified object is anchored.
This reserved word returns one of three values:
Value
Placement
0
Top
1
Bottom
2
Centered
Example:
The following instructions obtain the vertical alignment of text object #10 and set it to Bottom:
If Text_GetHStyle(10) <> 1 Then
Value1 = Text_SetVStyle(1);
Text_SetColor
This reserved word sets the color of the specified text object.
Syntax:
Value1 = Text_SetColor(Text_ID, Color)
Parameters:
Text_ID is a numeric expression representing the ID number of the text object, and Color
is an EasyLanguage color or its numeric equivalent.
For a list of the available colors, refer to Appendix B of this book.
Notes:
Value1 is any numeric variable or array. You must assign the text object reserved word
to a numeric variable or array so that you can determine whether or not the reserved
word performed its operation successfully.
It is important to remember that if an invalid ID number is used, the reserved word will
return a value of -2 and no additional operations will be performed on any text objects
by the trading signal, analysis technique, or function that generated the error.
The Basic EasyLanguage Elements
Drawing Text on Price Charts
87
Example:
The following indicator displays the word “Key” wherever there is a key reversal pattern
on the price chart, and compares the color of the text object with the background of the price
chart. If the colors match, the indicator sets the text object to a different color (it adds 1 to
the current color):
Variables: ID(-1), TxtColor(0);
If Low < Low[1] AND Close > High[1] Then Begin
ID = Text_New(Date, Time, Low, “Key”);
TxtColor = Text_GetColor(ID);
If TxtColor = GetBackgroundColor Then
Value1 = Text_SetColor(ID, TxtColor + 1);
End;
Text_SetLocation
All text objects are anchored at a specific bar and price value on the price chart. This
reserved word modifies the point at which the specified text object is anchored.
Syntax:
Value1 = Text_SetLocation(Text_ID, BarDate, BarTime, Price)
Parameters:
Text_ID is a numeric expression representing the ID number of the text object to modify;
BarDate and BarTime are numeric expressions representing the new EasyLanguage date
and time, respectively, at which to anchor the text object; and Price is the new price value
at which to anchor the text object.
Notes:
Value1 is any numeric variable or array. You must assign the text object reserved word
to a numeric variable or array so that you can determine whether or not the reserved
word performed its operation successfully.
It is important to remember that if an invalid ID number is used, the reserved word will
return a value of -2 and no additional operations will be performed on any text objects
by the trading signal, analysis technique, or function that generated the error.
We recommend that you change the location of the text object rather than delete the
text object and draw a new one. Relocating an existing object is faster and generates
fewer ID numbers to keep track of.
Example:
These statements display the name of the symbol above the first bar in the chart (after MaxBarsBack) and then change the location of the text to always display it on the last bar of the
chart:
If BarNumber = 1 Then
Value1 = Text_New(Date, Time, High *1.01, GetSymbolName);
Value2 = Text_SetLocation(Value1, Date, Time, High * 1.01);
88
Drawing Text on Price Charts
CHAPTER 2
Text_SetString
This reserved word changes the text string expression of the specified text object.
Syntax:
Value1 = Text_SetString(Text_ID, “MyText”)
Parameters:
Text_ID is a numeric expression representing the ID number of the text object whose text
string expression you want to modify, and MyText is the new text string expression for the
text object.
Notes:
Value1 is any numeric variable or array. You must assign the text object reserved word
to a numeric variable or array so that you can determine whether or not the reserved
word performed its operation successfully.
It is important to remember that if an invalid ID number is used, the reserved word will
return a value of -2 and no additional operations will be performed on any text objects
by the trading signal, analysis technique, or function that generated the error.
We recommend that you change the text string expression of the text object rather than
delete the text object and draw a new one. Changing an existing text object is faster and
generates fewer ID numbers to keep track of.
Example:
These statements display the closing price of the symbol above the first bar in the chart (after MaxBarsBack) and then change the location of the text and the text to always display
the closing price of the last bar on the chart:
If BarNumber = 1 Then
Value1=Text_New(Date,Time,High*1.01,NumToString(Close,2));
Value2 = Text_SetLocation(Value1, Date, Time, High * 1.01);
Value3 = Text_SetString(Value1, NumToString(Close,2));
Text_SetStyle
A text object is always anchored at a specific bar and price value. There are three horizontal
alignment settings: to the left of the bar where it is drawn, to the right, or centered. Also,
there are three vertical alignment settings: the top being at the specified price, the bottom
being at the specified price, or centered.
This reserved word changes the horizontal and vertical alignment of the specified text object.
Syntax:
Value1 = Text_SetStyle(Text_ID, HVal, VVal)
The Basic EasyLanguage Elements
Drawing Trendlines on Price Charts
89
Parameters:
Text_ID is a numeric expression representing the ID number of the text object whose
alignment you want to change, and HVal and VVal are numeric expressions
representing the horizontal and vertical alignment of the text object, respectively.
You can use one of three horizontal alignment values (HVal):
Value
Placement
0
Left
1
Right
2
Centered
You can use one of three vertical alignment values (VVal):
Value
Placement
0
Top
1
Bottom
2
Centered
If there are no text objects with the ID number you specify, or if the operation fails in
any way, this reserved word will return a numeric expression corresponding to one of
the EasyLanguage drawing objects error codes, and no additional operations will be
performed on any text objects by the trading signal, analysis technique, or function that
generated the error.
Notes:
Value1 is any numeric variable or array. You must assign the text object reserved word
to a numeric variable or array so that you can determine whether or not the reserved
word performed its operation successfully.
Example:
The following statement changes the alignment of text object #3 so it is right aligned
and sits above the specified price:
Value1 = Text_SetStyle(3, 1, 1) ;
Drawing Trendlines on Price Charts
You can draw and manipulate trendlines on a price chart from a trading signal, analysis
technique (indicators and studies) or functions. The very first concept you need to understand to start working with trendlines is that each instance of a trendline drawing object on
a chart has a distinct identification (ID) number. All EasyLanguage commands use the ID
number to refer to a specific trendline.
To view the ID number for a trendline, double-click the trendline to display the Format
Trendline dialog box; the caption will contain the ID number, as shown in Figure 2-15.
90
Drawing Trendlines on Price Charts
CHAPTER 2
Figure 2-15. Formatting a trendline on a chart
Trendlines are added to a chart using the default properties (i.e., color, thickness, line
style, extension status, and alert status) of the charting application. You can modify
these attributes using the trendline-related reserved words.
To place a trendline on the chart, you need to define its start and end points. Each point
is defined using a date and time (x axis) and a price value (y axis). This is the basic
information that you manipulate when working with trendlines; additional information
that you manipulate using reserved words includes the color, thickness, and line style,
as well as extension and alert status.
All of the reserved words used to work with trendlines return a numeric value
representing the result of the operation they performed. If the reserved word was able
to carry out its task successfully, it will return a value of 0; however, if an error
occurred, the reserved word returns a numeric value representing the specific error. The
following table lists the possible return values of the trendline reserved words:
Value
Explanation
-2
The identification number used was invalid (i.e., there is no
object on the chart with this ID number).
-3
The data number (Data2, Data3, etc.) passed to the function
was invalid. There is no symbol (or data stream) on the chart
with this data number.
-4
The value passed to a SET function was invalid (for example,
an invalid color or line thickness was used).
The Basic EasyLanguage Elements
Drawing Trendlines on Price Charts
Value
Explanation
-5
The beginning and ending points were the same (only when
working with trendlines). Can occur when you relocate a
trendline or change the begin/end points.
-6
The function was unable to load the default values for the tool.
-7
Unable to add the object. Possibly due to an out of memory
condition. Your system resources have been taxed and it
cannot process the request.
-8
Invalid pointer.Your system resources have been taxed and it
cannot process the request.
-9
Previous failure.Once an object returns an error code, no
additional objects can be created by the trading signal, analysis technique, or function that generated the error.
-10
Too many trendline objects on the chart.
-11
Too many text objects on the chart.
91
Whenever any of the trendline reserved words is unable to perform its task and returns
an error, the trading signal, analysis technique, or function will stop manipulating all
trendlines from that bar forward. The trading signal, analysis technique, or function itself
will continue to be evaluated, but all statements that include trendline reserved words
will return a value of -9 (Previous failure error) and will not perform the intended
action.
If you have any intention of modifying or referring to the trendline drawn in the price
chart in any way, you must store the ID number of the trendline. If you are adding
multiple trendlines to the price chart, we recommended you use arrays to store their ID
numbers.
Trendline Reserved Words
Following is a list of all the trendline reserved words available in EasyLanguage.
TL_New
This reserved word adds a trendline with the specified starting and ending points to a
price chart. It returns a numeric expression corresponding to the ID number of the
trendline added to the chart. If you want to modify the trendline in any way, it is very
important that you capture and keep the number; the ID number is the only way of
referencing a specific trendline.
Syntax:
Value1 = TL_New(iBarDate, iBarTime, iPrice, eBarDate,
eBarTime, ePrice)
92
Drawing Trendlines on Price Charts
CHAPTER 2
Parameters:
iBarDate, iBarTime, and iPrice are numeric expressions corresponding to the date,
time, and price, respectively, of the starting point; eBarDate, eBarTime, and ePrice are
numeric expressions corresponding to the date, time, and price, respectively, of the end
point of the trendline.
Notes:
Value1 is any numeric variable or array, and holds the ID number for the new trendline.
A minimum of two different points are needed in order to draw any trendline on a price
chart, and this is the information that you need to provide to the TL_New reserved word
to draw a trendline on the price chart from a trading signal, analysis technique, or
function.
Trendlines are added to the chart using the default properties set in the charting
application. As you will see, you can change any of these properties using the reserved
words listed in this section.
For example, the following statements add a trendline to the price chart (and extend it to
the right) every time there is a key reversal pattern:
Variable: ID(-1);
If Low < Low[1] AND Close > High[1] Then Begin
ID = TL_New(Date[1], Time[1], Low, Date, Time, Low);
Value1 = TL_SetExtRight(ID, True);
End;
TL_Delete
This reserved word deletes the specified trendline from the price chart.
Syntax:
Value1 = TL_Delete(Tl_ID)
Parameters:
Tl_ID is a numeric expression representing the ID number of the trendline to delete.
Notes:
Value1is any numeric variable or array. You must assign the trendline reserved word to
a numeric variable or array so that you can determine whether or not the reserved word
performed its operation successfully.
It is important to remember that if an invalid ID number is used, the reserved word will
return a value of -2 and no additional operations will be performed on any trendlines
by the trading signal, analysis technique, or function that generated the error.
Example:
The following statements draw a trendline at the low of a key reversal and extend it to the
right, and in addition, delete the old trendline from the chart when a new key reversal is
found:
The Basic EasyLanguage Elements
Drawing Trendlines on Price Charts
93
Variables: OldKeyID(-1), ID(-1);
If Low < Low[1] AND Close > High[1] Then Begin
OldKeyID = ID;
ID = TL_New(Date[1], Time[1], Low, Date, Time, Low);
Value1 = TL_SetExtRight(ID, True);
If OldKeyID <> -1 Then
Value1 = TL_Delete(OldKeyID);
End;
In the above example, first we declare two variables, one to hold the ID number of the
old trendline, and one to hold the ID number for the new trendline. When we find a new
key reversal, we store the existing trendline’s ID number in OldKeyID, and create a
new trendline at the low of the key reversal bar and extend it to the right. Then, we
delete the old trendline. Before deleting the old trendline, we first check to make sure
the ID number in OldKeyID is not -1, which it will be until the second trendline is
drawn. This way, we don’t reference an invalid ID number.
TL_GetAlert
This reserved word obtains the alert setting for the specified trendline.
Syntax:
Value1 = TL_GetAlert(Tl_ID)
Parameters:
Tl_ID is a numeric expression representing the ID number of the trendline whose alert
status you want to obtain.
Notes:
Value1 can be any numeric variable or array, and holds the alert status. This reserved word
returns one of these three values:
Value
Description
0
None - no alert enabled
1
Breakout Intrabar
2
Breakout on Close
An alert set to Breakout on Close is triggered when on the previous bar, the close of the
symbol was lower than the trendline, and on the current bar, the close is higher than the
trendline. This type of alert is only evaluated once the bar is closed.
An alert set to Breakout Intrabar is triggered if the high crosses over the trendline or
if the low crosses under the trendline. This alert is triggered at the moment the trendline
is broken.
94
Drawing Trendlines on Price Charts
CHAPTER 2
Example:
The following statement checks the alert status for trendline #10 and if it is not set to
Breakout on Close, it enables it and sets it to Breakout on Close:
If TL_GetAlert(10) <> 2 Then
Value1 = TL_SetAlert(10, 2);
TL_GetBeginDate
This reserved word returns the date of the starting point of the trendline. The start point
is the one with the earlier date. If the trendline is vertical, the lower of the two points
is considered to be the starting point.
Syntax:
Value1 = TL_GetBeginDate(Tl_ID)
Parameters:
Tl_ID is a numeric expression representing the ID number of the trendline whose start date
you want to obtain.
Notes:
Value1is any numeric variable or array, and holds the date of the starting point.
It is important to remember that if an invalid ID number is used, the reserved word will
return a value of -2 and no additional operations will be performed on any trendlines
by the trading signal, analysis technique, or function that generated the error.
Example:
The following statement assigns the EasyLanguage date of the bar used as the start
point for the trendline with the ID number 5 to the variable Value1:
Value1 = TL_GetBeginDate(5);
TL_GetBeginTime
This reserved word returns the time of the starting point of the trendline. The start point
is the one with the earlier date. If the trendline is vertical, the lower of the two points
is considered to be the starting point.
Syntax:
Value1 = TL_GetBeginTime(Tl_ID)
Parameters:
Tl_ID is a numeric expression representing the ID number of the trendline whose
starting time you want to obtain.
Notes:
Value1is any numeric variable or array, and holds the date of the starting point.
The Basic EasyLanguage Elements
Drawing Trendlines on Price Charts
95
It is important to remember that if an invalid ID number is used, the reserved word will
return a value of -2 and no additional operations will be performed on any trendlines
by the trading signal, analysis technique, or function that generated the error.
Example:
The following statement assigns the EasyLanguage time of the bar used as the start point
for the trendline with the ID number 5 to the variable Value1:
Value1 = TL_GetBeginTime(5);
TL_GetBeginVal
This reserved word returns a numeric expression corresponding to the price value used
as the starting point of the trendline. The starting point of the trendline is the one with
the earlier date; if the trendline is vertical, the lower of the two points is considered to
be the starting point.
Syntax:
Value1 = TL_GetBeginVal(Tl_ID)
Parameters:
Tl_ID is a numeric expression representing the ID number of the trendline whose
starting price value you want to obtain.
Notes:
Value1is any numeric variable or array, and holds the price value of the starting point
of the trendline.
It is important to remember that if an invalid ID number is used, the reserved word will
return a value of -2 and no additional operations will be performed on any trendlines
by the trading signal, analysis technique, or function that generated the error.
Example:
The following statement assigns the price value of the starting point of trendline #5 to the
variable Value1:
Value1 = TL_GetBeginVal(5);
TL_GetColor
This reserved word returns a numeric expression corresponding to the color assigned to the
specified trendline.
Syntax:
Value1 = TL_GetColor(Tl_ID)
Parameters:
Tl_ID is a numeric expression representing the ID number of the trendline whose color you
want to obtain.
96
Drawing Trendlines on Price Charts
CHAPTER 2
Notes:
Value1is any numeric variable or array, and holds the EasyLanguage color or numeric
equivalent of the specified trendline.
It is important to remember that if an invalid ID number is used, the reserved word will
return a value of -2 and no additional operations will be performed on any trendlines
by the trading signal, analysis technique, or function that generated the error.
For a list of supported colors, refer to Appendix B of this book.
Example:
The following statements draw a trendline at the low of each key reversal pattern. If the color of the trendline matches the background color of the chart, the indicator sets the trendline
to a different color (it adds 1 to the current color):
Variable: ID(-1);
If Low < Low[1] AND Close > High[1] Then Begin
ID = TL_New(Date[1], Time[1], Low, Date, Time, Low);
Value1 = TL_GetColor(ID);
If Value1 = GetBackGroundColor Then
Value2 = TL_SetColor(ID, Value1 + 1);
End;
TL_GetEndDate
This reserved word returns the date of the ending point of the trendline. The ending
point of the trendline is the one with the later date; if the trendline is vertical, the higher
of the two points is considered to be the ending point.
Syntax:
Value1 = TL_GetEndDate(Tl_ID)
Parameters:
Tl_ID is a numeric expression representing the ID number of the trendline whose end date
you want to obtain.
Notes:
Value1is any numeric variable or array, and holds the date of the starting point.
It is important to remember that if an invalid ID number is used, the reserved word will
return a value of -2 and no additional operations will be performed on any trendlines
by the trading signal, analysis technique, or function that generated the error.
Example:
The following statement assigns the EasyLanguage date of the bar used as the end point
for the trendline with the ID number 5 to the variable Value1:
Value1 = TL_GetEndDate(5);
The Basic EasyLanguage Elements
Drawing Trendlines on Price Charts
97
TL_GetEndTime
This reserved word returns the time of the ending point of the trendline. The ending
point of the trendline is the one with the later date; if the trendline is vertical, the higher
of the two points is considered to be the ending point.
Syntax:
Value1 = TL_GetEndTime(Tl_ID)
Parameters:
Tl_ID is a numeric expression representing the ID number of the trendline whose
ending time you want to obtain.
Notes:
Value1is any numeric variable or array, and holds the date of the ending point.
It is important to remember that if an invalid ID number is used, the reserved word will
return a value of -2 and no additional operations will be performed on any trendlines
by the trading signal, analysis technique, or function that generated the error.
Example:
The following statement assigns the EasyLanguage time of the bar used as the end point for
the trendline with the ID number 5 to the variable Value1:
Value1 = TL_GetEndTime(5);
TL_GetEndVal
This reserved word returns a numeric expression corresponding to the price value used
as the ending point of the trendline. The ending point of the trendline is the one with
the later date; if the trendline is vertical, the higher of the two points is considered to
be the ending point.
Syntax:
Value1 = TL_GetEndVal(Tl_ID)
Parameters:
Tl_ID is a numeric expression representing the ID number of the trendline whose
ending price value you want to obtain.
Notes:
Value1is any numeric variable or array, and holds the price value of the ending point of
the trendline.
It is important to remember that if an invalid ID number is used, the reserved word will
return a value of -2 and no additional operations will be performed on any trendlines
by the trading signal, analysis technique, or function that generated the error.
98
Drawing Trendlines on Price Charts
CHAPTER 2
Example:
The following statement assigns the price value of the ending point of trendline #5 to the
variable Value1:
Value1 = TL_GetEndVal(5);
TL_GetExtLeft
Trendlines can be extended to the right or left. This reserved word returns a value of True
or False. If the trendline is extended to the left, it will return a value of True; otherwise, it
will return a value of False.
Syntax:
Condition1 = TL_GetExtLeft(Tl_ID)
Parameters:
Tl_ID is a numeric expression representing the ID number of the trendline whose extension
status you want to obtain.
Notes:
Condition1 can be any true/false variable or array, and holds the true/false value determining whether or not the trendline is extended. If an invalid ID number is used, the value False
is returned.
Example:
The following instructions extend the trendline #10 to the left if it is not already extended:
If TL_GetExtLeft(10) = False Then
Value1 = TL_SetExtLeft(10, True);
TL_GetExtRight
Trendlines can be extended to the right or left. This reserved word returns a value of True
or False. If the trendline is extended to the right, it will return a value of True; otherwise, it
will return a value of False.
Syntax:
Condition1 = TL_GetExtRight(Tl_ID);
Parameters:
Tl_ID is a numeric expression representing the ID number of the trendline whose extension
status you want to obtain.
Notes:
Condition1 can be any true/false variable or array, and holds the true/false value determining whether or not the trendline is extended. If an invalid ID number is used, the value False
is returned.
Example:
The following instructions extend the trendline #10 to the right if it is not already extended:
If TL_GetExtRight(10) = False Then
Value1 = TL_SetExtRight(10, True);
The Basic EasyLanguage Elements
Drawing Trendlines on Price Charts
99
TL_GetFirst
You can draw trendlines using trading signals, analysis techniques (indicators and studies)
or functions, or by using the drawing object tool. EasyLanguage enables you to search for
trendlines based on how and in what order they were created.
The charting application stores the chronological order of all trendlines added to a chart,
and this information is made available to EasyLanguage. This reserved word returns the ID
number of the first trendline added to the price chart (by a trading signal, analysis
technique, or function, or by a drawing tool, or by either).
It is important to remember that if an invalid ID number is used, the reserved word will
return a value of -2 and no additional operations will be performed on any trendlines by the
trading signal, analysis technique, or function that generated the error.
Syntax:
Value1 = TL_GetFirst(Num)
Parameters:
Num is a numeric expression representing the origin type of the trendline. The possible
values for Num are:
Value of Num
Description
1
Trendline created by a trading signal, analysis technique, or
function
2
Trendline created by the trendline drawing object tool only
3
Trendline created by either the trendline drawing object tool
or a trading signal, analysis technique, or function
If a value different than 1, 2, or 3 is used, EasyLanguage will assume a value of 3.
Notes:
Value1 is any numeric variable or array that holds the ID number of the desired trendline.
Example:
The following statements delete the oldest trendline on a price chart drawn by a trading
signal, analysis technique, or function:
Value1 = TL_GetFirst(1);
Value2 = TL_Delete(Value1);
Note: When the oldest (first) trendline is deleted, the next oldest (second) trendline
becomes the first drawn on the price chart, and so on.
100
Drawing Trendlines on Price Charts
CHAPTER 2
TL_GetNext
You can draw trendlines using trading signals, analysis techniques (indicators or studies),
or functions, or by using the drawing object tool. EasyLanguage enables you to search for
trendlines based on how they were created.
The charting application stores the chronological order of all trendlines added to a chart,
and this information is made available to EasyLanguage. This reserved word returns the ID
number of the trendline on the price chart added immediately after the trendline specified.
You can use this reserved word together with the reserved word TL_GetFirst to traverse all
the trendlines in a price chart.
It is important to remember that if an invalid ID number is used, the reserved word will
return a value of -2 and no additional operations will be performed on any trendlines by the
trading signal, analysis technique, or function that generated the error.
Syntax:
Value1 = TL_GetNext(TL_ID, Num)
Parameters:
TL_ID is a numeric expression representing the ID number of the trendline, and Num
is a numeric expression representing the origin type of the trendline. The possible
values for Num are:
Value of Num
Description
1
Trendline created by a trading signal, analysis technique, or
function
2
Trendline created by the trendline drawing object tool only
3
Trendline created by either the trendline drawing object tool
or a trading signal, analysis technique, or function
If a value different than 1, 2, or 3 is used, EasyLanguage will assume a value of 3.
Notes:
Value1 is any numeric variable or array, and holds the ID number of the trendline added
after the trendline specified.
Example:
The following statements set the color of all trendlines in the chart to yellow:
Value1 = TL_GetFirst(3);
While Value1 <> -2 Begin
Value2 = TL_SetColor(Value1, Yellow);
Value1 = TL_GetNext(Value1, 3);
End;
The Basic EasyLanguage Elements
Drawing Trendlines on Price Charts
101
In the above example, we obtain the ID number for the first trendline drawn on the
chart. Then, we set its color to yellow. We then obtain the ID number of the next
trendline and set that to yellow. This loop continues until TL_GetNext returns -2
indicating that there are no more trendlines on the chart. Keep in mind that once the
trading signal, analysis technique, or function returns -2, it cannot draw any more
trendline on the chart. In this situation, you may want to use one trading signal, analysis
technique, or function to draw the trendlines, and another to change their color.
TL_GetSize
This reserved word returns a numeric expression representing the thickness of the
trendline, where 0 is the thinnest, and 6 is the thickest.
Syntax:
Value1 = TL_GetSize(Tl_ID)
Parameters:
Tl_ID is a numeric expression representing the ID number of the trendline whose thickness
setting you want to obtain.
Notes:
Value1 can be any numeric variable or array, and holds the thickness setting.
It is important to remember that if an invalid ID number is used, the reserved word will
return a value of -2 and no additional operations will be performed on any trendlines by the
trading signal, analysis technique, or function that generated the error.
Example:
The following statement assigns the thickness of trendline #10 to the variable Value1:
Value1 = TL_GetSize(10);
TL_GetStyle
This reserved word returns a numeric expression representing the line style used for the
specified trendline.
Syntax:
Value1 = TL_GetStyle(Tl_ID)
Parameters:
Tl_ID is a numeric expression representing the ID number of the trendline whose line style
you want to obtain.
102
Drawing Trendlines on Price Charts
CHAPTER 2
Notes:
Value1is any numeric variable or array, and holds the numeric expression representing
the line style of the specified trendline. Following are the possible return values and
their numeric equivalents:
Tool_Solid
1
Tool_Dashed
2
Tool_Dotted
3
Tool_Dashed2 4
Tool_Dashed3 5
You can use either the numbers or the EasyLanguage reserved word.
It is important to remember that if an invalid ID number is used, the reserved word will
return a value of -2 and no additional operations will be performed on any trendlines
by the trading signal, analysis technique, or function that generated the error.
Example:
The following IF-THEN statement verifies that a trendline is solid before executing the
EasyLanguage instruction:
If TL_GetStyle(10) = Tool_Solid Then
{EasyLanguage instruction } ;
TL_GetValue
This reserved word returns a numeric expression corresponding to the value of a trendline
at a specific bar. It is important to remember that this reserved word returns a value even if
the trendline is not shown on or projected through the bar specified. For example, if a
trendline is drawn from December 1st to January 5th, and the following statement is used:
Value1 = TL_GetValue(10, 990203, 1400);
Even though the date specified is in February, the TL_GetValue reserved word will return
the trendline value as if the trendline were extended to that particular bar (along the same
slope).
Syntax:
Value1 = TL_GetValue(Tl_ID, TLDate, TLTime)
Parameters:
Tl_ID is a numeric expression representing the ID number of the trendline whose price
value you want to obtain. TLDate and TLTime are the date and time, respectively, of the bar
for which you want to obtain the trendline’s value.
Notes:
Value1is any numeric variable or array. You must assign the trendline reserved word to
a numeric variable or array so that you can determine whether or not the reserved word
performed its operation successfully.
The Basic EasyLanguage Elements
Drawing Trendlines on Price Charts
103
It is important to remember that if an invalid ID number is used, the reserved word will
return a value of -2 and no additional operations will be performed on any trendlines
by the trading signal, analysis technique, or function that generated the error.
Example:
The following statement triggers an alert when the close crosses over trendline #10:
If Close Crosses Over TL_GetValue(10, Date, Time) Then
Alert(“Trendline is broken”);
TL_SetAlert
This reserved word changes the alert status for a trendline.
Syntax:
Value1 = TL_SetAlert(Tl_ID, AlertVal)
Parameters:
Tl_ID is a numeric expression representing the identification number of the trendline, and
AlertVal is a numeric expression representing the alert setting for the trendline. You can
specify one of these three values:
Value
Description
0
None - no alert enabled
1
Breakout Intrabar
2
Breakout on Close
An alert set to Breakout on Close is triggered when on the previous bar, the close of the
symbol was lower than the trendline, and on the current bar, the close is higher than the
trendline. This type of alert is only evaluated once the bar is closed.
An alert set to Breakout Intrabar is triggered if the high crosses over the trendline or
if the low crosses under the trendline. This alert is triggered at the moment the trendline
is broken.
Notes:
Value1is any numeric variable or array. You must assign the trendline reserved word to
a numeric variable or array so that you can determine whether or not the reserved word
performed its operation successfully.
It is important to remember that if an invalid ID number is used, the reserved word will
return a value of -2 and no additional operations will be performed on any trendlines
by the trading signal, analysis technique, or function that generated the error.
Example:
The following statement checks the alert status for trendline #10 and if it is not set to Breakout on Close, it enables it and sets it to Breakout on Close:
If TL_GetAlert(10) <> 2 Then
Value1 = TL_SetAlert(10, 2);
104
Drawing Trendlines on Price Charts
CHAPTER 2
TL_SetBegin
This reserved word changes the start point of the specified trendline. It is very important to
know which is the starting point and which is the ending point for a trendline; the start point
has an earlier date and time. If the trendline is vertical, the point with the lower price value
is considered the starting point.
However, if the starting point of a trendline is changed (by EasyLanguage or by using the
drawing tool) such that it has a later date than the ending point, the starting point then
becomes the old ending point of the trendline.
Syntax:
Value1 = TL_SetBegin(Tl_ID, iDate, iTime, iVal)
Parameters:
Tl_ID is a numeric expression representing the identification number of the trendline, and
iDate, iTime, and iVal are numeric expressions representing the trendline’s starting point
date, time, and value respectively.
Notes:
Value1is any numeric variable or array. You must assign the trendline reserved word
to a numeric variable or array so that you can determine whether or not the reserved
word performed its operation successfully.
This reserved word returns zero (0) when it successfully changes the beginning point of a
trendline, and it returns one of the EasyLanguage drawing object errors when it fails. For
example, if the start point of the trendline is set to exactly the same value as the ending
point, the reserved word will return the error -5. Also, it is important to remember that if an
invalid ID number is used, the reserved word will return a value of -2, and no additional
operations will be performed on any trendlines by the trading signal, analysis technique, or
function that generated the error.
Example:
The following statement sets the start point of trendline #5 to the high price 10 bars ago:
Value1 = TL_SetBegin(5, Date[10], Time[10], High[10]);
TL_SetColor
This reserved word changes the color of the specified trendline.
Syntax:
Value1 = TL_SetColor(Tl_ID, Color)
Parameters:
Tl_ID is a numeric expression representing the ID number of the trendline whose color you
want to change, and Color is one of the EasyLanguage supported colors.
For a list of supported colors, refer to Appendix B of this book.
The Basic EasyLanguage Elements
Drawing Trendlines on Price Charts
105
Notes:
Value1is any numeric variable or array. You must assign the trendline reserved word to
a numeric variable or array so that you can determine whether or not the reserved word
performed its operation successfully.
It is important to remember that if an invalid ID number is used, the reserved word will
return a value of -2 and no additional operations will be performed on any trendlines
by the trading signal, analysis technique, or function that generated the error.
Example:
The following statements draw a trendline at the low of a key reversal, and compare the
color of the trendline with the background of the chart. If the colors match, the
EasyLanguage instructions add 1 to the color, and set the trendline to this new color:
Variables: ID(-1), TLColor(0);
If Low < Low[1] AND Close > High[1] Then Begin
ID = TL_New(Date[1], Time[1], Low, Date, Time, Low);
TLColor = TL_GetColor(ID);
If TLColor = GetBackgroundColor Then
Value1 = TL_SetColor(ID, TxtColor+1);
End;
TL_SetEnd
This reserved word changes the end point of the specified trendline. It is very important to
know which is the starting point and which is the ending point for a trendline; the end point
has a later date and time. If the trendline is vertical, the point with the higher price value is
considered the ending point.
However, if the ending point of a trendline is changed (by EasyLanguage or by using the
drawing tool) such that it has an earlier date than the starting point, the ending point then
becomes the original starting point of the trendline.
Syntax:
Value1 = TL_SetEnd(Tl_ID, eDate, eTime, eVal)
Parameters:
Tl_ID is a numeric expression representing the identification number of the trendline, and
eDate, eTime, and eVal are numeric expressions representing the trendline’s new ending
point date, time, and price value, respectively.
Notes:
Value1is any numeric variable or array. You must assign the trendline reserved word
to a numeric variable or array so that you can determine whether or not the reserved
word performed its operation successfully.
This reserved word returns zero (0) when it successfully changes the end point of a
trendline, and one of the EasyLanguage drawing object errors when it fails. For example,
if the end point of the trendline is set to exactly the same value of the start point, the
106
Drawing Trendlines on Price Charts
CHAPTER 2
reserved word will return an error -5. Also, it is important to remember that if an invalid ID
number is used, the reserved word will return a value of -2 and no additional operations will
be performed on any trendlines by the trading signal, analysis technique, or function that
generated the error.
Example:
The following statement sets the end point of trendline #5 to the current bar’s high price:
Value1 = TL_SetEnd(5, Date, Time, High);
TL_SetExtLeft
Trendlines can be extended to the left or right. This reserved word enables you to toggle the
trendline between extended to the left and not extended.
Syntax:
Value1 = TL_SetExtLeft(Tl_ID, Extend)
Parameters:
Tl_ID is a numeric expression representing the ID number of the trendline, and Extend is a
true/false expression that either extends the trendline to the left or not.
Notes:
Value1is any numeric variable or array. You must assign the trendline reserved word to
a numeric variable or array so that you can determine whether or not the reserved word
performed its operation successfully.
It is important to remember that if an invalid ID number is used, the reserved word will
return a value of -2 and no additional operations will be performed on any trendlines
by the trading signal, analysis technique, or function that generated the error.
Example:
The following statements draw a trendline at the low of a key reversal bar and extend it to
the right:
Variable: ID(-1);
If Low < Low[1] AND Close > High[1] Then Begin
ID = TL_New(Date[1], Time[1], Low, Date, Time, Low);
Value1 = TL_SetExtRight(ID, True);
End;
TL_SetExtRight
Trendlines can be extended to the left or right. This reserved word enables you to toggle the
trendline between extended to the right and not extended.
Syntax:
Value1 = TL_SetExtRight(Tl_ID, Extend)
The Basic EasyLanguage Elements
Drawing Trendlines on Price Charts
107
Parameters:
Tl_ID is a numeric expression representing the ID number of the trendline, and Extend is a
true/false expression that either extends the trendline to the right or not.
Notes:
Value1is any numeric variable or array. You must assign the trendline reserved word to
a numeric variable or array so that you can determine whether or not the reserved word
performed its operation successfully.
It is important to remember that if an invalid ID number is used, the reserved word will
return a value of -2 and no additional operations will be performed on any trendlines
by the trading signal, analysis technique, or function that generated the error.
Example:
The following statements draw a trendline at the low of a key reversal bar and extend it to
the left and right:
Variable: ID(-1);
If Low < Low[1] AND Close > High[1] Then Begin
ID = TL_New(Date[1], Time[1], Low, Date, Time, Low);
Value1 = TL_SetExtRight(ID, True);
Value1 = TL_SetExtLeft(ID, True);
End;
TL_SetSize
This reserved word changes the thickness of the specified trendline. Zero (0) is the
thinnest and six (6) is the thickest setting.
Syntax:
Value1 = TL_SetSize(Tl_ID, Num)
Parameters:
Tl_ID is a numeric expression representing the ID number of the trendline, and Num is a
numeric expression representing the thickness of the trendline, 0 - 6.
Notes:
Value1is any numeric variable or array. You must assign the trendline reserved word to
a numeric variable or array so that you can determine whether or not the reserved word
performed its operation successfully.
It is important to remember that if an invalid ID number is used, the reserved word will
return a value of -2 and no additional operations will be performed on any trendlines
by the trading signal, analysis technique, or function that generated the error.
Example:
The following statement sets the line style of trendline #10 to the thinnest line style
setting:
Value1 = TL_SetSize(10, 0);
108
Drawing Trendlines on Price Charts
CHAPTER 2
TL_SetStyle
This reserved word enables you to modify the style of the specified trendline.
Syntax:
Value1 = TL_SetStyle(Tl_ID, Style);
Parameters:
Tl_ID is a numeric expression representing the ID number of the trendline whose style you
want to change, and Style is a numeric expression representing the new line style for the
trendline.
The possible styles are:
Tool_Solid
1
Tool_Dashed
2
Tool_Dotted
3
Tool_Dashed2 4
Tool_Dashed3 5
You can use either the number or the reserved word. The style only applies when the
trendline is set to the thinnest size, which is zero (0).
Notes:
Value1is any numeric variable or array. You must assign the trendline reserved word to
a numeric variable or array so that you can determine whether or not the reserved word
performed its operation successfully.
It is important to remember that if an invalid ID number is used, the reserved word will
return a value of -2 and no additional operations will be performed on any trendlines
by the trading signal, analysis technique, or function that generated the error.
Example:
The following statement changes the line style of trendline #10 to a dotted line:
Value1 = TL_SetStyle(10, Tool_dotted);
The Basic EasyLanguage Elements
Understanding Quote Fields
109
Understanding Quote Fields
There is a category of reserved words called Quote Fields. These words are data-related
words specific to a symbol that are offered by the datafeed, and that are forwarded through
the GlobalServer and made available to you in EasyLanguage for use with RadarScreen and
OptionStation. This data is available only as snapshot information—no historical values are
available.
The main purpose of these words is to allow indicators applied to RadarScreen and
OptionStation to use less memory and be more efficient; in other words, to optimize the
performance of your grid applications.
It is important to remember that it is not possible to refer to historical values for any of these
quote fields. They are useful for performing analysis on intraday minute and tick bars and
referencing the current day’s information (e.g., daily high, low, open).
Following is a list of the quote fields available in the Omega Research ProSuite 2000i applications. For descriptions of these words, including examples of their use, see
Appendix C, “Reserved Word Quick Reference”:
PLEASE NOTE: Availability of the data for any quote field depends on the datafeed.
Category
Cusip
Description
ExpirationMonth
ExpirationRule
ExpirationStyle
ExpirationYear
Expired
FirstNoticeDate
HistorySettings
Maturity
MinMove
PointValue
q_7DayYield
q_Ask
q_AskExchange
q_AskSize
q_Bid
q_BidExchange
q_BidSize
q_Close
q_Datafeed
q_Date
q_DateLastAsk
q_DateLastTrade
q_DownVolume
q_ExchangeListed
q_ExpirationDate
q_Headline
q_HeadlineCount
q_High
q_Hour
q_Last
q_LastTradingDate
q_Low
q_Margin
q_Minute
q_MinutesDelayed
110
Multimedia and EasyLanguage
CHAPTER 2
q_Month
q_NetAssetValue
q_NetChange
q_NewsCount
q_NewsDay
q_NewsTime
q_Open
q_OpenInterest
q_OptionType
q_PreviousClose
q_PreviousDate
q_PreviousHigh
q_PreviousLow
q_PreviousOpen
q_PreviousOpenInterest
q_PreviousTime
q_PreviousVolume
q_Time
q_TimeLastAsk
q_TimeLastBid
q_TimeLastTrade
q_TotalVolume
q_TradeVolume
q_UnchangedVolume
q_UpVolume
q_Year
q_Yield
q_StrikePrice
Sessions
StrikeConfidence
SymbolName
SymbolNumber
SymbolRoot
Note: If a quote field has the same name as another reserved word, to reference the
quote field, you must use the pound sign ( # ) as a prefix.
Multimedia and EasyLanguage
You can include a sound (.wav) file or a video file (.avi) in any of your trading signals,
analysis techniques, or functions. Common uses of audio and video include alerts and
commentary. You can write your analysis techniques such that when an alert is triggered,
a video and/or a sound file is played.
The reserved words you use to include sound and video files are described next.
Playing Sound Files
There is only one reserved word you use to play sounds; it is described below.
PlaySound
This reserved word finds and plays the specified sound file (.wav file). This reserved
word returns a value of True if it was able to find and play the sound file, and it returns
a value of False if it is not able to find or play it.
The Basic EasyLanguage Elements
Multimedia and EasyLanguage
111
Syntax:
Condition1 = PlaySound(FileName);
Parameters:
Condition1 is any true/false variable or array, and FileName is any text string expression
that represents the full path and file name of the sound file to be played. Only .wav files
can be played.
Notes:
We recommended that you use this reserved word only on the last bar of the chart or on
bars where the commentary is obtained. Otherwise, you may find that the .wav file is
played more often than you intended. For example, if your intention is to play a .wav file
whenever a certain bar pattern occurs, and this pattern occurs 50 times in the price chart,
the trading signal, analysis technique, or function will play the .wav file 50 times when it
is applied to the price chart. Also, the .wav file is only played once per bar, even if the
event occurs more than once intrabar (unless the Update Every Tick option is enabled,
in which case, the .wav file will play with each new tick while the event is True).
Example:
The following statements play the sound file Ding.wav when there is a key reversal
pattern on the last bar of the chart:
If LastBarOnChart AND Low < Low[1] AND Close > High[1] Then
Condition1 = PlaySound("c:\windows\sounds\ding.wav");
Playing Video Files
You can play a video file (.avi file) using a combination of three reserved words.
EasyLanguage allows you to build video clips out of many different .avi files, and it
allows you to mix and match video clips at will.
First, you obtain a video clip ID number for each video clip that you will be using in your
trading signal, analysis technique, or function, then you specify what .avi files will make
up that video clip. You can play the resulting video clip at any time.
The three reserved words necessary to create video clips are described next.
MakeNewMovieRef
This reserved word creates a new video clip and returns a numeric value representing the
ID number of the new video clip created.
Syntax:
Value1 = MakeNewMovieRef;
Parameters:
Value1 is any numeric variable or array.
Notes:
Once you create the video clip using this reserved word, you can add one or more .avi
files to it using the reserved word AddToMovieChain. You must save the ID number of
112
Multimedia and EasyLanguage
CHAPTER 2
the video clip as it will be the way to reference the video clip in order to add .avi files as
well as play it.
Example:
The following statement creates a new video clip and assigns the ID number to the
variable Value1:
Value1 = MakeNewMovieRef;
AddToMovieChain
This reserved word adds .avi files to an existing video clip and returns a true/false value
representing the success of the operation. If the reserved word was able to add the .avi
file to the video clip, it returns a value of True; if it was not, it returns a value of False.
Syntax:
Condition1 = AddToMovieChain(Movie_ID, File);
Parameters:
Condition1 is any true/false variable or array, Movie_ID is a numeric expression
representing the ID number of the video clip to which you’re adding the .avi file, and File
is a text string expression representing the full path and file name of the .avi file to add
to the video clip.
Notes:
When a video clip is played, it will play all the .avi files in the order they were added to
the video clip.
Example:
The following statements create a video clip and add two .avi files to it:
Variable: ID(-1);
ID = MakeNewMovieRef ;
Condition1 = AddToMovieChain(ID, “c:\MyMovie.avi”);
Condition2 = AddToMovieChain(ID, “c:\MyOtherMovie.avi”);
PlayMovieChain
This reserved word plays a video clip and returns a true/false expression representing the
success of the operation. If the reserved word was able to play the video clip, it returns a
value of True, if it was not, it returns a value of False.
Syntax:
Condition1 = PlayMovieChain(Movie_ID);
Parameters:
Condition1 is any true/false variable or array, Movie_ID is a numeric expression representing the ID number of the video clip.
The Basic EasyLanguage Elements
Multimedia and EasyLanguage
113
Notes:
Once you have created a video clip using the reserved word MakeNewMovieRef and added
.avi files to the video clip, you are ready to play it. We recommend you use the reserved
word PlayMovieChain only on the last bar of the chart or on bars where the commentary
is obtained (using the AtCommentaryBar or LastBarOnChart reserved words).
Otherwise, you may find that the video clip is played more often than you need it to.
If your intention is to play the video clip when a certain bar pattern occurs, and this
pattern occurs 50 times the price chart, the trading signal, analysis technique, or function
will play the video clip 50 times when applied to the price chart.
Example:
The following statements create and play a video clip on the bar where commentary is
obtained:
Variable: ID(-1);
If BarNumber = 1 Then Begin
ID = MakeNewMovieRef;
Condition1 = AddToMovieChain(ID, “c:\MyMovie.avi”);
Condition2 = AddToMovieChain(ID, “c:\MyOtherMovie.avi”);
End;
If AtCommentaryBar Then
Condition1 = PlayMovieChain(ID);
Notice that the video clip is created and the video files are added to it only once by
using an IF-THEN statement to check for the first bar of the chart. If we don’t use this
IF-THEN statement, the indicator will create as many video clips as there are bars in
the chart.
Note: You can also use the reserved word LastBarOnChart instead of
AtCommentaryBar.
114
Multimedia and EasyLanguage
CHAPTER 2
CHAPTER 3
EasyLanguage for TradeStation
This chapter covers EasyLanguage specifically for use with TradeStation 2000i.
You are introduced to syntax for writing Trading Signals as well as the Trading Strategy
Testing Engine, which is the engine that performs the backtesting and automation of your
Trading Strategies.
This chapter also describes the reserved words for use with indicators and studies
(ShowMe, PaintBar, ActivityBar, and ProbabilityMap) when working with TradeStation.
In This Chapter
Writing Trading Signals ....................... 116
Writing Indicators and Studies............. 148
The Trading Strategy Testing Engine .. 117
Writing ShowMe and PaintBar Studies 154
Trading Verbs....................................... 131
Writing ProbabilityMap Studies .......... 159
Understanding Built-in Stops............... 144
Writing ActivityBar Studies................. 166
116
Writing Trading Signals
CHAPTER 3
Writing Trading Signals
EasyLanguage enables you to express your trading ideas very specifically using
TradeStation Trading Signals. An example of a statement within a Trading Signal is:
Buy 100 Shares Next Bar at Market;
The statements used to create in your Trading Signal have two parts, which are very
similar to the language you use to communicate with your broker. The first part of the
statement is the trading order, which is a description of the action you want to perform;
for example, buy 100 shares. The second part of the statement is the execution method,
which is exactly how (when and at what price) the order should be carried out; for
example, next bar at market.
There are four reserved words you can use to express your trading ideas when writing
Trading Signals. We refer to these words as trading verbs, and these are:
Trading Verb
Description
Buy
Cover all short positions and initiate a long position
Sell
Cover all long positions and initiate a short position
ExitLong
Close a long position
ExitShort
Close a short position
Figure 3-1. Trading Verbs
Each one of these orders can have four different execution methods:
... this bar on close
... next bar at market
... next bar at price stop
... next bar at price limit
As with all other EasyLanguage statements, the statements created using these trading
verbs are evaluated at the end of every bar, at which point an order is placed.
When an order is executed this bar on close (i.e., at the close of the current bar), it is executed immediately when the bar is closed. If it is specified as a next bar at market order, it
is executed at the opening price of the next bar. Stop and limit orders are left as open orders
that remain active throughout the next bar, until the price specified is met or the bar is
closed (completed).
Depending on the trading verb used, stop and limit orders translate into or higher or or lower than the specified price. The statement Buy next bar at 100 limit opens a long position
during the next bar at the first price available at or under 100. Similarly, the statement
ExitShort next bar at 50 stop closes a short position during the next bar at the first traded
price at or over 50. It is possible for stop and limit orders not to be filled (i.e., price never
reached); in this case, the orders are canceled at the close of the bar.
Figure 3-2 shows the meaning of the different orders.
EasyLanguage for TradeStation
The Trading Strategy Testing Engine
Trading Verb
Stop
Limit
Buy
or Higher
or Lower
Sell
or Lower
or Higher
ExitLong
or Lower
or Higher
ExitShort
or Higher
or Lower
117
Figure 3-2. Stop and Limit orders
Each component of a trading order is discussed in the section “Trading Verbs” on page 131.
The Trading Strategy Testing Engine
To as accurately as possible reproduce how a Trading Strategy would have performed in
the past, and to keep track of your trading rules as new data is collected, TradeStation uses
a powerful Trading Strategy Testing Engine. This engine takes all the orders generated by
the Trading Strategy applied to the chart and creates the TradeStation Strategy Performance
Report.
This section covers all the different procedures that the Trading Strategy Testing
Engine uses, and the assumptions it makes in order to evaluate the Trading Strategy applied
to a chart.
The Trading Strategy Testing Engine performs two functions, backtesting and automation.
Backtesting is the process of analyzing historical data and deriving historical profitability
results, and automation is the process of monitoring and analyzing new data as it is obtained. This section describes each process in detail.
Overview
Once you create a price chart and apply a Trading Strategy to it, TradeStation evaluates all
the Trading Strategy rules for the very first (oldest) bar on the chart—as it does with all
EasyLanguage procedures—and generates the trading orders (to buy, sell or exit) to be executed either at the close of that first bar or on the next bar.
Once TradeStation evaluates all instructions for the first bar on the chart, it reads the second
bar of data and evaluates any orders that were left active from the first bar with the prices
of the second bar, looking for possible fills. If tick data is available, TradeStation can look
at each traded price, or tick, to determine the price at which the orders would have been
filled, or if they would have been filled at all. If there is no tick data available, TradeStation
simulates the fill prices using several market assumptions explained later in this section.
Once the Trading Strategy Testing Engine is done evaluating the orders that were active
through the second bar, TradeStation returns to the EasyLanguage instructions that compose the Trading Strategy and generates the necessary orders for the close of the second bar
and places those for the third bar. This process, called backtesting, is repeated on every bar
until the last bar on the chart is reached (the most recent bar). The results of each trade are
stored and are presented in a variety of ways in the TradeStation Strategy Performance Report, which is commonly referred to as the Strategy Report.
118
The Trading Strategy Testing Engine
CHAPTER 3
The second part of the process is the automation of new orders. Backtesting takes a few seconds to complete, at which point, TradeStation begins to evaluate the new data as it is received. TradeStation also monitors any outstanding orders remaining from the backtesting
process. When each new bar is completed, TradeStation evaluates the EasyLanguage instructions of the Trading Strategy for this new bar, and places any orders for the close of
the current bar and/or the next bar. This process is repeated on every new bar until the
Trading Strategy is deleted from the chart or the workspace is closed.
Automation and backtesting are discussed in detail next.
Automation
Automation is the process of monitoring new data that is received by the GlobalServer for
the symbol to which the Trading Strategy is applied. The rules followed by the Trading
Strategy Testing Engine to evaluate the Trading Strategy orders are described next.
Price at Which Orders are Placed and Filled
The very first thing TradeStation does to any order it receives from a Trading Strategy
is verify that the order has a valid price for the instrument to which it is applied.
A valid price is any price that has a valid decimal value compared to the settings of the
charted symbol. The settings are the price scale and the minimum value.
If the price scale of a given symbol is 1/100, and the minimum movement is 10, then
this symbol only trades in 10ths of a point; therefore, 100.1, 950.5 and 10,000.7 are
valid prices whereas 95.125 is not.
If the order being processed is an or higher order, the price is rounded up to the nearest
valid trading price. If it is an or lower order, the price is rounded down to the nearest
price. Figure 3-3 describes how orders are interpreted by the Trading Strategy Testing
Engine.
Trading Verb
Stop
Limit
Buy
or Higher
or Lower
Sell
or Lower
or Higher
ExitLong
or Lower
or Higher
ExitShort
or Higher
or Lower
Figure 3-3. Stop and Limit orders
To continue with the above example, in which the price scale is 1/100 and the minimum
movement is 10, if an order to Buy at 100.125 limit is placed, this order will be placed in
TradeStation as an order to Buy at 100.1 or anything lower. If an order is placed to Buy
at 100.125 stop, this order will be placed as Buy at 100.2 or higher.
This rounding is essential because if an order is received to buy at 100.125 or higher, it
means that you do not want to buy at 100.124, or at 100.120, or much less at 100.1
because the order stated ‘100.125 or higher’; therefore, the only alternative is to round
up to the nearest valid trading price. The opposite is done for or lower orders for the same
reason.
EasyLanguage for TradeStation
The Trading Strategy Testing Engine
119
Determining Which Order to Fill
A Trading Strategy can place more than one order of the same type (buy, sell, or exit)
for a particular bar, and when it does, the Trading Strategy Testing Engine determines
which order to fill by following two rules:
Rule 1: Orders on Close and Next Bar at Market
Orders that are placed to be filled this bar at the close have the highest priority, once all
these orders have been filled, the next bar at market orders are evaluated. If there is more
than one order of the same type (e.g., three orders to buy this bar on the close), then the
order that was placed first takes priority and is filled first. This is important to remember
when designing a Trading Strategy that contains multiple entry orders that could enter the
market on the same bar.
For example, assume your Trading Strategy has a Trading Signal that will enter a long
position at the open of the next bar after a moving average crossover is found, and a
second signal that will enter a short position at the open of the next bar after a hammer
candlestick pattern formation is found. If both the long and short conditions are met on
the same bar, the Trading Strategy will issue orders to enter both a short and long position
is executed first, and the second order is executed immediately after.
If the entry signal to establish a short position is listed second, the Trading Strategy will
end that bar with a short position open. However, if the signal to establish a long position
is listed second, the Trading Strategy will end the bar with a long position.
In similar fashion, a Trading Signal can have multiple orders. If this is the case, the one
that appears first in the PowerEditor Trading Signal document will be filled first, and if
there are multiple signals in the Trading Strategy that place the same type of order, then
the orders from the signal that is listed first in the Signal tab of the TradeStation
StrategyBuilder is given priority (Figure 3-4). You can rearrange the Trading Signals
using the Move Up and Move Down buttons in the Signals tab.
Figure 3-4. Trading Signals in the TradeStation StrategyBuilder. You can move the signals up or down
to specify the order in which they are read by the engine.
120
The Trading Strategy Testing Engine
CHAPTER 3
Another example is when a Trading Strategy includes two Trading Signals to enter a long
position, Signal A and Signal B. Each will enter a position with different position sizes.
Assume that Signal A will open a position with 100 shares, and Signal B will open a
position with 500 shares. If both signals issue an order to buy on the same bar, whichever
signal is listed first in the TradeStation StrategyBuilder is filled, the second order is
ignored.
Note: It is possible to enable pyramiding for a Trading Strategy, in which case multiple
entries in the same direction can be filled. The rules used to process orders for Trading
Strategies that allow pyramiding are explained on page 124.
To summarize this rule: this bar on close orders are evaluated first, then next bar at
market orders. If there are multiple orders of the same type, then the orders that come
from the signal that is listed first in the TradeStation StrategyBuilder have a higher
priority. Furthermore, if there is more than one order of the same type in a Trading Signal,
the orders that appear first in the PowerEditor Trading Signal document are evaluated
first, and the rest are ignored (unless pyramiding is allowed).
As shown in Figure 3-5, if Signal A is listed first in the TradeStation StrategyBuilder then
Order A1 will be executed and the rest ignored; whereas if Signal B is listed first in the
TradeStation StrategyBuilder, then Order B1 will be filled.
Figure 3-5. Trading Strategy with multiple Trading Signals and orders.
Rule 2: Stop and Limit Orders
Once all market orders are evaluated, the Trading Strategy Testing Engine analyzes stop
and limit orders. If there are multiple stop or limit orders, the Trading Strategy Testing
Engine gives a higher priority to the order that is closest to the market (closest to the
current price).
This is done in order to simulate how stop and limit orders are actually filled. If a symbol
is trading at 950, and there are two limit orders to buy—one at 949 and one at 948—as
the market drops, the order to buy at 949 would be filled first, and the order to buy at 948
would be filled second. Therefore, the TradeStation Strategy Engine fills these orders in
that way, producing results are as realistic as possible.
As another example, assume there are three (or more) different orders to buy at a limit
price (e.g., buy 100 shares at 101 limit, buy 300 shares at 98 limit, and buy 500 shares at
95 limit). In this case, when pyramiding is disabled, TradeStation only displays the order
EasyLanguage for TradeStation
The Trading Strategy Testing Engine
121
to buy 100 shares at 101 limit, which is closest to the market. If pyramiding is enabled,
then all three orders are shown, and the orders that are closest to the market are filled first.
To summarize this rule: if the stop or limit orders are an “or higher” order, TradeStation
gives a higher priority when filling orders to the order with the lowest price target. If the
stop or limit orders are “or lower,” TradeStation gives a higher priority when filling
orders to the highest price target.
Advanced Tips: ‘Acceptable Orders’
Although many brokers will not accept buy stop or sell limit orders below the market or
buy limit or sell stop orders above the market, TradeStation will accept these orders and
fill them on the next bar at the first available price, which will usually be the open of the
bar. For example, if the market is trading at 950 and the Trading Strategy places an order
to buy at 1,000 limit, TradeStation will fill this order during the next bar at the first price
under 1,000, which will probably be the open of the next bar.
Determining the Number of Shares when Opening Positions
When formatting Trading Strategies under the Costs tab (Figure 3-6) there is an option
to specify the default number of shares (or contracts) that the Trading Strategy will use
when opening a position. This number is used unless the Trading Strategy’s buy or sell
order specifies the number of shares/contracts to buy, sell or close out (as discussed in
the section, “Trading Verbs” on page 131). When the order specifies the number of
shares/contracts, it will override the setting in the Costs tab.
Figure 3-6. Format Strategy - Costs tab
122
The Trading Strategy Testing Engine
CHAPTER 3
Once it has determined the number of contracts/shares, the Trading Strategy Testing Engine will look at the setting under the Properties tab labeled Entry Settings: Maximum
Number of contracts/shares per position (shown in Figure 3-7). If necessary, the number
of contracts/shares of any orders are adjusted so that the total number of contracts/shares in
an open position does not exceed the number specified in this option.
If there is no open position, and a Trading Strategy places an order to buy 5,500 shares, and
the number entered under the Properties tab is 5,000, the Trading Strategy Testing Engine
will reduce the number of shares to 5,000.
Also, assuming the same maximum limit, if the Trading Strategy allows for pyramiding,
and there are 1,000 shares in the open position, and the Trading Strategy places an order to
buy 5,500 shares, the Trading Strategy Testing Engine will modify the order to 4,000
shares.
In summary, to determine how many contracts/shares the order will include, we need to
find the lowest of the two numbers:
Maximum contracts/shares per position (minus the current shares/contracts held)
as specified in the Properties tab
Number of contracts/shares requested by the order
The Maximum contracts/shares per position option enables you to set a global limit to
the number of contracts/shares traded by a Trading Strategy. This allows you to vary the
limit depending on the symbol you are trading without having to modify the Trading Signal(s) within the Trading Strategy.
Limiting the Number of Open Entries per Position
When you enable pyramiding, it is possible for a Trading Strategy to buy (or sell short) a
number of consecutive times (increasing the size of the position). You can specify the maximum number of times the Trading Strategy can buy (or sell short) without closing any of
the open entries. You set this in the Entry Settings section of the Format Strategy dialog
box, as shown in Figure 3-7.
The Maximum open entries per position option enables you to force the Trading Strategy to ignore any new orders to add to the current position once the Trading Strategy has
EasyLanguage for TradeStation
The Trading Strategy Testing Engine
123
already bought (or sold short) a specified number of consecutive times in a single position.
Figure 3-7. Format Strategy - Properties tab.
Stand-by Orders
Stand-by orders are orders that are generated by the Trading Strategy that are not active.
They remain on stand-by for the duration of the bar on which they were placed until either
the bar is closed and the order is discarded, or conditions change during the bar such that
the order is made active.
For example, assume you have applied a Trading Strategy to a daily chart, the bar being
evaluated is a Monday, and your current position is flat (neither long nor short). At this
point, the Trading Strategy places an order to exit a long position on the next bar at the
low or anything lower. Since you are not currently in a long position, TradeStation
generates this order and places it on stand-by. You are not informed that this order has
been generated, it is invisible to you.
Now, assume that subsequently, an order to buy is placed for the next bar. During the
next bar (the Tuesday bar), the entry order is filled (and now your position is long). At
that point, the status of the exit order changes from stand by to active (and is listed on
the Active Orders tab of the Tracking Center window). Conditions changed such that
the order was made active. However, if no long position had been established during
the Tuesday bar, the exit order would have been discarded.
This stand-by feature enables you to place protective stops on the bar of entry; the order
is placed on stand-by only until the close of the bar on which it is placed. Following is
a list of scenarios under which orders are placed on stand-by:
124
The Trading Strategy Testing Engine
CHAPTER 3
General Scenarios:
• If the Trading Strategy is not in a long position, all exit orders for long positions
are placed in stand-by.
• If an exit order for a long position is tied to a specific entry, and the current long
position was not initiated by the entry to which the exit is tied, the exit order is
placed in stand-by.
• If the Trading Strategy is not in a short position, all exit orders for short positions
are placed in stand-by.
• If an exit order for a short position is tied to a specific entry, and the current short
position was not initiated by the entry to which the exit is tied, the exit order is
placed in stand-by.
• If there are multiple or higher exit orders, the Trading Strategy traverses the orders, starting from the order with the lowest price, and adds the number of shares/
contracts in each exit order. Any orders above and beyond the number of outstanding shares/contracts are placed in stand-by.
• If there are multiple or lower exit orders, the Trading Strategy traverses the orders,
starting from the order with the highest price, and adds the shares/contracts that
each order is covering. Any orders above and beyond the number of outstanding
shares/contracts are placed in stand-by.
No Pyramiding:
• All cases already described under ‘General Scenarios’.
• If the Trading Strategy is already in a long position, any additional stop or limit
buy orders are placed on stand-by.
• If the Trading Strategy is in a short position, any additional stop or limit sell orders
are placed on stand-by.
• If the Trading Strategy is in a long or short position, and there is more than one or
higher exit order, all exit orders except the one with the lowest target price are
placed on stand-by.
• If the Trading Strategy is in a long or short position, and there is more than one or
lower exit order, all exit orders except the one with the highest target price will be
placed on stand-by.
• If there are multiple or higher or or lower entry orders while the Trading Strategy
is not in a long or short position, all orders except the order that is closest to the
market will be placed on stand-by.
Pyramiding - Allow Multiple Orders in Same Direction by Same and Different Entry
Orders:
• All cases already described under ‘General Scenarios’.
• If the Trading Strategy has more than one or higher entry orders, it will consider
the lower orders first, and if the combined orders reach the maximum number of
shares/contracts allowed by the Trading Strategy, then all additional higher entry
orders will be placed on stand-by.
• If the Trading Strategy has more than one or lower entry orders, it will consider
the highest orders first, and if the combined orders reach the maximum number of
shares/contracts allowed by the Trading Strategy, then all additional higher entry
orders will be placed on stand-by.
Pyramiding - Allow Multiple Orders in Same Direction by Different Entry Orders:
EasyLanguage for TradeStation
The Trading Strategy Testing Engine
•
•
125
All cases already described under ‘General Scenarios’.
If a Trading Strategy is in a long or short position, and a new order is generated
by the same entry signal that opened the position, then the order is placed on standby.
Canceling Orders
As a general rule, all stop and limit orders are canceled at the close of the bar. For
example, if a trading strategy is applied to a daily price chart, and a buy limit order is
placed on Monday, then the order is active throughout the Tuesday bar. This limit order
is canceled at the close of the session on Tuesday if the target price of the limit order
is not met by the market. This applies to intra-day charts as well.
Note that we use the word bar instead of day. This implies that if you apply a trading
strategy to a 30-minute bar, and the trading strategy places a buy limit order at 10am,
the order is active from 10am to 10:30am (or the duration of the bar) and canceled if
the order is not filled at the close of the bar.
There is one exception to this rule, and that is when a trading strategy places the exact
same order for two or more consecutive bars. In this case, TradeStation will not cancel
an order to replace it with an exact duplicate. Instead, it leaves the order active until it
is filled, or the order is not placed (or it is changed in some way).
For example, let’s assume that the trading strategy we apply to a daily chart places an
order to buy 100 shares at 50 limit on Monday. This order remains active through
Tuesday, and is canceled at the end of the trading session on Tuesday unless the trading
strategy places another order to buy 100 shares at 50 limit during the Tuesday bar. If
any element of the order changes, such as the number of shares, the price, etc., the order
is canceled, and a new active order is placed.
When you work with intra-day charts, you can write day-only orders (orders that are
canceled at the end of the day) by having the trading strategy place the exact same order
repeatedly throughout the day once it finds its entry point.
Stop and limit orders are canceled at the close of the bar when:
The order was not placed on this bar by the trading strategy
The order was placed but either the number of shares or the target price changed
from last bar
A different trading signal generated the order in the current bar
A different trading signal with a higher/lower target price was placed at a price
closer to the market (then the order is placed in stand-by mode)
Backtesting
During backtesting, TradeStation reviews all the historical data and derives the historical
results for the Trading Strategy applied to the price chart.
126
The Trading Strategy Testing Engine
CHAPTER 3
Strategy Testing Data Resolution
The finer the data resolution that the strategy can analyze, the more accurate the Trading
Strategy results are when comparing real-time results to backtested results. In real time,
stop and limit orders are monitored for possible fill prices on every tick received from your
datafeed; therefore, when your Trading Strategy includes stop and/or limit orders, to
achieve the same results when backtesting your Trading Strategy, it is necessary to have all
the historical tick data available.
A bar has four prices: the open, high, low, and close. By reading these four values, the only
certain fact is that the first and last prices traded correspond to the values of the open and
close, respectively. The order in which the market reached the high and low, and how much
the market oscillated when building the bar cannot be inferred from these four prices.
Therefore, when the tick data is not available, TradeStation must make assumptions about
how the market moved ‘inside the bar.’
As shown in Figure 3-8, when formatting a Trading Strategy, the Properties tab includes
a section labeled Backtesting Settings that contains the option Strategy testing
resolution. This option enables you to specify the data resolution to use when backtesting
your Trading Strategies. If you don’t specify an option, the data resolution of the price
chart to which the Trading Strategy is applied is used.
Figure 3-8. Format Strategy - Properties tab.
When you set this option to test to the tick level (assuming that the data is available), the
Trading Strategy Testing Engine behaves the same way for backtesting as it would for
automation (real-time trading).
EasyLanguage for TradeStation
The Trading Strategy Testing Engine
127
However, many times, it is not be feasible to have all the tick data necessary for
extensive back testing. In these cases, TradeStation evaluates as much tick data as is
available, and uses bar assumptions for the rest of the data.
Also, due to performance considerations (memory and speed), it may not be convenient
or necessary to backtest on every tick, but to backtest using a fine resolution instead.
For example, if a test is performed across 5,000 daily bars, the Trading Strategy can
look at 10-minute bars to find the fill prices instead of every tick, since 5,000 days of
tick data is an enormous amount of data to load and use on a price chart. In this case,
TradeStation will apply the bar assumptions to each 10-minute bar, looking for fill
prices for the stop and/or limit orders placed by the Trading Strategy. This significantly
improves the accuracy of the results (over using daily data to backtest) but reduces
considerably the resource requirements when compared to testing the Trading Strategy
on a one tick resolution.
On the other hand, if a Trading Strategy only places orders at the close of the current
bar or on the next bar at market, it is not necessary to backtest using a fine resolution
because these prices are always known.
Remember, from the four prices every bar has, we know at which price the bar opened
and at which price the bar closed, so if a Trading Strategy includes an order to buy at
the open of the next bar, this price will not be any different historically than in real
time. Examining the ticks that compose a bar reveals no additional information about
the open or closing prices of the bar. Therefore, enabling the backtesting resolution
setting for Trading Strategies containing only these types of orders does not increase
the backtesting accuracy of the Trading Strategy.
Bar Assumptions
When tick data is not available, TradeStation makes certain assumptions about how each
price bar was formed. These bar assumptions apply only when the Trading Strategy uses
stop and/or limit orders; they do not apply when it includes only on close or at market orders, as described in the section above.
After extensive research, a few rules were established to describe the ‘normal’
behavior of bars. The Trading Strategy Testing Engine follows these rules in an attempt
to simulate the market activity when there is not sufficient data available. However,
these are market assumptions designed to improve the accuracy of the testing when
there is not enough data available, and historical results will not always match realtime results. The assumptions are:
1.
The market traded at every valid price throughout the range of the bar.
2.
If the open price is nearer to the low than to the high (i.e., the open is in the
bottom half of the bar), the intra-bar movement is assumed to be Open -> Low
-> High -> Close, chronologically (see Figure 3-9).
3.
If the open price is in the upper half of the bar (i.e., nearer to the high than the
low), the intra-bar movement is assumed to Open -> High -> Low -> Close,
chronologically (see Figure 3-9).
128
The Trading Strategy Testing Engine
CHAPTER 3
The first assumption implies that the fill prices of stop and limit orders during backtesting
may not be exactly the same as the results obtained while trading real time. Stop and limit
orders are interpreted as the first price available over or under a a certain level; if you place
a buy stop order at 100, and the market trades at 99.875, and then the next trade jumps in
price to 100.5, the real-time order is filled at 100.5, but if the backtest is performed and the
tick data is not available to the Trading Strategy, TradeStation will have no way of knowing
that the market jumped in price, so the order is filled at 100.
Figure 3-9. Intra-bar movement assumption
The second and third assumptions are important only when there are multiple active orders
in one bar. If a Trading Strategy places both a stop loss and a profit target order, and both
prices are reached during one particular bar, the behavior of the market inside that bar determines if the trade is a winner or a loser.
For instance, if the market dropped, reached the low, and then rallied to the high, the stop
loss was hit first and the trade lost money. However, if the high is reached first, the profit
target makes the trade a winner. Without the tick data available, there is no certain way to
determine how the market moved during the bar. The assumptions may or may not be correct.
Keep in mind however, that by law of averages, if a backtest includes sufficient incidents
of these scenarios, and they are resolved in a consistent fashion, the errors in favor and
against tend to offset each other.
Bouncing Ticks
The markets do not move in straight lines, and they tend to oscillate even when in a strong
trend. In fact, the market will rarely, if ever, move in the straight line as assumed by the
second and third market assumptions explained in the previous section. Even within a
bar, the market will usually oscillate as it reaches the highs and lows, and its movement
will generally more closely resemble the illustration in Figure 3-10 than a straight line.
EasyLanguage for TradeStation
The Trading Strategy Testing Engine
129
To simulate this behavior, the Trading Strategy Testing Engine uses a technique called
‘bouncing ticks’ that simulates market oscillations whenever stop or limit orders are
filled.
Figure 3-10. Normal intra-bar price movement
The method by which TradeStation’s Strategy Testing Engine simulates this market
activity is by bouncing the assumed price a certain percentage of the bar’s range (10% by
default) in the opposite direction of any filled stop or limit order.
For example, if the range of the bar is 10 points, and a buy stop order is filled,
TradeStation looks down the bar as far as 1 point under the entry price of the buy stop
order looking for other orders to fill before continuing with the bar assumptions (Figure
3-11). If the stop or limit order filled is read as an or higher order, the Trading Strategy
Testing Engine bounces the tick down, if the order is read as an or lower order, it bounces
the tick up.
Figure 3-11. Bouncing tick
Bouncing ticks affect Trading Strategy results in a very minor way, and only when the
Trading Strategy includes multiple stop and limit orders that are placed very close to each
other.
Let’s look an example of how bouncing ticks can affect your Trading Strategy results.
130
The Trading Strategy Testing Engine
CHAPTER 3
Suppose there are three orders active for a particular bar: a buy stop order at 100, a sell
short stop order at 99.125, and an ExitLong limit order at 103. The market opens at 99.5,
goes up to 105, falls to 90, and finally closes at 92. What trades took place, and what is
the your market position at the close of the bar?
If bouncing ticks is not enabled (set to 0%), the buy stop order is filled first, followed by
the ExitLong limit order, resulting in a profit, and then the sell short order is filled,
leaving you in a short position at the close of the bar.
If bouncing ticks is set to 10%, the buy stop order is filled, then TradeStation bounces the
price 10% lower, hitting the sell stop (this exits you from the long position with a loss
and establishes a short position), and bounces the price again, this time upwards. At this
point, since there are no valid orders left (the ExitLong order is ignored since you are in
a short position), TradeStation finishes traversing the bar normally, and leaves you in a
short position. This example is illustrated in Figure 3-12.
Figure 3-12. Bouncing tick example
With this technique, TradeStation introduces several oscillations into the intra-bar movement without having the underlying tick data. This particular example showed how the
bouncing tick technique can turn a winning trade to a losing trade; however, it can just as
easily turn a losing trade into a winning trade. Again, if a backtest includes sufficient incidents of these scenarios, and they are resolved in a consistent fashion, the errors in favor
and against tend to offset each other.
It is very important to remember that this technique is designed to simulate market activity,
but it is only a simulation. Actual market movement may differ significantly from this simulation, and produce differences in the TradeStation Strategy Performance Report results.
EasyLanguage for TradeStation
Trading Verbs
131
Trading Verbs
Using the four trading verbs, you can simulate a wide variety of trading ideas and order
types. This section describes the four trading verbs—Buy, Sell, ExitLong, and
ExitShort—in detail.
Buy
This trading verb is used to open a long position (it covers your short positions and
opens a long position). The specifics of the order are defined by the optional
parameters used in the statement (i.e., number of shares, at what price, etc.).
Syntax:
Buy [(“Order Name”)] [Number of Shares] [Execution Method];
Only the word Buy is required to open a long position. The following is a complete EasyLanguage statement:
Buy ;
When the parameters are not specified, the default values used for this statement are:
Buy (“Buy”) This Bar on Close ;
The above order uses the default number of shares/contracts specified by the Trading Strategy in the Costs tab when formatting the strategy.
Each portion of the statement, Order Name, Number of Shares, and Execution Method is
described next.
Order Name
If your Trading Signal or your Trading Strategy includes multiple long entries, it is helpful
to label each entry order with a different name. By naming entry orders, you can easily
identify all positions, both on the chart and in the TradeStation Strategy Performance Report. Also, naming the entry orders allows you to tie an exit to a particular entry order (for
information on doing this, refer to the discussion of the trading verb ExitLong on 136).
To name a long entry order, include a descriptive name in quotation marks and within parenthesis after the trading verb Buy. For example:
Buy (“My Entry”);
This instruction initiates a long position named My Entry. Again, when a Trading Signal or
Strategy that contains this statement is applied to a price chart, the order name (also referred
to as signal name) is displayed on the chart under the onscreen arrows that correspond to
132
Trading Verbs
CHAPTER 3
this statement, and in the TradeStation Strategy Performance Report under the Trade by
Trade tab (Figure 3-13).
Figure 3-13. Naming Trading Signals
Number of Shares/Contracts
To specify how many shares (or contracts) to open the long position with, place a
numeric expression followed by the words shares (or contracts) after the trading verb
Buy (and entry order name if used). Some examples:
Buy (“My Entry”) 100 Shares;
Buy 5 Contracts;
Buy Value1 Shares;
Note: The words shares and contracts are synonymous.
If the number of shares/contracts is not specified, the value entered under the Costs tab of
the Format Strategy dialog box is used. The Costs tab contains a section that controls the
default trade amount; this can be set to either a fixed unit or dollars per transaction. Whatever is specified in this dialog box is used by the Trading Strategy Engine only if the Buy
statement does not specify the number of shares/contracts with which to open the position.
Execution Method
You can use four different execution methods with the Buy trading verb:
... this bar on close
... next bar at market
EasyLanguage for TradeStation
Trading Verbs
133
... next bar at price Stop
... next bar at price Limit
The execution method this bar on close is provided for backtesting purposes only; it enables you to backtest ‘market at close’ orders, which you cannot automate using
TradeStation. Given that all orders are evaluated and executed at the end of each bar,
TradeStation reads and issues the this bar on close order once the bar has closed (e.g., once
the daily trading session has ended). TradeStation fills the order using the close of the current bar, but you must place an order at market for execution on the next bar. This invariably
introduces slippage.
The execution method next bar at price limit instructs TradeStation to buy at the first opportunity at the specified price or lower. The execution method next bar at price stop instructs TradeStation to buy at the first opportunity at the specified price or higher.
Stop and limit orders are filled as market if touched (MIT) orders. A MIT order becomes a
market order when the price of the symbol meets the specified order price. It is possible for
stop and limit orders not to be filled (i.e., price never met); in this case, the orders are canceled at the close of the bar.
Typically, traders use next bar at market and this bar on close execution methods when the
exact entry price is not crucial to their trading strategy and they expect a large upward
move.
Traders use buy limit orders when attempting to enter long positions at lower prices, when
working with support levels, or when attempting to establish a position at a bottom. And,
conversely, they use buy stop orders when searching for volatility or price break outs, or
when looking to ride momentum. Again, these are the common usages of these types of orders; they are flexible enough to be used in many different ways.
Examples
The following statement buys 100 contracts/shares at the closing price of the bar:
Buy 100 Shares This Bar on Close;
The following statement buys the default number of contracts/shares specified in the Costs
tab at the open of the next bar, and names this entry order Entry#1:
Buy (“Entry#1”) Next Bar at Market;
The next statement places an order to buy 5 contracts at the high of the current bar plus the
range of the current bar, or any price higher. Note that Range is a function that returns the
high minus the low. This order remains active throughout the next bar (until filled or canceled):
Buy 5 Contracts Next Bar at High + Range Stop;
The next statement places an order to buy 100 shares at the lowest low of the last 10 bars,
or any price lower. This order remains active throughout the next bar (until filled or canceled), and the order is named LowBuy:
Buy (“LowBuy”) 100 Shares Next Bar at Lowest(Low,10) Limit ;
134
Trading Verbs
CHAPTER 3
Sell
This trading verb is used to open a short position (it closes your long position and opens
a short one). The specifics of the order are defined by the optional parameters used in
the statement (i.e., number of shares, at what price, etc.).
Syntax:
Sell [(“Order Name”)] [Number of Shares] [Execution Method] ;
Only the word Sell is required to open a short position. The following is a complete EasyLanguage statement:
Sell ;
When the parameters are not specified, the default values used for this statement are:
Sell (“Sell”) This Bar on Close;
The above order uses the default number of shares/contracts specified by the Trading Strategy in the Costs tab when formatting the strategy.
Each portion of the statement, Order Name, Number of Shares, and Execution Method is
described next.
Order Name
If your Trading Signal or your Trading Strategy includes multiple short entries, it is helpful
to label each entry order with a different name. By naming entry orders, you can easily
identify all positions both on the chart and in the TradeStation Strategy Performance Report. Also, naming the entry orders allows you to tie an exit to a particular entry order (for
information on doing this, refer to the discussion of the trading verb ExitShort on page 141).
To name a short entry order, include a descriptive name in quotation marks and within parenthesis after the trading verb Sell. For example:
Sell (“My Entry”);
This instruction initiates a short position named My Entry. Again, when a Trading Signal
or Strategy that contains this statement is applied to a price chart, the order name (also referred to as signal name) is displayed on the chart over the onscreen arrows that correspond
to this statement, and in the TradeStation Strategy Performance Report under the Trade by
Trade tab (see Figure 3-13, “Naming Trading Signals,” on page 132).
Number of Shares/Contracts
To specify how many shares (or contracts) to open the short position with, place a
numeric expression followed by the words shares (or contracts) after the trading verb
Sell (and entry order name if used). Some examples:
Sell (“My Entry”) 100 Shares;
Sell 5 Contracts;
EasyLanguage for TradeStation
Trading Verbs
135
Sell Value1 Shares;
Note: The words shares and contracts are synonymous.
If the number of shares/contracts is not specified, the value entered under the Costs tab of
the Format Strategy dialog box is used. The Costs tab contains a section that controls the
default trade amount; this can be set to either a fixed unit or dollars per transaction. Whatever is specified in this dialog box is used by the Trading Strategy Engine only if the Sell
statement does not specify the number of shares/contracts with which to open the position.
Execution Method
You can use four different execution methods with the trading verb Sell:
... this bar on close;
... next bar at market;
... next bar at price Stop;
... next bar at price Limit;
The execution method this bar on close is provided for backtesting purposes only; it enables you to backtest ‘market at close’ orders, which you cannot automate using
TradeStation. Given that all orders are read and executed at the end of each bar,
TradeStation evaluates and issues the this bar on close order once the bar has closed (e.g.,
once the daily trading session has ended). TradeStation fills the order using the close of the
current bar, but you have to place an order at market to be executed on the next bar. This
invariably introduces slippage.
An order to Sell next bar at price Limit instructs TradeStation to sell at the first opportunity
at the specified price or higher. A Sell next bar at price Stop order instructs TradeStation to
sell at the first opportunity at the specified price or lower. Stop and limit orders are filled
as market if touched (MIT) orders. A MIT order becomes a market order when the price of
the traded symbol meets the specified order price. It is possible for stop and limit orders not
to be filled (i.e., price never met); in this case, the orders are canceled at the close of the bar.
As a general guideline, traders use market and at the close orders when the exact entry price
is not critical to the trading strategy and a large downward move is expected. They use Sell
limit orders when attempting to enter short positions at higher prices, when working with
resistance levels, or when attempting to sell short at a top. And conversely, they use Sell
stop orders whenever searching for volatility or price ‘break unders’, or when looking to
ride negative momentum. Again, these are the common usages of these types of orders;
they are flexible enough to be used in many different ways.
Examples
The following statement sells 100 contracts/shares at the closing price of the current bar:
Sell 100 Shares This Bar on Close;
136
Trading Verbs
CHAPTER 3
This statement sells the default number of contracts/shares specified in the Costs tab of the
Format dialog box at the open of the next bar, and names this order Entry#2:
Sell (“Entry#2”) Next Bar at Market;
The following statement places an order to sell 5 contracts at the low of the current bar minus the range of the current bar, or any price lower. Note that Range is an EasyLanguage
function that returns the high minus the low of the current bar. This order remains active
throughout the next bar (until filled or canceled).
Sell 5 Contracts Next Bar at Low - Range Stop;
The following statement places an order to sell 100 shares at the highest high of the last
10 bars, or any price higher. This order remains active throughout the next bar (until
filled or canceled) and is named HighSell:
Sell (“HighSell”) 100 Shares Next Bar at Highest(High,10) Limit;
ExitLong
This trading verb is used to close a long position. The specifics of the order are defined
by the optional components used in the statement (i.e., how many shares/contracts, at
what price, etc.).
Exit orders do not pyramid. Once the exit criteria is met and the exit order filled, the
order is ignored for that position until the position is modified (i.e., more shares/
contracts are bought or a new long position is established).
Syntax:
ExitLong [(“Order Name”)] [from entry (“Entry Name”)] [ Number of
Shares [Total]] [Execution Method];
Only the word ExitLong is required to exit a long position. For example:
ExitLong ;
The default values used for the rest of the expression when they are not specified are:
ExitLong (“LX”) This Bar on Close;
The above statement exits all long positions.
Each portion of the statement, Order Name, Number of Shares, and Execution Method
is described next.
Order Name
If your Trading Signal or Trading Strategy includes multiple exits, it is helpful to label
each one with a different name. As shown in Figure 3-13, this enables you to identify
these exit orders in both the price chart and the TradeStation Strategy Performance
Report. The order name is included in both these windows.
EasyLanguage for TradeStation
Trading Verbs
137
To assign an exit order a name, specify a name in quotation marks and within parentheses
immediately after the word ExitLong. For example:
ExitLong (“My Exit”);
This instruction closes the entire long position, and the order is labeled My Exit.
Tying an Exit to an Entry
It is possible to tie an exit instruction to a specific entry. This can be achieved only if you
named the long entry, and the long entry is in the same Trading Signal as the exit order.
Consider the following Trading Signal:
Buy (“MyBuy”) 10 Shares Next Bar at Market;
Buy 20 Shares Next Bar at High + 1 Point Stop ;
ExitLong From Entry (“MyBuy”) Next Bar at High + 3 Points Stop;
In the above example, the Trading Signal buys 30 shares total; your long position is 30
shares. However, the ExitLong instruction only closes out the 10 shares bought using the
MyBuy entry order. It ignores any other order, and does not close out the other 20 shares.
Therefore, this signal leaves you long 20 shares.
You can also close padrt of an entry order. For example, if your entry, which you named
“MyBuy” buys 10 shares, you can specify that you want to exit from entry “MyBuy” but
only close out 5 shares, not the entire 10:
Exitlong From Entry (“MyBuy”) 5 Shares Next Bar at High + 3
Points Stop;
Important: The entry name is case sensitive. Be sure to use consistent capitalization.
Also, it is important to remember that exit orders do not pyramid; therefore, if an exit
does not close out a position, you will need another exit order (or buy/sell order) in
order to close out the position.
Number of Shares/Contracts
To specify how many shares (or contracts) to close, place a numeric expression followed
by the word shares or contracts after the trading verb ExitLong. Some examples:
ExitLong 100 Shares;
ExitLong From Entry (“MovAvg”) 10 Shares Next Bar at High + 1
Point Stop ;
Note: The words shares and contracts are synonymous.
138
Trading Verbs
CHAPTER 3
If you do not specify the number of shares or contracts in the ExitLong instruction, the
exit order closes out the entire long position, rendering your position flat.
When you specify the number of shares/contracts, the ExitLong instruction exits the
specified number of shares/contracts from every open entry.
Therefore, if the Trading Strategy allows for pyramiding, and has bought 500 shares
twice (for a total of 1,000 shares), and an order to ExitLong 100 shares is placed by the
Trading Strategy, the instruction will exit a total of 200 shares: 100 shares from each of
the two entries. Figure 3-14 illustrates this example. After buying a total of 1,000 shares
(500 at two different entry points), the order based on the instruction Exitlong 100 shares
next bar at market exits a total of 200 shares, 100 from each entry, leaving you in a long
position consisting of 800 shares. The onscreen cues in Figure 3-14 show you how many
shares you hold in your current position.
Figure 3-14. The instruction ‘ExitLong 100 shares next bar at market’ exits 100 shares out of each open entry.
However, if you want to exit a total of 100 shares, you can use the word Total in the
ExitLong instruction. Using the word Total instructs the Trading Strategy to exit 100
shares from the first open entry (first in, first out). This example is illustrated in Figure
3-15.
EasyLanguage for TradeStation
Trading Verbs
139
Figure 3-15. The instruction ‘ExitLong 100 shares total next bar at market’ exits 100 shares out of the oldest open entr(ies).
Execution Method
You can use four different execution methods with the trading verb ExitLong:
... this bar on close
... next bar at market
... next bar at price Stop
... next bar at price Limit
The execution method this bar on close is provided for backtesting purposes only; it enables you to backtest ‘market at close’ orders, which you use with TradeStation when trading on a real-time/delayed basis. Given that all orders are read and executed at the end of
each bar, TradeStation evaluates and issues the this bar on close order once the bar has
closed (e.g., once the daily trading session has ended). TradeStation fills the order using the
close of the current bar, but you have to place an order at market to be executed on the next
bar. This invariably introduces slippage.
An order to ExitLong at price Limit instructs TradeStation to exit a long position at the first
opportunity at the specified price or higher. An ExitLong at price Stop instructs
TradeStation to exit a long position at the first opportunity at the specified price or lower.
Stop and limit orders are treated by TradeStation as market if touched (MIT) orders. It is
possible for stop and limit orders not to be filled (i.e., price never reached); in this case, the
orders are canceled at the close of the bar.
As a general guideline, traders use market and close orders when the exact entry price is
not critical to their trading strategy after a large move occurred. They use limit orders when
they are attempting to exit long positions at higher prices, to exit at resistance levels, or to
140
Trading Verbs
CHAPTER 3
exit at a top. And finally, they generally use stop orders whenever looking to stop losses,
or to place trailing stops. Again, these are common usage for the different type of orders;
they are flexible enough to be used in many different ways.
Tying the Exit Price to the Bar of Entry
When specifying the execution method, you can vary stop and limit orders by using ‘At$’
instead of ‘at’. Using At$ forces the Trading Signal to refer to the value the numerical expression Price had on the bar where the entry order was generated. Consider the following
statement:
ExitLong From Entry (“MyBuy”) Next Bar At$ Low - 1 Point Stop;
The above statement places an order to exit the long position at one point lower than the
low of the bar where the order to establish the long position was generated (e.g., if an order
to buy next bar... is generated today, the prices referenced will be today’s, not tomorrow’s.
Even though the order was placed and filled tomorrow, it was generated today, and that is
the bar referenced).
To use the At$ reserved word, you must name the entry order, and the ExitLong instruction
must refer to the specific entry order.
As another example, if the maximum risk you will tolerate for a position is 5 points under
the closing price of the bar on which you generated the entry order, you can use the following statement:
ExitLong From Entry (“MyBuy”) Next Bar At$ Close - 5 Points
Stop;
This is a valuable technique that allows you to refer easily to the prices of the bar on which
the entry order was generated.
Examples
This statement exits all contracts/shares of your open long position at the close of the
current bar. Your position will be flat.
ExitLong This Bar on Close;
The next instruction exits all contracts/shares of your positions opened by the entry order
Entry#1 at the open of the next bar, and the exit order is named LongExit.
ExitLong (“LongExit”) From Entry (“Entry#1”) Next Bar at Market;
The following statement places an order to close 5 contracts/shares in total at the low of the
current bar minus 1 point or anything lower. This order is active throughout the next bar
(until filled or canceled):
ExitLong 5 Contracts Total Next Bar at Low - 1 Point Stop;
The next instruction places an order to exit 100 shares from every entry at the high plus
the range of the current bar or anything higher. This order is active throughout the next
bar (until filled or canceled) and will be named HighExit.
ExitLong (“HighExit”) 100 Shares Next Bar at High + Range Limit;
EasyLanguage for TradeStation
Trading Verbs
141
The following statement allows you to monitor your risk by placing an exit order 5 points
below the closing price of the bar that generated the long entry order:
ExitLong From Entry (“MyBuy”) Next Bar At$ Close - 5 Points
Stop;
ExitShort
This trading verb is used to cover a short position. The specifics of the order are defined
by the optional components used in the statement (i.e., how many shares/contracts, at
what price, etc.).
Exit orders do not pyramid. Once the exit criteria is met and the exit order filled, the
order is ignored for that position until the position is modified (i.e., more shares/
contracts are sold or a new short position is established).
Syntax:
ExitShort [(“Order Name”)] [from entry (“Entry Name”)] [Number of
Shares [Total]] [Execution Method] ;
Only the word ExitShort is required to exit a short position. For example:
ExitShort ;
The default values used for the rest of the expression when they are not specified are:
ExitShort (“SX”) This Bar on Close ;
The above statement covers the entire short position.
Each portion of the statement, Order Name, Entry Name, Number of Shares, and Execution
Method is described next.
Order Name
If a Trading Strategy includes multiple exits, it is helpful to label each one with a
different name. As shown in Figure 3-13, this helps to identify these exit orders in both
the price chart and the TradeStation Strategy Performance Report.
To name an exit, specify a name in quotation marks and parentheses after the trading verb
ExitShort. For example:
ExitShort (“My Exit”);
This statement exits the short position in its entirety, and the order is named My Exit.
Tying an Exit to an Entry
It is possible to tie an exit instruction to a specific entry. This can be done only if you
name the short entry, and if the short entry is in the same Trading Signal as the exit. For
example:
142
Trading Verbs
CHAPTER 3
Sell (“MySell”);
ExitShort from Entry (“MySell”);
In the previous example, the ExitShort statement only acts upon entries established from
the entry named MySell and ignores entries by any other statements.
Important: The entry name is case sensitive. Be sure to use consistent capitalization.
Also, it is important to remember that exit orders do not pyramid; therefore, if an exit
does not close out a position, you will need another exit order (or buy/sell order) in
order to close out a position.
Number of Shares/Contracts
To specify how many shares/contracts to close out, use a numeric expression followed
by the word shares after the trading verb ExitShort. For example:
ExitShort 100 Shares;
or
ExitShort 5 Contracts;
Note: The words shares and contracts are synonymous.
If you do not specify the number of shares/contracts in the ExitShort instruction, the order
exits all shares/contracts, rendering your position flat.
If you do specify the number of shares/contracts, the ExitShort instruction exits the
determined number of shares/contracts out of every open entry. For example, if the
Trading Strategy allows for pyramiding, and has shorted 500 shares three times (for a
total of 1,500 shares), and an order to ExitShort 100 shares is placed, the exit order will
exit a total of 300 shares: 100 shares from each one of the three entries. Refer to the
discussion on the trading verb ExitLong on page 136 for an additional examples and
charts illustrating this feature.
However, if the purpose of the ExitShort statement is to exit a total of 100 shares, you
can use the reserved word Total in the ExitShort statement. Using the word Total causes
the Trading Strategy to exit 100 shares from the oldest open entry (first in, first out).
Execution Method
You can use four different execution methods with the trading verb ExitShort:
... this bar on close;
... next bar at market;
... next bar at price Stop;
... next bar at price Limit;
EasyLanguage for TradeStation
Trading Verbs
143
The execution method this bar on close is provided for backtesting purposes only; it enables you to backtest ‘market at close’ orders, which you use with TradeStation when trading on a real-time/delayed basis. Given that all orders are read and executed at the end of
each bar, TradeStation evaluates and issues the this bar on close order once the bar closes.
TradeStation fills the order using the close of the current bar, but you must place an order
at market to be executed on the next bar. This invariably introduces slippage.
An order to ExitShort at price Limit causes TradeStation to close a short position at the first
opportunity at the specified price or lower. An ExitShort at price stop order causes
TradeStation to close at the first opportunity at the specified price or higher. Stop and limit
orders are filled as market if touched (MIT) orders. A MIT order becomes a market order
when the price of the traded symbol reaches the specified target price. It is possible for stop
and limit orders not to be filled (i.e., price never reached); in this case, the orders are canceled at the close of the bar.
As a general guideline, traders use at market and on the close orders when the exact entry
price is not critical to their trading strategy, and after a large move occurred. They generally
use ExitShort limit orders when attempting to exit short positions at lower prices, at support
levels, or at a bottom. And finally, they use ExitShort stop orders whenever looking to stop
losses or place trailing stops. Again, this is the common usage for these type of orders; they
are flexible enough to be used in many different ways.
Tying the Exit Price to the Bar of Entry
When specifying the execution method, you can vary the stop and limit orders by using
‘At$’ instead of ‘at’. Using At$ forces the Trading Signal to refer to the value the numerical
expression Price had on the bar where the entry order was generated. Consider the following statement:
ExitShort From Entry (“MyBuy”) Next Bar At$ High + 1 Point Stop;
The statement places an order to exit the short position at one point higher than the high of
the bar where the specified short entry order was generated. For example, if an order to sell
next bar is generated today, the prices referenced will be today’s, not tomorrow’s. Even
though the order was placed and filled tomorrow, it was generated today and that is the bar
referenced.
To use the reserved word At$, you must name the entry order, and the ExitShort instruction
must refer to the name of the specific entry order.
As another example, if the maximum risk you will tolerate for a position is 5 points over
the closing price of the bar on which you generated the order to enter the market, you can
use the following expression:
ExitShort From Entry (“MySell”) Next Bar At$ Close + 5 Points
Stop;
This is a valuable technique that allows you to refer easily to the prices of the bar on which
the entry order was generated.
Examples
The next statement exits all contracts/shares of all open short entries at the close of the current bar:
144
Understanding Built-in Stops
CHAPTER 3
ExitShort This Bar on Close;
The following instruction exits all contracts/shares of any short entries opened by the entry
order Entry#1 at the open of the next bar, and this order is named ShortExit.
ExitShort (“ShortExit”) From Entry (“Entry#1”) Next Bar at
Market;
The next instruction places an order to close 5 contracts in total at the high of the current
bar plus 1 point or anything higher. This order is active throughout the next bar (until filled
or canceled):
ExitShort 5 Contracts Total Next Bar at High + 1 Point Stop;
The next instruction places an order to exit 100 shares out of every open entry at the low
minus the range of the current bar or anything lower. This order is active throughout the
next bar (until filled or canceled), and is named HighExit.
ExitShort (“HighExit”) 100 Shares Next Bar at Low - Range Limit;
The following statement enables you to monitor your risk by placing an exit order 5 points
over the closing price of the bar on which you generated the short entry order:
ExitShort From Entry (“MySell”) Next Bar At$ Close + 5 Points
Stop;
Understanding Built-in Stops
Stops are exit trading signals that are not market driven; they exit you from the market
based on your risk tolerance or desired profit. TradeStation provides six built-in stops
(trading signals) that are written using specific reserved words. The built-in stops are
unique because the reserved words they use are recalculated on every tick instead at
the completion of a bar. In other words, they are active on the bar of entry and updated
for every bar of a position on a tick-by-tick basis. All other EasyLanguage instructions
you write are calculated at the completion of a bar only.
This unique behavior is especially important to remember when using the trailing stop.
Once a built-in stop order is placed, the value of the trailing stop is recalculated on
every tick, and if necessary, the stop order is canceled and a new stop order is placed
before the completion of a bar. This means that a built-in stop order can be generated,
placed, and filled on the same bar using the prices from that bar.
For example, assume you apply a trading strategy that contains a built in trailing stop
to a daily chart (when collecting real-time/delayed data). The price at which the order
is placed is recalculated every tick. If the price for the order differs from the last
calculation (e.g., because the market made a new high), then the open order is canceled
and a new order is placed on the current bar, regardless of the status of the bar.
The drawback to using the built-in stops (or your own trading signals written with the
specific reserved words) is that since they are updated on every tick, the given stop
price may not be realistically attainable because of the tick by tick updating of the stop
EasyLanguage for TradeStation
Understanding Built-in Stops
145
price. In addition, the results of these stops (like any entry/exit trading signals) can be
affected by bar assumptions.
You can use the six built-in stops in your trading strategies, or you can use the specific
reserved words in your own exit trading signals. The eight specific reserved words are
listed next, along with a description of the corresponding trading signal.
SetBreakEven
This reserved word is used to place an order to exit the position or contract/share at the
breakeven point once the specified amount of profit is reached.
Syntax:
SetBreakEven(FloorAmnt)
Parameters:
FloorAmnt is the amount of profit to be reached before the exit order is placed.
Notes:
Use with SetStopContract or SetStopPosition.
Trading Signal:
Breakeven Stop-Floor — When the profit (for the position or per contract/share)
exceeds the breakeven floor, an exit order is generated. The exit order is a stop order
placed at the entry price (average entry price if multiple entries) plus the commission
specified in the Costs tab when formatting the strategy.
The profit on a position basis is calculated by subtracting any commissions specified
in the Costs tab from the overall position profit. The profit on a contract/share basis is
calculated by dividing the overall position profit by the number of contracts/shares and
then subtracting the commissions from the resulting value.
The Breakeven Stop-Floor trading signal only takes effect once a certain amount of
profit is reached, so in a given position, it may never take effect. Therefore, you should
not use it to limit losses.
SetExitOnClose
This reserved word is used to place an order to exit the position or contract/share at the
close of the current bar.
Syntax:
SetExitOnClose
Parameters:
None
Trading Signal:
Close at End of Day — The Close at End of Day trading signal has no inputs. It will
exit all open positions at the close of the day. It is particularly useful for day traders
who do not want to hold any positions overnight.
146
Understanding Built-in Stops
CHAPTER 3
SetDollarTrailing
This reserved word is used to specify the amount, based on the maximum open position
profit, you are willing to lose (in dollars). The position or contract/share is closed out
when the specified amount is lost.
Syntax:
SetDollarTrailing(DollarValue)
Parameters:
DollarValue is the amount of the maximum open profit that you are willing to lose.
Notes:
Use with SetStopContract or SetStopPosition.
Trading Signal:
Dllr Risk Trailing — The Dllr Risk Trailing trading signal allows you to indicate the
maximum amount of money you are willing to risk on a position, based on the
maximum open position profit. The maximum profit is calculated from the point of
entry using the highest high when long, or the lowest low when short. The dollar
amount of profit per contract or per position you are willing to risk is then subtracted,
and the trailing stop is placed at that point.
For example, assume that a dollar risk trailing stop is placed for $500. A protective stop
would be placed for the maximum profit minus $500. If the amount you are willing to
risk is greater than the maximum open position profit, this trailing stop does not take
effect.
Consequently, the Dllr Risk Trailing trading signal only locks in profits; it does not exit
a position if you have a loss on the trade. Therefore, you should not use it to limit
losses.
SetPercentTrailing
This reserved word is used to specify the amount of the maximum open position profit
you are willing to lose (as a percent) as well as the profit level that must be reached in
order for the stop to take effect. The position or contract/share is closed out when the
specified percentage of the maximum profit is lost.
Syntax:
SetPercentTrailing(FloorAmnt, Amount)
Parameters:
FloorAmnt is the amount of profit to be reached before the stop takes effect. Amount is
the percent of the profit you are willing to lose.
Notes:
Use with SetStopContract or SetStopPosition.
EasyLanguage for TradeStation
Understanding Built-in Stops
147
Trading Signal:
Percent Risk Trailing — The Percent Risk Trailing trading signal enables you to
indicate what percent of the maximum position profit you are willing to give back
before the position is automatically closed out. It also requires that you provide a
minimum profit level that must be reached by the position before the stop will take
effect.
The maximum profit is calculated from the point of entry using the highest high when
long or the lowest low when short. The percent of this amount per contract that you are
willing to risk is then subtracted, and the trailing stop is placed at that point.
For example, assume that a Percent Risk Trailing Stop is placed at 20% with a floor of
$500. Once profits exceed the floor value of $500, the stop will become active. The
stop is then placed for the maximum profit to date minus 20%.
If the maximum open position profit for the trade does not exceed the floor level, this
trailing stop does not take effect. Consequently, this stop only locks in profits, it does
not limit losses.
SetProfitTarget
This reserved word is used to specify the amount of profit you want to reach in order
to close out the position or per contract/share.
Syntax:
SetProfitTarget(DollarValue)
Parameters:
DollarValue is the amount of profit to reach in order to close the position (or exit from
the contracts/shares).
Notes:
Use with SetStopContract or SetStopPosition.
Trading Signal:
Profit Target — The Profit Target trading signal enables you to set a profit target (in
dollars per contract/share or per position) at which your position is automatically
closed out. If that profit level is never reached, the stop will not take effect. This stop
locks in profits, it does not limit losses.
SetStopLoss
This reserved word is used to specify the amount you are willing to lose per position
or per contract/share.
Syntax:
SetStopLoss(DollarValue)
Parameters:
DollarValue is the amount you are willing to lose per position or per contract/share.
Notes:
Use with SetStopContract or SetStopPosition.
148
Writing Indicators and Studies
CHAPTER 3
Trading Signal:
Stop Loss
The Stop Loss trading signal enables you to specify the maximum amount of money
you are willing to risk on any position, or on any one contract/share.
For example, if you specify a per position stop loss of $500 on your S&P 500 Futures
contracts, TradeStation automatically exits the entire position when losses on the
position reach $500. If on S&P 500 Futures, you specify a per contract stop loss of
$500, TradeStation automatically exits the position when losses for any contract reach
$500.
A Stop Loss trading signal should never be used as the only exit your trading strategy
is using as it requires the position to lose money in order to exit the trade.
For example, if the market goes in your favor, and you achieve a great deal of profit,
you would have to lose all of that profit, plus the amount you specify as the stop loss
value before the trading strategy would issue an order liquidating the contract/share or
position.
SetStopContract
This reserved word forces the stop that is used to be evaluated per contract/share. If
neither SetStopContract or SetStopPosition is used, the stop is evaluated on a position
basis.
SetStopPosition
This reserved word forces the stop that is used to be evaluated on a position basis. If
neither SetStopContract or SetStopPosition is used, the stop is evaluated on a position
basis.
Writing Indicators and Studies
Indicators and studies display information on a price chart. The most common definition
of an indicator is a mathematical formula that returns a number for every bar on a chart,
with its resulting value displayed as a line, histogram, or series of points.
Studies are much like indicators, except that they have specific formatting built-in. The
studies available to you in TradeStation are ShowMe, PaintBar, ProbabilityMap, and
ActivityBar.
This section discusses how to write indicators, and is followed by sections describing
how to write studies (ShowMe, PaintBar, ProbabilityMap, and ActivityBar).
Writing Indicators
When you apply an indicator to a price chart, you can format the indicator to display
their values in different ways; for example, as shown in Figure 3-16, you can format
EasyLanguage for TradeStation
Writing Indicators and Studies
149
the indicator to display as a line chart, as a histogram from the bottom of the chart, or
as a series of dots, etc.
Figure 3-16. Different formatting styles of indicators
You can even format the properties of an indicator to display as a bar chart. For
example, in the case of an indicator with three plots, such as the 3-Line Moving
Average Indicator, you can format the indicator and set one plot to bar high, another to
150
Writing Indicators and Studies
CHAPTER 3
bar low, and another to right tick. The 3-Line Moving Average indicator displayed as
a bar chart is shown in Figure 3-17.
Figure 3-17. Indicator formatted to display as a bar chart
For more information on formatting indicators, please refer to the Online User Manual.
Also, make sure you understand the concept of scaling with respect to price charts and
indicators. Using different scaling can dramatically alter the display of your indicators.
For information on scaling, search the Online User Manual Answer Wizard for
Indicator Formatting.
The Plot statements used to write indicators for price charts are discussed next.
PlotN(Expression, “<PlotName>” , ForeColor, BackColor, Width)
Displays values, resulting from a calculation or an expression, in a price chart. For price
charts, the values displayed can only be numeric.
Syntax:
PlotN(Expression[,“<PlotName>”[,ForeColor[,BackColor,[,Width]]]]);
Parameters:
N is a number between 1 and 4, representing one of the four available plots. Expression is
the numeric value plotted, and <PlotName> is the name of the plot. ForeColor is an EasyLanguage color used for the plot (also referred to as PlotColor), BackColor specifies the
background color (for use only with the OptionStation Position Analysis and RadarScreen
windows), and Width is a numeric value representing the width of the plot. The parameters
<PlotName>, ForeColor, BackColor, and Width are optional.
EasyLanguage for TradeStation
Writing Indicators and Studies
151
For a list of the available colors and widths, refer to Appendix B of this book.
Notes:
The BackColor parameter has no effect when plotting the indicator in a price chart window;
however, a value for the parameter is required in order to specify a width, as discussed in
the example.
Example:
Any one or more of the optional parameters can be omitted, as long as there are no other
parameters to the right. For example, the BackColor and Width parameters can be excluded
from a statement as follows:
Plot1( Volume, “V”, Red);
But the plot name cannot be omitted if you want to specify the plot color and width. For
instance, the following example generates a syntax error because the name of the plot statement is expected:
Incorrect:
Plot1( Volume, Black, White, 2);
Correct:
Plot1( Volume, “V”, Black, White, 2);
The only required parameter for a valid Plot statement is the value to be plotted. So the following statement is valid:
Plot1(Volume);
When no plot name is specified, EasyLanguage uses Plot1, Plot2, Plot3, or Plot4 as the plot
names for each plot. The first plot is named Plot1, the second Plot2, and so on.
Whenever referring to the plot color or width, you can use the word Default in place of the
parameter(s) to have the Plot statement use the default color and/or width selected in the
Properties tab of the Format indicator dialog box.
For example, the following statement will display the volume in the default color but specifies a specific width:
Plot1( Volume, “V”, Default, Default, 3);
Again, you can use the word Default for the color parameters or the width parameter.
Also, the same plot (i.e., Plot1, Plot2) can be used more than once in an analysis technique;
the only requirement is that you use the same plot name in both instances of the Plot statement. If no name is assigned, then the default plot name is used (i.e., Plot1, Plot2).
For example, if you want to plot the net change using red when it is negative and green
when it is positive, you can use the same plot number (in this case Plot1) twice, as long a
the name of the plot is the same:
152
Writing Indicators and Studies
CHAPTER 3
Value1 = Close - Close[1];
If Value1 > 0 Then
Plot1( Value1, “NetChg”, Green )
Else
Plot1( Value1, “NetChg”, Red );
In this example, the plot name “NetChg” must be the same in both instances of the Plot
statement.
Note: Once you have defined a plot using the PlotN reserved word, you can reference
the value of the plot simply by using the reserved word, PlotN. In the example below,
the reserved word Plot1 is used to plot the accumulation distribution of the volume. The
value of the plot is referenced in the next statement, in order to write the alert criteria:
Plot1(AccumDist(Volume), "AccumDist") ;
If Plot1 > Highest(Plot1, 20) then Alert ;
SetPlotColor(Number, Color)
This reserved word is used to change the color of a particular plot in a price chart
window.
Syntax:
SetPlotColor(Number, Color);
Parameters:
Number is a number from 1 to 4 representing the number of the plot to modify. Color is
the EasyLanguage color to be used for the plot.
For a list of the available colors, refer to Appendix B of this book.
Example:
The following EasyLanguage statements color the plot red when the RSI Indicator is
over 75, and green when it is under 25:
Plot1(RSI(Close, 9), “RSI”) ;
SetPlotColor(1, Default);
If Plot1 > 75 Then
SetPlotColor(1, Red);
If Plot1 < 25 Then
SetPlotColor(1, Green);
In this example, the RSI Indicator has three possible colors: red when it is over 75,
green when it is below 25, and the default color when it is between 25 and 75. If you
EasyLanguage for TradeStation
Writing Indicators and Studies
153
only set two colors, one for over 75 and one for under 25, it would remain one of the
two colors (which ever it was set to last) when it is between 25 and 75.
What you need to do is reset the plot color to a default color every bar so that it is only
red when above 75 and green when below 25. The rest of the time it is the default color.
In this example, we used the SetPlotColor reserved word to reset the plot to the default
color.
You can also set the default color of the plot using the PlotN reserved word. If you set
the default color in the PlotN statement, then you don’t have to use the first
SetPlotColor statement; instead your instructions would be as follows:
Plot1(RSI(Close, 9), “RSI”, Default) ;
If Plot1 > 75 Then
SetPlotColor(1, Red) ;
If Plot1 < 25 Then
SetPlotColor(1, Green) ;
SetPlotWidth(Number, Width)
This reserved word sets the width of the specified plot.
Syntax:
SetPlotWidth(Number, Width);
Parameters:
Number is a number from 1 to 4 representing the number of the plot to modify. Width is
the EasyLanguage width to be used for the plot.
For a list of the available widths, refer to Appendix B of this book.
Example:
The following EasyLanguage statements change the width of the plot to a thicker line
when the Momentum Indicator is over 0, and to a thinner line when it is under 0:
Plot1(Momentum(Close, 10), “Momentum”) ;
If Plot1 > 0 Then
SetPlotWidth(1, 4);
If Plot1 < 0 Then
SetPlotWidth(1, 1);
In this example, the Momentum Indicator has two possible widths: thicker when it is
over 0, and thinner when it is below 0. However, in some cases you will want the
indicator to have three or more possible widths. Please refer to the example for the
previous reserved word, SetPlotColor for a variation on the usage of the SetPlotWidth
reserved word.
154
Writing ShowMe and PaintBar Studies
CHAPTER 3
Specifying the Availability of Indicators
When you create an indicator in the EasyLanguage PowerEditor, you are prompted to
specify the windows e.g., price chart, OptionStation Position Analysis window,
RadarScreen window) for which your indicator will be available. By available, we
mean it will appear in the library of indicators to apply when you choose to insert an
indicator into the application.
The choices available to you depend on which Omega Research product(s) you
purchased. For example, if you purchased Omega Research ProSuite, by default, the
indicator is available in TradeStation charts, RadarScreen, and all sections of the
Position Analysis window.
For information on specifying the applications for which your indicator is available,
search the Online User Manual Answer Wizard for the phrase Specifying Applications.
Writing ShowMe and PaintBar Studies
ShowMe and PaintBar studies are somewhat similar to one another, in that both look for
a bar that meets a specific condition and marks the bar if the condition is met. Their
difference lies in the way each study marks the bar: the PaintBar study colors the entire
bar, while the ShowMe studies typically place a mark above or below the bar.
A ShowMe study is best used when the objective of the analysis is to find a criteria that
normally happens once every certain number of bars. A mark (usually a round dot) is
placed above or below these bars. The intention of the ShowMe study is to save you the
work of scrolling through the chart looking for bars that meet a certain criteria.
A PaintBar study is best used to highlight when a market enters a certain mode or trend.
In other words, it is best used in order to highlight an event that happens for a number of
consecutive bars. For example, in Figure 3-18, we see how a ShowMe study is used to
EasyLanguage for TradeStation
Writing ShowMe and PaintBar Studies
155
find all Bullish Key Reversal bars, and a PaintBar study is used to find whenever the
momentum of the symbol is positive.
Figure 3-18. ShowMe and Paintbar studies
ShowMe Studies
To write ShowMe studies, you use the PlotN reserved word described on page 150 but
instead of plotting a value for every tick or bar, you specify the conditions under which
you want the Plot statement to be executed using an IF-THEN statement. Also, instead
of specifying the value to plot, you specify the value on the bar at which to place the
mark when the conditions are met (for example, the high, low, open, close, or any other
numeric value).
Below is an example of the Outside Bar ShowMe study, which places a mark at the
high of the bar when the high is higher than the previous high and the low is lower than
the previous low:
If High > High[1] AND Low < Low[1] Then
Plot1(High, “Outside Bar”) ;
In the above example, we specified only the value at which to place the mark, in this
case, the high price of the bar, and we named the plot Outside Bar. We could also
specify the color of the mark and the width, or thickness, of the mark, as described in
the discussion of the reserved word PlotN.
When working with ShowMe studies, you have an additional reserved word available
to you, NoPlot.
156
Writing ShowMe and PaintBar Studies
CHAPTER 3
NoPlot(Num)
This reserved word removes the specified plot from the current bar in the price chart.
Syntax:
NoPlot(Num)
Parameters:
Num is a numeric expression representing the number of the plot to remove.
Notes:
This reserved word is useful when collecting data on a real-time/delayed basis and you
have the Update Every Tick check box selected for the ShowMe study. If the ShowMe
study condition becomes true during the bar, but is not true at the end of the bar, the
mark is removed. If you do not use this reserved word, the mark would be placed on
the bar when the condition became true and left there even when the condition was no
longer true.
Example:
The following ShowMe study marks the low of a gap down bar, but removes the mark
if the condition is no longer true for the bar:
If High < Low of 1 Bar Ago Then
Plot1(Low, “GapDown”)
Else
NoPlot(1) ;
PaintBar Studies
To write PaintBar studies, you use the reserved words described next.
PlotPaintBar( BarHigh, BarLow , "PlotName", ForeColor, BackColor, Width )
This reserved word is used only within a PaintBar study, and enables you to paint the
entire bar a specified color or paint the bar between two specified values.
Syntax:
PlotPaintBar( BarHigh, BarLow [, BarOpen [, BarClose
[, "<PlotName>"[, ForeColor[, BackColor[, Width]]]]]] );
Parameters:
BarHigh, BarLow, BarOpen and BarClose are numeric expressions representing the
high, low, open and closing prices for the bar to be drawn by the PaintBar study, and
<PlotName> is the name of the plot. ForeColor is an EasyLanguage color that will be used
to paint the bar, BackColor is an EasyLanguage color that is currently not used, and Width
is a numeric value representing the width of the plot.
EasyLanguage for TradeStation
Writing ShowMe and PaintBar Studies
157
Notes:
You can also specify only two of the bar parameters instead of the four: BarHigh, BarLow,
BarOpen or BarClose. However, you must specify either two or four of the bar parameters.
The parameter BackColor currently has no effect on a chart; however, you do need to include it in the statement when you want to specify Width.
You can abbreviate the PlotPaintBar reserved word to PlotPB. Also, you can use the
PlotN reserved word described previously to write a PaintBar study; however, we recommend you use the PlotPaintBar reserved word.
For a list of the available colors and widths, refer to Appendix B of this book.
Example:
For example, the following instructions can be used in order to paint red the bars with
twice the 10-bar average of the volume:
If Volume > 2 * Average(Volume, 10) Then
PlotPB(High, Low, Open, Close, "AvgVol", Red );
The following instructions paint the area between the two plots of the Bollinger Bands
Indicator when the 14-bar ADX value is lower than 25:
Variables: Top(0), Bottom(0);
Top = BollingerBand(Close, 14, 2);
Bottom = BollingerBand(Close, 14, -2);
If ADX(14) < 25 Then
PlotPaintBar(Top, Bottom, “Area”, Blue);
In this last example, notice that although we omitted the BarLow and BarClose
parameters, we are still able to specify the name and color of the plot. We applied this
PaintBar study to a chart and formatted it to use a dotted line. The result is shown in
Figure 3-19.
158
Writing ShowMe and PaintBar Studies
CHAPTER 3
Figure 3-19. Use of a PaintBar study to shade an area of the chart
NoPlot(Num)
This reserved word removes the specified plot from the current bar in the price chart.
Syntax:
NoPlot(Num)
Parameters:
Num is a numeric expression representing the number of the plot to remove.
Notes:
This reserved word is useful when collecting data on a real-time/delayed basis and you
have the Update Every Tick check box selected for the PaintBar study. If the PaintBar
study condition becomes true during the bar, but is not true at the end of the bar, the
plot is removed from that bar. If you do not use this reserved word, the bar is painted
when the condition becomes true and remains painted even when the condition is no
longer true.
Example:
The following PaintBar study paints the bars while the close is less than the 10-bar
average of the close, but removes the plot from the current bar if the condition is no
longer true:
EasyLanguage for TradeStation
Writing ProbabilityMap Studies
159
If Close < Average(Close, 10) Then
PlotPaintBar(High, Low, “Price<BarAvg”)
Else
NoPlot(1) ;
A PaintBar study uses one plot for two parameters; therefore, to remove the above plot, you
need to use one NoPlot statement, as shown above. If you use four price parameters with
the PlotPaintBar reserved word, then you use two NoPlot statements to remove the plot,
NoPlot(1) and NoPlot(2).
Writing ProbabilityMap Studies
ProbabilityMap studies create a ‘drawing area’ to the right of any bar clicked in the charting
application. They are most commonly used to show the most probable path, or area where
the symbol will move to in the future. An example of this is show in Figure 3-20.
Figure 3-20. A ProbabilityMap study attempting to forecast future market activity.
You can also base ProbabilityMap studies on other analysis techniques, thereby providing
a forecast of values based on the analysis technique.
However, this is not the only use for ProbabilityMap studies, as the analysis technique
provides a canvas on which you can draw any pattern or figure.
As mentioned above, when creating a new ProbabilityMap study, your first task is to define
the drawing area. This area is rectangular and divided into a grid with rows and columns.
As illustrated in Figure 3-21, the number of rows is defined by a top and bottom price, and
a row height, and the number of columns defined as a number of bars. You set these values
using reserved words.
When the grid is initially created, it contains zeros (0) in all cells. Therefore, after you define the drawing area, you should assign a number between 0 and 100 to each one of the
160
Writing ProbabilityMap Studies
CHAPTER 3
cells in the grid. This number reflects the probability that the price (or value) will reach that
particular cell.
Figure 3-21. ProbabilityMap Study drawing area
As explained above, when creating a ProbabilityMap study, a rectangular area is created
and divided into a grid with a specified number of rows and columns. Each one of the cells
in this grid is assigned a value from 0 to 100, representing the probability that the price will
reach that cell. When the ProbabilityMap study is applied to price chart, a color is assigned
to each cell of the drawing area, thereby creating the ProbabilityMap graph.
As shown in Figure 3-22, there are three available patterns: fire, smoke, and fade. You
specify the pattern using the Properties tab in the Format dialog box.
Figure 3-22. ProbabilityMaps color patterns
When creating ProbabilityMap studies, it is important to know that they are evaluated the
same way as other analysis techniques (and as is explained in Chapter 2, “The Basic Elements of EasyLanguage”); however, they do not take into account all the bars on the price
EasyLanguage for TradeStation
Writing ProbabilityMap Studies
161
chart, as do other analysis techniques. They take into account only however many bars are
specified by the MaxBarsBack setting.
For instance, if 50 bars are specified in the MaxBarsBack setting, and we place our ProbabilityMap pointer on the 53rd bar of the price chart, the ProbabilityMap study begins calculating on the 50th bar of the chart, and so on until the 53rd bar until it displays the
drawing area. However, if we place our pointer on the 100th bar of the price chart, the ProbabilityMap study will begin calculating on the 51st bar of the chart and so on until the most
recent bar, at which point it will display the drawing area (the drawing area is actually created for each of the 50 bars, however, it is displayed for one bar at a time, that is why it is
visible only on the selected bar).
This is illustrated in Figure 3-23.
Figure 3-23. ProbabilityMap studies calculate only on the last MaxBarsBack of the chart
As with any trading strategy or analysis technique, you must specify the number of bars to
use in the Maximum Number of Bars study will reference box (MaxBarsBack).
The reserved words available for the use of ProbabilityMap studies are divided into two
groups: set reserved words and get reserved words. The set reserved words are used to define the properties of the ProbabilityMap studies and to draw the graph itself. The get reserved words, on the other hand, are used to read the values of an existing ProbabilityMap
study or other analysis techniques applied to the price chart.
162
Writing ProbabilityMap Studies
CHAPTER 3
Set Reserved Words
To create a ProbabilityMap, you will use all the ProbabilityMap set reserved words.
These words define the size and properties of the ProbabilityMap study drawing area.
PM_SetHigh(Num)
This reserved word specifies the upper boundary of the ProbabilityMap area. The
ProbabilityMap is not drawn above the value specified.
Syntax:
PM_SetHigh(Num)
Parameters:
Num is a numeric expression representing the upper boundary of the ProbabilityMap.
study.
Example:
The following statement sets the upper boundary of the ProbabilityMap study to a value of
the close plus three times the range of the current bar:
PM_SetHigh(Close + (Range * 3));
PM_SetLow(Num)
This reserved word specifies the lower boundary of the ProbabilityMap area. The
ProbabilityMap is not drawn below the value specified.
Syntax:
PM_SetLow(Num)
Parameters:
Num is a numeric expression representing the lower boundary of the ProbabilityMap.
Example:
The following statement sets the lower boundary of the ProbabilityMap study to the a value
equal to the lowest low of the last 20 bars:
PM_SetLow(Lowest(Low,20));
PM_SetNumColumns(Num)
This reserved word is used to determine the number of columns inside the ProbabilityMap
drawing area. The ProbabilityMap is not drawn past the number of bars specified.
Syntax:
PM_SetNumColumns(Num)
Parameters:
Num is a numeric expression representing the maximum number of bars to the right of
the current bar that the ProbabilityMap is to be drawn.
EasyLanguage for TradeStation
Writing ProbabilityMap Studies
163
Example:
The following statement defines the ProbabilityMap study drawing area to 50 bars:
PM_SetNumColumns(50);
You can use the following expression to set the ProbabilityMap drawing area to have as
many columns as bars to the right available in the chart:
PM_SetNumColumns(MaxBarsForward);
PM_SetRowHeight(Num)
This reserved word is used to specify (in points) the height of each row of the
ProbabilityMap drawing area.
Syntax:
PM_SetRowHeight(Num)
Parameters:
Num is a numeric expression representing the row height.
Notes:
The row height of the drawing area is usually specified as:
(ProbabilityMap Upper Boundary - ProbabilityMap Lower Boundary) / Number of Rows
So, for instance, if the difference between the upper and lower boundaries of the ProbabilityMap is 50, and you want 100 rows, the row height must be 0.5. The more rows there are
in the ProbabilityMap, the better ‘resolution’; in other words, the grid cells are smaller and
the resulting graph appears smother and more detailed. However, it takes more time to
draw, as there are more cells to calculate and for which to draw ProbabilityMap values.
Example:
If you want to have 50 rows in the ProbabilityMap, the following instructions specify the
appropriate row height:
PM_SetRowHeight((PM_High - PM_Low) / 50 );
PM_SetCellValue(Column, Price, Value)
This reserved word is used to set the value of an individual cell in the ProbabilityMap
drawing area.
Syntax:
PM_SetCellValue(Column, Price, Value)
Parameters:
Column, Price, and Value are numeric expressions. Column and Price are the column and
the row of the drawing area, respectively, and Value is a numeric expression between 0
and 100 that colors that particular cell according to the color patterns shown in Figure 322.
164
Writing ProbabilityMap Studies
CHAPTER 3
Example:
The following statement sets the cell in the column corresponding to the close of the last
bar on the chart (the first bar in the ProbabilityMap drawing area) to a value of 100:
PM_SetCellValue(1, Close, 100);
Get Reserved Words
The get reserved words enable trading strategies, analysis techniques, and functions to
read information from the ProbabilityMap study.
PM_Low
This reserved word returns a numeric value representing the lower boundary of the
ProbabilityMap study drawing area. This value is important to ensure that you don’t
query values outside of the ProbabilityMap study drawing area.
Syntax:
PM_Low
Parameters:
None
Example:
The following statement checks whether or not a particular value is inside the upper and
lower boundaries of the ProbabilityMap study drawing area before assigning a color
value to a cell:
If Value1 >= PM_Low AND Value1 <= PM_High Then
PM_SetCellValue(1, Value1, 100);
PM_High
This reserved word returns a numeric value representing the upper boundary of the
ProbabilityMap study drawing area. This value is important to ensure that you don’t
query the values outside of the ProbabilityMap study drawing area.
Syntax:
PM_High
Parameters:
None
Example:
The following statement checks whether or not a particular value is inside the upper and
lower boundaries of the ProbabilityMap study drawing area before assigning a color
value to a cell:
If Value1 >= PM_Low AND Value1 <= PM_High Then
PM_SetCellValue(1, Value1, 100);
EasyLanguage for TradeStation
Writing ProbabilityMap Studies
165
PM_GetRowHeight
This reserved word returns numeric value representing the height (in points) of the cells
of the ProbabilityMap study drawing area.
Syntax:
PM_GetRowHeight
Parameters:
None. To obtain the value returned by this reserved word, you can assign the value to a
numeric variable, for example, Value1.
Notes:
This value should be used as an increment when traversing the ProbabilityMap study
drawing area.
Example:
The following loop traverses the first column of the ProbabilityMap study drawing area:
Value1 = PM_Low;
While Value1 < PM_High Begin
{ EasyLanguage instructions }
Value1 = Value1 + PM_GetRowHeight;
End;
PM_GetNumColumns
This reserved word returns a numeric value representing the number of columns of the
ProbabilityMap study drawing area.
Syntax:
Value1 = PM_GetNumColumns
Parameters:
None. To obtain the value returned by this reserved word, you can assign the value to a
numeric variable, for example, Value1.
Example:
The following loop traverses a row of the ProbabilityMap study drawing area from the
first to the last column:
For Value1 = 1 To PM_GetNumColumns Begin
{ EasyLanguage instruction(s) }
End;
166
Writing ActivityBar Studies
CHAPTER 3
PM_GetCellValue(Column, Price)
This reserved word returns the number corresponding to the value of the specified cell of
the ProbabilityMap study drawing area. The number returned by this reserved word is
between 0 and 100, corresponding to the color patterns shown in Figure 3-22.
Syntax:
Value1 = PM_GetCellValue(Column, Price)
Parameters:
Column and Price are numeric expressions representing the cell in the ProbabilityMap
study drawing area for which you want to obtain the value. To obtain the value returned by
this reserved word, you can assign the value to a numeric variable, for example, Value1.
Example:
The following statement obtains the value of the cell in the lower left corner of the ProbabilityMap study drawing area:
Value1 = PM_GetCellValue(1, PM_Low);
Writing ActivityBar Studies
ActivityBar studies provide you with the ability to show trading patterns that occur within
a range of bars on a chart. Unlike other indicators or studies, which consist of lines drawn
between price points or that plot symbols above or below a bar, ActivityBar studies produce
a series of cells to the right or left of a bar that show additional information about the trading
activity within each bar.
ActivityBar studies break down each bar into smaller bars by adding cells to the right or
left of the bar following the EasyLanguage instructions provided in the ActivityBar study.
When writing new ActivityBar studies in the PowerEditor, it is helpful to think of the studies as multi-data analysis techniques, where the two data streams are for the same symbol,
but one data stream has a finer resolution (smaller data compression) than the other and is
placed in a hidden subgraph.
All the EasyLanguage instructions are evaluated on the hidden data stream, referred to as
the ActivityData data stream, and the resulting cells are added to the visible bars.
When creating an ActivityBar study, only two instructions are necessary. The first is the
instruction that defines the height of the cells, which is determined on a bar-by-bar basis.
The other is the instruction or criteria that determines whether or not a cell is added.
You can also define and draw a zone around the ActivityBar study cells. You can draw this
zone to the left, right, or on both sides of the bar. The EasyLanguage instructions define the
upper and lower boundaries for the left and right zone separately, the width is automatically
determined by the longest row of cells. For example, if the longest row has 35 cells, the
zone is drawn wide enough to include all 35 cells.
EasyLanguage for TradeStation
Writing ActivityBar Studies
167
You can also draw an arrow or pointer to highlight a specific price of the bar. You can draw
this arrow on the left or right side of the bar (or both). By default, these pointers are drawn
on the open and closing prices of the bar.
The ActivityBar study reserved words can be divided into three groups: 1) reserved words
used to set the properties of the ActivityBar study, 2) get keywords used to obtain information on an existing ActivityBar study, and 3) other reserved words that are not necessary to
when creating ActivityBar studies, but are helpful when working with them. Reserved
words in the first two groups, set and get, are described next. For information on reserved
words in the third group, refer to the Reserved Word Library in the Online User Manual.
Set Reserved Words
There are many ActivityBar study reserved words, but only two are required to write
an ActivityBar study: AB_AddCell and AB_SetRowHeight. These and the other set
reserved words for ActivityBar studies are discussed next.
AB_AddCell(Price, Side, Str_Char, Color, Value)
This reserved word is used to add a cell to the current bar of the chart. You can only add
cells to the bar currently being analyzed (e.g., AB_AddCell(...)[1] is not allowed). This reserved word must be included in an ActivityBar study.
Syntax:
AB_AddCell(Price, Side, Str_Char, Color, Value)
Parameters:
Price is a numeric expression representing the price value at which the cell is added. It can
be any value inside or outside the range of the bar.
Side specifies the side of the bar on which the cell is placed, and it accepts one of two reserved words, LeftSide or RightSide.
Str_Char is the text string expression representing the text stored in the cell being added.
The expression is limited to one character. If the text string expression is longer than one
character, only the first character is used (e.g., if you use the text string expression “High”
the letter “H” is placed in the cell).
Color is the EasyLanguage color or its numeric equivalent representing the color in which
the cell is drawn. For a list of the available colors, see Appendix B of this book.
Value is a numeric expression stored in the cell. This value is required; however, it does not
affect the calculation of the ActivityBar study, and is solely for your use. You can refer to
the value later from the ActivityBar study itself or from other analysis techniques that reference the ActivityBar study. Use zero (0) for this parameter if you do not want to specify
a meaningful value.
Notes:
When writing an ActivityBar study, you must also specify the cell height. To do so, use
the reserved word AB_SetRowHeight, described next.
168
Writing ActivityBar Studies
CHAPTER 3
Example:
The following statement adds a green cell to the right side of the bar for every tick. Each
cell contains the letter A, and stores the trade volume for the tick in each cell:
AB_AddCell(Close of ActivityData, RightSide, “A”, Green,
Volume of ActivityData);
AB_SetRowHeight(Value)
This reserved word is used to define the height of each cell (row) on a bar-by-bar basis;
it is required when writing an ActivityBar study.
Syntax:
AB_SetRowHeight(Value)
Parameters:
Value is a numeric expression representing the row height.
Notes:
You want the row height to be dynamic because symbols vary greatly in price from one
symbol to another. For example, a row height of 0.25 will work nicely if the instrument is
trading at $50, but it will be an enormous row height for a penny stock trading at $1 per
share. Also, the trading range for a symbol can change significantly during a span of several
years (e.g., a stock adjusted for several stock splits), and an appropriate row height for today may not work well in the past or the future. The built-in ActivityBar studies use the
reserved word AB_RowCalc as the parameter for this reserved word to calculate a dynamic
row height.
When writing an ActivityBar study, you must also use the AB_AddCell reserved word
(discussed previously) to add cells.
Example:
The following statement sets the row height to 1/20th of the average range of the last 10
bars. The result is approximately 20 rows of cells per bar:
AB_SetRowHeight(Average(Range, 10) / 20 );
AB_SetZone(HighVal, LowVal, Side)
This reserved word defines the properties of the ActivityBar study zone.
Syntax:
AB_SetZone(HighVal, LowVal, Side)
Parameters:
HighVal and LowVal are numeric expressions representing the upper and lower
boundaries of the ActivityBar study zone, respectively. Side is one of two reserved
words LeftSide or RightSide, which specifies the side of the bar on which the zone is
drawn.
EasyLanguage for TradeStation
Writing ActivityBar Studies
169
Notes:
The zone is drawn on every bar using the same drawing properties (color and thickness) of
the bars, and is wide enough to fit the widest row of cells of that bar. The ActivityBar study
zone is not drawn if there are no cells for a bar.
Example:
The following statements draw the ActivityBar study zone to the left of each bar at one
standard deviation above and below the median price of the ActivityBar cells:
Value1 = AB_Median(RightSide);
Value2 = AB_StdDev(1, RightSide);
AB_SetZone(Value1 + Value2, Value1 - Value2, RightSide);
The above example uses the reserved words AB_Median and AB_StdDev. These
reserved words are described in Appendix C, “Reserved Words Quick Reference,” as
well as the Online User Manual.
AB_SetActiveCell(Price, Side)
ActivityBar studies display price markers on each bar on the chart. By default, these
markers are drawn at the open (left side) and closing prices (right side). This reserved word
overrides the default placement of these markers, allowing you to place them at any
location on the bar.
Syntax:
AB_SetActiveCell(Price, Side)
Parameters:
Price is a numeric expression representing the price at which you want to place the marker,
and Side defines the marker to move (left or right). Side only accepts one of two reserved
words, LeftSide or RightSide.
Example:
The following statements place the right side marker at the modal cell of the ActivityBar
study:
Value1 = AB_Mode(RightSide);
AB_SetActiveCell(Value1, RightSide);
AB_RemoveCell(Price, Offset, Side)
This reserved word is used to remove a cell from the current bar of an ActivityBar study.
Syntax:
AB_RemoveCell(Price, Offset, Side)
Parameters:
Price is a numeric expression representing the price of the row from which the cell is to be
removed. Offset is the column number of the cell to be removed (where column 1 is the
closest to the bar), and Side specifies the side of the bar on which the cell is located (you
must use one of two reserved words, LeftSide or RightSide, to specify the side).
170
Writing ActivityBar Studies
CHAPTER 3
Notes:
If the specified cell does not exist, the ActivityBar study generates a run time error with the
message “ActivityBar tried to reference an empty row.”
Example:
The following statement removes the last cell on the right side of the bar, from the row corresponding to the close of the bar:
Value1 = AB_GetNumCells(Close of Data1, RightSide);
AB_RemoveCell(Close of Data1, Value1, RightSide);
This example uses the reserved word AB_GetNumCells to obtain the number of cells
on the right side of the ActivityBar, and then uses the value obtained as the Offset
parameter for AB_RemoveCell.
Get Reserved Words
Using the reserved words described in this section, you can reference information on
existing ActivityBar study cells from any other analysis technique, trading strategy, or
function.
AB_GetCellChar(Price, Side, Offset)
This reserved word returns the text string expression held by the specified cell.
Syntax:
AB_GetCellChar(Price, Side, Offset)
Parameters:
Price is a numeric expression representing the price of the cell referenced. Side specifies
the side of the bar on which the cell is located (you must use one of two reserved words,
LeftSide or RightSide, to specify the side), and Offset is the column number of the cell referenced (where column 1 is the closest to the bar).
Notes:
You can use this reserved word in an ActivityBar study as well as any other analysis
technique, trading strategy, or function. To store the text string expression returned by
the reserved word, you can assign this reserved word to a text string variable. If you
reference a cell that does not exist, a runtime error will occur.
Example:
The following statements retrieve the text string expression held in the first cell of the row
corresponding to the closing price of the current bar:
Variable: Str(“ ”);
Str = AB_GetCellChar(Close of data1, LeftSide, 1);
EasyLanguage for TradeStation
Writing ActivityBar Studies
171
AB_GetCellColor(Price, Side, Offset)
This reserved word returns a number representing the color used to draw the specified cell.
Syntax:
AB_GetCellColor(Price, Side, Offset)
Parameters:
Price is a numeric expression representing the price of the cell referenced. Side specifies
the side of the bar on which the cell is located (you must use one of two reserved words,
LeftSide or RightSide, to specify the side), and Offset is the column number of the cell referenced (where column 1 is the closest to the bar).
Notes:
To store the number returned by the reserved word, you can assign this reserved word
to a numeric variable. The numeric value returned is the EasyLanguage numeric equivalent used to specify colors. For a list of the available colors, refer to Appendix B of this
book. You can use this reserved word in an ActivityBar study as well as any other analysis technique, trading strategy, or function. If you reference a cell that does not exist,
a runtime error will occur.
Example:
The following statement retrieves the color of the first cell on the right side located at the
opening price of the bar. The color is assigned to the variable Value1:
Value1 = AB_GetCellColor(Open of Data1, RightSide, 1);
AB_GetCellDate(Price, Side, Offset)
Each time a cell is added to a bar, the date and time of when it was added is stored with the
cell. This reserved word returns the EasyLanguage date corresponding to the date the cell
was added to the bar.
Syntax:
AB_GetCellDate(Price, Side, Offset)
Parameters:
Price is a numeric expression representing the price of the cell being referenced. Side specifies the side of the bar on which the cell is located (you must use one of two reserved
words, LeftSide or RightSide, to specify the side), and Offset is the column number of the
cell referenced (where column 1 is the closest to the bar).
Notes:
To store the date returned by the reserved word, you can assign this reserved word to
a numeric variable. You can use this reserved word in an ActivityBar study as well as
any other analysis technique, trading strategy, or function. If you reference a cell that
does not exist, a runtime error will occur.
172
Writing ActivityBar Studies
CHAPTER 3
Example:
The following statement retrieves the date of the first cell on the right side at the opening
price of the bar, and assign this date to the numeric variable Value1:
Value1 = AB_GetCellDate(Open of Data1, RightSide, 1);
AB_GetCellTime(Price, Side, Offset)
Each time a cell is added to a bar, the date and time of when it was added is stored with the
cell. This reserved word returns the time that the cell was added to the bar.
Syntax:
AB_GetCellTime(Price, Side, Offset)
Parameters:
Price is a numeric expression representing the price of the cell being referenced. Side specifies the side of the bar on which the cell is located (you must use one of two reserved
words, LeftSide or RightSide, to specify the side), and Offset is the column number of the
cell referenced (where column 1 is the closest to the bar).
Notes:
To store the time returned by the reserved word, you can assign this reserved word to
a numeric variable. You can use this reserved word in an ActivityBar study as well as
any other analysis technique, trading strategy, or function. If you reference a cell that
does not exist, a runtime error will occur.
Example:
The following statement retrieves the time of the first cell on the right side at the opening
price of the bar, and assigns this date to the numeric variable Value1:
Value1 = AB_GetCellDate(Open of Data1, RightSide, 1);
AB_GetCellValue(Price, Side, Offset)
When you add a cell to a bar using the AB_AddCell reserved word, you can store a value in
the cell. You use the AB_GetCellValue reserved word to obtain the value.
Syntax:
AB_GetCellValue(Price, Side, Offset)
Parameters:
Price is a numeric expression representing the price of the cell being referenced. Side specifies the side of the bar on which the cell is located (you must use one of two reserved
words, LeftSide or RightSide, to specify the side), and Offset is the column number of the
cell referenced (where column 1 is the closest to the bar).
Notes:
To store the value returned by the reserved word, you can assign this reserved word to
a numeric variable. You can use this reserved word in an ActivityBar study as well as
any other analysis technique, trading strategy, or function. If you reference a cell that
does not exist, a runtime error will occur.
EasyLanguage for TradeStation
Writing ActivityBar Studies
173
Example:
The following statement retrieves the value stored in the first cell on the right side at the
opening price of the bar, and assigns this value to the numeric variable Value1:
Value1 = AB_GetCellValue(Open of Data1, RightSide, 1);
AB_GetNumCells(Price, Side)
This reserved word returns the number of cells in a specified row.
Syntax:
AB_GetNumCells(Price, Side)
Parameters:
Price is a numeric expression representing the price of the row being referenced, and Side
specifies the side of the bar (Side accepts one of two reserved words, LeftSide or RightSide).
Notes:
If you reference any attribute of a non-existent cell, a run time error is generated by the
ActivityBar study when applied to a chart. For example, if at price 100 there are 5 cells to
the right of the bar, and the study attempts to obtain the color of cell number 6, an error is
generated and the study is turned off. You can avoid these errors by using the
AB_GetNumCells reserved word to determine the number of available cells before attempting to reference any of them.
To store the resulting value, you can assign this reserved word to a numeric variable. You
can use this reserved word in an ActivityBar study as well as any other analysis
technique, trading strategy, or function.
Example:
The following statements obtain the text string expression stored in the last cell in the row
corresponding to the open of the bar. Notice that we first obtain the total number of cells in
the desired row, and store this number in the variable Value1. We then use the resulting
number (Value1) to obtain the text string expression:
Variable: Str(“ ”);
Value1 = AB_GetNumCells(Open of Data1, RightSide);
Str = AB_GetCellChar(Open of Data1, Value1, RightSide);
AB_GetZoneHigh(Side)
This reserved word returns a numeric value representing the upper boundary of the
ActivityBar study zone.
Syntax:
AB_GetZoneHigh(Side)
Parameters:
Side specifies the side for which to obtain the value. Side accepts one of two reserved
words, LeftSide or RightSide.
174
Writing ActivityBar Studies
CHAPTER 3
Notes:
To store the resulting value, you can assign this reserved word to a numeric variable. You
can use this reserved word in an ActivityBar study as well as any other analysis
technique, trading strategy, or function.
Example:
The following statement assigns the high price of the ActivityBar zone to the numeric
variable Value1:
Value1 = AB_GetZoneHigh(RightSide);
AB_GetZoneLow(Side)
This reserved word returns a numeric value representing the lower boundary of the
ActivityBar study zone.
Syntax:
AB_GetZoneLow(Side)
Parameters:
Side specifies the side for which to obtain the value. Side accepts one of two reserved
words, LeftSide or RightSide.
Notes:
To store the resulting value, you can assign this reserved word to a numeric variable. You
can use this reserved word in an ActivityBar study as well as any other analysis
technique, trading strategy, or function.
Example:
The following statement assigns the high price of the ActivityBar zone to the numeric
variable Value1:
Value1 = AB_GetZoneLow(RightSide);
AB_High
This reserved word returns a numeric value representing the highest price on the bar at
which a cell is drawn.
Syntax:
AB_High
Parameters:
None.
Notes:
If no cells are drawn, a value of zero (0) is returned. To store the resulting value, you can
assign this reserved word to a numeric variable. You can use this reserved word in an
ActivityBar study as well as any other analysis technique, trading strategy, or function.
EasyLanguage for TradeStation
Writing ActivityBar Studies
175
Example:
The following statements use a While loop to traverse all the possible cells:
Value1 = AB_High;
While Value1 > AB_Low Begin
{ EasyLanguage Instruction(s) }
Value1 = Value1 - AB_GetRowHeight;
End;
First, we use AB_High to obtain the highest price at which a cell is drawn, and we
assign this value to Value1. In each iteration of the While loop, we subtract the value
equal to one row (which we obtain using AB_GetRowHeight). The loop continues as
long as Value1 is greater than the lowest price on the bar at which a cell is drawn.
AB_Low
This reserved word returns a numeric value representing the lower of two values: the
lowest price of the bar on which the ActivityBar study is applied, or the lowest price
on the bar at which a cell is drawn.
Syntax:
AB_Low
Parameters:
None.
Notes:
If no cells are drawn, a value of zero (0) is returned. To store the resulting value, you can
assign this reserved word to a numeric variable. You can use this reserved word in an
ActivityBar study as well as any other analysis technique, trading strategy, or function.
Example:
The following statements use a While loop to traverse all the possible cells:
Value1 = AB_Low;
While Value1 < AB_High Begin
{ EasyLanguage Instruction(s) }
Value1 = Value1 + AB_GetRowHeight;
End;
First, we use AB_Low to obtain the lowest price at which a cell is drawn, and we assign
this value to Value1. In each iteration of the While loop, we add the value equal to one
row (which we obtain using AB_GetRowHeight). The loop continues as long as Value1
is less than the highest price on the bar at which a cell is drawn.
176
Writing ActivityBar Studies
CHAPTER 3
Other Reserved Words Related to ActivityBar Studies
The following is a list of reserved words you can use when writing ActivityBar studies.
ActivityData
This reserved word is a data alias used to reference the hidden data stream used by the
ActivityBar study. When you want to refer to the ActivityBar data stream, and the
reserved word that you are using is not an ActivityBar-related reserved word (thereby
referencing the ActivityBar study data stream by default), you must use this data alias.
Syntax:
... of ActivityData
Parameters:
None.
Notes:
The reserved word Of is used with ActivityData to make it easier to read.
Example:
The following statement calculates the average of the last 10 closing prices of the
ActivityBar study data stream. For instance, assume the ActivityBar study uses a data
compression of 30 minutes and is applied to a daily chart. In this case, the statement
calculates the average of the last ten 30-minute bars:
Value1 = Average(Close, 10) of ActivityData;
BarStatus(DataNum)
It can be very useful to know when the ActivityBar study is being called for the last
trade of a particular bar, or when the ActivityBar study is being read for a trade ‘inside
the bar’. This reserved word obtains this information.
Syntax:
BarStatus(DataNum)
Parameters:
DataNum is a numeric expression representing the data stream that is being evaluated,
and can be between 1 and 50, inclusive.
Notes:
This reserved word will return one of four possible values:
2 = the closing tick of a bar
1 = a tick within a bar
0 = the opening tick of a bar
-1 = an error occurred while executing the reserved word
EasyLanguage for TradeStation
Writing ActivityBar Studies
177
Example:
The following statements reset the numeric variable Value1 to 0 when the bar to which
the ActivityBar study is applied is closed:
If BarStatus(1) = 2 Then
Value1 = 0
Else
Value1 = Value1 + 1;
LeftSide
This reserved word is used with the other ActivityBar reserved words to specify the
side of the ActivityBar you want to reference. It specifies that you are referencing the
left side of the bar.
Syntax:
LeftSide
Parameters:
None.
Example:
The following statement obtains the number of cells on the left side of a bar, for the
row corresponding to the closing price:
Value1 = AB_GetNumCells(Close of Data1, LeftSide);
RightSide
This reserved word is used with the other ActivityBar reserved words to specify the
side of the ActivityBar you want to reference. It specifies that you are referencing the
right side of the bar.
Syntax:
RightSide
Parameters:
None.
Example:
The following statement obtains the number of cells on the right side of a bar, for the
row corresponding to the open price:
Value1 = AB_GetNumCells(Open of Data1, RightSide);
178
Writing ActivityBar Studies
CHAPTER 3
CHAPTER 4
EasyLanguage for RadarScreen
This chapter covers EasyLanguage specifically for use with RadarScreen 2000i.
When working with RadarScreen, you can write indicators for use in the RadarScreen
window as well as price charts. RadarScreen 2000i enables you to scan and rank symbols
based on almost any criteria imaginable. Unlike price charts, where your indicators are
restricted to plotting a numeric value, your RadarScreen indicators can plot a numeric or
text string expression. This, combined with the ability to sort your symbols by up to four
indicators (in ascending or descending order), allows you a great deal of power and
flexibility when ranking your symbols.
This chapter describes the reserved words you’ll be using to write your RadarScreen
indicators, and the considerations you should keep in mind when writing them to
maximize the power of RadarScreen.
Keep in mind that the information in this chapter builds on the foundation outlined in
Chapter 2, “The Basic EasyLanguage Elements.” Therefore, we recommend you read
and understand the material in Chapter 2 before continuing with this chapter, particularly
the section titled, “How EasyLanguage is Evaluated,” at the beginning of Chapter 2.
In This Chapter
Writing RadarScreen Indicators ........... 180
Writing Indicators for
SuperCharts SE .................................... 185
Specifying Availability of
Indicators.............................................. 191
180
Writing RadarScreen Indicators
CHAPTER 4
Writing RadarScreen Indicators
When working with price charts, an indicator is a mathematical formula that returns a
numeric value. These values are then displayed in a price chart, either overlaid on the
price data or in a subgraph below it. However, when working with RadarScreen, an
indicator can return a numeric or text string value. This enables you to scan your symbols
as well as rank them.
For instance, you can display thousands of symbols, scan the data for certain criteria, and
enable alerts so you are notified when your symbdols meet any of the criteria in your
specific indicator(s). You can also rank the symbols. In other words, you can sort the
symbols by certain indicators, so that instantly, the symbols you want to trade are listed
at the top of the window, or grouping.
Let’s take a look at a RadarScreen window. Each column is an indicator, and the value
shown in each cell represents the value of the indicator calculated for the symbol in that
particular row. Also, the values displayed are the values of the indicators for the latest
data point available (most recent bar). Figure 4-1 shows a RadarScreen window
containing several indicators.
Figure 4-1. Various indicators in a RadarScreen window
You can set alerts on individual indicators, as well as sort your symbols by up to four indicators. Keep in mind also, that the concept of price bars and data compression on a price
chart also applies when working with a RadarScreen window. For instance, in
RadarScreen, the data compression can vary just like it does in a price chart, and when an
indicator refers to bars, it is referring to the data compression selected for the symbol.
For example, if a Moving Average 1 Line Indicator is applied to a RadarScreen window,
and the symbol’s data compression is set to daily (the default), and the Length input of the
indicator is set to 10, this indicator will calculate the 10-day average of this symbol. How-
EasyLanguage for RadarScreen
Writing RadarScreen Indicators
181
ever, if another symbol’s data compression is set to 30 minutes, then the same indicator will
calculate the 5-hour average for that symbol.
How EasyLanguage evaluates data for the RadarScreen window is discussed in detail in
Chapter 2, “The Basic EasyLanguage Elements.” Refer to the first section of that chapter,
titled, “How EasyLanguage Evaluates Data.” It provides an important foundation you’ll
need to understand the RadarScreen Plot statements and begin writing your indicators.
The reserved words used to write indicators for use with RadarScreen are described next.
Plot Statements
The reserved words used to create indicators result in statements referred to as plot
statements because they control how information is displayed, or plotted, either in a
grid (i.e., a RadarScreen window) or in a price chart.
PlotN(Expression, “<PlotName>” , ForeColor, BackColor)
Displays values, resulting from a calculation or an expression, in a RadarScreen window.
The values can be numeric or text string.
Syntax:
PlotN(Expression [,“<PlotName>”[,ForeColor[,BackColor ]]]);
Parameters:
N is a number between 1 and 4, representing one of the four available plots. Expression is
the value that will be plotted (either numeric or text string expression), and <PlotName>
is the name of the plot. ForeColor is an EasyLanguage color that will be used for the plot
foreground, and BackColor is an EasyLanguage color that will be used for the plot background. The parameters <PlotName>, ForeColor, and BackColor are optional. When plotting a text string expression, the expression must be enclosed in quotation marks (e.g., “T”).
For a list of the available colors, refer to Appendix B of this book.
Notes:
There is a category of reserved words called Quote Fields. These words enable you to access snapshot information from the datafeed, and allows indicators applied to RadarScreen
to use less memory and be more efficient in its calculations; in other words, to optimize its
performance. They are very useful for performing analysis on intraday minute and tick bars
and referencing the current day’s information (e.g., daily high, low, open). For information
on Quote Fields, refer to Chapter 2, “The Basics EasyLanguage Elements.”
Example:
Any one or more of the optional parameters can be omitted, as long as there are no other
parameters to the right. For example, the background color can be excluded from the statement, as follows:
Plot1( Volume, “V”, Black );
But the plot name cannot be omitted if you want to specify the plot colors. For instance, the
following example generates a syntax error because the name of the plot statement is expected:
182
Writing RadarScreen Indicators
CHAPTER 4
Incorrect:
Plot1( Volume, Black, White);
Correct:
Plot1( Volume, “V”, Black, White);
The only required parameter for a valid Plot statement is the value plotted. So the following
statement is valid:
Plot1(Volume);
When no plot name is specified, EasyLanguage will use Plot1, Plot2, Plot3, or Plot4 as the
plot names for each plot. The first plot will be named Plot1, the second Plot2, and so on.
Whenever referring to the foreground color or background color, you can use the word Default in place of the parameter(s) to have the Plot statement use the default colors selected
in the Properties tab of the Format indicator dialog box.
For example, the following statement can be used to display the volume in the default foreground color but a specific background color:
Plot1( Volume, “V”, Default, Red);
Again, you can use the word Default for either of the color parameters.
Also, the same plot (i.e., Plot1, Plot2) can be used more than once in an indicator; the only
requirement is that you use the same plot name in both instances of the Plot statement. If
no name is assigned, then the default plot name is used (i.e., Plot1, Plot2).
For example, if you want to plot the net change using red when it is negative and green
when it is positive, you can use the same plot number (in this case Plot1) twice, as long a
the name of the plot is the same:
Value1 = Close - Close[1];
If Value1 > 0 Then
Plot1( Value1, “NetChg”, Green )
Else
Plot1( Value1, “NetChg”, Red );
In this example, the plot name “NetChg” must be the same in both instances of the Plot
statement.
As discussed, the power of RadarScreen lies in its ability to plot not only numeric values
but also text string values. For example, the following indicator displays a T in the cell
when the symbol experiences a key reversal, and an F when it does not:
If Low < Low[1] AND Close > Close[1] Then
Plot1( “T”, “KR”)
Else
Plot1( “F”, “KR”);
EasyLanguage for RadarScreen
Writing RadarScreen Indicators
183
SetPlotColor(Number, Color)
This reserved word is used to change the foreground or plot color of a particular plot.
Syntax:
SetPlotColor(Number, Color);
Parameters:
Number is a number from 1 to 4 representing the number of the plot to modify. Color is
the EasyLanguage color to be used for the plot.
Notes:
This reserved word changes the color of the plot; the reserved word described next,
SetPlotBGColor, changes the background color of the plot (for use only with grid
applications; in other words, the RadarScreen or OptionStation Position Analysis
windows).
For a list of the available colors, refer to Appendix B of this book.
Example:
The color of the plot can be changed for each price; for example, if the indicator value is
negative, the plot can be displayed in red, and when the indicator value is positive, the
plot can be displayed in green. The following statements show how to modify the color
of an indicator; in this case, the Momentum Indicator:
Plot1(Momentum(Close, 10), “Momentum”);
If Plot1 > 0 Then
SetPlotColor(1, Green)
Else
SetPlotColor(1, Red);
In this example, the Momentum Indicator has two possible colors: green when it is over
0, red when it is below 0. Please refer to the example for the next reserved word,
SetPlotBGColor for a variation on the usage of this reserved word.
SetPlotBGColor(Number, Color)
This reserved word is used to change the background color of the cell where the value
of the plot is displayed.
Syntax:
SetPlotBGColor(Number, Color);
Parameters:
Number is a number from 1 to 4 identifying the plot to modify, and Color is the
EasyLanguage color to be used for the background of the cell.
Notes:
The color of the plot can be set as you create the plot, using the reserved word PlotN;
the SetPlotBGColor reserved word is used to change the color on a value by value
184
Writing RadarScreen Indicators
CHAPTER 4
basis. For example, if a symbol is overpriced, the indicator can change the background
color of the cell to red, and when the symbol is under priced, the indicator can set the
color to green.
For a list of the available colors, refer to Appendix B of this book.
Example:
The following EasyLanguage statements color the background of the cell red when the
RSI Indicator is over 75, and green when it is under 25:
Plot1(RSI(Close, 9), “RSI”) ;
SetPlotBGColor(1, Default);
If RSI(Close, 9) > 75 Then
SetPlotBGColor(1, Red);
If RSI(Close, 9) < 25 Then
SetPlotBGColor(1, Green);
In this example, the RSI Indicator has three possible colors: red when it is over 75,
green when it is below 25, and the default color when it is between 25 and 75. If you
only set two colors, one for over 75 and one for under 25, it would remain one of the
two colors (which ever it was set to last) when it is between 25 and 75. What you need
to do is reset the plot color to another color every bar so that it is only red when above
75 and green when below 25. The rest of the time it is the other color. In this example,
we used the SetPlotBGColor reserved word to reset the plot to the default color.
You can also set the default color of the plot using the PlotN reserved word. If you set
the default color in the PlotN statement, then you don’t have to use the first
SetPlotBGColor statement; instead your instructions would be as follows:
Plot1(RSI(Close, 9), “RSI”, Default, Default) ;
If RSI(Close, 9) > 75 Then
SetPlotBGColor(1, Red);
If RSI(Close, 9) < 25 Then
SetPlotBGColor(1, Green);
The same applies for the previous reserved word, SetPlotColor.
NoPlot(Num)
This reserved word removes the specified plot from the cell.
Syntax:
NoPlot(Num)
Parameters:
Num is a numeric expression representing the number of the plot to remove.
Notes:
This reserved word is useful when you want the cell to revert back to a blank cell.
EasyLanguage for RadarScreen
Writing Indicators for SuperCharts SE
185
Example:
The following indicator displays the percentage change of the price (from the open)
when it is more than 5% in either direction, up or down. When the percentage change
is less than 5% either up or down, the cell is blank:
Value1 = ((Close - Open)/Open) * 100 ;
If Value1 >= 5 or Value1 <= 5 Then
Plot1(Value1, “Pcnt Change”)
Else
NoPlot(1) ;
Writing Indicators for SuperCharts SE
This section discusses how to write indicators for use with SuperCharts SE, and is
intended for those who have purchased RadarScreen only. In this case, you have
SuperCharts SE available for your charting and technical analysis needs.
If you purchased Omega Research ProSuite or TradeStation, you will have
TradeStation available for your charting and trading strategy testing needs, and you
should refer instead to the chapter of this book titled, “EasyLanguage for
TradeStation,” for information on writing trading signals, indicators, and studies for
use with TradeStation.
Writing Indicators
When working with price charts, indicators calculate a mathematical formula and
display their values on the price chart. When you apply an indicator to a price chart,
you can format the indicator to display their values in different ways; for example, as
shown in Figure 4-2, you can format the indicator to display as a line chart, as a
histogram, or as a series of dots.
186
Writing Indicators for SuperCharts SE
CHAPTER 4
Figure 4-2. Different forms of indicators
You can even format the properties of an indicator to display as a bar chart. For
example, in the case of an indicator with three plots, such as the 3-Line Moving
Average Indicator, you can format the indicator and set one plot to bar high, another to
bar low, and another to right tick. The revised 3-Line Moving Average indicator
displayed as a bar chart is shown in Figure 4-3.
EasyLanguage for RadarScreen
Writing Indicators for SuperCharts SE
187
Figure 4-3. Indicator formatted to display as a bar chart
For more information on formatting indicators, please refer to the Online User Manual.
Also, make sure you understand the concept of scaling with respect to price charts and
indicators. Using different scaling can dramatically alter the display of your indicators.
For information on scaling, search the Online User Manual Answer Wizard for
Indicator Formatting.
You use two of the same plot statements to create an indicator for use in a price chart
as you do for use in the RadarScreen window, PlotN and SetPlotColor; however, there
are some parameters for these plot statements that apply only when working with price
charts. Therefore, the plot statements are discussed again, this time with the focus on
the parameters and considerations that apply when working with price charts.
PlotN(Expression, “<PlotName>” , ForeColor, BackColor, Width)
Displays values, resulting from a calculation or an expression, in a price chart. For price
charts, the values displayed can only be numeric.
Syntax:
PlotN(Expression[,“<PlotName>”[,ForeColor,[BackColor,[,Width]]]]);
Parameters:
N is a number between 1 and 4, representing one of the four available plots. Expression is
the numeric value that will be plotted, and <PlotName> is the name of the plot. ForeColor
is an EasyLanguage color that is used for the plot, BackColor specifies the background col-
188
Writing Indicators for SuperCharts SE
CHAPTER 4
or (for use only with the RadarScreen and OptionStation Position Analysis windows), and
Width is a numeric value representing the width of the plot. The parameters <PlotName>,
ForeColor, BackColor, and Width are optional.
For a list of the available colors and widths, refer to Appendix B of this book.
Notes:
The BackColor parameter has no effect when plotting the indicator in a price chart window;
however, it is required in order to specify a width, as discussed in the example.
Example:
Any one or more of the optional parameters can be omitted, as long as there are no other
parameters to the right. For example, the BackColor and Width parameters can be excluded
from a statement as follows:
Plot1( Volume, “V”, Black);
But the plot name cannot be omitted if you want to specify the plot color and width. For
instance, the following example generates a syntax error because the name of the plot statement is expected:
Incorrect:
Plot1( Volume, Black, White, 2);
Correct:
Plot1( Volume, “V”, Black, White, 2);
The only required parameter for a valid Plot statement is the value that will be plotted. So
the following statement is valid:
Plot1(Volume);
When no plot name is specified, EasyLanguage will use Plot1, Plot2, Plot3, or Plot4 as the
plot names for each plot. The first plot will be named Plot1, the second Plot2 and so on.
Whenever referring to the plot color or width, you can use the word Default in place of the
parameter(s) to have the Plot statement use the default color and/or width selected in the
Properties tab of the Format indicator dialog box.
For example, the following statement can be used to display the volume in the default color
but a specific width:
Plot1( Volume, “V”, Default, Default, 3);
Again, you can use the word Default for the color parameters or the width parameter.
Also, the same plot (i.e., Plot1, Plot2) can be used more than once in an analysis technique;
the only requirement is that you use the same plot name in both instances of the Plot statement. If no name is assigned, then the default plot name is used (i.e., Plot1, Plot2).
For example, if you want to plot the net change using red when it is negative and green
when it is positive, you can use the same plot number (in this case Plot1) twice, as long a
the name of the plot is the same:
EasyLanguage for RadarScreen
Writing Indicators for SuperCharts SE
189
Value1 = Close - Close[1];
If Value1 > 0 Then
Plot1( Value1, “NetChg”, Green )
Else
Plot1( Value1, “NetChg”, Red );
In this example, the plot name “NetChg” must be the same in both instances of the Plot
statement.
Note: Once you have defined a plot using the PlotN reserved word, you can reference
the value of the plot simply by using the reserved word, PlotN. In the example below,
the reserved word Plot1 is used to plot the accumulation distribution of the volume. The
value of the plot is referenced in the next statement, in order to write the alert criteria:
Plot1(AccumDist(Volume), "AccumDist") ;
If Plot1 > Highest(Plot1, 20) then Alert ;
SetPlotColor(Number, Color)
This reserved word is used to change the color of a particular plot in a price chart
window.
Syntax:
SetPlotColor(Number, Color);
Parameters:
Number is a number from 1 to 4 representing the number of the plot to modify. Color is
the EasyLanguage color to be used for the plot.
For a list of the available colors, refer to Appendix B of this book.
Example:
The following EasyLanguage statements color the plot red when the RSI Indicator is
over 75, and green when it is under 25:
Plot1(RSI(Close, 9), “RSI”) ;
SetPlotColor(1, Default);
If Plot1 > 75 Then
SetPlotColor(1, Red);
If Plot1 < 25 Then
SetPlotColor(1, Green);
In this example, the RSI Indicator has three possible colors: red when it is over 75,
green when it is below 25, and the default color when it is between 25 and 75.
190
Writing Indicators for SuperCharts SE
CHAPTER 4
If you only set two colors, one for over 75 and one for under 25, it would remain one
of the two colors (which ever it was set to last) when it is between 25 and 75.
What you need to do is reset the plot color to a default color every bar so that it is only
red when above 75 and green when below 25. The rest of the time it is the default color.
In this example, we used the SetPlotColor reserved word to reset the plot to the default
color.
You can also set the default color of the plot using the PlotN reserved word. If you set
the default color in the PlotN statement, then you don’t have to use the first
SetPlotColor statement; instead your instructions would be as follows:
Plot1(RSI(Close, 9), “RSI”, Default) ;
If Plot1 > 75 Then
SetPlotColor(1, Red);
If Plot1 < 25 Then
SetPlotColor(1, Green);
SetPlotWidth(Number, Width)
This reserved word sets the width of the specified plot.
Syntax:
SetPlotWidth(Number, Width);
Parameters:
Number is a number from 1 to 4 representing the number of the plot to modify. Width is
the EasyLanguage width to be used for the plot.
For a list of the available widths, refer to Appendix B of this book.
Example:
The following EasyLanguage statements change the width of the plot to a thicker line
when the Momentum Indicator is over 0, and to a thinner line when it is under 0:
Plot1(Momentum(Close, 10), “Momentum”) ;
If Plot1 > 0 Then
SetPlotWidth(1, 2);
If Plot1 < 0 Then
SetPlotWidth(1, 6);
In this example, the Momentum Indicator has two possible widths: thicker when it is
over 0, and thinner when it is below 0. However, in some cases you will want the
indicator to have three or more possible widths. Please refer to the example for the
previous reserved word, SetPlotColor for a variation on the usage of the reserved word.
The same applies for SetPlotWidth.
EasyLanguage for RadarScreen
Specifying Availability of Indicators
191
Specifying Availability of Indicators
When you create an indicator in the EasyLanguage PowerEditor, you are prompted to
specify the applications (i.e., price chart, RadarScreen window) for which your
indicator will be available. By available, we mean it will appear in the library of
indicators to apply when you choose to insert an indicator into the application.
The choices available to you depend on which Omega Research product(s) you
purchased. For example, if you purchased Omega Research ProSuite, by default, the
indicator will be available in TradeStation charts, RadarScreen, and all sections of the
Position Analysis window. For information on specifying the applications for which
your indicator is available, search the Online User Manual Answer Wizard for the
phrase Specifying Applications.
192
Specifying Availability of Indicators
CHAPTER 4
CHAPTER 5
EasyLanguage for OptionStation
This chapter covers EasyLanguage that is specifically for use with OptionStation 2000i.
You can write indicators for use with the OptionStation Position Analysis window as
well as price charts. You can also create custom Search Strategies, for use with the
Position Search Wizard, and Pricing, Volatility, and Bid/Ask Models, which enable you
to fully customize OptionStation’s price modeling and position search calculations.
This chapter first reviews how OptionStation uses the Price Modeling Engine to process
the data it receives from the GlobalServer, derive the modeled values, and prepare the
data for analysis. The chapter then describes the OptionStation-specific reserved words,
providing contextual examples to create OptionStation indicators, Search Strategies, and
models.
Included with the explanation of the reserved words are descriptions of the Position
Search Engine and Price Modeling Engine, so you’ll understand the effect of your
EasyLanguage instructions on the Engines’ calculations.
In This Chapter
OptionStation Data Analysis ......... 194
Writing Search Strategies ..............215
Reading OptionStation Data.......... 195
Writing OptionStation Models.......223
Writing OptionStation Indicators .. 204
OptionStation Global Variables.....235
Writing Indicators for
SuperCharts SE.............................. 208
194
OptionStation Data Analysis
CHAPTER 5
OptionStation Data Analysis
When developing indicators, Search Strategies, and models in OptionStation, it is necessary to understand how OptionStation processes the data it receives from the GlobalServer,
how it performs its calculations, and what data is available to you at what point during the
calculations. The OptionStation data analysis process occurs in three general steps, as
shown in Figure 5-1.
Figure 5-1. OptionStation data analysis process
First, any new data for the underlying asset and options currently being analyzed is passed
from the GlobalServer into OptionStation. This is the beginning of the data analysis process
and therefore considered Step 1.
Automatically, as soon as any new data is received by OptionStation, the OptionStation
Price Modeling Engine calculates the necessary modeled values and prepares all data for
analysis. The modeled values calculated are the Market Implied Volatility (MIV) on Close,
MIV on Bid, and MIV on Ask; the volatility, theoretical, and greek values for all options
being analyzed; the modeled Bid and Ask values for the options; and the MIV for the modeled Bid and Ask values. This automatic process is considered Step 2. It is a resource-intensive step because the values are being calculated for the underlying asset(s) chosen for
analysis and all the options included in the analysis.
Pricing, Volatility, and/or Bid/Ask Models are used during Step 2. The Price Modeling
Engine is described in detail in the section of this chapter titled, “Writing OptionStation
Models.”
Step 3 occurs when you run a Position Search or open an OptionStation Position Analysis
window. During the Position Search, any Search Strategies selected are executed using data
from the GlobalServer and the values calculated in Step 2. Similarly, when you open a
Position Analysis window, all indicators are executed using the data from the GlobalServer
and the values calculated in Step 2.
What this means is that when you write OptionStation indicators, Search Strategies and/or
models, you have to keep in mind what data is available. For example, you cannot reference
position information when you’re writing a Pricing, Volatility, or Bid/Ask Model, because
positions are not established until Step 3. The table in Figure 5-2 shows the availability of
EasyLanguage for OptionStation
Reading OptionStation Data
195
data in different OptionStation EasyLanguage documents (Indicator, Search Strategy,
Pricing Model, Volatility Model, or Bid/Ask Model).
Figure 5-2. OptionStation data availability
Keep the information in the above table in mind when you write your indicators, Search
Strategies, and/or models to ensure that you reference data that is available.
Reading OptionStation Data
The previous section provides an overview of the order in which OptionStation performs
its calculations and what data is available to you at each stage. There is a tremendous
amount of information available to you, and depending on the OptionStation
EasyLanguage document (Indicator, Search Strategy, Pricing Model, Volatility Model,
or Bid/Ask Model) you are creating, you can refer to information on the underlying asset,
option, and/or position.
To enable you to manage the vast amount of information available, OptionStation
EasyLanguage provides reserved words that act as qualifiers to enable you to specify
whether you want to refer to information on the underlying asset, option, or position.
For instance, to calculate the intrinsic value of an option, you retrieve the strike price of
the option as well as the closing price of the underlying asset. In this case, you need to
specify that you want to refer to the closing price of the underlying asset as opposed to
the close of the option. The way to do this is by using the reserved words outlined next
as qualifiers (or data aliases).
The reserved words you can use as qualifiers are listed next, grouped by the type of
information they provide: asset, option, or position.
196
Reading OptionStation Data
CHAPTER 5
Asset Information
EasyLanguage enables you to reference, through a set of reserved words, the
information related to the underlying asset being analyzed. These reserved words are
available when working with all OptionStation EasyLanguage documents (Indicator,
Search Strategy, Pricing Model, Volatility Model, or Bid/Ask Model).
Asset
This reserved word is used as a qualifier, or data alias, to reference information for the
underlying asset (stock or index) of the option being analyzed.
Syntax:
Value of asset
Parameters:
None.
Value is any value you can obtain for the underlying asset; for example, a piece of
information such as the closing price, trade volume, etc. Of is a skip word that makes the
expression easier to read.
Notes:
This reserved word is for use with stocks and indexes. For referencing futures, use Of
Future or Of Future(num). If you use Of Asset to refer to a future contract, OptionStation
will obtain the information for the same series future contract only.
Example:
The following expression refers to the last closing price of the underlying asset:
Close of asset
The following expression obtains the 10-bar average of the volume of the underlying
asset:
Average(Volume of asset, 10)
Future
This reserved word is used as a qualifier, or data alias, to reference information for the
underlying asset when analyzing options on future contracts.
Syntax:
Value of future
Parameters:
None.
Value is any value you can obtain for the underlying asset; for example, a piece of
information such as the closing price, trade volume, etc. Of is a skip word that makes the
expression easier to read.
EasyLanguage for OptionStation
Reading OptionStation Data
197
Notes:
See notes for Future(num)
Example:
The following expression refers to the last closing price of the underlying asset:
Close of future
The following calculates the 10-bar average of the volume of the underlying asset:
Average(Volume of future, 10)
Future(num)
This reserved word is used as a qualifier, or data alias, to reference information for a
specific future contract, not just the future contract being analyzed.
Syntax:
Value of future(num)
Parameters:
Num is a numeric expression representing the future contract to which the expression is
referring.
Value is any value you can obtain for the future contract, for example, a piece of
information (e.g., closing price, volume, expiration date). Of is a skip word that makes
the expression easier to read.
Notes:
When you apply an indicator to the Assets or Options section of the Position Analysis
window, the indicator references the future contract in the row to which it is applied.
However, you can reference information for any of the available future contracts, using
the reserved word Of Future(num).
For example, assume you have three future contracts listed in the Assets section of your
Position Analysis window. If you use the qualifier Of Future in your indicator, the
calculations will reference only the future contract in the row to which the indicator is
applied. However, when you use Of Future(num), the indicator can reference any future
contract being analyzed.
Likewise, when we apply the indicator to the Options section of the window, if we use
Of Future(num), we can refer to the future contract underlying the option in the row to
which the indicator is applied or to any future contract being analyzed.
When OptionStation obtains the future contracts from the GlobalServer, it numbers them
arbitrarily, from 1 through n. Therefore, to refer to a particular contract, you must first
determine what number OptionStation has assigned to it. The only identifying
characteristic of a future contract is its expiration date, which means you can use the
reserved word ExpirationDate to find specific contracts.
For example, if you know the expiration date for the future contract you want to refer to,
you can find the number assigned to it using the following instructions:
198
Reading OptionStation Data
CHAPTER 5
For Value1 = 1 To NumFutures of asset Begin
If ExpirationDate of future = ExpirationDate of
future(Value1) Then Value2 = Value1;
End;
When the loop is done, the variable Value2 will contain the number assigned by
OptionStation to the future contract, and you can use it in place of the num parameter.
The examples here use the reserved word NumFutures, which is described next.
Or, we can find the front contract (the one that will expire next) by looking for the
future contract that is closest to current date. We can find the future contract with the
smallest number when we subtract the current date from the expiration date.
Variables: OurNumber(0), Counter(0) ;
Value1 = DateToJulian(ExpirationDate of future(1)) –
DateToJulian(CurrentDate);
For Counter = 1 To NumFutures of asset Begin
If DateToJulian(ExpirationDate of future(Counter)) –
DateToJulian(CurrentDate) < Value1 Then Begin
Value1 = DateToJulian(ExpirationDate of
future(Counter)) – DateToJulian(CurrentDate);
OurNumber = Counter;
End;
End;
First, we declare our two variables, OurNumber and Counter. We also use a
predeclared variable Value1.
We then subtract the current date from the expiration date of the future assigned
number 1 and assign the result to the variable Value1.
Then, using a For loop, we subtract the current date from the expiration date of each
future contract available (1 through NumFutures), and compare the result to the value
in Value1. If the result is less than the value in Value1, then a new value is assigned to
Value1 and the number for the future contract is assigned to OurNumber.
When the loop is done, the variable OurNumber will contain the number assigned by
OptionStation to the front future contract.
Note: OptionStation depends on the GlobalServer to mark options ‘expired’. The
GlobalServer marks symbols as expired during Nightly Maintenance. Allowing Nightly
Maintenance to run each night as scheduled will ensure all expired options are marked
as such and therefore not included in the analysis.
EasyLanguage for OptionStation
Reading OptionStation Data
199
Example:
The following refers to the closing price of the first future contract listed:
Close of future(1)
The following obtains the highest high of the last 10 bars of the second future contract:
Highest(High of future(2), 10)
NumFutures
This reserved word is not a data alias, but returns the total number of future contracts
loaded in the current Position Analysis window.
Syntax:
NumFutures data alias
Parameters:
None; however, you must use the data alias Of Asset (where Of is a skip word that makes
the expression easier to read).
Notes:
When NumFutures returns a value of 0, it means the underlying asset is a stock or
index.
Example:
You can use the NumFutures reserved word to traverse through all available future
contracts using a For loop. As described with the reserved word Futures(num), the
following instructions enable you to find the number OptionStation assigns to a specific
futures contract when you know its expiration date:
For Value1 = 1 to NumFutures of asset Begin
If ExpirationDate of future = ExpirationDate of
future(Value1) Then Value2 = Value1;
End;
200
Reading OptionStation Data
CHAPTER 5
Option Information
EasyLanguage enables you to reference, through a set of reserved words, information
related to the options being analyzed. These reserved words are available when
working with all OptionStation EasyLanguage documents (Indicator, Search Strategy,
Pricing Model, Volatility Model, or Bid/Ask Model) as specified in Figure 5-2 on page
195.
Option
This reserved word is used as a qualifier, or data alias, to reference the information for the
option being analyzed.
Syntax:
Value of option
Parameters:
None.
Value is any value you can obtain for the option; for example, a calculated function or a
piece of information such as the closing price, strike price, etc. Of is a skip word that
makes the expression easier to read.
Notes:
When used in an indicator applied to the Options section of the Position Analysis window,
the instructions will apply to the single option in each row to which the indicator is applied.
The instructions apply to the specific option being analyzed. To reference an option other
than the one currently being analyzed, use Of Option(num), which is described next.
Example:
The following calculates the intrinsic value of a call:
Value1 = Strike of option - Close of asset;
Option(num)
This reserved word is used as a qualifier, or data alias, to reference the information for a
specific option. It enables you to reference the values of any available option, not just the
option being analyzed.
Syntax:
Value of option(num)
Parameters:
Num is a numeric expression representing the option to which the expression is referring.
Value is any value you can obtain for the option; for example, a piece of information such
as the closing price, strike price, etc. Of is a skip word that makes the expression easier
to read.
EasyLanguage for OptionStation
Reading OptionStation Data
201
Notes:
When OptionStation obtains the options from the GlobalServer, it numbers them
arbitrarily, from 1 through n. Therefore, to refer to a particular option, you must first
determine what number OptionStation has assigned to it. The identifying characteristics
of an option are the expiration date, type of option, and the strike price; therefore, you
can use the reserved words ExpirationDate, OptionType, and Strike to identify the
number assigned to an option.
For your convenience, OptionStation provides two user functions designed to determine
the number assigned to an option, OS_FindCall and OS_FindPut. Please refer to the
Function Library in the Online User Manual for information on these user functions.
Example:
The following instructions return a summation of the open interest for all Put options:
For Value1 = 1 To NumOptions of asset Begin
If OptionType of option(Value1) = Put Then
TotalPutI = TotalPutI + OpenInt of option(Value1) ;
End ;
The IF-THEN statement within the loop adds the open interest of all put options being analyzed, and stores the result in the variable TotalPutI. The above example uses the reserved
word NumOptions, which is described next.
NumOptions
This reserved word is not a data alias; it returns the total number of options being
analyzed.
Syntax:
NumOptions of asset
Parameters:
None; however, you must use the data alias Of Asset (where Of is a skip word that makes
the expression easier to read).
Example:
The following instructions traverse through all available options using a For loop; in this
case, the loop adds the open interest for all Put options and stores them in the variable
TotalPutI.
For Value1 = 1 To NumOptions of asset Begin
If OptionType of option(Value1) = Put Then
TotalPutI = TotalPutI + OpenInt of option(Value1) ;
End;
202
Reading OptionStation Data
CHAPTER 5
Position Information
EasyLanguage also offers the possibility of referencing position-related information,
through a set of reserved words that will allow the manipulation of both position and
position leg-related information. These reserved words are available when working
with Search Strategies and indicators specifically written for the Positions section of
the Position Analysis window.
Position
This reserved word is used to reference the information for the position being analyzed.
You cannot reference another position, only the position in the row in the Position
Analysis window to which the indicator is applied.
Syntax:
Value of position
Parameters:
None.
Value is any value you can obtain for the position; for example, a piece of information
such as the Delta value. Of is a skip word that makes the expression easier to read.
Example:
The following statement assigns the delta of the position to the variable Value1:
Value1 = Delta of position;
Leg(num)
This reserved word is used to reference information for any leg of the position being
analyzed.
Syntax:
Value of leg(num)
Parameters:
Num is a numeric expression representing the leg of the position to which the expression
is referring.
Value is any value you can obtain for the leg; for example, a piece of information such
as the expiration date, strike price, etc. Of is a skip word that makes the expression easier
to read.
Notes:
Legs are numbered arbitrarily, from 1 through n. To reference a specific leg, you need to
first determine which number is assigned to the leg you want to analyze. To do so, use
the expression LegType of Leg(num), Strike of Leg(num), or ExpirationDate of Leg(num)
to determine which option comprises the specific leg.
Example:
The following Search Strategy will create a position that consists of writing a call and buying
EasyLanguage for OptionStation
Reading OptionStation Data
203
a second call. The Of Leg(num) qualifier is used to compare the strike prices of the two legs
being evaluated:
CreateLeg(1, Call);
CreateLeg(-1, Call);
Condition1 = Strike of leg(1) < Strike of leg(2) – 10 ;
PositionStatus(Condition1) ;
For information on Search Strategies, see the section later in this chapter, titled
“Writing Search Strategies.”
ModelPosition
This reserved word is used to reference information for the modeled positions built when
a Position Search is run. This reserved word is available only when writing Search
Strategies.
Syntax:
Value of ModelPosition
Parameters:
None.
Value is any value you can obtain for the modeled position; for example, a calculated
function or a piece of information such as the theoretical value. Of is a skip word that
makes the expression easier to read.
Notes:
This information is used when evaluating the criteria in a Search Strategy to determine
whether or not to include the position in the search results.
Example:
The following statement obtains the Delta of the modeled position and assigns it to the
variable Value1:
Value1 = Delta of ModelPosition;
NumLegs
This reserved word returns the number of legs in the position being analyzed. It enables
you to know exactly how many legs are open at any point in time.
Syntax:
NumLegs data alias
204
Writing OptionStation Indicators
CHAPTER 5
Parameters:
None; however, you must specify Of Position or Of ModelPosition (Of is a skip word that
makes the expression easier to read).
Example:
The following loop adds the total cost of all legs in a position and stores the result in the
variable Sum:
Variable: Sum(0);
For Value1 = 1 To NumLegs of position Begin
Sum = Sum + Cost of leg(Value1);
End;
Writing OptionStation Indicators
An indicator is a mathematical formula that returns a value. These values are displayed
either in a grid, like in the OptionStation Position Analysis window, or in a price chart.
This section first covers writing indicators for the Position Analysis window, and then discusses writing indicators for price charts.
In the Position Analysis window, shown in Figure 5-3, you have three sections available
for your analysis: the Assets section, the Options section, and the Positions section.
The Assets section refers to the underlying asset (or assets) used as the basis for the
analysis window, the Options section includes information on all of the options available
in the GlobalServer for the asset(s), and the Positions section includes all the information
about any position(s) added to the Position Analysis window. You can write indicators
EasyLanguage for OptionStation
Writing OptionStation Indicators
205
to use data from any of the three sections in order to calculate and display custom
information.
Assets
ts
sts
Figure 5-3. OptionStation Position Analysis window
Since all of the information on the underlying asset(s), options, and option positions is
available to you through EasyLanguage, you can create OptionStation indicators that use
any of this information.
However, if you apply an indicator referencing position information to the Assets or Options sections of the Position Analysis window, you will obtain zero values. You cannot reference position information from the Assets or Options sections. Due to the nature of the
Position Analysis window, it is of no analytical value to reference position information in
the Assets or Options sections; therefore, OptionStation does not allow it.
The next section describes the reserved words used to create indicators.
206
Writing OptionStation Indicators
CHAPTER 5
Plot Statements
The reserved words used to create indicators result in statements referred to as plot
statements because they control how information is displayed, or plotted, either in a grid
(the Position Analysis window) or in a price chart.
PlotNum(Expression, "PlotName", ForeColor, BackColor)
Displays values, resulting from a mathematical calculation or an expression, in a price
chart or grid. For price charts, the values displayed can be only numeric, whereas for
the Position Analysis window, the values can be numeric, true/false, or string.
Syntax:
PlotNum( Expression [, "<PlotName>" [, ForeColor [, BackColor]]] );
Parameters:
Num is a number between 1 and 4, representing one of the four available plots. Expression
is the value that will be plotted, and <PlotName> is the name of the plot. ForeColor is an
EasyLanguage color that will be used for the plot foreground, and BackColor is an EasyLanguage color that will be used for the plot background. The parameters <Plot Name>,
ForeColor, and BackColor are optional.
For a list of the available colors, refer to Appendix B of this book.
Notes:
The background color setting has no effect when the indicator is applied to a price chart.
Notes:
There is a category of reserved words called Quote Fields. These words enable you to access snapshot information from the datafeed, and allows indicators applied to OptionStation to use less memory and be more efficient; in other words, to optimize its performance.
They are very useful for performing analysis on intraday minute and tick bars and referencing the current day’s information (e.g., daily high, low, open). For information on Quote
Fields, refer to Chapter 2, “The Basics EasyLanguage Elements.”
Example:
Any one or more of the optional parameters can be omitted, as long as there are no other
parameters to the right. For example, the Width parameter can be excluded from a statement, as follows:
Plot1(Strike of option, “Strike”, Black, White);
But the plot name cannot be omitted while specifying the colors and/or the width. So the
following example will generate a syntax error because the name of the Plot statement is
expected:
Incorrect:
Plot1(Strike of option, Black, White, 2);
Correct:
Plot1(Strike of option, “Strike”, Black, White, 2);
The only required parameter is the value that is plotted. So the following statement is valid:
EasyLanguage for OptionStation
Writing OptionStation Indicators
207
Plot1(Strike of option);
When no plot name is specified, EasyLanguage assigns Plot1, Plot2, Plot3, or Plot4, in that
order, as the plot names for each respective plot.
Whenever referring to the foreground color, background color, or the width, the word Default can be used in place of the parameter(s) to have the Plot statement use the default color
and/or width selected in the Properties tab of the Format indicator dialog box.
For example, the following statement can be used in order to display the strike price of an
option with the default foreground and a yellow background:
Plot1(Strike of option, “Strike”, Default, Yellow);
The same plot number (i.e., Plot1, Plot2, etc.) can be used more than once in an analysis
technique; the only requirement is that you use the same plot name in both instances of the
Plot statement. If no name is assigned, then the default plot name is used (Plot1, Plot2, etc.).
For example, if you want to plot the net change using red when it is negative and green
when it is positive, you can use the same plot number (in this case Plot1) twice, as long as
the name of the plot is the same.
Value1 = TheoreticalValue of option - Close of option;
If Value1 > 0 Then
Plot1( Value1, “TValue”, Green)
Else
Plot1( Value1, “TValue”, Red);
In this example, the plot name “TValue” has to be the same in both instances of the Plot
statement.
SetPlotColor(PlotNumber, Color)
This reserved word is used to change the foreground or plot color of a particular plot,
and can be used when applying indicators to a price chart or a Position Analysis window.
Syntax:
SetPlotColor(PlotNumber, Color);
Parameters:
PlotNumber is a number from 1 to 4 representing the number of the plot to modify. Color
is the EasyLanguage color to be used for the plot.
Notes:
This reserved word changes the color of the plot; the reserved word described next,
SetPlotBGColor, changes the background color of the plot (for use only with the Position
Analysis window).
For a list of the available colors, refer to Appendix B of this book.
208
Writing OptionStation Indicators
CHAPTER 5
Example:
The color of the plot can be changed for each price; for example, if the indicator value is
negative, the plot can be displayed in red, and when the indicator value is positive, the
plot can be displayed in green. The following statements show how to modify the color
of an indicator; in this case, the Momentum Indicator:
Plot1(Momentum(Close of asset, 10), “Momentum”);
If Plot1 > 0 Then
SetPlotColor(1, Green)
Else
SetPlotColor(1, Red);
SetPlotBGColor(PlotNumber, Color)
This reserved word is used to change the background color of the cell where the value
of the plot is displayed. This reserved word works only when the indicator is applied to
the Position Analysis window; it is ignored when applied to a price chart.
Syntax:
SetPlotBGColor(PlotNumber, Color);
Parameters:
PlotNumber is a number from 1 to 4 identifying the plot to modify, and Color is the
EasyLanguage color to be used for the background of the cell.
Notes:
The color of the plot can be set as you create the plot, by using the reserved word
PlotNum; this reserved word is used to change the color on a value by value basis. For
example, if a symbol is overpriced, an indicator can change the background color of
the cell to red, when a symbol is underpriced, the indicator can change it to green.
For a list of the available colors, refer to Appendix B of this book.
Example:
The following statements color the background of the cell red when the RSI Indicator
is over 75, and green when it is under 25:
Plot1(RSI(Close of asset, 9), “RSI”) ;
SetPlotBGColor(1, Default);
If RSI(Close of asset, 9) > 75 Then SetPlotBGColor(1, Red);
If RSI(Close of asset, 9) < 25 Then SetPlotBGColor(1, Green);
In this example, the RSI Indicator has three possible colors: red when it is over 75,
green when it is below 25, and the default color when it is between 25 and 75. If you
only set two colors, one for over 75 and one for under 25, it would remain one of the
two colors (which ever it was set to last) when it is between 25 and 75. What you need
to do is reset the plot color to a default color every bar so that it is only red when above
75 and green when below 25. The rest of the time it is the default color. In this example,
we used the SetPlotBGColor reserved word to reset the plot to the default color.
EasyLanguage for OptionStation
Writing Indicators for SuperCharts SE
209
You can also set the default color of the plot using the PlotNum reserved word. If you
set the default color in the PlotNum statement, then you don’t have to use the first
SetPlotBGColor statement; instead your instructions would be as follows:
Plot1(RSI(Close of asset, 9), “RSI”, Default, Default) ;
If RSI(Close of asset, 9) > 75 Then
SetPlotBGColor(1, Red);
If RSI(Close of asset, 9) < 25 Then
SetPlotBGColor(1, Green);
Writing Indicators for SuperCharts SE
This section discusses how to write indicators for use with SuperCharts SE, and is
intended only for those who have purchased OptionStation only, in which case, you
have SuperCharts SE available for your charting and technical analysis needs. Please
review the section titled, “Writing OptionStation Indicators,” and then continue with
this section.
If you purchased Omega Research ProSuite or TradeStation, you will have
TradeStation available for your charting and trading strategy testing needs, and you
should refer instead to the chapter of this book titled, “EasyLanguage for
TradeStation,” for information on writing trading signals, indicators, and studies for
use with TradeStation.
210
Writing Indicators for SuperCharts SE
CHAPTER 5
Writing Indicators
Indicators calculate a mathematical formula and display their values on a chart. When
you apply an indicator to a price chart, you can format the indicator to display their
values in different ways; for example, as shown in Figure 5-4, you can format the
indicator to display as a line chart, as a histogram from the bottom of the chart, or as a
series of dots, etc.
Figure 5-4. Different forms of indicators
You can even format the properties of an indicator to display as a bar chart. For
example, in the case of an indicator with three plots, such as the 3-Line Moving
Average Indicator, you can format the indicator and set one plot to bar high, another
to bar low and another to right tick The 3-Line Moving Average indicator displayed as
a bar chart is shown in Figure 5-5.
EasyLanguage for OptionStation
Writing Indicators for SuperCharts SE
211
Figure 5-5. Indicator formatted to display as a bar chart
For more information on formatting indicators, please refer to the Online User Manual.
Also, make sure you understand the concept of scaling with respect to price charts and
indicators. Using different scaling can dramatically alter the display of your indicators.
For information on scaling, search the Online User Manual Answer Wizard for
Indicator Formatting.
You use two of the same plot statements to create an indicator for use in a price chart
as you do for use in the OptionStation Position Analysis window, PlotNum and
SetPlotColor; however, there are some parameters for these plot statements that apply
only when working with price charts. Therefore, the plot statements are discussed
again, this time with the focus on the parameters and considerations that apply when
working with price charts.
PlotNum(Expression, “<PlotName>” , ForeColor, BackColor, Width)
Displays values, resulting from a calculation or an expression, in a price chart. For price
charts, the values displayed can only be numeric.
Syntax:
PlotNum(Expression[,“<PlotName>”[,ForeColor,[BackColor,[,Width]]]]);
Parameters:
N is a number between 1 and 4, representing one of the four available plots. Expression is
the numeric value that will be plotted, and <PlotName> is the name of the plot. ForeColor
is an EasyLanguage color that is used for the plot, BackColor specifies the background color (for use only with the OptionStation Position Analysis and RadarScreen windows), and
Width is a numeric value representing the width of the plot. The parameters <PlotName>,
ForeColor, BackColor, and Width are optional.
212
Writing Indicators for SuperCharts SE
CHAPTER 5
For a list of the available colors and widths, refer to Appendix B of this book.
Notes:
The BackColor parameter has no effect when plotting the indicator in a price chart window;
however, it is required in order to specify a width, as discussed in the example.
Example:
Any one or more of the optional parameters can be omitted, as long as there are no other
parameters to the right. For example, the BackColor and Width parameters can be excluded
from a statement as follows:
Plot1( Volume, “V”, Black);
But the plot name cannot be omitted if you want to specify the plot color and width. For
instance, the following example generates a syntax error because the name of the plot statement is expected:
Incorrect:
Plot1( Volume, Black, White, 2);
Correct:
Plot1( Volume, “V”, Black, White, 2);
The only required parameter for a valid Plot statement is the value that will be plotted. So
the following statement is valid:
Plot1(Volume);
When no plot name is specified, EasyLanguage will use Plot1, Plot2, Plot3, or Plot4 as the
plot names for each plot. The first plot will be named Plot1, the second Plot2 and so on.
Whenever referring to the plot color or width, you can use the word Default in place of the
parameter(s) to have the Plot statement use the default color and/or width selected in the
Properties tab of the Format indicator dialog box.
For example, the following statement can be used to display the volume in the default color
but a specific width:
Plot1( Volume, “V”, Default, Default, 3);
Again, you can use the word Default for the color parameters or the width parameter.
Also, the same plot (i.e., Plot1, Plot2) can be used more than once in an analysis technique;
the only requirement is that you use the same plot name in both instances of the Plot statement. If no name is assigned, then the default plot name is used (i.e., Plot1, Plot2).
For example, if you want to plot the net change using red when it is negative and green
when it is positive, you can use the same plot number (in this case Plot1) twice, as long a
the name of the plot is the same:
EasyLanguage for OptionStation
Writing Indicators for SuperCharts SE
213
Value1 = Close - Close[1];
If Value1 > 0 Then
Plot1( Value1, “NetChg”, Green )
Else
Plot1( Value1, “NetChg”, Red );
In this example, the plot name “NetChg” must be the same in both instances of the Plot
statement.
Note: Once you have defined a plot using the PlotNum reserved word, you can
reference the value of the plot simply by using the reserved word, PlotNum. In the
example below, the reserved word Plot1 is used to plot the accumulation distribution
of the volume. The value of the plot is referenced in the next statement, in order to write
the alert criteria:
Plot1(AccumDist(Volume), "AccumDist") ;
If Plot1 > Highest(Plot1, 20) then Alert ;
SetPlotColor(Number, Color)
This reserved word is used to change the color of a particular plot in a price chart
window.
Syntax:
SetPlotColor(Number, Color);
Parameters:
Number is a number from 1 to 4 representing the number of the plot to modify. Color is
the EasyLanguage color to be used for the plot.
For a list of the available colors, refer to Appendix B of this book.
Example:
The following EasyLanguage statements color the plot red when the RSI Indicator is
over 75, and green when it is under 25:
Plot1(RSI(Close, 9), “RSI”) ;
SetPlotColor(1, Default);
If Plot1 > 75 Then
SetPlotColor(1, Red);
If Plot1 < 25 Then
SetPlotColor(1, Green);
In this example, the RSI Indicator has three possible colors: red when it is over 75,
green when it is below 25, and the default color when it is between 25 and 75.
214
Writing Indicators for SuperCharts SE
CHAPTER 5
If you only set two colors, one for over 75 and one for under 25, it would remain one
of the two colors (which ever it was set to last) when it is between 25 and 75.
What you need to do is reset the plot color to a default color every bar so that it is only
red when above 75 and green when below 25. The rest of the time it is the default color.
In this example, we used the SetPlotColor reserved word to reset the plot to the default
color.
You can also set the default color of the plot using the PlotNum reserved word. If you
set the default color in the PlotNum statement, then you don’t have to use the first
SetPlotColor statement; instead your instructions would be as follows:
Plot1(RSI(Close, 9), “RSI”, Default) ;
If Plot1 > 75 Then
SetPlotColor(1, Red);
If Plot1 < 25 Then
SetPlotColor(1, Green);
SetPlotWidth(Number, Width)
This reserved word sets the width of the specified plot.
Syntax:
SetPlotWidth(Number, Width);
Parameters:
Number is a number from 1 to 4 representing the number of the plot to modify. Width is
the EasyLanguage width to be used for the plot.
For a list of the available widths, refer to Appendix B of this book.
Example:
The following EasyLanguage statements change the width of the plot to a thicker line
when the Momentum Indicator is over 0, and to a thinner line when it is under 0:
Plot1(Momentum(Close, 10), “Momentum”) ;
If Plot1 > 0 Then
SetPlotWidth(1, 2);
If Plot1 < 0 Then
SetPlotWidth(1, 6);
In this example, the Momentum Indicator has two possible widths: thicker when it is
over 0, and thinner when it is below 0. However, in some cases you will want the
indicator to have three or more possible widths. Please refer to the example for the
previous reserved word, SetPlotColor for a variation on the usage of the reserved word.
The same applies for SetPlotWidth.
EasyLanguage for OptionStation
Writing Search Strategies
215
Specifying Availability of Indicators
When you create an indicator in the EasyLanguage PowerEditor, you are prompted to
specify the applications (i.e., price chart, Position Analysis window) for which your
indicator will be available. By available, we mean it will appear in the library of
indicators to apply when you choose to insert an indicator into the application.
The choices available to you depend on which Omega Research product(s) you
purchased. For example, if you purchased Omega Research ProSuite, by default, the
indicator will be available in TradeStation charts, RadarScreen, and all sections of the
Position Analysis window.
For information on specifying the applications for which your indicator is available,
search the Online User Manual Answer Wizard for the phrase Specifying Applications.
Writing Search Strategies
The OptionStation Position Search Wizard allows you to search through all available
options for those that meet your criteria and rank them in order of theoretical
profitability based on your market assumptions. One criteria you must specify before
completing the Position Search Wizard is a Search Strategy. The Position Search
Wizard provides many built-in Search Strategies—Bear or Bull Credit Spreads,
Butterfly Calls, Straddles, Strangles, etc.—but you can also create your own for use in
the Position Search Wizard.
In order to create a Search Strategy, you must first understand how the Position Search
Engine works.
216
Writing Search Strategies
CHAPTER 5
The Position Search Engine
The OptionStation Position Search Engine obtains and evaluates every possible combination of options based on the assumptions and the Search Strategy or Strategies you’ve specified in the Position Search Wizard. It then lists the positions found (up to 50) sorted in
order of theoretical profitability.
For example, let’s assume we used a Search Strategy that specifies writing one call and
three puts with Delta close to neutral, and we are analyzing Microsoft options.
Microsoft is at 95, and we think it will not move much from here to December 17 (the
expiration date we specified).
We want the Delta as close to delta neutral as possible because we think MSFT will not
move, but if it does, the calls and puts will not change much in value and hopefully will
expire either at a lower price than we sold them for, or worthless (leaving us with at
least the money we got up front as the premium).
When we run the Position Search, the OptionStation Position Search Engine will go
through every combination of one call versus three puts and do the following process
on each, one at a time:
1.
Run through the Search Strategy and determine if it evaluates to True. In other words,
see if the current combination of one call and three puts it meets the criteria specified
by the Search Strategy. If not, it will obtain a different combination of one call versus
three puts and evaluate again until it finds a position that meets the criteria
2.
As soon as it finds a position that meets the criteria of the Search Strategy, the four
options making up the position are run through the Price Modeling Engine using
the current values (date, time, price and volatility) of the underlying symbol in
order to find all the values the models offer for each one of the four options. Then
a position is established by buying (on the modeled ask) or selling (on the modeled
bid) each one of the legs of the position.
3.
Then, the Position Search Engine calls the Price Modeling Engine and runs the
position through it using the search assumptions (date, time, price and volatility)
for the underlying symbol in order to find all the values the models offer. Then the
position is exited by selling (on the modeled bid) or buying (on the modeled ask)
each one of the legs. Subtracting this from the values obtained in Step 2 (minus
commission) results in the theoretical profit of the position based on the
assumptions.
4.
The results for this position are saved in the Position Search report if it is one of
the 50 most profitable.
If there are more option combinations to test, the Position Search Engine begins again
at Step 1. Once there are no more option combinations to test, OptionStation lists up to
fifty (50) of the most profitable positions (theoretically) in the Position Search window.
Three of the more important dialog boxes of the Position Search Wizard are discussed next:
the Holding Period, Volatility, and Underlying Target Price.
EasyLanguage for OptionStation
Writing Search Strategies
217
The Holding Period
The objective of a Position Search is to find the best position, based on some price and
volatility assumptions, at a specific point in time. This point in time can be the present,
or any other date in the future. The first dialog box of the Position Search Wizard, the
Holding Period dialog box, shown in Figure 5-6, enables you to specify the date on
which the valuation of the positions will be performed.
Figure 5-6. OptionStation Position Search Wizard holding period
You have three choices:
Close the position at the end of the session on the nearest expiration date
Close the position after X day(s) at the end of the session
Close the position at a specific date and time (local time)
Your choice gives OptionStation a specific date to work with to calculate the valuation of
all positions.
Volatility
Volatility is defined as a measure of the amount by which an underlying asset is
expected to fluctuate in a given period of time. It is generally measured by the annual
standard deviation of the daily price changes in the asset. Volatility is an important
factor in working with accurate options data.
218
Writing Search Strategies
CHAPTER 5
You have three choices when specifying the volatility to use during the Position
Search. They are shown in Figure 5-7.
Figure 5-7. OptionStation Position Search Wizard volatility assumptions
Use current volatility for each underlying asset
OptionStation will use the volatility obtained from the OptionStation Price Modeling Engine calculated using the most current data available.
Use a volatility range of X% above and below the current volatility
OptionStation uses the percentage specified above and below the current volatility (obtained from the Price Modeling Engine) and calculates the profitability of each position using the high and low volatility values.
Specify a range of volatility for each underlying asset
You select the high and low values for the range of volatility expected during the holding
period. OptionStation calculates the profitability of each position using these high and low
values.
Underlying Asset Target Price
In the Underlying Asset Target Price dialog box, you specify the expected movement
of the underlying asset during the holding period specified. The OptionStation Search
Engine then values each position’s profit at the ending date and time of the holding
period, using the volatility and price assumptions specified.
EasyLanguage for OptionStation
Writing Search Strategies
219
Your three target price assumption choices are shown in Figure 5-8:
Figure 5-8. OptionStation Position Search Wizard - target price assumptions
Use the current price as the target price for each underlying asset
The OptionStation Search Engine uses the current price of the underlying asset as the
target price at the end of the holding period.
Use a price target for each asset X% above/below the current price
The OptionStation Search Engine uses the specified percent above or below the current
price of the underlying asset as the target price at the end of the holding period to value
the profit or loss of each position.
Specify a target price style and a target price range for each underlying asset
The following are available under this choice:
Exactly Price 1
The OptionStation Search Engine uses the specified price with the volatility
assumptions at the end of the holding period to value the profit or loss of each
position.
Price1 to Price2
This setting accepts a target price range instead of a single value. The
OptionStation Search Engine divides the specified range by 100, and values
each position on each one of the 100 prices.
For example, if the search is to look for the bullish limited risk Search Strategy
with the best profit, and the position will be held 30 days, assuming that
current volatility will be maintained and the price range expected is between
1330 and 1340, the OptionStation Search Engine will value each bullish
limited risk Search Strategy using an underlying asset price of 1330, then
1330.1, 1330.2, 1330.3, etc. until it reaches 1340. It will call on the Price
220
Writing Search Strategies
CHAPTER 5
Modeling Engine to valuate each position through 100 valid prices in the price
range and will select those with the highest resulting P/L.
If the volatility assumption is also a range, the OptionStation Search Engine
will run through 100 tests for each one of the volatility values. So it will value
each position a total 200 times.
Price1 to Price2 using probability
This works the same as Price1 to Price2 except that when all the resulting 100
values of the test are done, the resulting profit or loss of each test is multiplied
by the probability of the underlying asset reaching that particular target price.
This means that if a particular position is extremely profitable, but the
statistical probability of the underlying asset reaching that level is very low,
the position will be penalized by lowering the resulting P/L in order to favor
other results that have better statistical chances of occurring.
The probability of the underlying asset reaching the specified price is
calculated in the same way as the Probability Calculator Indicator provided
with OptionStation. The following is the calculation performed when the
target price is above the current price:
ExpDays = SquareRoot(NearDays * .002739);
StdD1 = Log(Price1/Close of asset) / (Volatility *
ExpDays);
AnswerH = 1 - NormalSCDensity(StdD1);
And, the following is the calculation performed when the target price is under the
current price:
ExpDays = SquareRoot(NearDays * .002739);
StdD2 = Log(Price2/Close of asset) / (Volatility *
ExpDays);
AnswerL = NormalSCDensity(StdD2);
Where NearDays is the number of days left until the holding period is over, and
NormalSCDensity is the Normal Standard Cumulative Density calculation.
Price1 +/- X volatilities
This method of determining the price assumption is similar to the price range
methodology, only that the high and low values of the price range are determined
by adding and subtracting X number of standard deviations based on the current
volatility of the underlying asset from the target price specified. The same evaluation methodology as described in Price1 to Price 2 is used.
EasyLanguage for OptionStation
Writing Search Strategies
221
Price1 +/- X volatilities using probability
This method of determining the price assumption is similar to the price range
methodology, only that the high and low values of the price range are determined
by adding and subtracting X number of standard deviations based on the current
volatility of the underlying asset from the target price specified. The same evaluation methodology as described in Price1 to Price 2 using probability is used.
222
Writing Search Strategies
CHAPTER 5
Position Search Reserved Words
Every Search Strategy must contain the following two reserved words: CreateLeg and
PositionStatus.
CreateLeg(Contracts, LegType)
This reserved word is used to create a leg for a position.
Syntax:
CreateLeg(Contracts, LegType)
Parameters:
Contracts is the number of contracts, and LegType is Call, Put, or AssetType.
Notes:
Contracts is the number of contracts (or shares) with which this leg will be created. If a positive number is used, then the leg will purchase the specified number of contracts; if a negative number is used, then the leg will sell (or write) the specified number of contracts.
LegType can be Call, Put, or AssetType, and defines what instrument to use for the specific
leg. Call and Put are self-explanatory; AssetType specifies to use shares/contracts of the underlying asset.
Figure 5-9 shows a table with the combination of possible alternatives when working with
the CreateLeg reserved word:
Figure 5-9. CreateLeg variations
Example:
See the example for the reserved word PositionStatus.
EasyLanguage for OptionStation
Writing OptionStation Models
223
PositionStatus(Condition)
This reserved word determines whether or not the position is valid based on your own
criteria, and therefore accepted for evaluation in the Position Search results.
Syntax:
PositionStatus(Condition)
Parameters:
Condition is any true/false expression.
Notes:
When an expression that evaluates to True is passed to this reserved word, the position
is accepted and considered for the search results; if it evaluates to False, the position is
discarded.
Example:
For example, the following instructions are used to create a position that consists of buying only in-the-money calls:
CreateLeg(1, Call);
Condition1 = (Strike of leg(1) < Close of asset);
PositionStatus(Condition1);
Writing OptionStation Models
Writing OptionStation Models (Pricing, Volatility, and Bid/Ask) in EasyLanguage is
more of an exercise in translating the mathematical procedures of calculating these
values into EasyLanguage than anything else. In order to do this, you only need to be
aware of how to read all the option-related data (see the previous section in this chapter
titled, “Reading OptionStation Data”) and EasyLanguage syntax.
This section describes how OptionStation performs its calculations, along with the
reserved words you’ll use to create your own models.
224
Writing OptionStation Models
CHAPTER 5
The Price Modeling Engine
OptionStation uses the Price Modeling Engine for now-analysis and future-time
analysis.
The now-analysis consists of evaluating the Pricing Model using the most current price
information for the underlying asset and all the options, as well as the current date and
time to run through the Price Modeling Engine. This is done primarily in the Position
Analysis window to keep track of the current option chain and positions on a real-time
and/or delayed basis.
The future-time analysis consists of evaluating the Pricing Model using market
assumptions. By changing the date and time, underlying price, or volatility,
OptionStation can determine how much a position may be worth under specific
circumstances. This is done during the Position Search and in the Position Chart
window, where OptionStation finds the best position given a user-specified market
assumption.
The mathematics of Pricing, Volatility, and Bid/Ask Models is very complex and
advanced, and the purpose of this section is to explain how these models are used by
OptionStation, not to explain their rationale or mathematical principles.
In order for a Pricing Model to produce valuable results, it must have all of the following
pieces of information:
1.
2.
3.
4.
5.
Price of the underlying asset
Strike price of the option
Interest rates
Time to expiration of option
Volatility
The price of the underlying asset and the strike price of each option are provided by the
GlobalServer. The interest rates are somewhat of a constant number that can be input into
the OptionStation Pricing Model by the user. The time to expiration of the option is fixed
and therefore easily calculated by OptionStation. Volatility is the value most open to interpretation, as there are several methods used to calculate it, depending on your preference
and the data available.
Once the Price Modeling Engine has received the first four pieces of information, it will
run through the OptionStation models and will derive MIV (Market Implied Volatility) on
raw Bid and Ask; MIV on Last; Theoretical Value of the option; Delta, Gamma, Rho, Theta, Vega; modeled Bid and Ask; MIV on modeled Bid and Ask; and modeled Volatility (not
necessarily in that order).
When the Price Modeling Engine finishes calculating, all this information is available for
the analysis of the options and underlying asset.
The Price Modeling Engine enhances the options data that is sent from the datafeed to the
GlobalServer and OptionStation with all the option-specific data mentioned before. All this
is done through a five-step iterative process, described next.
EasyLanguage for OptionStation
Writing OptionStation Models
225
The Five-Step Iterative Process
The OptionStation Price Modeling Engine calculates all prices through a five-step process.
This process includes three different models: Pricing Model, Volatility Model, and Bid/Ask
Model. Figure 5-10 illustrates this five-step process.
Figure 5-10. OptionStation Five-Step Pricing Model Engine
This process is repeated for every option available to OptionStation at a particular moment.
In other words, OptionStation iterates through this process as many times as there are options in the symbol portfolio for the underlying asset being analyzed.
Step 1: Obtaining MIVs from the Pricing Model
The objective of this step is to find the Market Implied Volatility (MIV) for the raw last,
Bid, and Ask sent by the datafeed for an option. This is an iterative process (as shown in
Figure 5-10) which intelligently picks different volatility values to run the Pricing Model
in order to estimate what volatility is needed to derive a price equaling the last, Bid, and
Ask values received from the GlobalServer.
Therefore, knowing the last traded price of the underlying asset, the strike, and days to expiration of the option, the interest rate and the last traded price of the option,
OptionStation iterates through the Pricing Model, feeding it different volatility values in order to try to approximate as closely as possible the result of the Pricing Model to the last
price transmitted from the datafeed. The same is also done with the Bid and Ask values.
From this process OptionStation derives the MIV on Close, MIV on Bid, and MIV on Ask.
226
Writing OptionStation Models
CHAPTER 5
Step 2: Volatility Model
The objective of this second step is to find the volatility for a particular option. The Volatility Model will calculate the volatility for each option using the raw MIV values derived
in Step 1 and a Newton-Raphson search method using the option’s Vega (for a description
of this method, refer to Option Volatility & Pricing, by Sheldon Natenberg, McGraw-Hill,
1994. Page 446).
Step 3: Pricing Model
The objective of this third step (and second pass through the Pricing Model) is to calculate
the Theoretical Value (TV) of a particular option as well as all its Greek values (Delta,
Gamma, Theta, Rho, and Vega).
Using the underlying asset’s price, strike price, and days to expiration of the option, the interest rates, and the model volatility calculated in Step 2, OptionStation will run through
the Pricing Model and set the Theoretical Value of the option and all its Greek values.
Step 4: Bid/Ask Model
The objective of this fourth step is to calculate modeled Bid and Ask values for the option.
Given that Bid and Ask prices are not always accurately transmitted by the datafeeds, it is
sometimes desirable to have modeled Bid and Ask values.
When a Bid/Ask Model other than raw Bid and Ask is selected, the Bid/Ask Model uses all
the values obtained during the first three steps and calculates smart Bid and Ask values to
replace values transmitted from the datafeed.
Step 5: Obtaining Modeled MIVs with the Theoretical Model
This fifth step (and third pass through the Pricing Model) is done with the intention of calculating the MIV values for the modeled Bid and Ask calculated in Step 4. As in Step 1,
this is an iterative step, where the Volatility Model and Vega are run repeatedly with different values for volatility attempting to find the MIV for the smart Bid and Ask values obtained in Step 4.
EasyLanguage for OptionStation
Writing OptionStation Models
227
Update Logic of the Price Modeling Engine
The five-step process is performed for every option available for the underlying asset. In
other words, OptionStation will run through this process for each and every option available in the GlobalServer for the underlying asset specified.
In spite of all the optimizations in place to speed up this process, performing it for every
option is still a very labor-intensive task. Therefore, OptionStation provides three different
update logic choices, as shown in Figure 5-11.
Figure 5-11. OptionStation Update Logic
They are:
Update all symbols for this underlying when any symbol for this underlying
ticks. All values for all options are calculated whenever there is an update in any
of the underlying asset or option symbols. This is the most labor-intensive mode
of OptionStation and in most instances, it will result in unnecessary calculations
as all modeled values are re-calculated on a constant basis as ticks are received
from the datafeed.
Update each symbol as it ticks or the underlying ticks. This is the
recommended setting; when the specific option ticks, the modeled values are
updated; and when the underlying asset ticks, the modeled values for all options
are updated.
Update each symbol as it ticks. This setting is the least labor-intensive choice;
the modeled values for the specific option are updated when the option ticks. The
modeled values are not updated when the underlying asset ticks.
The three settings above can be based on either every trade tick and on every Bid and Ask
tick that is received from the datafeed, or on both, by selecting the appropriate Calculation
Dependencies check box.
The reserved words used to write your own models are discussed next.
228
Writing OptionStation Models
CHAPTER 5
Model Reserved Words
Most of the Model reserved words function as “set” words, in that they set the different
values for the options (e.g., Theoretical Value, Delta). These same words, when used
in the other EasyLanguage documents, obtain the values rather than set them.
TheoreticalValue(num)
This reserved word is used in the Pricing Model to set the Theoretical Value of the
option. When this reserved word is used in another analysis technique, it is used to
obtain the Theoretical Value of the option.
Syntax:
TheoreticalValue(num)
Parameters:
Num is a numeric expression representing the Theoretical Value of the option. This parameter is needed only when setting the value in the Pricing Model, not when obtaining it.
Example:
For example, when writing a Pricing Model, if the value of the Theoretical Value is stored
in the variable Value1, then the Theoretical Value for the option is set by using:
TheoreticalValue(Value1);
When writing other analysis techniques, use this word to obtain the Theoretical Value
of the option. Example instructions are shown below.
Value1 = TheoreticalValue of option ;
Notice the use of the qualifier Of Option. For information on qualifiers, see the section
earlier in this chapter, titled, “Reading OptionStation Data.”
Delta(num)
This reserved word is used in the Pricing Model to set the Delta of the option. When this
reserved word is used in another analysis technique, it is used to obtain the Delta of the
option.
Syntax:
Delta(num)
Parameters:
Num is a numeric expression representing the Delta of the option. This parameter is needed
only when setting the value in the Pricing Model, not when obtaining it.
Example:
For example, when writing a Pricing Model, if the value of Delta is stored in the variable
Value1, then the Delta for the option is set by using:
Delta(Value1);
EasyLanguage for OptionStation
Writing OptionStation Models
229
When writing other analysis techniques, these instructions obtain the Delta for the
option:
Value1 = Delta of option ;
Notice the use of the qualifier Of Option. For information on qualifiers, see the section
earlier in this chapter, titled, “Reading OptionStation Data.”
Gamma(num)
This reserved word is used in the Pricing Model to set the Gamma of the option. When this
reserved word is used in another analysis technique, it is used to obtain the Gamma of the
option.
Syntax:
Gamma(num)
Parameters:
Num is a numeric expression representing the Gamma of the option. This parameter is needed only when setting the value in the Pricing Model, not when obtaining it.
Example:
For example, if in a Pricing Model the value of Gamma is stored in the variable Value1,
then the Gamma for the option is set by using:
Gamma(Value1);
When writing other analysis techniques, these instructions obtain the Gamma for the
option:
Value1 = Gamma of option ;
Notice the use of the qualifier Of Option. For information on qualifiers, see the section
earlier in this chapter, titled, “Reading OptionStation Data.”
Rho(num)
This reserved word is used in the Pricing Model to set the Rho of the option. When this
reserved word is used in another analysis technique, it is used to obtain the Rho of the
option.
Syntax:
Rho(num)
Parameters:
Num is a numeric expression representing the Rho of the option. This parameter is needed
only when setting the value in the Pricing Model, not when obtaining it.
Example:
For example, if in a Pricing Model the value of Rho is stored in the variable Value1, then
the Rho for the option is set by using:
Rho(Value1);
230
Writing OptionStation Models
CHAPTER 5
When writing other analysis techniques, these instructions obtain the Rho for the
option:
Value1 = Rho of option ;
Notice the use of the qualifier Of Option. For information on qualifiers, see the section
earlier in this chapter, titled, “Reading OptionStation Data.”
Theta(num)
This reserved word is used in the Pricing Model to set the Theta of the option. When this
reserved word is used in another analysis technique, it is used to obtain the Theta of the
option.
Syntax:
Theta(num)
Parameters:
Num is a numeric expression representing the Theta of the option. This parameter is needed
only when setting the value in the Pricing Model, not when obtaining it.
Example:
For example, if in a Pricing Model the value of Theta is stored in the variable Value1, then
the Theta of the option is set by using:
Theta(Value1);
When writing other analysis techniques, these instructions obtain the Theta for the
option:
Value1 = Theta of option ;
Notice the use of the qualifier Of Option. For information on qualifiers, see the section
earlier in this chapter, titled, “Reading OptionStation Data.”
Vega(num)
This reserved word is used in the Pricing Model to set the Vega of the option. When this
reserved word is used in another analysis technique, it is used to obtain the Vega of the option.
Syntax:
Vega(num)
Parameters:
Num is a numeric expression representing the Vega of the option. This parameter is needed
only when setting the value in the Pricing Model, not when obtaining it.
Example:
For example, if in a Pricing Model the value of Vega is stored in the variable Value1 then
it can be set by using:
Vega(Value1);
EasyLanguage for OptionStation
Writing OptionStation Models
231
When writing other analysis techniques, these instructions obtain the Vega for the
option:
Value1 = Vega of option ;
Notice the use of the qualifier Of Option. For information on qualifiers, see the section
earlier in this chapter, titled, “Reading OptionStation Data.”
ModelVolatility(num)
This reserved word is used in the Volatility Model to set the volatility of the option. When
this reserved word is used in another analysis technique, it is used to obtain the volatility of
the option.
Syntax:
ModelVolatility(num)
Parameters:
Num is a numeric expression representing the modeled volatility of the option. This parameter is needed only when setting the value in the Volatility Model, not when obtaining it.
Example:
For example, if in a Volatility Model the volatility value is stored in the variable Value1,
then the volatility of the option is set by using:
ModelVolatility(Value1);
The following expression can be used in order to assign the volatility of an option to a variable in a Pricing Model:
Value1 = ModelVolatility of option ;
Notice the use of the qualifier Of Option. For information on qualifiers, see the section
earlier in this chapter, titled, “Reading OptionStation Data.”
Ask(num)
This reserved word is used in the Bid/Ask Model to set the Ask of the option. When this
reserved word is used in another analysis technique, it is used to obtain the Ask of the
option.
Syntax:
Ask(num)
Parameters:
Num is a numeric expression representing the modeled Ask of the option. This parameter is
needed only when setting the value in the Bid/Ask Model, not when obtaining it.
Example:
For example, if in a Bid/Ask Model the Ask value is stored in the variable Value1, then the
Ask value is set by using:
Ask(Value1);
232
Writing OptionStation Models
CHAPTER 5
The following expression can be used in order to assign the Ask of an option to a variable
in a Pricing Model; for example:
Value1 = Ask of option ;
Notice the use of the qualifier Of Option. For information on qualifiers, see the section
earlier in this chapter, titled, “Reading OptionStation Data.”
Bid(num)
This reserved word is used in Bid/Ask Models to set the Bid for the option. When this
reserved word is used in another analysis technique, it is used to obtain the Bid of the
option.
Syntax:
Bid(num)
Parameters:
Num is a numeric expression representing the modeled Bid of the option. This parameter is
needed only when setting the value in the Bid/Ask Model, not when obtaining it.
Example:
For example, if in a Bid/Ask Model the Bid value is stored in the variable Value1, then the
Bid value is set by using:
Bid(Value1);
The following expression can be used in order to assign the Bid of an option to a variable
in a Pricing Model; for example:
Value1 = Bid of option ;
Notice the use of the qualifier Of Option. For information on qualifiers, see the section
earlier in this chapter, titled, “Reading OptionStation Data.”
ModelPrice
ModelPrice is used in all three models (Pricing, Bid/Ask, and Volatility) to refer to the
price of the underlying asset when performing future-time analysis (for more
information, see the previous section titled, “The Price Modeling Engine”).
Syntax:
ModelPrice data alias
Parameters:
None; however, you must use the data alias Of Asset (Of is a skip word that makes the
expression easier to read).
Notes:
It is very important to use ModelPrice whenever referring to the price of the underlying
asset in any of the models; it will be used in the future-time analysis performed by the
Price Modeling Engine (for example, when creating Position Charts).
EasyLanguage for OptionStation
Writing OptionStation Models
233
When you use this reserved word, its value will change as necessary in order to obtain
the Theoretical Values of the positions in the future-time analysis, thus generating P/L
figures for any number of different values of the underlying asset.
Example:
For example, the following expression can be used in order to assign the price of the underlying asset to a variable in a Pricing Model:
Value1 = ModelPrice of asset ;
TargetType
This reserved word is only valid in Pricing Models. It returns a numerical value
corresponding to the step of the Price Modeling Engine for which the Pricing Model is
being called.
Syntax:
TargetType
Parameters:
None.
Notes:
This reserved word returns one of these four values:
0
Theoretical Value and Greek calculations
1
MIV values on raw data
2
MIV values for Bid/Ask modeled values
3
Position Search Engine call
Example:
For example, if there are calculations that are specific to when the Market Implied Volatility values of the raw data are calculated, and are not necessary for the rest of the process,
you can use an IF-THEN statement with TargetType. The following IF-THEN statement
performs the instructions only when the Pricing Model is being called to calculate the MIV
values on the raw data:
If TargetType = 1 Then Begin
{EasyLanguage instruction(s) here}
End;
FirstOption
This reserved word is only valid in Volatility Models. It will return a true/false value. If the
option being evaluated is the very first analyzed, then this reserved word will return True;
if it is any other option, it will return False.
234
Writing OptionStation Models
CHAPTER 5
Syntax:
FirstOption
Parameters:
None.
Notes:
This reserved word speeds up calculations that need to be performed only once for an entire
option chain.
Example:
For example, if the analysis is using a fixed volatility for all options, the volatility should
only be calculated for the first option; the resulting value can be used for the rest of the options instead of calculating the volatility as many times as there are options. In
EasyLanguage, you could write a Volatility Model in the following way:
If FirstOption Then Begin
{Volatility calculations here, the resulting value is
assigned to global variable GVValue1}
End;
ModelVolatility(GVValue1);
Notice that in the above example, GVValue1 is an OptionStation global variable. For a discussion of global variables, see the next section, “OptionStation Global Variables.”
TickType
TickType will return a different value depending on whether the calculation of the Price
Modeling Engine and indicators were initiated by a new price of the underlying asset, an
option, or a modeled tick.
Syntax:
TickType
Parameters:
None
Notes:
This reserved word returns one of these four values:
0
Asset (stock or index)
1
Future
2
Option
3
Model
This reserved word enables you to optimize your EasyLanguage calculations for speed; you
can control when the analysis technique performs its calculations.
Example:
For example, in order to perform certain calculations only when the underlying asset ticks
(stock, index, or future), and to ignore the calculation when an option ticks, you can write:
EasyLanguage for OptionStation
OptionStation Global Variables
235
If TickType = 0 OR TickType = 1 Then Begin
{ EasyLanguage instruction(s) here }
End;
OptionStation Global Variables
Option analysis calculations are very computationally intense. One of the main reasons option analysis is so demanding is that all three models (Pricing, Volatility, and Bid/Ask) have
to be called for each option available every time new data is received. However, some of
the calculations are redundant and can be avoided.
For example, some option analysis techniques use a general volatility value for all options
(instead of a different volatility value for each option). In this case, calling the Volatility
Model for each option would be redundant and a waste of resources. Also, modeled Bid and
Ask values can use skew information generated in the Volatility Model.
Instead of duplicating these complex calculations, you can use placeholders in the models
that maintain their value across all options and/or across OptionStation EasyLanguage documents. These placeholders are called OptionStation Global Variables.
There are three different types of OptionStation Global variables: Pricing Model Global
Variables, Volatility Model Global Variables, and Bid/Ask Model Global Variables. Each
is discussed next.
236
OptionStation Global Variables
CHAPTER 5
Pricing Model Global Variables
The values of the Pricing Model Global Variables can only be set in Pricing Models, but
they can be read from Volatility and Bid/Ask Models, Search Strategies, and indicators.
Syntax:
GPValueNum
Parameters:
Num is a number 0 through 99.
Notes:
Global variables are pre-declared; you do not have to declare them using a Declaration
Statement.
Example:
For example, a Pricing Model can be written such that it calculates the dividend adjustment
to make to the asset price for dividends once for the first option only and then uses this value for all other options (the instructions below are part of the BS Annual Dividend Pricing
Model):
If FirstOption Then Begin
DivOffset = OS_AnnualDividend(AnnDiv, TInDays, IntRate) ;
GPValue2 = DivOffset ;
End;
Price = Price - GPValue2 ;
EasyLanguage for OptionStation
OptionStation Global Variables
237
Volatility Model Global Variables
The values of the Volatility Model Global Variables can only be set in Volatility Models,
but they can be read from Pricing and Bid/Ask Models, Search Strategies, and indicators.
Syntax:
GVValueNum
Parameters:
Num is a number 0 through 99.
Notes:
Global variables are pre-declared; you do not have to declare them using a Declaration
Statement.
Example:
For example, when calculating the volatility for an option chain, you can calculate this value once and make it accessible to all other options by using Volatility Global Variables:
If FirstOption then Begin
{EasyLanguage Instructions to calculate volatility here}
GVValue1 = OurVolty ;
End ;
ModelVolatility(GVValue1) ;
238
OptionStation Global Variables
CHAPTER 5
Bid/Ask Model Global Variables
The values of Bid/Ask Model Global Variables can only be set in Bid/Ask Models, but they
can be read from Pricing and Volatility Models, Searches Strategies, and indicators.
Syntax:
GBValueNum
Parameters:
Where num is a number 0 through 99.
Notes:
Global variables are pre-declared; you do not have to declare them using a Declaration
Statement.
Example:
For example, Bid/Ask Models can store intermediate calculations that might be useful for
indicators and Search Strategies by using global variables:
GBValue1 = Value1 ;
CHAPTER 6
EasyLanguage and Other Languages
EasyLanguage enables you to use functions residing in dynamic-link libraries (written in
C or C++) in your trading signals, analysis techniques, and functions. This means that in
addition to all the EasyLanguage reserved words and functions, you also have at your
disposal any function in a DLL that is written in C or C++.
Omega Research provides an EasyLanguage DLL Extension Kit, which consists of four
files and detailed documentation. This chapter introduces you to the kit and discusses the
use of DLL functions with EasyLanguage.
This is an advanced topic and this chapter assumes you know C or C++ as well as how
to create a Windows DLL file.
In This Chapter
Defining a DLL Function..................... 236
Using Functions from DLLs ................ 238
More About the EasyLanguage DLL
Extension Kit........................................ 239
236
Defining a DLL Function
CHAPTER 6
Defining a DLL Function
Before you can call a DLL function from EasyLanguage, you must declare the DLL using
a DLL Function Declaration statement.
Syntax:
DefineDLLFunc: “DLLNAME.DLL”, Return Type, “FunctionName”,
Parameters ;
DLLNAME.DLL is the name of the DLL where the function resides, Return Type is the type
of expression the function will return, FunctionName is the name of the function as defined
in the DLL, and Parameters is the list of parameters expected by the function (each parameter separated by a comma).
It is very important to remember that 32-bit DLLs use case-sensitive exported functions declared using _cdecl, _ _stdcall , or fastcall. For DLLs to be compatible with EasyLanguage,
exported functions should be created using all uppercase letters and be declared as _stdcall.
These exported functions must be listed within the EXPORTS section of the DLL’s .DEF
file. Using “_declspec (dllexport)” from the function’s prototype is not sufficient for
EasyLanguage to locate a DLL’s exported functions.
For example, the following statement declares a function called MessageBeep which
resides in the DLL called USER32.DLL. It returns a boolean (true/false) value, and it
expects one parameter, int.
DefineDLLFunc: “USER32.DLL”, bool, “MessageBeep”, int;
Data Types
EasyLanguage supports a number of valid data types that may be used to send and
receive information to functions contained in DLLs. Following is a list of the data types
supported by EasyLanguage:
Fundamental Data Types:
BYTE
1 byte integer data type.
char
1 byte integer data type.
int
4 byte signed integer data type.
WORD
2 byte unsigned integer data type.
long
4 byte signed integer data type.
DWORD
4 byte unsigned integer data type.
float
4 byte floating point data type.
double
8 byte floating point data type.
BOOL
4 byte boolean data type.
EasyLanguage and Other Languages
Defining a DLL Function
237
Variants:
UNSIGNED LONG
Same as DWORD.
VOID
Means “No returned value”.
Pointer Types:
LPBYTE
Pointer to a BYTE.
LPINT
Pointer to an int.
LPWORD
Pointer to a WORD.
LPLONG
Pointer to a LONG.
LPDWORD
Pointer to a DWORD.
LPFLOAT
Pointer to a float (in C++ float FAR).
LPDOUBLE
Pointer to a double (in C++ double FAR).
LPSTR
Pointer to a char.
All pointers are 32-bit pointers and EasyLanguage treats each of them in the same manner.
Also, it is very important to remember that all values in EasyLanguage are floats, except
for the Open, High, Low and Close values, which are integers. To manipulate these prices,
you will want to send to the function the price scale of the symbol being plotted.
For example, if a stock has a price scale of 1/1,000 and the last price was 105.125, this price
will be sent to a DLL as 105125. For the DLL to know how to read this price, you need to
send the value in the reserved word PriceScale, which in this case, returns a value of 1,000.
s te D
ata Types
Pointer data types are designed to pass the memory addresses of and data point to a DLL
function. All pointers used in EasyLanguage are treated as 32-bit pointers. To obtain the
pointer of any data element in EasyLanguage, the user must precede the data element with
an ampersand (&).
For example, in order to refer to the address of the open, high of one bar ago and the value
of variable value1 of two bars ago you would use the following expressions:
&Open
Address of the open price of the current bar.
&High[1]
Address of the high price of the previous bar.
&Value1[2]
Address of the Value1 variable of two bars ago.
EasyLanguage currently supports addresses for the following data objects:
All Date, Time, Open, High, Low, Close, Volume, and OpenInt values.
All true/false and numeric variables including predefined variables.
All true/false and numeric arrays.
238
Using Functions from DLLs
CHAPTER 6
Text strings are passed by address as a default when the LPSTR parameter type is used. Do
not change the size of the passed string within your DLL, as this can cause unpredictable
results.
The following example uses the correct syntax for including a pointer data type as one of
the parameters sent to a function from a DLL in a statement.
DefineDLLFunc: “C:\UserDLL\MyLib.DLL”,int,“MyFunc”,LPLONG;
If MyFunc(&Close) > 0 Then
Buy next bar at market;
It is very important to remember that pointers cannot be correctly assigned to a variable or
an array element. Because neither a variable nor an array element has the necessary accuracy to hold a pointer, you should not try to store a pointer for later use.
PROHIBITED: The following example is prohibited in the current version of
EasyLanguage as it produces an unpredictable result when Value1 is referenced at a
later time.
Value1 = &Open;
Also, do not assume that there is any relationship between two memory addresses. For example, do not assume &Open[1] is equal to &Open[0] plus 4. You should always use the
provided ELKIT32 Functions to perform pointer calculations.
Using Functions from DLLs
Once it is defined using DefineDLLFunc statement, a DLL function can be called from
EasyLanguage in much the same way as any other EasyLanguage function is used. A DLL
function can be called within an expression or as a distinct statement if the return value is
not used. To call a DLL function, the user must specify the function name and enclose all
parameters within parenthesis. If multiple parameters are used, they must be separated by
commas.
For example, in order to use a function called MessageBeep, which is included in
USER32.DLL the following statements can be used:
DefineDLLFunc: “USER32.DLL”,bool,“MessageBeep”,int;
If Open > Close Then
MessageBeep(0);
A second example follows:
DefineDLLFunc: “MYLIB.DLL”,int,“MyAverageFunc”, multiple;
Value1 = MyAverageFunc(“Open = ”,(LONG)Open);
EasyLanguage and Other Languages
More About the EasyLanguage DLL Extension Kit
239
The return value of the function MyAverageFunc is assigned to Value1. Notice the data
type specifier (LONG) is included before the second parameter's value. This specifier is
necessary because MyAverageFunc declares multiple parameter fields. In this instance, a
data type specifier must precede each parameter. The exception to this rule is when a text
string is used as a parameter of a DLL function as in Example 2. With this exception in
mind, we know that the data type must be LPSTR. Therefore, no data type specifier is needed, even when MULTIPLE is used. This is why there is no data type specifier before the
string “Open =”.
More About the EasyLanguage DLL Extension Kit
The EasyLanguage DLL Extension Kit consists of four files:
ELKIT32.DLL
ELKIT32.H
ELKITVC.LIB (for use with VC++ only)
ELKITBOR.LIB (for use with Borland C++ Builder only)
These files are located in the \Omega Research\Program directory, and the
documentation for the kit is provided on the program CD.
The EasyLanguage Toolkit Library (ELKIT32.DLL) is a dynamic-link library that provides useful functions that can be called from any user DLL. It is commonly used to find
the address of an offset of an EasyLanguage data object from within a user DLL.
For the most up to date documentation for the EasyLanguage DLL Extension Kit, review
the online documentation available on the Omega Research program CD. To install the documentation, browse the program CD and look for a folder called DEVKIT. Run the file setup.exe under this folder to install the documentation.
240
More About the EasyLanguage DLL Extension Kit
CHAPTER 6
EasyLanguage Syntax Errors
241
APPENDIX A
EasyLanguage Syntax Errors
Syntax errors are produced when verifying an EasyLanguage statement that is not understood or expected by the PowerEditor. Following is a list of all syntax errors and their description, listed by error number. Each entry includes the description of the error,
probable causes of the error, and examples of the correct and incorrect syntax for the
offending statement or instruction (where applicable).
61
"Word not recognized by EasyLanguage."
This error is displayed whenever a word is not recognized by the PowerEditor. For example, if it is not an EasyLanguage reserved word; EasyLanguage function, or a declared user
defined variable, array, or input name.
62
"Invalid number."
The PowerEditor displays this message whenever it finds a typographical error in a number. For example, if a letter is inserted by mistake in a number, the number will be highlighted and this error will be displayed. An example of an invalid number is 100.b4.
63
"Number out of range."
The PowerEditor displays this error whenever it finds a number that is outside the supported range (a number which is too big). The following statement will produce this error:
Value1 = 99999999999999999999 ;
65
"Invalid variable name."
The PowerEditor displays this error whenever it finds an invalid name in an variable declaration statement. Variable names cannot start with a number nor any special character
other than the underline (_).
For example, this error will be generated when the following statement is verified:
Variable: $MyVariable (0);
66
"Invalid input name."
The PowerEditor will display this error whenever it finds an invalid name in a input declaration statement. Input names cannot start with a number nor any special character other
than the underline (_).
For example, this error will be generated when the following statement is verified:
Input: $MyInput (0);
242
APPENDIX A
70
"Array size cannot exceed 2 billion elements."
Arrays can have up to 2 billion elements. The number of elements is calculated by multiplying all the dimensions of the array. For example, an array declared using the following
statement will have 66 elements:
Array: MyArray[10,5](0);
This arrays will have rows 0 through 10 and columns 0 though 5; in other words, 11 rows
and 6 columns. The resulting number from multiplying the dimensions of the array can’t
exceed 2 billion.
74
"Invalid array name."
The PowerEditor displays this error whenever it finds an invalid name in an array declaration statement. Array names cannot start with a number nor any special character other
than the underline (_).
For example, this error will be generated when the following statement is verified:
Array: $MyArray [10](0);
90
"The first jump command must be a begin: (\\hb,\\pb,\\wb)"
This error is displayed when the PowerEditor finds an end jump command without a begin
jump command in a text string. The end jump commands are:
\he
\pe
\we
Before these commands, a begin jump command must be used.
Note: when specifying a file name for the Print() or FileAppend() words, files that start
with any of the jump commands will produce this error. So a file name “c:\hello.txt” will
produce this error as part of the name \he.
91
"You cannot nest jump commands within other jump commands."
Jump commands are used in commentary-related text string expressions to highlight
words, and create links to the on line help. Jump commands cannot be nested; that is, there
cannot be multiple starting jump commands without having matching end jump commands.
EasyLanguage Syntax Errors
243
92
"You must terminate all jump commands with ends (\\he,\\pe,\\we)"
This error is displayed when the PowerEditor finds a begin jump command without a end
jump command in a text string. The begin jump commands are:
\hb
\pb
\wb
After these commands, an end jump command must be used.
Note: when specifying a file name for the Print() or FileAppend() words, files that start
with any of the jump commands will produce this error. So a file name “c:\hello.txt” will
produce this error as part of the name is \he.
151
"This word has already been defined."
User defined words (such as variables, arrays, and inputs) need to have unique names. This
error is generated when a user defined word is defined more than once, such as in the following example:
Input: vac(10);
Variable: vac (0);
154
"=, <>, >, >=, <, <= expected here."
This error is displayed when the PowerEditor evaluates complex true/false expressions
and it finds an error within the expression.
Condition1 = Condition2 = Close ;
The intention of this statement was to assign a complex true-false value to the variable
Condition1, by using Condition2 and a comparison that involves the Close. A
corrected version would look like this:
Condition1 = Condition2 AND Open = Close;
155
" ’(’ expected here."
The left parenthesis was expected before the highlighted word; for example, if you are using a function that requires parameters, and no parameters are listed.
Value1 = Average + 10;
In this example, the highlight signifies that a parenthesis was expected before the ‘+’
sign.
244
APPENDIX A
156
" ')' expected here"
The right parenthesis was expected after the highlighted word; for example, if you are using a function that requires parameters, you must enclose them in parentheses.
Value1 = Average(Close, 10;
Here, the highlight signifies that a closing parenthesis was expected before the’;’
157
"Arithmetic (numeric) expression expected here."
This error is displayed whenever the PowerEditor is expecting a number or a numeric expression and it finds a true-false expression, string value, or any other keyword that does
not return a numeric expression. For example, the Average() function expects two numeric
expressions, so the following:
Value1 = Average( Condition1, 10);
generates an error since Condition1 is a true-false expression.
158
"An equal sign '=' expected here."
This error is displayed if the equal sign is omitted when assigning a value to a variable,
array, or function (writing an assignment statement).
For example, the following statement will cause an error:
Value1 10;
and would be corrected by adding an equal sign, as in:
Value1 = 10;
159
"This word cannot start a statement."
Not all words can be used to start a statement. For example, the data word Close cannot
be used to start a statement. Usually, reserved words that generate some action are used to
start statements such as Buy, Plot1, or If-Then.
160
"Semicolon (;) expected here."
All EasyLanguage statements must end with a semicolon. Whenever the PowerEditor
finds a word or expression that can be interpreted as a new line, it will place the cursor
before this expression and show this error. For example, the following statements will produce this error:
Value1 = Close + Open |
Buy Next Bar at Value1 Stop;
Given that the word Buy is always used at the beginning of a statement to place a trading
order, a semicolon is required after the Open.
EasyLanguage Syntax Errors
245
161
"The word THEN must follow an If condition."
This error is displayed whenever the word Then is omitted from a If-Then statement. The
word Then must always follow the condition of the If-Then statement. The correct syntax
for an If-Then statement is:
If Condition1 Then {any operation}
162
"STOP, LIMIT, CONTRACTS, SHARES expected here."
This error is displayed by the PowerEditor if it finds a numeric expression following a
trading verb without including one of the words listed above. A numeric expression can
be used in a trading order to determine the number of shares (or contracts) and/or to specify the price of the stop or limit order. For example:
Buy Next Bar at Low - Range ;
is incorrect because it does not include a trading verb after the price Range. To be
correct, you could add the word Stop or Limit, as in:
Buy Next Bar at Low - Range Stop;
163
"The word TO or DOWNTO was expected here."
This error is displayed whenever writing a For loop and the word to or downto is omitted.
The correct syntax for a For loop is:
For Value1 = 1 To 10 Begin
{statements}
End;
165
"The word BAR or BARS expected here."
This error is displayed whenever referencing to a value of a previous bar where the word
Bar is omitted. For example, the following statement will cause this error:
Value1 = Close of 10 Ago ;
The correct syntax is:
Value1 = Close of 10 Bars Ago;
166
"The word AGO expected here."
This error is displayed when the PowerEditor finds a reference to any expression for a
number of bars ago without using the phrase Bars Ago. For example:
Value1 = Close of 10 Bars ;
produces this error because the word Ago is missing. The correct syntax for this expression
is:
Value1 = Close of 10 Bars Ago;
246
APPENDIX A
167
" ’}' was expected before end of file."
In order to add comments to your EasyLanguage, it is necessary to enclose the commentary text in the curly braces ‘{’ and ‘}’. An error message is displayed when a left curly
brace is found without a matching right curly brace.
{ this was written by Trader Joe
If Close > Highest(High, 10)[1] Then
Buy Next Bar at Market;|
Above, the right curly brace was omitted somewhere before the vertical cursor. In this example a right curly brace should have been placed after the word ‘Joe’.
168
" '[' was expected here."
When declaring, assigning, or referencing array values you are required to use the squared
braces to specify the array element(s). This error is displayed if the left squared brace is
not used when working with an array.
Array: MyArray( 10);
For example, here the highlight shows that a squared brace, corresponding to the declared
number of array element, is expected before the parenthesis.
169
"']' was expected here."
When working with bar offsets or arrays, the bar or array index must be enclosed in
squared braces. This message is displayed if the right squared brace is missing.
Value1 = Close[10 * 1.05 ;
In this example, the highlight indicates that a squared bracket should be placed somewhere
before the semicolon. Note that since the PowerEditor is expecting a numeric value in the
squared braces, it places the highlight after the last character in a numeric expression.
However, in this case, the right bracket was probably intended to be placed after the number 10.
170
"Assignment to a function not allowed."
This error is displayed when you attempt to assign a value to a function. By definition, a
function is an EasyLanguage procedure that returns a value, so it is not possible to assign
a different value to a function (except when returning a value from within a function).
Average = 100.1245;
In this example, the highlighted function name indicates that you cannot assign it a value.
EasyLanguage Syntax Errors
247
171
"A value was never assigned to user function."
By definition, a function is a set of statements that return a value. This error will be displayed when editing or creating a function and the PowerEditor finds that no value has
been assigned to the function. A statement similar to the following must be included in
every function:
MyFunction = Value;
where MyFunction is the name of the function and Value is the expression to be returned
when the function is referenced.
172 "Either NUMERIC, TRUEFALSE, STRING, NUMERICSIMPLE, NUMERICSERIES,
TRUEFALSESIMPLE, TRUEFALSESERIES, STRINGSIMPLE, or STRINGSERIES expected."
When declaring the inputs in a function it is necessary to specify the type of each input.
This error is generated when any word or value, other than a valid input type, is used when
declaring function inputs.
174
"Function not verified."
In order for an analysis technique to verify, all functions used by the analysis technique
must be verified as well. This error is displayed if there is a function that is not verified
and you attempt to verify the analysis technique.
In order to solve this, open the function and verify it, or run “Verify All” from the PowerEditor menu.
175
" ',' or ')' expected here."
This error is displayed when listing a number of elements in parentheses and a semicolon
is read before the list is finished.
Value1 = Average(Close, 10;
In this case, the highlight indicates that either more parameters (separated by a comma) or
a right parenthesis were expected before the semicolon.
176
"More inputs expected here."
This error is displayed whenever referencing a function or an included signal without
specifying enough inputs. For example:
Value1 = Average(Close );
displays an error because only one input is specified while the Average function requires
two inputs: 1) the price to be averaged and 2) the number of bars.
248
APPENDIX A
177
"Too many inputs supplied."
The PowerEditor displays this error when too many inputs are supplied for a function. For
example, the Average function requires only two inputs, so the following statement will
produce this error:
Value1 = Average(Close, 10 , 5);
The correct syntax would be
Value1 = Average(Close, 10);
180
"The word #END was expected before end of file."
The compiler directive #END must be used to indicate the end of a group of statements
included in the alert or commentary only section of an analysis technique. The alert and
commentary compiler directives will allow certain instructions to be executed only when
the alert or commentary is enabled.
181
"There can only be 10 dimensions in an array."
Arrays can have up to 10 dimensions. The correct syntax for creating a multi-dimensional
array is:
Array: MyArray[10,10,10](0);
where this statement creates a three dimensional array of 11x11x11
183
"More than 100 errors. Verify termination."
When the PowerEditor is verifying a document for correctness, it will continue to evaluate
expressions until it finds 100 errors. These errors will be found in the error log once the
verification process is finished. If the PowerEditor finds more than 100 errors it will stop
the process and will display this message.
185
"Either HIGHER or LOWER expected here."
When specifying the execution instructions for an order in a signal, it is possible to use the
words or Higher and or Lower as synonyms to stop and limit. This error occurs when the
word or is found in an order without the words Higher or Lower. The following is the
proper syntax for this statement:
Buy Next Bar at Low - Range or Lower;
186
"Input name too long."
Input names in any PowerEditor analysis technique can be up to 20 characters long. This
error is displayed by the PowerEditor whenever an input has a name that has more than 20
characters.
187
"Variable name too long."
Variable names can have up to twenty characters. This error is displayed whenever a variable is declared with a name that contains more than twenty characters.
EasyLanguage Syntax Errors
249
188
"The word BEGIN expected here."
This error is generated whenever the PowerEditor is expecting a block statement. For example, all loops require Begin and End block statements, so writing the following will
generate this error:
For Value1 = 1 To 10
Value10 = Value10 + Volume[Value1];
The correct syntax is:
For Value1 = 1 To 10 Begin
Value10 = Value10 + Volume[Value1];
End;
189
"This word not allowed in a signal."
The word highlighted by the PowerEditor is not allowed in a Signal. Words like Plot1,
TheoreticalValue, ModelVolatility, etc., are not allowed in Signal.
190
"This word not allowed in a function."
The word highlighted by the PowerEditor is not allowed in a function. Words like Plot1,
Buy, Sell, etc., are not allowed in functions.
191
"This word not allowed in a study."
The word highlighted by the PowerEditor is not allowed in a study. Words like Plot1, Buy,
Sell, etc., are not allowed in studies.
192
"This word not allowed in an ActivityBar."
The word highlighted by the PowerEditor is not allowed in an ActivityBar study. Words
like Plot1, Buy, Sell, etc., are not allowed in ActivityBar studies.
193
"Comma (,) expected here."
Commas are used to separate elements in a list; for example when declaring multiple inputs or variables, or when listing the parameters of a function.
This error will be generated whenever the PowerEditor finds two words, that seem to be
part of the list, which are not separated by a comma. For example, in the following:
Inputs: Price(Close) | Length(10);
the comma after the first input is missing. The PowerEditor places the vertical cursor at
the location where it was expecting a comma.
250
APPENDIX A
195
"Matching quote is missing."
All text string expressions need to be within double quotes. This error will be displayed
whenever there are not matching quotes around a text string expression. For example, the
following statement will produce this error:
Variable: Txt(“ ”);
Txt = “This is an example;
because there is a missing quote to the right of the text expression. The correct syntax for
this expression is:
Variable: Txt(“ ”);
Txt = “This is an example”;
197
"Signal not verified."
In order for a trading signal to verify, any signals referenced by the trading signal through
the use of the IncludeSignal reserved word must be verified as well. This error is displayed
if you attempt to verify a trading signal that references an unverified signal.
In order to solve this, open the referenced signal and verify it, or run “Verify All” from the
PowerEditor menu.
200
"Error found in function."
This error is displayed whenever verifying an analysis technique that refers to an unverified function. The only solution is to open the function, verify the function, and then return
to the analysis technique.
201
"User function cannot refer to current cell of itself."
A simple function cannot refer to the same value of a function within its calculations.
However, if defined as a series function, it can refer to a previous value of itself. For example, the following simple function gives an error:
MyFunction = MyFunction + Volume;
because the calculation refers to the current value of the function. By setting the function
Parameter to “Series”, the following becomes a valid expression that uses a function’s
previous value to accumulate the volume of the chart:
MyFunction = MyFunction[1] + Volume;
EasyLanguage Syntax Errors
251
204
"Orders cannot be inside a loop."
EasyLanguage does not allow trading orders to be placed inside a For or While loop. If the
intention of placing an order inside a loop is to increase the number of shares or contracts
that the signal will handle, this can still be done by placing the calculation of the number
of shares or contracts inside a loop and then using the resulting value in the order instruction after the loop is finished. For example,
While Condition1 Begin
Value1 = <calculation of number of shares>;
End;
Buy Value1 Shares Next Bar at Market;
205
"Statement does not return a value."
This error is displayed when attempting to return a value from statements not designed
to return a value, such as those that set or change a value. For example:
Value1 = AB_SetZone (High, Low, RightSide);
To correct this error, do not assign the expression to a variable:
AB_SetZone(High, Low, RightSide);
208
"CONTRACTS, SHARES expected here."
When writing an EasyLanguage statement to place an order, it is possible to specify how
many contracts or shares the signal should use to open (or exit) the position. This error will
be generated by the PowerEditor whenever it finds a numeric expression after the trading
verb that is not followed by the words Stop, Limit, or Higher, or or Lower. For example:
Buy 100;
generates an error because it is not clear if ‘100’ is a part of the instructions to specify the
number of shares or the execution instruction (the price at which the order should be
placed). A correct statement might read:
Buy 100 Shares;
209
"Signal name expected within quotes."
When specifying the name of an order, it must be enclosed within parentheses and double
quotes. This error is displayed if the name is missing or not correctly provided. For example, the following statement will cause this error:
ExitLong From Entry ( ) Next Bar at Market;
211
"Signal cannot call itself."
A signal cannot reference itself when using the IncludeSignal reserved word.
252
APPENDIX A
213
"Error found in signal."
This error is displayed whenever verifying a signal that contains the IncludeSignal reserved word which references a signal that is not verified. The only solution is to open the
unverified signal, verify it, and then return to the original signal.
214
"Colon (:) expected here."
EasyLanguage expects a colon to be used when declaring certain elements of the language
like inputs, variables, arrays, and DLLs. In order to declare a new input, the word input
should be followed by a colon, and then the list of input names. This error will be displayed whenever the colon is missing from this expression, for example:
Input MyValue(10);
Since there is no colon after the word ‘Input’, the word MyValue is highlighted and this
error message is displayed. To correct the error, simply add a colon after ‘Input’:
Input: MyValue(10);
215
"Cannot use next bar's price and close order in the same signal."
EasyLanguage does not support using information from the next bar (the Date, Time, or
Open) and placing an order at the close of the current bar in the same signal. If the instructions are not related, they should be written as different signals and merged using
TradeStation StrategyBuilder.
The following produces an error because it includes a reference to the Open of Next Bar
with a Close order for This Bar (current bar):
If Open of Next Bar > Price Then Buy This Bar on Close;
217
"Function circular reference found."
A circular reference is defined as two formulas that refer to each other in their respective
calculations. This type of formula cannot be solved by EasyLanguage, so whenever a circular reference is found this error is displayed.
For example, a circular reference can happen if you have a function A, which is defined as
the value of the current bar of a function B plus 1, and the definition of the function B is
the value of the current bar of A plus 1. In order to calculate the value of function A, the
value of B is needed, but in order to calculate B, the value of A is needed. Therefore, it is
not possible to obtain the values of these functions and this error occurs.
EasyLanguage Syntax Errors
253
220
"Cannot anchor a global exit."
The price date of the bar where an entry order was placed can be accessed from an exit by
using At$. This is only allowed when the entry order has a label and if the exit is tied to
the entry. An error will be generated if the entry is not labeled or if the exit does not specify
what entry it is attempting to close. For example, the following exit will cause this error:
If Condition1 Then
Buy (“MyEntry”) This Bar on Close;
ExitLong At$ Low - 1 Stop;
since the exit does not specify the name of a matching entry. The correct syntax is:
If Condition1 Then
Buy (“MyEntry”) This Bar on Close;
ExitLong From Entry (“MyEntry”) At$ Low - 1 Stop;
223
"A simple function cannot call itself."
Historical values of simple functions are not available to EasyLanguage, so referring to
previous values of itself in its calculations is not allowed. If this is necessary, change the
function to a series.
MyFunction = MyFunction [1] + Volume;
For example, if MyFunction is a simple function, the above reference to the value of
MyFunction of one bar ago is not allowed in this calculation.
224
"Signal name already used."
The PowerEditor does not allow the reuse of a name in two different orders. It is mandatory that all orders have a different name. The following Sell statement produces this error:
If Condition1 Then
Buy (“MySignal”) Next Bar at Market;
If Condition2 Then
Sell (“MySignal” ) Next Bar at Market;
because both orders cannot have the same name.
226
"Next bar's prices can only be used in a signal."
The Open, Date and Time of the next bar can only be referenced from a signal; no other
analysis has access to this information.
254
APPENDIX A
227
"Default expected here."
When declaring an input in any analysis technique, you need to enclose the default value
in parentheses. This error will be shown whenever there is no default value specified (the
parentheses are empty). For example, the following is the correct syntax for declaring an
input with the default value of 15:
Input: MyInput(15);
229
"Invalid initial value."
An initial value needs to be specified when declaring a variable or array. This initial value
needs to be enclosed by parentheses and is used to 1) determine the type of the variable or
array (numeric, true-false, or text string), and 2) assign the initial value of the variable or
array on the first bar.
The correct syntax when declaring a variable is:
Variable: MyVariable(10);
where the initial value assigned to this variable is 10, which is a numeric value.
230
"Initial value expected here."
An initial value needs to be specified when declaring a variable or array. This initial value
needs to be enclosed by parentheses and is used to 1) determine the type of the variable or
array (numeric, true-false, or text string), and 2) assign the initial value of the variable or
array on the first bar.
The correct syntax when declaring a variable is:
Variable: MyVariable(10);
where the initial value assigned to this variable is 10, which is a numeric value.
231
"Function has no inputs. Parenthesis not needed."
This error is shown by the PowerEditor when parentheses are used for a function which
has no inputs. For example, the EasyLanguage function Range has no inputs, so the following statement:
Value1 = Range( 10);
displays the error message and highlights the first parenthesis before the parameter.
232
"Matching left comment brace '{' is missing."
The PowerEditor displays this error whenever it finds a right comment brace “}” without
a matching left comment brace. In order to fix this, find the beginning of the comment text
and place a left comment brace before it. If there is no comment in your analysis technique,
then remove the right comment brace.
EasyLanguage Syntax Errors
255
233
"Extra right parenthesis."
When writing any type of expression or statement that requires parentheses, it is necessary
to have matching left and right parentheses. This error is displayed if there are extra right
parentheses in the expression being evaluated.For example:
Value1 = (Close + Open) )/2
234
"END found without matching BEGIN."
This error is displayed whenever a block statement does not contain a matching End for
every Begin.
237
"Position Information function not allowed in a study."
Strategy position information words can only be used in signals and functions. This error
will be generated if any one of these words are found in anything other than a signal or
function.
238
"Performance Information function not allowed in a study."
Strategy performance information words can only be used in signals and functions. This
error will be generated if any one of these words are found in anything other than a signal
or function.
239
"Array name too long."
Array names can have up to 20 characters. An error message will be displayed if the array
name used in the declaration statement has more than 20 characters.
240
"This signal name does not exist."
This error is displayed whenever tying an exit to a non-existent entry name. For example,
the following signal produces this error:
Buy (“Break”) Next Bar at Highest(High, 10) Stop;
ExitLong From Entry ( "BreakOut" ) Next Bar at Low Stop;
because the exit incorrectly refers to an entry labeled “BreakOut” which does not exist in
this signal. Changing the entry name to “Break” will correct this error.
256
APPENDIX A
241
"Cannot exit from an exit signal."
This error is displayed when an exit signal is mistakenly tied to another exit signal. Exit
signals can only be tied to an entry through the use of the instruction from Entry (“entry
name”). For example, the following statements will generate this error:
If Condition1 Then
Buy (“MyEntry”) This Bar at Close;
If Condition2 Then
ExitLong (“MyExit”) This Bar at Close;
ExitLong from Entry (“MyExit”) Next Bar at Lowest(Low,10) Stop;
Instead, the following statements are correct:
If Condition1 Then
Buy (“MyEntry”) This Bar at Close;
If Condition2 Then
ExitLong (“MyExit”) This Bar at Close;
ExitLong From Entry (“MyEntry”) Next Bar at Lowest(Low,10)
Stop;
242
"Cannot exitshort from a buy signal."
This error will be displayed when an short exit signal is tied mistakenly to a long entry
signal. Short exit signals can be tied only to a short entry through the use of the instruction
from Entry (“entry name”). For example, the following statements will generate this error:
If Condition1 Then
Buy (“MyEntry”) This Bar at Close;
ExitShort From Entry (“MyEntry”) Next Bar at Lowest(Low,10)
Stop;
In this case, the error can be corrected by using the appropriate exit instruction, ExitLong:
If Condition1 Then
Buy (“MyEntry”) This Bar at Close;
ExitLong From Entry (“MyEntry”) Next Bar at Lowest(Low,10)
Stop;
EasyLanguage Syntax Errors
257
243
"Cannot exitlong from a sell signal."
This error will be displayed when an long exit signal is tied mistakenly to a short entry
signal. Long exit signals can be tied only to a long entry through the use of the instruction
from Entry (“entry name”). For example, the following statements will generate this error:
If Condition1 Then
Sell (“MyEntry”) This Bar at Close;
ExitLong from Entry (“MyEntry”) Next Bar at Low Stop;
In this case, the error can be corrected by using the appropriate exit instruction, ExitShort:
If Condition1 Then
Sell (“MyEntry”) This Bar at Close;
ExitShort from Entry (“MyEntry”) Next Bar at Low Stop;
244
"At$ cannot be used after the word TOTAL."
EasyLanguage does not allow the reserved word Total to be tied to reference information
from the bar of entry by using the AT$ instruction. For example, the following statement
will generate this error:
ExitLong 20 Shares Total From Entry (“MyEntry”) At$ Low Stop;
247
"References to previous values are not allowed in simple functions."
Prior values of simple functions, simple variables, or simple expressions cannot be referenced from within simple functions. If this is necessary for the calculation of a function
then the function must be set as series, not simple. This incorrect example:
MyFunction = MyFunction[1] + Close;
creates an error if MyFunction is a simple function with a reference to previous values
of itself. Setting the function Properties to “Series” will correct this error.
248
"Either PUT, CALL, ASSETTYPE, or FUTURETYPE expected here."
This error is displayed when creating a leg in a Position Search strategy through the CreateLeg keyword without specifying the appropriate leg type. The proper syntax for this
statement is:
CreateLeg(5, Call);
which creates a leg that consists of buying 5 calls.
258
APPENDIX A
250
"Cannot reference a previous value of a simple input."
Historical values of simple inputs in functions are not stored by EasyLanguage, so referring to previous values of them is not allowed. For example, in the following:
Input: MyVal(NumericSimple);
MyFunction = MyVal[5];
the value MyVal[5] is not allowed in this function since it includes a reference to the value
of the input of five bars ago but is declared as a NumericSimple input. If the reference to
a previous value is necessary, change the input type to series.
251
"Variables and arrays not allowed here."
In previous product versions, prior to 2000i, this error is displayed when attempting
to pass variables or arrays to series functions.
Value2 = Average(Close, Value1);
253
"Cannot reference a previous value of this input."
Historical values of simple inputs in functions are not stored by EasyLanguage, so referring to previous values of them is not allowed. For example, in the following:
Input: MyVal(NumericSimple);
MyFunction = MyVal[5];
the value MyVal[5] is not allowed in this function since it includes a reference to the value
of the input of five bars ago but was declared as a NumericSimple input. If the reference
to a previous value is necessary, change the input type to series.
258
"Variables, arrays and inputs not allowed here."
This error is displayed when a variable, array, or input is used as the initializer for an
input value, such as:
Vars: MyVar(3);
Input: MyInput( MyVar );
259
"This number is too big."
The PowerEditor displays this error whenever it finds a number that is outside the supported range (a number which is too big). The following statement produces this error:
Value1 = 99999999999999999999 ;
260
" ’Next Bar’ can only be applied to ’OPEN’, ’DATE’ and ’TIME’."
The only prices available from the next bar that can be read from a signal are Open, Date,
and Time. All other prices from the next bar can’t be accessed.
EasyLanguage Syntax Errors
259
261
"The word 'BAR' expected here."
This error is shown whenever writing an order in a signal where the word Bar is left out
of the expression. For example, the following:
Buy Next on the Close;
generates an error because Bar is missing. The correct syntax is:
Buy Next Bar on the Close;
262
"At market order can only be placed for the next bar."
All analysis techniques are read and executed at the end of each bar. Because of this, market orders can only be placed for the next bar. An error will be generated whenever a market order is placed to be filled on this bar, such as:
Buy This Bar at Market;
263
"Stop and limit orders can only be placed for the next bar."
This error is displayed when trying to write a stop or limit order for the current bar.
For example:
Buy This Bar at Low - Range Limit;
is not correct because a Limit order cannot be placed on This Bar. To be correct, the
Limit order must be on the Next Bar:
Buy Next Bar at Low - Range Limit;
264
"On close order must be placed for this bar."
Given that all instructions are read at the close of each bar, the only types of orders that
can be placed on the current bar are at the close. Whenever This Bar is included as part of
an order it may only refer to the at Close price. The correct syntax for This Bar orders is:
Buy This Bar at Close;
260
APPENDIX A
265
"Cannot mix next bar prices with data streams other than data1."
EasyLanguage prohibits the reference of secondary data streams in the same signal where
references to the Date, Time, or Open of the next price are also made. If the references to
a secondary data stream and the next bar prices are not directly related, it is recommended
that you write two signals, one that uses next bar prices and a second that references other
data streams.
For example, the following statements included in one signal are not allowed because they
reference two different data streams (Data1 by default is the first and Data2 in the second):
If Open Next Bar > High Then
Sell Next Bar at Open Next Bar + Range Limit;
If Average(Close, 4) of Data2 < Average(Close, 7) of Data2 Then
ExitShort Next Bar at Close;
Instead, writing two different signals, one containing the first IF-THEN statement and another containing the second IF-THEN statement is necessary. Later these signals can both
be included as part of the same Trading Strategy through TradeStation StrategyBuilder.
266
"Library name within double quotes expected here."
The PowerEditor displays this error when defining an external DLL function and the name
of the DLL is missing or incorrect. The first element of the list of parameters in the
DefineDLLFunc statement should be the name of the DLL library within double quotes.
The following statement will generate this error:
DefineDLLFunc: int , “MyFunc”, int;
The correct syntax for this statement is:
DefineDLLFunc: “MyDLL”, int, “MyFunc”, int;
267
"DLL function name within double quotes expected here."
When defining a function from a DLL, the name of the DLL must be enclosed in double
quotes. For example, the following is a proper example of such a function definition because it includes the function name “user.dll” followed by DLL’s return type and parameters:
DefineDLLFunc: “user.dll”, int, “beep”;
274
"Return type of this DLL function must be specified."
When declaring a DLL function, the return type of the function must be the second parameter listed. Following is a correct DLL function declaration statement with the DLL’s type
int following the DLL name:
DefineDLLFunc: “MyDLL.DLL”, int, “MyFunction”, int;
EasyLanguage Syntax Errors
261
276
"DLL name cannot be longer than 60 characters."
The name of the DLL used to define any function through the DefineDLLFunc statement
cannot exceed 60 characters.
277
"DLL function name cannot be longer than 65 characters."
The name of a function defined using the DefineDLLFunc statement cannot exceed 65
characters.
278
"A variable expected here."
Whenever the PowerEditor expects a variable and finds another reserved or user defined
word, it will highlight the unexpected word and give this message. An example is when a
function is expecting a variable as one of the parameters (because it is expecting to receive
the variable by reference).
279
"An array expected here."
Functions can now receive arrays as parameters. If a function is expecting an array and
instead the PowerEditor finds a variable, input, or other reserved word (different than an
array), it will display this error. In the following example the function Average_a() calculates the average of a particular array, so the following will generate the syntax error:
Variable: MyVar(0);
Value1 = Average_a( MyVar , 10);
To correct this problem, you need declare MyVar as an array instead of an integer. It
should be written:
Array: MyArray[20](0);
Value1 = Average_a(MyArray, 10);
280
"TrueFalse expression expected here."
This error is displayed when the PowerEditor expects a true/false expression and finds a
numeric or text string expression instead. For example:
Condition1 = High ;
281
"Mixing data types (NUMERIC, TrueFalse, String) not allowed."
This error appears when incompatible data types are combined in a single expression.
In this example:
Value1 = 100 + “12” ;
the text string “12” cannot be directly combined with a numeric value. To resolve such a
problem, use the appropriate EasyLanguage reserved word to convert the data to a compatible type.
For example, use the function StrToNum to convert the text string to a numeric value:
Value1 = 100 + StrToNum(“12”) ;
262
APPENDIX A
283
"Signal has no inputs. Comma not needed."
When including a signal through the IncludeSignal keyword, the list of the inputs must be
supplied and each input must be separated by a comma. This error is displayed if the signal
has no inputs, and an input is mistakenly included in the statement.
Following is the correct syntax of an IncludeSignal statement of a signal with no inputs:
IncludeSignal: “My Trailing LX”;
284
"There is no such signal."
This error is displayed by the PowerEditor whenever the signal name referenced by an
IncludeSignal statement does not exist in the signal library.
285
"Strategy circular reference found."
A circular reference is defined as two formulas that refer to each other’s current bar value
in their respective calculations. This type of formula cannot be solved by EasyLanguage,
so whenever a circular reference is found this error is displayed.
286
"Cannot divide by zero."
This error will be displayed when dividing any numerical expression by the literal number
0. So when the following is written:
Value1 = Close / 0;
the PowerEditor will generate a syntax error because dividing by zero is a mathematical
indetermination and cannot be solved.
287
"File name expected here."
This error is displayed when using the Print statement to send information to the printer,
and an invalid file name is used for the file name. The file name should be specified as text
between double quotes. Note that a text string expression will not be accepted as a file
name in the Print statement. For example, the PowerEditor will display this error when
evaluating the following statement:
Print(File( Value1 ), Date, Time, Close);
The file name needs to be text included in double quotes; for example:
Print(File(“c:\omega research\test.txt”), Date, Time, Close);
288
"A file or directory name must be <260 characters and may not contain "/ : * ? < > |"."
Certain instructions like the Print() and FileAppend() statements require a file name. The
file name needs to be less than 260 characters long and cannot have any of the characters
listed in the error label. For example, this error will be displayed when writing:
Print(File( “c:\data?.txt”, Date, Time, Close);
since the ‘?’ character is not a valid character and cannot be used as part of a file name.
EasyLanguage Syntax Errors
263
291
"The word 'OVER' or 'UNDER' expected here."
This error is displayed whenever using the word Cross without Over or Under when writing a true-false expression. For example, the following expression will produce this error:
Condition1 = Close Crosses Open ;
The correct syntax would be:
Condition1 = Close Crosses Over Open;
292
"Two constants cannot cross over each other."
The PowerEditor displays this error whenever using the logical operators Crosses Over or
Crosses Under compares two constants. Since they are constants, they will never cross
each other and the statement will display an error, as in:
Condition1 = 10 Crosses Over 15;
293
"This plot has been defined using a different name."
The value of a plot can be assigned more than once within an analysis technique but it must
always be referenced using the same name (or the name can be left out). For example, the
following statement will cause this error:
Plot1( Volume, “Vol” );
If Volume > 1000000 Then
Plot1(Volume, “V” , Red);
because the plot has been assigned a second name “V”. The correct way of writing this
statement is:
Plot1( Volume, “Vol” );
If Volume > 1000000 Then
Plot1(Volume, “Vol”, Red);
295
"This plot name has never been defined."
This error is displayed whenever referencing a Plot with a different name than it was defined with, or a plot that doesn’t exist. For example, the following statements will cause
this error:
Plot1(High, “H”);
Value1 = Plot1 + Plot2 ;
since Plot2 has not been defined. The PowerEditor highlights the second instance of the
Plot command to indicate where the error occurred.
264
APPENDIX A
296
"This plot has never been assigned a value."
This error is generated when referring to the value of a plot that has not been previously
defined in the analysis technique. For example, the following statements will produce this
error:
Plot1( Average(Close,10) );
If Plot1 Crosses Over Plot2 Then
Alert;
because Plot2 has not been defined
297
"Server field name too long; cannot be more than 30 characters."
Server Quote fields can be up to 30 characters long. This error will be generated whenever
a server field with a name that has more than 30 characters is used.
298
"Strategy Information (for plots) function not allowed in a strategy."
None of the “Strategy Information for plots” words can be used within a strategy. These
words are designed to be used in other analysis techniques to refer to overall performance
of the strategy. However, there are strategy-specific words that can be used from the strategy to refer to these figures.
These words are:
I_AvgEntryPrice
I_ClosedEquity
I_CurrentContracts
I_MarketPosition
I_OpenEquity
299
"Strategy Information function not allowed in a study."
Strategy information words (other than the strategy information for plots) can only be used
in trading signals and functions. These words, which are listed in the EasyLanguage Dictionary under the categories Strategy Performance and Strategy Position, can only be used
when writing trading signals and functions.
EasyLanguage Syntax Errors
265
300
"This plot has been defined with a different type."
The value of a plot can be assigned more than once but it must always be of the same type.
Plot statements can display numeric, true-false, and string expressions, but they cannot
change types within an analysis technique. For example, the following pair of Plot statements are not allowed in a analysis technique because they include different data types,
where the first plot is a text string and the second a true-false value:
Plot1( "This is a text string");
If Condition1 Then
Plot1 (Condition1);
302
"Different number of dimensions specified in the array than the parameter."
This error is shown when an array is passed into a function with the wrong number of dimensions. For example, this error will be generated if a function is expecting a single dimension array but is sent an array with two dimensions instead.
303
"Extraneous text is not allowed after the array-type parameter"
When passing an array into a function, only the array name should be used. This error is
displayed whenever any text, words, or braces are added after the array name that is passed
to a function. For example:
Array: MyArray[10](0);
Value1 = Average_a(MyArray [0], 10);
the [ will be highlighted because an array index appears after the array name. The correct
syntax would be:
Array: MyArray[10](0);
Value1 = Average_a(MyArray, 10);
304
"Numeric-Array Parameter expected here."
Functions can receive arrays as parameters. If a function is expecting an array, any other
type of parameter (variable, input, or reserved word) will display this error. In the following example:
Variable: MyVar(0);
Value1 = Average_a( MyVar , 10);
the function Average_a() requires an array on which to calculate an average and
displays this error because MyVar is not an array.
Instead, you can write:
Array: MyArray[20](0);
Value1 = Average_a(MyArray, 10);
266
APPENDIX A
305
"TrueFalse-Array Parameter expected here."
Functions can now receive arrays as parameters. If a function is expecting a true-false array and, instead, the PowerEditor finds a variable, input, or other reserved word (different
than a true-false array), it will display this error. For example, a function MyTrueFalse_a()
that correctly uses true-false arrays would be written as follows:
Array: MyArray[20](False);
Variable: MyTF(False);
MyTF = MyTruefalse_a(MyArray, 10);
306
"String Array Parameter expected here."
Functions can now receive arrays as parameters. If a function is expecting an array of text
strings and, instead, the PowerEditor finds a variable, input, or other reserved word (different than an array of text strings) it will display this error. For example, a function
Average_a(), which combines all the text strings that are in an array into one, should be
used as follows:
Array: MyArray[20](“ ”);
Variable: MyText(“ ”);
MyText = Average_a(MyArray, 10);
307
"The word 'Cancel' must be followed by 'Alert'."
Whenever cancelling a previously enabled alert, the statement Cancel Alert needs to be
used. This error is displayed whenever using the word Cancel without the word Alert.
308
"A data alias (POSITION) was expected here."
When working with OptionStation analysis techniques, and referring to some data information or expression referring to a position, it is necessary to specify if the data being referred to is from a position. In order to correct this error, add the qualifier of Position to
the expression used.
309
"This word not allowed in a Search Strategy."
The word highlighted by the PowerEditor is not allowed in a Search Strategy. Words like
Plot1, Buy, Sell, etc., are not allowed in Search Strategies.
310
"This word not allowed in a Pricing Model."
The word highlighted by the PowerEditor is not allowed in a Pricing Model. Words like
Plot1, Buy, Sell, etc., are not allowed in Pricing Models.
311
"The words 'Future' or 'Option' may not be numbered in a Pricing Model."
The words Future(n) and Option(n) cannot be used in a Pricing Model. These words can
be used in all other OptionStation-related analysis techniques.
312
"This word not allowed in a Volatility Model."
The word highlighted by the PowerEditor is not allowed in a Volatility Model. Words like
Buy, Sell, etc. are not allowed in a Volatility Model.
EasyLanguage Syntax Errors
267
313
"This word not allowed in a Bid/Ask Model."
The word highlighted by the PowerEditor is not allowed in a bid-ask model. Words like
Plot1, Buy, Sell, etc., are not allowed in this analysis technique.
314
"This word is only allowed in ActivityBar studies."
The words that are used to set the properties and draw ActivityBars are only allowed from
ActivityBars and are not allowed in any other study or strategy.
315
"This value can only be assigned in a Volatility Model."
The value highlighted by the PowerEditor can only be assigned in a Volatility Model. Usually this refers to the volatility. For example, assigning a value to volatility in a bid-ask
model will produce this error.
316
"This value can only be assinged in a Bid/Ask Model."
The value highlighted by the PowerEditor can only be assigned in a Bid-Ask Model. Usually this refers to modeled bid or ask values. For example, assigning a value to the modeled
bid in a Pricing Model will produce this error.
317
"This value can only be assigned in a Pricing Model."
The value highlighted by the PowerEditor can only be assigned in a Pricing Model. Usually this refers to the theoretical price, or any of the greeks. For example, assigning a value
to delta in a Volatility model will produce this error.
318
"A data alias (POSITION or MODELPOSITION) expected here"
When working with OptionStation analysis techniques, and referring to some data information or expression referring to a position or a modeled position, it is necessary to specify
if the data being referred to is from a position or the modeled position. In order to correct
this error, add the qualifier of Position or of ModelPosition to the expression used.
319
"A data alias (OPTION or LEG) expected here"
When working with OptionStation analysis techniques, and with some data information
referring to an option or a leg, it is necessary to specify which option or leg you are referring to by adding the qualifier of Option(n) or of Leg(n) to the expression highlighted by
the PowerEditor.
320
"A data alias (ASSET or LEG) expected here"
When working with OptionStation analysis techniques, and referring to data information,
it is necessary to specify what the analysis technique is referring to: the asset or the leg. In
order to correct this, add the qualified of Asset or of Leg() to the expression used.
321
"A data alias (OPTION) expected here"
When working with OptionStation analysis techniques, and with some data information
referring to an option, it is necessary to specify which option or leg you are referring to by
adding the qualifier of Option(n) to the expression highlighted by the PowerEditor.
268
APPENDIX A
322
"A data alias (ASSET) expected here"
When working with OptionStation analysis techniques, and with some data information
referring to the underlying asset, it is necessary to specifically state that the information
referred to is from the asset. In order to correct this, add the qualifier of Asset to the expression highlighted when this error is displayed.
323
"’Value-type inputs’ may not be passed into ’reference-type inputs’."
Functions can receive array and variable parameters by reference or by value. However,
if a function receives a variable or array by value, it is not possible to pass the parameter
to a second function by reference. If an input of a function needs to be passed by reference
to another function, it must also be declared as a reference input.
324
"A data alias (LEG) expected here"
When working with OptionStation analysis techniques, and with some data information
referring to a specific leg, it is necessary to specify which leg of a position should be used.
In order to correct this, add the qualifier of Leg(n) to the expression highlighted.
325
"Only an array, variable, or reference-input is allowed here"
Functions can receive arrays as parameters. If a function is expecting an array, any other
type of parameter (variable, input, or reserved word) will display this error. In the following example:
Variable: MyVar(0);
Value1 = Average_a( MyVar , 10);
the function Average_a() requires an array on which to calculate an average and
displays this error because MyVar is not an array.
Instead, you can write:
Array: MyArray[20](0);
Value1 = Average_a(MyArray, 10);
340
"This word is only allowed when defining array-type inputs."
This error is displayed when creating a function input using any input-type (such as
NumericArray, NumericArrayref) without fully qualifying the input with braces. For
example, this creates an error:
Input: MyInput( StringArrayRef );
because it does not include the array length parameter in brackets after the array name.
The correct syntax would be:
Input: MyInput[n](StringArrayRef);
EasyLanguage Syntax Errors
269
341 "An array input word (NUMERICARRAY, STRINGARRAY, TRUEFALSEARRAY,
NUMERICARRAYREF, STRINGARRAYREF, TRUEFALSEARRAYREF) was expected here."
When declaring inputs that are meant to receive an array, one of the above words are expected as the input type. For example, this error will be displayed when declaring an input
for a function using the following statement:
Input: MyArray[M,N]( Numeric );
since the reserved word Numeric is not valid for declaring arrays. However, the following
will verify successfully:
Input: MyArray[M,N](NumericArray);
342
"This word can only be used in a PaintBar study."
This error occurs when you use the reserved word PlotPaintBar when writing anything
other than a PaintBar study.
396
"This statement cannot specify an odd number of plots."
This error is displayed when using the PlotPaintBar statement and specifying an odd number of plots. There are two possible uses for this statement, either specifying only a high
and low value, or specifying high, low, open, and close markers. The correct syntax for
the PlotPaintBar statement follows:
PlotPaintBar(High, Low, “PB”);
or
PlotPaintBar(High, Low, Open, Close, “PB”);
403
"Cannot implicitly convert String to Numerical"
Whenever the PowerEditor expects a numerical expression, and, instead, finds a text string
expression, it will highlight the text string expression and display this message.
For example, the following statement will produce this error:
Variable: MyNumber(“55”);
Value1 = Close + MyNumber ;
Instead, the following expression accomplishes the expected result because it first uses the
keyword StrToNum() to convert a text string expression to a numeric value:
Variable: MyNumber(“55”);
Value1 = Close + StrToNum(MyNumber);
270
APPENDIX A
404
"Cannot implicitly convert String to TrueFalse"
Whenever the PowerEditor expects a true-false expression and, instead, finds a text string
expression, it will highlight the text string expression and will display this message.
For example, the following statement will produce the error:
Input: Text1(“Yes”), Text2(“No”);
Condition1 = Text1 ;
because the input “Text1” was declared as a text value and cannot be assigned the truefalse variable Condition1. Instead, the following statement is correct:
Input: Text1(“Yes”), Text2(“No”);
Condition1 = (Text1 = Text2);
Notice that while both Text1 and Text2 are string values, the result of the comparison
is a true-false value which is properly assigned to a true-false variable.
405
"Cannot implicitly convert TrueFalse to String"
Whenever the PowerEditor expects a text string expression and, instead, finds a true-false
expression, it will highlight the true-false expression and display this message. In this example, Condition1 is a true-false variable and cannot be directly combined with a string:
FileAppend(“Output.txt”, “This is a text string” + Condition1 );
Instead, the following expression corrects the problem by creating a string value based on
whether Condition1 is true or false:
Variable: txt(“ ”);
If Condition1 Then
txt = “true”
Else
txt = “false”;
FileAppend(“Output.txt”, “This is a text string” + txt);
406
"Cannot implicitly convert Numerical to String"
Whenever the PowerEditor expects a text string expression and, instead, finds a numerical
expression, it will highlight the numerical expression and will display this message.
For example:
FileAppend(“Output.txt”, “This is text” + Value1);
displays an error when a numeric expression is found. Instead, the following expression
will accomplish the expected results because it uses the keyword NumToString() to
convert a numerical expression to a string:
FileAppend(“Output.txt”, “This is text” + NumoStr(Value1, 2));
EasyLanguage Syntax Errors
271
407
"Cannot implicitly convert TrueFalse to Numerical"
Whenever the PowerEditor expects a numerical value and, instead, finds a true-false expression, it will highlight the expression and will display this message.
For example, the following statement will produce this error because the Condition1 value
is a true-false variable and cannot be assigned to the numeric variable Value1:
Value1 = Condition1 ;
408
"Cannot implicitly convert Numerical to TrueFalse"
Whenever the PowerEditor expects a true/false expression and, instead, finds a numerical
expression, it will highlight the numerical expression and will display this message. For
example, the following statement produces an error because the reserved word Open is a
numeric value and not a true/false expression:
Condition1 = Open ;
Instead, assign the numeric value Open to the numeric variable Value1:
Value1 = Open ;
Or, change the statement such that it is a comparison. For example:
Condition1 = Open > Close;
Notice that while both Open and Close are numerical values, the result of the
comparison is a true/false value, which is properly assigned to a true/false variable.
409
"String expression expected here"
This error is displayed whenever the PowerEditor is expecting a string expression and, instead, it finds a numeric or true-false expression. For example, this error will be displayed
when writing information to a file with a FileAppend statement:
FileAppend(“file.txt”, Value1);
that includes the numeric expression Value1 instead of a text string. Numeric expressions
can be converted to strings by using the NumToStr() keyword. For example:
FileAppend(“file.txt”, NumToStr(Value1,2));
569
"Buy or Sell name within double quotes expected here."
When specifying the name of a trading signal, only a text string literal can be used, and it
can’t be substituted by a variable or an input. The following statements will generate this
error:
Variable: txt(“MySignal”);
Buy (txt) Next Bar at Market;
while the correct way of assigning a name to a signal is to use a literal string, such as:
Buy (“Signal Name”) Next Bar at Market;
272
APPENDIX A
EasyLanguage Colors, Widths & Codes
273
APPENDIX B
EasyLanguage Colors, Widths & Codes
Colors
When working with analysis techniques or drawing objects using colors, you can
specify any of the 17 colors listed below (including -1), using the name, EasyLanguage
word, or numeric equivalent:
Color Name
Reserved Word
Numeric Equivalent
Use the color specified in
Properties tab of Format
dialog box
Default
-1
Black
Tool_Black
1
Blue
Tool_Blue
2
Cyan
Tool_Cyan
3
Green
Tool_Green
4
Magenta
Tool_Magenta
5
Red
Tool_Red
6
Yellow
Tool_Yellow
7
White
Tool_White
8
DarkBlue
Tool_DarkBlue
9
DarkCyan
Tool_DarkCyan
10
DarkGreen
Tool_DarkGreen
11
DarkMagenta
Tool_DarkMagenta
12
DarkRed
Tool_DarkRed
13
DarkBrown
Tool_DarkBrown
14
DarkGray
Tool_DarkGray
15
LightGray
Tool_LightGray
16
Widths
You can specify the width of a plot in EasyLanguage by using a numerical value from
0 - 6, where 0 represents the thinnest width and 6 the thickest. Also, you can use -1 to
have the analysis technique use the width specified in the Properties tab of the Format
dialog box.
274
APPENDIX B
Trendline and Text Object Error Codes
Value
Explanation
-2
The identification number used was invalid (i.e., there is no object on
the chart with this ID number).
-3
The data number (Data2, Data3, etc.) passed to the function was
invalid. There is no symbol (or data stream) on the chart with this data
number.
-4
The value passed to a SET function was invalid (for example, an invalid
color or line thickness was used).
-5
The beginning and ending points were the same (only when working
with trendlines). Can occur when you relocate a trendline or change
the begin/end points.
-6
The function was unable to load the default values for the tool.
-7
Unable to add the object. Possibly due to an out of memory condition.
Your system resources have been taxed and it cannot process the
request.
-8
Invalid pointer.Your system resources have been taxed and it cannot
process the request.
-9
Previous failure.Once an object returns an error code, no additional
objects can be created by the trading signal, analysis technique, or
function that generated the error.
-10
Too many trendline objects on the chart.
-11
Too many text objects on the chart.
When the text or trendline operation was successful, zero (0) is returned.
Reserved Words Quick Reference
275
APPENDIX C
Reserved Words Quick Reference
(alphabetical)
#BEGINALERT
A compiler directive that executes instructions between #BeginAlert and #End only
when the Enable Alert check box is selected.
Usage:
#BeginAlert
Alert("ADX Alert");
#End;
#BEGINCMTRY
A compiler directive that executes instructions between #BeginCmtry and #End only
when using the Expert Commentary tool to select a bar on a chart or a cell on a grid.
Usage:
#BeginCmtry
Commentary(ExpertADX(Plot1));
#End;
#BEGINCMTRYORALERT
A compiler directive that executes instructions between #BeginCmtryOrAlert and
#End when either the Alert or Commentary conditions exist.
Usage:
#BeginCmtryorAlert
Alert("ADX Alert");
Commentary(ExpertADX(Plot1));
#End;
#END
A compiler directive used to terminate an alert or commentary block statement.
A
Skip word ignored during execution.
Usage:
If a Close is > 100 Then {any operation} ;
AB_AddCell
Adds a cell to an ActivityBar row.
Syntax:
AB_AddCell(Price, Side, Str_Char, Color, Value);
Usage:
Price: a numeric expression representing the price of a bar (e.g.,Open,Close)
Side: LeftSide,RightSide
Str_Char: a character that is displayed in the ActivityBar cell (e.g.,"A","N")
Color: an EasyLanguage color value (e.g.,Red, Black)
Value: a numeric expression representing the value of the cell
AB_AddCell(Open, Leftside, "A", 7, 1) ;
276
APPENDIX C
AB_AddCellRange
Adds cells to a price range of the current bar starting at LowValue to HighValue.
Syntax:
AB_AddCellRange(HighPrice, LowPrice, Side, str_Char, Color, Value)
Usage:
HighPrice: a numeric expression representing the highest price for a column
LowPrice : a numeric expression representing the lowest price for a column
Side: LeftSide,RightSide
str_Char: a character that will be placed in the ActivityBar cell (e.g.,"A","N")
Color: an EasyLanguage color value (e.g.,Red, Black)
Value: a numeric expression representing the value of each cell to be added
Value1 = AB_AddCellRange(High of ActivityData, Low of
ActivityData, RightSide, “U”, Green, 0);
AB_AverageCells
Returns the average number of ActivityBar cells per row for the current bar.
Syntax:
AB_AverageCells(Side)
Usage:
Side: LeftSide,RightSide
Value2 = AB_AverageCells(RightSide);
AB_AveragePrice
Returns the average price of the ActivityBar cells on one or both sides.
Syntax:
AB_AveragePrice(Side)
Usage:
Side: LeftSide,RightSide
Value2 = AB_AveragePrice(LeftSide);
AB_CellCount
Counts and returns the number of cells on one or both sides of an ActivityBar.
Syntax:
AB_CellCount(Side)
Usage:
Side: LeftSide,RightSide
Value2 = AB_CellCount(LeftSide);
AB_ColorIntervals
Specifies the color of ActivityBar cells based on a user-defined interval.
Syntax:
AB_ColorIntervals(BStatus,MinuteInterval,ABInterval)
Usage:
BStatus: normally BarStatus(1) to determine if the ActivityBar is complete
MinuteInterval: number of minutes that make up each cell color interval
ABInterval: the bar interval on which the ActivityBar is based (e.g., 5 min, 60 min)
Value1 = AB_ColorIntervals(BarStatus(1), 10, BarInterval);
AB_GetCellChar
Returns the text string expression stored in the specified cell.
Syntax:
AB_GetCellChar(Price,Side,Column)
Usage:
Price: price value of the row containing the character
Side: LeftSide,RightSide
Column: number of the cell column containing the character on the side specified
Str = AB_GetCellChar(Close, RightSide, 3) ;
Reserved Words Quick Reference
277
AB_GetCellColor
Returns the color of the character stored in the specified cell.
Syntax:
AB_GetCellColor(Price,Side,Column)
Same parametersparameters as AB_GetCellChar above.
Usage:
Value1 = AB_GetCellChar(Open, LeftSide, 2) ;
AB_GetCellDate
Returns the corresponding date of the specified cell.
Syntax:
AB_GetCellDate(Price,Side,Column)
Same parameters as AB_GetCellChar above.
Usage:
Value2 = AB_GetCellDate(High,RightSide, 5) ;
AB_GetCellTime
Returns the corresponding time of the specified cell.
Syntax:
AB_GetCellTime(Price,Side,Column)
Same parameters as AB_GetCellChar above.
Usage:
Value1 = AB_GetCellTime(Low,LeftSide, 4) ;
AB_GetCellValue
Returns the extra value stored in the specified cell.
Syntax:
AB_GetCellValue(Price,Side,Column)
Same parameters as AB_GetCellChar above.
Usage:
Value2 = AB_GetCellValue(High,RightSide, 1) ;
AB_GetNumCells
Returns how many cells exist at a specified price on the right or left side.
Syntax:
AB_GetNumCells(Price,Side)
Usage:
Price: price value of the row
Side: LeftSide,RightSide
Value1 = AB_GetNumCells(Close,LeftSide) ;
AB_GetZoneHigh
Returns the value of the top (high) of the ActivityBar zone.
Syntax:
AB_GetZoneHigh(Side)
Usage:
Side: LeftSide,RightSide
Value1 = AB_GetZoneHigh(LeftSide) ;
AB_GetZoneLow
Returns the value of the bottom (low) of the ActivityBar zone.
Syntax:
AB_GetZoneLow(Side)
Usage:
Side: LeftSide,RightSide
Value2 = AB_GetZoneLow(RightSide) ;
278
APPENDIX C
AB_High
Returns the high of the current ActivityBar.
Usage:
Value1 = AB_High ;
AB_LetterIntervals
Returns an letter/number to use in an ActivityBar cell based on a user-defined interval.
Syntax:
AB_LetterIntervals(BStatus,MinuteInterval,ABInterval)
Usage:
BStatus: normally BarStatus(1) to determine if the ActivityBar is complete
MinuteInterval: number of minutes that make up each cell letter interval
ABInterval: the bar interval on which the ActivityBar is based (e.g., 5 min, 60 min)
Value1 = AB_LetterIntervals(BarStatus(1),10,BarInterval);
AB_Low
Returns the low of the current ActivityBar.
Usage:
Value1 = AB_Low ;
AB_Median
Returns the median price value of the cells for the current ActivityBar.
Syntax:
AB_Median(Side)
Usage:
Side: LeftSide,RightSide
Value2 = AB_Median(RightSide) ;
AB_ModeCount
Returns the cell count of the row with the most cells (the Mode row).
Syntax:
AB_ModeCount(Side)
Usage:
Side: LeftSide,RightSide
Value1 = AB_ModeCount(LeftSide) ;
AB_ModePrice
Calculates and returns the price of the Mode row of an ActivityBar.
Syntax:
AB_ModePrice(Side)
Usage:
Side: LeftSide,RightSide
Value2 = AB_ModePrice(RightSide) ;
AB_RemoveCell
Removes a cell from an ActivityBar row.
Syntax:
AB_RemoveCell(Price,Column,Side)
Usage:
Price: price value of the cell to remove
Column: number of the column containing the cell on the side specified
Side: LeftSide,RightSide
Value1 = AB_RemoveCell(Close,3,RightSide) ;
Reserved Words Quick Reference
279
AB_RowCalc
Calculates and returns the row height to use for an ActivityBar.
Syntax:
AB_RowCalc(Proximity,RangeLength)
Usage:
Proximity: the approximate number of rows desired (typically between 5 and 25)
RangeLength: number of bars back used to determine the average price rage
Value2 = AB_RowCalc(10, 5) ;
AB_RowHeight
Returns the row (cell) height for an ActivityBar. Often used with AB_SetRowHeight.
Usage:
Value1 = AB_RowHeight ;
AB_SetActiveCell
Changes the placement of the ActivityBar marker to the specified location on the bar.
Syntax:
AB_SetActiveCell(Price,Side)
Usage:
Price: price value of the cell row
Side: LeftSide,RightSide
AB_SetActiveCell(Open,RightSide) ;
AB_SetRowHeight
Changes the current ActivityBar’s row-increment value.
Syntax:
AB_SetRowHeight(RowHeight)
Usage:
RowHeight: value representing the row spacing for cells. Generally use AB_RowCalc
as the parameter.
AB_SetRowHeight(AB_RowCalc(10,5)) ;
AB_SetZone
Sets a zone range box for an ActivityBar side.
Syntax:
AB_SetZone(HighPrice,LowPrice, Side)
Usage:
HighPrice: a numeric expression representing the high price of the zone range box
LowPrice : a numeric expression representing the low price of the zone range box
Side: LeftSide,RightSide
AB_SetZone(Average(High, 5), Average(Low, 5), RightSide);
AB_StdDev
Returns the standard deviation of the ActivityBar cells for the specified side.
Syntax:
AB_StdDev(Multiplier, Side)
Usage:
Multiplier: represents the number of standard deviations to calculate
Side: LeftSide,RightSide,Both
Value2 = AB_StdDev(2, LeftSide);
Above
Used only with Crosses to detect a value crossing above, or over, another value.
Usage:
If Plot11 Crosses Above Plot2 Then {Any Operation} ;
280
APPENDIX C
AbsValue
Absolute value of num.
Syntax:
AbsValue(Num)
Usage:
Num: a numeric value or expression
Value1 = AbsValue(-1.45);
{returns a value of 1.45}
ActivityData
References any bar data element (Open, upticks, etc.) of the ActivityBar.
Usage:
Value2 = AB_AddCellRange(High of ActivityData,Low of
ActivityData,Rightside,3,2);
AddToMovieChain
Appends movie file MFile to end of movie chain MChain.
Syntax:
AddToMovieChain(MFile,MChain)
MFile: a numeric expression representing a movie chain ID
MChain: a string expression representing the path and name of the *.avi file to be
added to the specified movie chain
Ago
References a specified number of bars back already analyzed by EasyLanguage.
Usage:
Value1 = Close of 1 Bar Ago;
{returns Close of the previous bar}
Alert
When True, triggers an alert for an indicator or study. The alert description is optional.
Usage:
If {Your Alert Criteria} Then Alert(“MyAlert”);
AlertEnabled
Returns True if the Enable Alert check box is selected.
Usage:
If AlertEnabled Then Begin
{Your Code Here}
End ;
All
Specifies all shares/contracts are to be sold/covered when exiting a position.
Usage:
If Condition1 Then ExitLong All Shares Next Bar at Market;
An
Skip word used to improve readability. Ignored during execution.
Usage:
If an Open is > 100 Then {any operation}
AND
Links 2 true/false expressions together. True if both expressions are true.
Usage:
If Plot1 Crosses Above Plot2 AND Plot2 > 5 Then
{any operation};
Reserved Words Quick Reference
281
Arctangent
Returns the arctangent value of num degrees.
Usage:
Value1 = Arctangent(45);
{returns 88.7270 when num is 45 degrees}
Array
Used to declare an array type of variable.
Syntax:
Array: AnyName[Elements](InitialValue)
Usage:
Elements: the number of indexed values that this array can store
InitialValue : a numeric expression used to set the initial value of each element
Array: AnyName[4](0);
{declares a 4 element array with '0' for initial values}
Arrays
Used to declare an array type of variable.
See Array.
ARRAYSIZE
Reserved for use with custom DLLs designed for EasyLanguage and ELKIT32.DLL.
ARRAYSTARTADDR
Reserved for use with custom DLLs designed for EasyLanguage and ELKIT32.DLL.
Ask
Returns the ask value of an option or position leg calculated by a Bid/Ask Model.
Usage:
If Ask of Option - Close of Option < .125 Then
Alert("Very Low Ask");
Asset
Refers to an option's underlying asset in OptionStation.
Usage:
Value1 = Volume of Asset;
AssetType
Evaluates a position leg to determine if it is an asset.
Usage:
If LegType of Leg(1) = AssetType Then {any operation};
AssetVolatility
Returns the volatility of the underlying asset.
Usage:
If AssetVolatility > 50 Then {any operation};
At
Skip word used to improve readability. Ignored during execution.
Usage:
Buy 100 Contracts on Next Bar at Market;
At$
Anchors exit prices to the bar where the named entry order was placed.
Usage:
ExitLong from Entry("MA Cross") At$ Low - 1 Point Stop;
282
APPENDIX C
AtCommentaryBar
Returns True if the current bar was selected with the Expert Commentary Tool.
Usage:
If AtCommentaryBar Then {your commentary} ;
AvgBarsLosTrade
The average number of bars that elapsed during losing trades for all closed trades.
Usage:
Value1 = AvgBarsLosTrade;
{Note: returns the integer portion of the average}
AvgBarsWinTrade
The average number of bars that elapsed during winning trades for all closed trades.
Usage:
Value2 = AvgBarsWinTrade;
{Note: returns the integer portion of the average}
AvgEntryPrice
Returns the average entry price of each open entry in a pyramided position.
Usage:
Value1 = AvgEntryPrice; {returns 70 for open trades entered at 45, 75 and 90}
AvgList
Returns the average of the listed values.
Usage:
Value2 = AvgList(18, 67, 98, 24, 65, 19); {returns a value of 48.5}
Bar
References values for a specific bar based on the data compression interval.
Usage:
Buy Next Bar at Open ;
BarInterval
Returns the data compression interval (in minutes) for bars on a minute-based chart.
Bars
References a bar occurring N bars ago based on the data compression interval.
Usage:
Value2 = Open of 5 Bars Ago ;
BarsSinceEntry
Bars since initial entry of position, num position(s) ago.
Syntax:
BarsSinceEntry(Num)
Num: number of positions ago, 0 for current position
BarsSinceExit
Bars since position closed-out, num position(s) ago.
Syntax:
BarsSinceExit(Num)
Num: number of positions ago, 0 for current position
Reserved Words Quick Reference
283
BarStatus
Determines if a trade (tick) opened the bar, closed the bar, or is ‘inside the bar.’
Syntax:
BarsStatus(DataSeries)
Usage:
DataSeries: specifies which data series to use
Returns: 0 for opening tick, 1 for inside tick, 2 for closing tick, -1 on an error
Value2 = BarStatus(2) ;
Based
Skip word retained for backward compatibility.
Begin
Used to begin a block of EasyLanguage instructions within a conditional statement.
Usage:
If Condition1 = True Then Begin
{Your Code Line1}
{Your Code Line2, etc.}
End;
Below
Used only with Crosses to detect a value crossing below, or under, another value
Usage:
If Value1 Crosses Below Value2 Then {Any Operation} ;
Beta
Returns the Beta value of a stock compared to the S&P 500 index.
Beta_Down
Returns the Beta value of a stock when S&P 500 is down.
Beta_Up
Returns the Beta value of a stock when S&P 500 is up.
Bid
Returns the bid value of an option or position leg calculated by a Bid/Ask Model.
Usage:
If Close of Option - Bid of Option < .125 Then
Alert("Very Low Bid");
BigPointValue
Dollar amount of 1 full point move.
Usage:
Value1 = BigPointValue * Close;
Black
Specifies color Black (numeric value = 1) for plots and backgrounds.
BlockNumber
Returns the unique Security Block number attached to this computer.
284
APPENDIX C
Blue
Specifies the color Blue (numeric value = 2) for plots and backgrounds.
Usage:
Plot1(Value1, "Test", Blue);
Book_Val_Per_Share
Returns calculated book value per share (common shares / outstanding shares).
BOOL
Reserved for use with custom DLLs designed for EasyLanguage and ELKIT32.DLL.
BoxSize
Refers to minimum price change needed to add an X or O to a Point & Figure chart.
BreakEvenStopFloor
Reserved for backward compatibility with previous versions of the product. Replaced
by the reserved word SetBreakEven.
Buy
Initiates a long position. Covers any short positions & reverses an existing position.
Syntax:
Buy [("Order Name")] [num of shares] [execution instruction];
Usage:
execution instructions: this bar on close, next bar at market,
next bar at price stop, next bar at price limit
Buy Next Bar at Market;
Buy("Buy Close") 20 Shares This Bar on Close;
Buy 5 Contracts Next Bar at High + Range Stop;
Buy("BuyLimit") Next Bar at Price Limit;
By
Skip word ignored during execution.
Usage:
Value1 = (High-Close) / by 2 ;
BYTE
Reserved for use with custom DLLs designed for EasyLanguage and ELKIT32.DLL.
C
Abbreviation for Close. Returns the closing price of a referenced bar.
Usage:
If Price > Close of 1 Bar Ago Then Buy on Close;
Call
Used to determine if an option or leg analyzed is a call.
Usage:
If OptionType of Option = Call Then {Any Operation};
CallCount
Returns the number of calls found in the option chain.
Usage:
Value1 = CallCount of Asset;
Reserved Words Quick Reference
285
CallTMCount
This word has been reserved for future use.
CallOTMCount
This word has been reserved for future use.
CallSeriesCount
Returns the number of call series available in the option chain.
Usage:
Value2 = CallSeriesCount of Asset;
CallStrikeCount
Returns the number of strike prices available for calls in the option chain.
Usage:
Value1 = CallStrikeCount of Asset;
Cancel
Used in conjunction with Alert to cancel a previously triggered alert.
Usage:
If {Any Condition} Then Cancel Alert;
Category
Category of symbol: 0=Unspecified, 1=Stock, 2=Future, 3=Stock Option, etc.
Usage:
Value1 = Category
{returns a value of 3 for MSQ option of MSFT}
Ceiling
Returns the lowest integer greater than num.
Syntax:
Ceiling(Num);
Usage:
Num: a numeric value or expression
Value1 = Ceiling(4.5)
{returns a value of 5}
CHAR
Reserved for use with custom DLLs designed for EasyLanguage and ELKIT32.DLL.
CheckAlert
Returns True for the last bar when Enable Alert check box is selected.
Usage:
If CheckAlert Then {Any Operation};
CheckCommentary
Returns True when the Expert Commentary Tool is applied to the current bar.
Usage:
If CheckCommentary Then {Any Operation};
ClearDebug
Clears the contents of the Debug window in the PowerEditor.
Close
Returns the closing price of the bar being referenced.
Usage:
Value1 = Close of 1 Bar Ago ;
If Close > Close[1] Then Plot1(High,"ClosedUp");
286
APPENDIX C
Commentary
Sends EasyLanguage expression(s) to the Expert Commentary window.
Usage:
Commentary("This is expert commentary");
CommentaryCL
Sends EasyLanguage expression(s) to Expert Commentary with a carriage return.
Usage:
CommentaryCL("This is a single line of expert commentary");
CommentaryEnabled
Returns True on any bar when the Expert Commentary window is open.
Commission
Returns the commission setting from the current strategy’s Costs tab.
CommodityNumber
Unique number representing a particular symbol in the Symbol Dictionary (optional).
Usage:
If CommodityNumber = 149 Then {Any Operation};
Contract
Specifies the number of units (contracts/shares) to trade within a trading strategy.
Usage:
ExitLong 1 Contract Next Bar at Market;
ContractMonth
Refers to the delivery/expiration month of any option, future, or position leg.
Usage:
If
ContractMonth of Option = 6 Then
Plot1("June Expiration", "Expires")
Contracts
Specifies the number of units (contracts/shares) to trade within a trading strategy.
Same as Contract.
ContractYear
Refers to the delivery/expiration year of any option, future, or position leg.
Usage:
If
ContractYear of Option = 99 AND ContractMonth = 8 Then
Plot1("August 1999 Expiration", "Expired")
Contributor
With FutureSource, returns the name of the institution that provided a quote for a specific FOREX symbol.
Cosine
Returns the cosine value of num degrees.
Usage:
Value1 = Cosine(72);
{returns 0.3090 when num is 72 degrees}
Cost
Returns the value of the cost of establishing a leg or position.
Usage:
Plot1(Cost of Leg(1), "Cost");
Reserved Words Quick Reference
287
Cotangent
Returns the cotangent value of num degrees.
Usage:
Value1 = Cotangent(45);
{returns 1.0 when num is 45 degrees}
CreateLeg
Sets the size and type of position to be created in a Position Search Strategy.
Syntax:
CreateLeg(Num,LegType);
Usage:
Num: the number of contracts to purchase (positive value) or write (negative value)
LegType: Put or Call
CreateLeg(-2, Put)
{creates a leg by writing 2 put options}
Cross
Used to detect when values have crossed over/under or above/below another value.
Usage:
If Plot1 does Cross Above Plot2 Then {Any Operation};
Crosses
Used to detect when values have crossed over/under or above/below another value.
Usage:
If Value1 Crosses Below Value2 Then {Any Operation};
Current
Reserved for future use.
Current_Ratio
Returns the current ratio of a stock (Total Current Assets / Total Current Liabilities).
CurrentBar
Returns the number of the bar currently being evaluated.
CurrentContracts
The number of contracts in the current position (+value is long, -value is short).
CurrentDate
Returns the current date in the format YYMMDD or YYYMMDD.
Usage:
Value1 = CurrentDate; {returns a value of 1011220 on December 20, 2001}
CurrentEntries
Number of entries currently open within a position.
Usage:
Value2 = CurrentEntries
CurrentTime
Returns the current time as HHMM using a 24-hour format.
Usage:
Value2 = CurrentTime
{returns a value of 1718 at 5:18 pm}
CustomerID
Returns the User ID number of the person to whom the software is registered.
288
APPENDIX C
Cusip
Returns a numeric expression representing the CUSIP number for stocks.
Cyan
Specifies color Cyan (numeric value = 3) for plots and backgrounds.
D
Returns the closing date of the bar referenced. (Abbreviation for Date).
DailyLimit
Number of stocks/contracts allowed traded in 1 day (from the Symbol Dictionary).
DarkBlue
Specifies color Dark Blue (numeric value = 9) for plots and backgrounds.
DarkBrown
Specifies color Dark Brown (numeric value = 14) for plots and backgrounds.
DarkCyan
Specifies color Dark Cyan (numeric value = 10) for plots and backgrounds.
DarkGray
Specifies color Dark Gray (numeric value = 15) for plots and backgrounds.
DarkGreen
Specifies color Dark Green (numeric value = 11) for plots and backgrounds.
DarkMagenta
Specifies color Dark Magenta (numeric value = 12) for plots and backgrounds.
DarkRed
Specifies color Dark Red (numeric value = 13) for plots and backgrounds.
DataN
Used to reference information from a specified data stream.
Usage:
Value1 = Low of Data10 {returns the Low for the current bar from data stream 10}
DataCompression
The compression setting of the price data for the applied analysis technique.
Usage:
Returns: 0 forTick, 1 for Intraday, 2 for Daily, 3 for Weekly, 4 for Monthly, 5 for Point & Figure.
If DataCompression=2 Then {Any Operation}
{tests for daily bars}
DataInUnion
Reserved for future use.
Date
Returns the closing date of the bar referenced in YYYMMDD format.
Usage:
If Date < 990101 Then Buy This Bar on Close;
Reserved Words Quick Reference
289
DateToJulian
Converts calendar date to Julian date.
Syntax:
DateToJulian(cDate);
Usage:
cDate: numeric expression for the date in YYMMDD or YYYMMDD format.
Value2 = DateToJulian(991024) {returns Julian value of 36457)
Day
Reserved for backward compatibility. Replaced by Bar.
DayOfMonth
Returns the day of month (DD) portion of the specified calendar date.
Syntax:
DayOfMonth(cDate);
Usage:
cDate: numeric expression for the date in YYMMDD or YYYMMDD format.
Value1 = DayOfMonth(991004) {returns day value of 4)
DayOfWeek
Returns the day of week (0 for Sun., 1 for Mon., ..., 6 for Sat.) for a calendar date.
Syntax:
DayOfWeek(cDate);
Usage:
cDate: numeric expression for the date in YYMMDD or YYYMMDD format
Value1 = DayOfWeek(1011024){returns 3 because Oct 24, 2001 is a Wednesday)
Days
Reserved for backward compatibility. Replaced by Bars.
Default
Used in plot statements to set a style to its default value.
Usage:
Plot1(Value1, "Plot1", Default, Default, 5);
DefineCustField
Reserved for future use.
DEFINEDLLFUNC
Reserved for use with custom DLLs designed for EasyLanguage and ELKIT32.DLL.
DeliveryMonth
Used for contracts that expire. Returns the month of expiration (1...12).
DeliveryYear
Used for contracts that expire. Returns the 3-digit year of expiration.
Delta
Returns the Delta value of an option, leg, or position. Debit positions will return positive numbers and credit positions will return negative numbers.
Usage1:
If Delta of Option > HighVal Then Alert("High Delta");
In a Pricing Model, used to set the value of Delta.
Usage2:
Delta(0);
{sets the value of Delta to zero}
290
APPENDIX C
Description
Returns a string containing the description of the symbol if it is available.
Usage:
TextString= Description;
{symbol decription - blank if none available}
Dividend
Returns the Dividend paid any number of periods ago.
Value1 = Dividend(2);
Usage:
{the last dividend amount paid 2 periods ago}
Dividend_Yield
Most recent cash dividend paid (or declared) times the dividend payment frequency.
DividendCount
The number of times that dividends have been reported in the time frame considered.
DividendDate
Date of reported stock dividend any number of periods ago.
Syntax:
DividendDate(num);
Num: number of periods ago, use 0 or no parameter for current period
Value2 = DividendDate(4); {the date of the dividend 4 periods ago}
Usage:
DividendTime
The time at which a stock dividend was paid out any number of periods ago.
Syntax:
DividendTime(num);
Usage:
Num: number of periods ago, use 0 or no parameter for current period
Value1 = DividendTime;
{the time of the last reported dividend}
Does
Skip word ignored during execution.
Usage:
If Plot1 Does Cross Over Plot2 Then {Any Operation}
DOUBLE
Reserved for use with custom DLLs designed for EasyLanguage and ELKIT32.DLL.
DownTicks
Number of ticks on a bar whose value is lower than the tick immediately preceding it
(or an unchanged tick that follows a downtick).
DownTo
Instructs a loop's counter to decrement and exit the loop at a specified value.
Usage:
For Value5 = Length DownTo 0 Begin
{Any Operations}
End;
DWORD
Reserved for use with custom DLLs designed for EasyLanguage and ELKIT32.DLL.
Reserved Words Quick Reference
291
EasyLanguageVersion
Returns the EasyLanguage version currently installed (i.e.,EL 2000i is version 5.1) .
Usage:
If EasyLanguageVersion >= 5.0 Then {Any Operation}
EL_DateStr
Returns an 8 character YYYYMMDD string based on month, day, and year values.
Syntax:
EL_DateStr(Month,Day,Year);
Usage:
(Month) is a numeric expression representing a month (e.g., January = 01).
(Day) is a numeric expression representing the day of the month.
(Year) is a numeric expression representing a four-digit year.
Value1 = EL_DateStr(09,05,1999){returns the string 19990905)
Else
Used to execute instructions when the specified ‘If’ condition returns False.
Usage:
If Condition1 Then
{Operation done if condition is true}
Else
{Operations done if condition is false} ;
End
Used with Begin to execute multiple statements based on a condition. See Begin.
Entry
An optional Exit parameter used to reference a specific, named entry.
Usage:
ExitLong from Entry ("MyTrade") Next Bar at Market;
EntryDate
Returns the entry date for the specified period in the format YYYMMDD.
Usage:
Value1 = EntryDate(2)
{the date of the entry 2 periods ago}
EntryPrice
Returns the entry price for the specified period.
Usage:
Value2 = EntryPrice(1)
{the price of the entry 1 period ago}
EntryTime
Returns the entry time for the specified period in the 24-hour format HHMM.
Usage:
Value1 = EntryTime(3)
{the time of the entry 3 periods ago}
EPS
Returns the reported earnings-per-share value for the specified period.
Usage:
Value2 = EPS(5)
{the Earnings-Per-Share 5 periods ago}
EPS_PChng_Y_Ago
The percent change in EPS this quarter vs. same quarter 1 year ago.
292
APPENDIX C
EPS_PChng_YTD
The percent change in EPS YTD earnings vs. YTD earnings same period 1 year ago.
EPSCount
The number of times that Earnings Per Share has been reported for a specified period.
EPSDate
The date on which Earnings Per Share were reported for the specified period.
Usage:
Value1 = EPSDate(2)
{the Earnings Per Share date 2 periods ago}
EPSTime
The time at which Earnings Per Share were reported for the specified period.
Usage:
Value1 = EPSTime
{the Earnings Per Share time for this period}
ExitDate
Returns the exit date for the specified position in the format YYYMMDD.
Usage:
Value2 = ExitDate(4)
{the exit date 4 positions ago}
ExitLong
A trading strategy order to partially or completely liquidate a long position.
Syntax:
ExitLong [from entry ("MyTrade")] [num of shares] [execution instruction];
Usage:
execution instructions: this bar on close, next bar at market,
next bar at price stop, next bar at price limit
ExitLong Next Bar at Market;
ExitLong From Entry ("BuyClose") Next Bar at 75 Stop
ExitLong 5 Contracts Next Bar at Low + Range Stop;
ExitLong From Entry ("BuyLimit") Next Bar at Price Limit;
ExitPrice
Returns the exit price for the specified position
Usage:
Value1 = ExitPrice(2)
{the exit price 2 positions ago}
ExitShort
A trading strategy order to partially or completely cover short positions.
Syntax:
ExitShort [from entry ("MyTrade")] [num of shares] [execution instruction];
Usage:
execution instructions: this bar on close, next bar at market,
next bar at price stop, next bar at price limit
ExitShort Next Bar at Market;
ExitShort From Entry ("BuyClose") Next Bar at 75 Stop
ExitShort 5 Contracts Next Bar at Low + Range Stop;
ExitShort From Entry ("BuyLimit") Next Bar at Price Limit;
ExitTime
Returns the exit time for the specified position in 24-hour HHMM format.
Usage:
Value1 = ExitTime(1)
{the exit time 1 position ago}
Reserved Words Quick Reference
293
ExpirationDate
The expiration/delivery date of an option, future, or position leg as YYYMMDD.
ExpirationMonth
Returns the expiration/delivery month of an option, future, or position leg as MM.
ExpirationRule
Returns a string containing the description of the expiration rule used for the symbol.
ExpirationStyle
Specifies the style of a option's expiration rule. (0 = American, 1 = European).
ExpirationYear
Returns the expiration/delivery year of an option, future, or position leg as YYYY.
Expired
Returns zero (0) when the option is expired and 1 when the option is not expired.
ExpValue
Returns the exponential value of the specified number.
Usage:
Value2 = ExpValue(4.5)
{returns a value of 90.0171}
False
Represents the logical value False when evaluating an expression or setting an input.
Usage:
Input:MyValue(False);
{initializes MyValue to False}
File
Sends information to a specified file from a print statement.
Syntax:
File(strFilename);
Usage:
strFileName: name of file to receive ‘print’ output
Print(File("c:\data\mydata.txt"), Date, Time, Close);
FileAppend
Appends a text string to the end of a specified file.
Syntax:
FileAppend(strFilename,strText);
Usage:
strFileName: name of file to which text will be appended
strText: text string containing information that will be added to the specified text file
FileAppend("d:\myfile.txt","Add this text to the file");
FileDelete
Deletes the specified file.
Syntax:
FileDelete(strFilename);
Usage:
strFileName: path name of file
FileDelete("e:\path\anyfile.txt");
FirstNoticeDate
Returns the first notice date of a futures contract, in YYYMMDD format.
294
APPENDIX C
FirstOption
Returns true/false indicating if an option is the first option initiating an option core calculation event.
FLOAT
Reserved for use with custom DLLs designed for EasyLanguage and ELKIT32.DLL.
Floor
Returns the highest integer less than the specified number.
Usage:
Floor(6.5)
{returns a value of 6}
For
Executes a block of instructions a specified number of times within a loop.
Usage:
For N = 1 To 10 Begin
Total = Total + Price[N];
End ;
{adds Price(N) to Total 10 times}
FracPortion
Returns the fractional portion of a number while retaining the sign.
Usage:
FracPortion(-1.72)
{returns a value of -0.72}
FreeCshFlwPerShare
Calculates and returns the Free Cash Flow Per Share value.
Friday
Specifies day of the week Friday (numeric value = 5).
From
Used with Entry to specify the name of a Long or Short entry in an Exit statement.
Usage:
ExitLong From Entry("MyTrade") Next Bar at 75 Stop ;
Future
Used to reference the current futures contract in a Position Analysis window.
Usage:
If High of Future > 1000 Then
Alert("High above 1000");
FutureType
Evaluates a position leg to determine if it is a future.
Usage:
If LegType of Leg(1) = FutureType Then
{Any Operation}
G_Rate_EPS_NY
The number of years over which the Earnings Per Share Growth Rate is calculated.
G_Rate_Nt_In_NY
The number of years over which the Net Income Growth Rate is calculated.
Reserved Words Quick Reference
295
G_Rate_P_Net_Inc
The Net Income Growth Rate percentage for a stock.
Gamma
Returns the Gamma value of an option, leg, or position. Debit positions will return
positive numbers and credit positions will return negative numbers.
Usage1:
If Gamma of Option <VLowVal Then Alert("Low Gamma");
In a Pricing Model, used to set the value of Gamma.
Usage2:
Gamma(0);
{sets the value of Gamma to zero}
GetBackgroundColor
Returns the current chart background color (see Online User Manual for color values).
Usage:
Value1 = GetBackgroundColor;
GetBotBound
Returns the bottom boundary of a ProbabilityMap array.
Usage:
Value2 = GetBotBound;
GetCDRomDrive
Returns the drive letter of first CD-ROM found.
Usage:
Variable: Drive("D");
Drive = GetCDRomDrive;
GetExchangeName
Returns the name of the Exchange for a symbol.
Usage:
Value1 = GetExchangeName;
{i.e. ,'NYSE' for the New York Stock Exchange}
GetPlotBGColor
Returns the background color of a cell on a grid.
Syntax:
GetPlotBGColor(PlotNum);
Usage:
PlotNum: value or expression representing the plot number
Value2 = GetPlotBGColor(1);
GetPlotColor
Returns the numeric color value of a chart's plot line or grid's foreground color.
Syntax:
GetPlotColor(PlotNum);
Usage:
PlotNum: value or expression representing the plot number
Value1 = GetPlotColor(2);
GetPlotWidth
Returns the width value of a plot line in a chart.
Syntax:
GetPlotWidthPlotNum);
Usage:
PlotNum: value or expression representing the plot number
Value2 = GetPlotWidth(1);
296
APPENDIX C
GetPredictionValue
Returns the prediction value from a ProbabilityMap cell array.
Syntax:
GetPredictionValue(Column,Price);
Usage:
Column: column number of the desired cell
Price: the desired price level of the cell to use for the predicting value
Plot1(GetPredictionValue(4,99.25),"Predicted Value");
GetRowIncrement
Returns the row increment value in a ProbabilityMap array.
GetStrategyName
Returns the strategy name as a string value.
GetSymbolName
Returns a string with the symbol name to which the analysis technique is applied.
GetSystemName
Reserved for backward compatibility. See GetStrategyName.
GetTopBound
Returns the top boundary of a ProbabilityMap array. Also see GetBotBound.
Gr_Rate_P_EPS
Returns the Earnings Per Share Growth Rate for a stock.
Green
Specifies color Green (numeric value = 4) for plots and backgrounds.
GrossLoss
Cumulative dollar total of all closed-out losing trades.
Usage:
Value1 = GrossLoss; {returns -1000 for three losing trades of -500,-200, and -300}
GrossProfit
Cumulative dollar total of all closed-out winning trades.
Usage:
Value2 = GrossProfit; {returns 800 for three winning trades of 100, 300, and 400}
H
Returns the highest price of the bar referenced. (abbreviation for High)
Usage:
Value1 = H[2];
{returns the High of 2 bars ago}
High
Returns the highest price of the bar referenced.
Usage:
Value2 = High of 1 bar ago;
{returns the High of the previous bar}
Reserved Words Quick Reference
297
Higher
Synonym for stop or limit orders depending on the context used within a strategy.
Usage1:
Usage:2
Buy Next Bar at MyEntryPrice or Higher;
ExitShort Next Bar at MyExitPrice or Higher;
Sell Next Bar at MyEntryPrice or Higher;
ExitLong Next Bar at MyEntryPrice or Higher;
{Buy... Stop}
{ExitShort... Stop}
{Sell... Limit}
{ExitLong...Limit}
HistFundExists
True if historical fundamental info (EPS, Dividends, and Splits) exists for symbol.
I
Number of contracts outstanding at the close of a bar (abbreviation for OpenInt).
Usage:
Value1 = I of 1 bar ago;
{returns the open interest of the previous bar}
I_AvgEntryPrice
Returns the average entry price of each open entry in a pyramided position. For use
when writing indicators and studies.
Usage:
Value2 = I_AvgEntryPrice;
{returns150 for opens entries at 130, 145, and 175)
I_ClosedEquity
Returns the profit or loss realized when a position is closed. For use when writing indicators and studies.
I_CurrentContracts
Returns the number of contracts held in all open entries. For use when writing indicators and studies.
Usage:
Value2= I_CurrentContracts;
{returns 3 for 3 open enries of 1 contract each)
I_MarketPosition
A strategy's current market position: 1 = long, -1 = short, 0 = flat. For use when writing indicators and studies.
Usage:
Value1 = I_MarketPosition;
{returns 1 if currently held position is Long)
I_OpenEquity
Returns the current gain or loss while a position is open.
If
Specifies condition(s) that must be met to execute a set of instructions.
Usage:
If Condition1 Then Begin
{Operations done if condition is true}
End ;
298
APPENDIX C
IncludeSignal
Used to include one signal’s EasyLanguage instructions in another.
Syntax:
IncludeSignal:"SignalName",[Input1[,InputN...]];
Usage:
SignalName: Name of the signal to be included
Input1: refers to one of the included signal’s inputs
InputN: additional input names separated by commas
IncludeSignal:"LowEntry",Price,BarCount;
IncludeSystem
Reserved for backward compatibility. Replaced by IncludeSignal.
InitialMargin
Returns the Initial Margin Requirement of a position.
Usage:
If InitialMargin of Position > 500 Then {Any Operation}
Input
Used to declare an input name that accepts a user value when applying a technique.
Usage:
Input: Length(10);
{declares input 'Length' with an initial value of 10}
Inputs
Declares multiple inputs separated by commas. See Input.
Usage:
Inputs: Price(5.25), Length(8), Status(True);
Inst_Percent_Held
The percent of common stock held by institutions relative to total outstanding shares.
InStr
Returns the location of String2 within String1.
Syntax:
InStr(String1,String2);
Usage:
String1: Text string to be searched
String2: Word or phrase to be found in String1
Returns: Character position of the start of String2, if found. Zero if not found.
Value1 = InStr("Net Profit Margin", "Profit");
{returns a 5}
INT
Reserved for use with custom DLLs designed for EasyLanguage and ELKIT32.DLL.
IntPortion
Returns the integer portion of the specified decimal number.
Syntax:
IntPortion(Num);
Usage:
Num: A numeric value or expression
Value1 = IntPortion(4.125);
Is
Skip word ignored during execution.
Usage:
If a Close is > 100 Then {any operation} ;
{returns a 4}
Reserved Words Quick Reference
299
JulianToDate
Returns the calendar date YYYMMDD for the specified Julian date.
Syntax:
JulianToDate(jDate);
Usage:
jDate: numeric expression for the date in Julian format.
Value2 = JulianToDate(36457);
{returns Date value of 991024}
L
Returns the lowest price of the bar referenced. (abbreviation for Low)
Usage:
Value1 = L[4];
{returns the Low of 4 bars ago}
LargestLosTrade
Returns the dollar value of the largest closed-out losing trade.
LargestWinTrade
Returns the dollar value of the largest closed-out winning trade.
Last_Split_Date
Returns the Date on which the last stock split was reported.
Last_Split_Fact
Returns the size or ratio of last stock split.
LastCalcJDate
Returns the Julian date of last completed bar.
LastCalcMMTime
Returns the time of last completed bar, in minutes since midnight.
Usage:
Value1 = LastCalcMMTime;
{returns a value of 540 if last bar was at 9:00 am}
LastTradingDate
Refers to the last day an option, future, position leg, or asset may be traded.
LeftSide
Used with ActivityBars to refer to actions on the left side of a bar.
Usage:
Value2 = GetCellChar(Close, Leftside, 3);
LeftStr
Returns the leftmost (starting) portion of a text string.
Syntax:
LeftStr(String,Length);
Usage:
String: A text string to evaluate. Must be enclosed in quotation marks.
Length: The number of characters to return from the start of String.
Value1 = LeftStr("Net Profit", 3);
{returns the word "Net"}
Leg
References a data element (Open, Close, OpenInt, etc.) of an position leg.
Usage:
If Volume of Leg(1)
> HighVal Then {any operation}
300
APPENDIX C
LegType
Returns the type of position leg: asset, future, call, or put.
Usage:
If LegType of Leg(2) = Call Then
Plot1("Call", "Leg Type");
LightGray
Specifies color Light Gray (numeric value = 16) for plots and backgrounds.
Limit
In an entry or exit order, means 'or higher' or 'or lower', depending on the context.
Usage:
Buy Next Bar at 75 Limit; {enters a long position at a price of 75 or lower}
Sell Next Bar at 75 Limit; {enters a short position at a price of 75 or higher}
Log
Returns the natural logarithm of a number.
Usage:
Value1 = Log(172);
{returns a log value of 5.1475}
LONG
Reserved for use with custom DLLs designed for EasyLanguage and ELKIT32.DLL.
Low
Returns the lowest price of the bar referenced.
Usage:
Value2 = Low of 1 bar ago;
{returns the Low of the previous bar}
Lower
Synonym for stop or limit orders depending on the context used within a strategy.
Usage1:
Usage2:
Buy Next Bar at MyEntryPrice or Lower;
ExitShort Next Bar at MyExitPrice or Lower;
Sell Next Bar at MyEntryPrice or Lower;
ExitLong Next Bar at MyEntryPrice or Lower;
{Buy... Limit}
{ExitShort... Limit}
{Sell... Stop}
{ExitLong...Stop}
LowerStr
Used to convert a string expression to lowercase letters.
Usage1:
Value1 = LowerStr("My TextString") ;
{returns "my textstring"}
LPBOOL
Reserved for use with custom DLLs designed for EasyLanguage and ELKIT32.DLL.
LPBYTE
Reserved for use with custom DLLs designed for EasyLanguage and ELKIT32.DLL.
LPDOUBLE
Reserved for use with custom DLLs designed for EasyLanguage and ELKIT32.DLL.
LPDWORD
Reserved for use with custom DLLs designed for EasyLanguage and ELKIT32.DLL.
Reserved Words Quick Reference
301
LPFLOAT
Reserved for use with custom DLLs designed for EasyLanguage and ELKIT32.DLL.
LPINT
Reserved for use with custom DLLs designed for EasyLanguage and ELKIT32.DLL.
LPLONG
Reserved for use with custom DLLs designed for EasyLanguage and ELKIT32.DLL.
LPSTR
Reserved for use with custom DLLs designed for EasyLanguage and ELKIT32.DLL.
LPWORD
Reserved for use with custom DLLs designed for EasyLanguage and ELKIT32.DLL.
Magenta
Specifies color Magenta (numeric value = 5) for plots and backgrounds.
MakeNewMovieRef
Creates new movie reference number.
Usage:
Print(MakeNewMovieRef = 1);
Margin
Returns the margin setting from the applied strategy’s Costs tab
Market
Order type referring to the opening price of the next bar.
Usage:
Buy Next Bar at Market;
MarketPosition
The market position (1 = long, -1 = short, 0 = flat) of the specified position.
Syntax:
MarketPosition(Num)
Num: number of positions ago
Usage:
Value1 = MarketPosition(2) ;
{returns1 if long 2 posittions ago was long}
MaxBarsBack
The minimum number of bars required to evaluate a study or trading strategy.
MaxBarsForward
Represents the number of bars to the right of the last bar on the chart.
MaxConsecLosers
Represents the longest chain of consecutive closed-out losing trades.
MaxConsecWinners
Represents the longest chain of consecutive closed-out winning trades.
302
APPENDIX C
MaxContracts
The maximum number of contracts held during the specified position.
Syntax:
MaxContracts(Num)
Num: number of positions ago.
Usage:
Value1 = MaxContracts(2) ;
{returns number of contracts held 2 posittions ago}
MaxContractsHeld
Maximum number of contracts held at any one time.
MaxEntries
The maximum number of entry signals for the specified position.
Syntax:
MaxEntries(Num)
Num: number of positions ago.
MaxGain
Returns the Maximum Gain of the position.
Usage:
If MaxGain of Position < HighVal Then {any operation};
MaxIDDrawDown
The largest drop in equity (in dollars) throughout the entire trading period.
MaxList
Returns the highest value of the listed inputs.
Syntax:
MaxList(Num1[,NumN...])
Usage:
Num1 the first value or expression to compare
NumN additional values to compare separated by commas
Value1 = MaxList(45, 72, 86, 125, 47);
{returns a value of 125}
MaxList2
Returns the second highest value of the listed inputs. See MaxList for syntax.
Usage:
Value2 = MaxList2(18, 67, 98, 24, 65, 19);
{returns a value of 67}
MaxLoss
The Maximum Loss of the position.
Usage:
If MaxLoss of Position > LowVal Then {any operation};
MaxPositionLoss
Dollar amount of largest loss for the specified position.
Syntax:
MaxPositionLoss(Num)
Num: number of positions ago.
MaxPositionProfit
Dollar amount of largest gain for the specified position.
Syntax:
MaxPositionProfit(Num)
Num: number of positions ago.
Reserved Words Quick Reference
303
MessageLog
Sends information to the Message Log.
Syntax:
MessageLog (Item1[,ItemN...]) ;
Usage:
Item1: a string or numeric expression
ItemN: additional strings or expressions separated by commas
MessageLog("Today is: ",Date, Time," Close is: ", Close);
MidStr
Returns the middle portion of a text string.
Syntax:
MidStr (String,Location,Size) ;
Usage:
String: text expression to evaluate
Location: starting character position of the text string to be returned
Size: length of the text string to be returned
Value1 = MidStr("Net Profit Value", 5, 6) {returns the word 'Profit'}
MinList
Returns the lowest value of the listed inputs.
Syntax:
MinList(Num1[,NumN...])
Usage:
Num1 the first value or expression to compare
NumN additional values to compare separated by commas
Value1 = MinList(45, 72, 86, 125, 47);
{returns a value of 45}
MinList2
Returns the second lowest value of the listed inputs. See MinList for syntax.
Usage:
Value2 = MinList2(18, 67, 98, 24, 65, 19)
{returns a value of 19 }
MinMove
Minimum tick movement of stock/future symbol.
Usage:
Value1 = MinMove * PriceScale
{returns the smallest price increment}
MIVonAsk
Returns the market implied volatility of an option or position leg based on the ask
price defined by a Bid/Ask Model.
Usage:
If ModelVolatility of Option > MIVonAsk of Option * 1.2 Then
Alert("High Modeled Volatility");
MIVonBid
Returns the market implied volatility of an option or position leg based on the bid
price defined by a Bid/Ask Model. Usage is similar to MIVonAsk.
MIVonClose
Returns the market implied volatility of an option or position leg based on the closing
price. Usage is similar to MIVonAsk.
304
APPENDIX C
MIVonRawAsk
Returns the market implied volatility of an option or position leg based on the last ask
price received from your datafeed. Usage is similar to MIVonAsk.
MIVonRawBid
Returns the market implied volatility of an option or position leg based on the last bid
price received from your datafeed. Usage is similar to MIVonAsk.
Moc
Reserved for future use.
Mod
Divides two numbers and returns the remainder.
Syntax:
Mod(Num,Divisor)
Usage:
Num: any value or expression
Divisor: any numeric expression representing the divisor.
Value1 = Mod(17, 5);
{divides 17 by 5 and returns 2 as the remainder}
ModelPosition
References a modeled position in a Search Strategy.
Usage:
If Delta of ModelPosition < .1 Then {any operation};
ModelPrice
The underlying price currently used by the Pricing or Volatility Model.
Usage:
Value2 = ModelPrice * BigPointValue of Option;
ModelVolatility
References the volatility calculated by the Volatility Model in OptionStation. Debit
positions return positive numbers and credit positions return negative numbers.
Usage1:
If ModelVolatility > 75 Then Alert("High Volatility");
In a Volatility Model, used to set the value of ModelVolatility.
Usage2:
ModelVolatility(32);
{sets the ModelVolatility to 32}
Monday
Specifies day of the week Monday (numeric value = 1).
MoneyMgtStopAmt
Reserved for backward compatibility with previous versions of the product. Replaced
by the reserved word SetStopLoss.
Month
Returns the month (MM) portion of the specified calendar date, from 1 to 12.
Syntax:
Month(cDate);
Usage:
cDate: numeric expression for the date in YYMMDD or YYYMMDD format.
Value1 = Month(991004)
{returns day value of 10}
Reserved Words Quick Reference
305
MULTIPLE
Reserved for use with custom DLLs designed for EasyLanguage and ELKIT32.DLL.
Neg
Returns the absolute negative value of a number.
Usage:
{returns a value of -17}
{returns a value of -9}
Value1 = Neg(17);
Value2 = Neg(-9);
Net_Profit_Margin
Calculates and returns the Net Profit Margin (Income after Taxes / Total Revenue).
NetProfit
Cumulative dollar total of all closed-out trades, both winning and losing.
Usage:
Value1 = NetProfit {returns 1000 for three closed trades of -500, 1200 and 300}
NewLine
Adds carriage return/linefeed in FileAppend and commentary/file output strings.
Usage:
FileAppend("c:\my.txt", "Text Line1" + NewLine + "Line2");
Next
Used in conjunction with Bar to reference the next bar in a trading strategy.
Usage:
Buy Next Bar at Market;
NoPlot
Removes a plot from the current bar in a chart or cell in a grid.
Usage:
If Close > Close[1] Then
Plot1(High, "CloseUp")
Else
NoPlot(1);
{plots 'CloseUp' on the bar}
{removes a previous plot from the bar}
Not
Reserved for future use.
NthMaxList
Returns the Nth highest value of the listed inputs.
Syntax:
NthMaxList(N,Num1[,NumN...])
Usage:
N: an integer representing the rank in the list (1st, 2nd, 3rd, etc.)
Num1: the first value or expression to compare
NumN: additional values to compare separated by commas
Value1 = NthMaxList(2, 45, 72, 86, 125, 47); {returns a value of 86}
NthMinList
Returns the Nth lowest value of the listed inputs. See syntax as NthMaxList.
Usage:
Value1 = NthMaxList(2, 45, 72, 86, 125, 47); {returns a value of 47}
306
APPENDIX C
Numeric
Defines an input that expects a number passed by value.
Usage:
{accepts a numeric value for Price}
Input: Price(Numeric);
NumericArray
Defines an input that expects a number passed by value for each array element.
Usage:
Input: MyArray[n](NumericArray)
{accepts numeric inputs by value}
NumericArrayRef
Defines an input that expects a numeric variable passed by reference for each array
element.
Usage:
Input: MyArray[n](NumericArrayRef) {accepts numeric inputs by reference}
NumericRef
Defines an input that expects a numeric variable passed by reference.
Usage:
Input: Price(NumericRef);
{accepts a numeric variable reference for Price}
NumericSeries
Defines an input as a numeric series expression with price history.
Usage:
Input: Price(NumericSeries); {a numeric input allowing previous bar history}
NumericSimple
Defines an input as a numeric simple expression.
Usage:
Input: Price(NumericSimple);
{a numeric input not allowing bar history}
NumFutures
Returns the total number of futures contracts associated with a future symbol root.
Usage:
Value1 = NumFutures of Asset;
NumLegs
Returns the total number of position legs associated with any position.
Usage:
Plot1(NumLegs of Position, "NumLegs");
NumLosTrades
Returns the total count of closed-out losing trades.
NumOptions
Returns the total number of options begin analyzed for an asset or the total number of
options used in the specified leg of a position.
Usage:
Value1 = NumOptions of Asset;
{returns total options for an Asset}
Reserved Words Quick Reference
307
NumToStr
Converts the specified numeric expression to a string expression.
Syntax:
NumToStr(Num,Dec);
Usage:
Num: a numeric expression to be converted to a string
Dec: the number of decimal places for the string version of the value
Value1 = NumToStr(1170.5, 2) ;
{returns the text string '1170.50'}
NumWinTrades
Total count of closed-out winning trades.
O
Abbreviation for Open. Returns the opening price of a referenced bar.
Usage:
If Price < O of 1 Bar Ago Then Sell at Market;
Of
Skip word ignored during execution.
Usage:
If Close of Data1 = Highest(High, 14) Then {any operation} ;
On
Skip word ignored during execution.
Usage:
Buy 100 Contracts on Next Bar Open;
Open
Returns the opening price of the bar referenced.
Usage:
Value1 = Open of 2 Bars Ago;
OpenInt
The open interest, or number of contracts outstanding, at the close of a specific bar.
Usage:
Value2 = Average(OpenInt, 10);
{returns the average OpenInt over 10 bars}
OpenPositionProfit
Returns the gain or loss of current open position (only used with strategies).
Option
Used to reference a data element (Open, Close, OpenInt, etc.) of a specified option.
Usage:
Value1 = Close of Option(5);
OptionType
Used to determine if an option is a call or put.
Usage:
If OptionType = Call Then {any operation};
Or
Links 2 true/false expressions together. True if either expression is true.
Usage:
If Plot1 Crosses Above Plot2 Or Plot2 > 5 Then Begin
{any operations}
{done if either condition is true}
End;
308
APPENDIX C
Over
Used only with Crosses to detect a value crossing over, or above, another value.
Usage:
If Plot1 Crosses Over Plot2 Then {Any Operation} ;
Pager_DefaultName
Returns the string containing of the default Message Recipient as specified in the
Messaging tab under the File - Desktop Options menu.
Usage:
Name = Pager_DefaultName;
Pager_Send(Name, “Buy 200 AMD at Market”);
Pager_Send
Sends a text message to a specified pager recipient (if pager module enabled).
Syntax:
Pager_Send(sTo,sMessage);
Usage:
sTo: text string containing the name of the message recipient
sMessage: text string containing the message contents
Pager_Send("Joe Trader", "Buy 200 AMD at Market");
PercentProfit
Percentage of all closed-out winning trades.
Usage:
Value1 = PercentProfit;
{returns 80 if 8 of 10 trades were winners}
Place
Retained for backward compatibility. Skip word.
PlayMovieChain
Queues and plays the movie chain with the specified reference number.
Usage:
Condition1 = PlayMovieChain(1);
{plays the movie chain with ref number 1}
PlaySound
Plays the specified sound file (.wav file).
Usage:
Condition1 = PlaySound("c:\sounds\thatsabuy.wav");
Plot
References the value of a specified plot.
Syntax:
Plot(n);
Usage:
n: plot number ranging from 1-4
If Plot(Value1) < Close Then Buy Next Bar on Open;
Reserved Words Quick Reference
309
Plot1
Displays an expression (numeric or text) in a price chart or grid.
Syntax:
Plot1(Value[,sName[,fgColor,[bgColor[,Width]]]] );
Usage:
Value: a numeric or text string expression or value to display on a chart or grid
sName: text string containing the name of the plot (optional)
fgColor: color number (or Default) of the plotted object or text (optional)
bgColor: color number (or Default) of the cell background in a grid (optional, ignored for charts)
Width: the thickness of a line to be plotted on a chart (optional, ignored for grids)
Plot1(Value) ;
or
Plot1(Value, "My Plot Name", Red, Default, 0) ;
Plot2
Displays an expression in a price chart or grid. See Plot1 for syntax and usage.
Plot3
Displays an expression in a price chart or grid. See Plot1 for syntax and usage.
Plot4
Displays an expression in a price chart or grid. See Plot1 for syntax and usage.
PlotPaintBar
For use with PaintBar studies, enables you to paint the entire bar, or part of the bar,
with a single instruction.
Syntax:
PlotPaintBar(High, Low[, Open, Close[, “PlotName”[,fgColor, [bgColor, Width]]]] );
Usage1:
High: the upper price limit to paint
Low: the lower price limit to paint
Open: (optional) paints the opening tick mark
Close: (optional) paints the closing tick mark
PlotName: (optional) name used when referencing the plot
fgColor: (optional) color number (or Default) of the paint color
bgColor: (optional) color number (or Default) of the background (currently ignored with charts)
Width: (optional) the thickness of the lines to be plotted
PlotPaintBar(High,Low,Open,Close,"My Plot Name");
Usage2:
PlotPaintBar(High,Low);
or
PlotPB
Abbreviated version of PlotPaintBar (see above).
PM_GetCellValue
Returns the intensity value of a cell at the specified column and price location.
Syntax:
PM_GetCellValue(ColNum,Price);
Usage:
ColNum: the ProbabilityMap column number where the cell is located
Price: the price location of the cell
Value1 = PM_GetCellValue(12,High) ;
310
APPENDIX C
PM_GetNumColumns
Returns the number of columns in a ProbabilityMap array.
Usage:
Value1 = PM_GetNumColumns;
PM_GetRowHeight
Returns the height or increment of the rows in a ProbabilityMap study.
PM_High
Returns the value of the upper range of a ProbabilityMap grid.
PM_Low
Returns the value of the lower range of a ProbabilityMap grid.
PM_SetCellValue
Sets the location and intensity of ProbabilityMap cells.
Syntax:
PM_SetCellValue(ColNum,Price,Value) ;
Usage:
ColNum: the ProbabilityMap column of the cell to be set
Price: the price location of the cell within the column
Value: a numeric expression representing the intensity of the cell
PM_SetCellValue(5,80,10) ;
{sets intensity of cell to 10}
PM_SetHigh
Sets the upper range value of a ProbabilityMap.
Syntax:
PM_SetHigh(Price)
Usage:
Price: a numeric expression or value for a price
PM_SetHigh(Highest(High,50));
{sets the PM top to the Highest High}
PM_SetLow
Sets the lower range value of a ProbabilityMap.
Syntax:
PM_SetLow(Price)
Usage:
Price: a numeric expression or value for a price
PM_SetLow(14.5) ;
{sets the PM bottom to a price of 14.50}
PM_SetNumColumns
Sets the number of columns in a probability map array.
Syntax:
PM_SetNumColumns(Num);
Usage:
Num: a numeric expression or value representing the desired number of columns
PM_SetNumColumns(PM_BarColumns) ;
PM_SetRowHeight
Sets the height of the rows for a ProbabilityMap grid.
Syntax:
PM_SetRowHeight(RowHeight);
RowHeight: a numeric expression or value for the height of each PB row
Usage:
PM_SetRowHeight(.125) ;
{sets the PM row height to a price of .125}
Reserved Words Quick Reference
311
Pob
Retained for backward compatibility. Replaced by Limit.
Point
The minimal fractional value a symbol can move (one increment in the Price Scale).
Usage:
ExitLong This Bar at EntryPrice - 1 Point Stop;
POINTER
Reserved for use with custom DLLs designed for EasyLanguage and ELKIT32.DLL.
Points
Represents multiple ‘Point’ increments of the Price Scale. See Point.
Usage:
Buy This Bar at Close - 3 Points Stop;
PointValue
The dollar value per share of one increment on the price scale. Calculated as Big Point
Value divided by the Price Scale using the values specified in the symbol dictionary.
Usage:
{returns 2.5 for S&P Futures}
Value1 = PointValue;
Pos
Returns the absolute positive value of a number.
Usage:
Value1 = Pos(17);
Value2 = Pos(-9);
{returns a value of 17}
{returns a value of 9}
Position
References a position in a Search Strategy
Usage:
If Delta of Position < .1 Then {any operation};
PositionID
References the PositionID of a position in a Search Strategy.
Usage:
Plot1(PositionID of Position, "Position ID");
PositionProfit
Returns the current gain (positive) or loss (negative) of the specified position.
Usage:
Value1 = PositionProfit;
{returns -1.00 if the position had a loss of 1.00}
PositionStatus
Used in Search Strategies to create a position. Specified position is created when the
expression (criteria) evaluates to True.
Syntax:
PositionStatus(Criteria);
Usage:
Criteria: a true/false expression or value for the height of each PB row
Condition1= OS_CheckProx(Call, ExpDate, “OTM”, Max, Min);
{creates position when Condition1 is True}
PositionStatus(Condition1) ;
312
APPENDIX C
Power
Returns the number raised to the specified power.
Syntax:
Power(Num,Exponent);
Usage:
Num: a numeric expression or value
Exponent: the power by which to raise the number
Value1 = Pow(2,3);
{returns 8 based on 23}
PrevContribl
With FutureSource, returns the name of the institution that provided the previous quote
for a specific FOREX symbol.
Price_To_Book
Stock price vs. net worth of stock company.
PriceScale
Price scale of stock/future symbol (inverted).
Usage:
Value2 = PriceScale
{returns 100 for the S&P 500 Futures representing 1/100}
Print
Sends information to the Debug window in the EasyLanguage PowerEditor or, if specified, to an alternate output location (a file or the default printer).
Syntax:
Print (Item1[,ItemN...]) ;
Usage:
Usage1:
Usage2:
Item1: a string or numeric expression
ItemN: additional strings or expressions separated by commas
Print(Date, Time, Close);
{prints the 3 values to the Debug window}
Print(Printer, D, T, C);
{prints the same 3 values to the default printer}
Print(“c:\myfile.txt”, D, T, C); {prints the 3 values to the specified file}
Printer
Sends information to the default printer from a Print statement.
Usage:
Print(Printer,"Today is: ", Date);
{sends output to the default printer}
Product
Number representing the Omega Research charting application currently being used.
Product Name
Product Number
TradeStation
0
SuperCharts
1
Usage:
If Product = 0 Then Plot1(Value1, "TS Indicator");
Profit
Reserved for future use.
ProfitTargetStop
Retained for backward compatibility with previous versions of the product. Replaced
by the reserved word SetProfitTarget.
Reserved Words Quick Reference
313
Protective
Reserved for future use.
Put
Used to determine if an option or leg analyzed is a put.
Usage:
If OptionType of Option = Put Then {Any Operation};
PutCount
Returns the number of puts in the option chain.
Usage:
Value1 = PutCount of Asset;
PutITMCount
Reserved for future use.
PutOTMCount
Reserved for future use.
PutSeriesCount
Returns the number of put series available in the option chain.
Usage:
Value2 = PutSeriesCount of Asset;
PutStrikeCount
The number of strike prices available for puts in the option chain.
Usage:
Value1 = PutStrikeCount of Asset;
Q_Ask *
A numeric value representing the last ask for a symbol.
Q_AskExchange *
A text string representing the exchange the last bid was sent from.
Q_AskSize *
A numeric value representing the number of units offered at the best ask price.
Q_BaseCode *
A character code that represents the Price Scale multiplier as sent by some datafeeds.
Q_BaseCodeBidAsk *
A character code that represents the Bid/Ask Price Scale multiplier on some datafeeds.
Q_Bid *
A numeric value representing the last bid price for a symbol.
Q_BidExchange *
A text string representing the exchange the last bid was sent from.
Q_BidSize *
A numeric value representing the number of units bid at the best bid price.
314
APPENDIX C
Q_Close *
A numeric value for the price of the close of the last completed trading session.
Q_DatafeedID *
A numeric value representing the datafeed ID.
Q_Date *
The YYYMMDD date of the last time any price field for this symbol was updated.
Q_ExchangeListed *
A string expression representing the exchange under which the symbol is listed.
Q_ExpirationDate *
The expiration date YYYMMDD for the symbol defined by the chosen expiration
rule.
Q_High *
The numeric value of the highest price traded during the current trading day.
Q_Hour *
The hour (HH) portion of the last time any price field of this symbol was updated.
Q_Last *
A numeric value representing the last traded price of the symbol.
Q_LastTradingDate *
The last trading date YYYMMDD for the symbol defined by the chosen expiration
rule.
Q_Low *
The numeric value of the lowest price traded during the current trading session.
Q_Margin *
A numeric expression representing the margin for a future.
Q_Mid *
A legacy FOREX field representing the average Bid/Ask.
Q_Minute *
The minutes (MM) portion of the last time any price field of this symbol was updated.
Q_Month *
The month portion of the last time any price field of the symbol was updated.
Q_Open *
A numeric value representing the opening price of the symbol.
Q_Open2 *
A numeric value representing the opening price of the previous day.
Reserved Words Quick Reference
Q_OpenInterest *
A numeric value representing the last known open interest for the symbol.
Q_OptionType *
A numeric expression representing the option type.
Q_QuoteStatus *
Returns the status of the last trade as:
REALTIME TRADE (01)
REALTIME BIDASK (02)
OPEN (04)
SETTLEMENT (08)
EXDIVIDEND (10)
HIGHSETBYBID (20)
LOWSETBYASK (40)
NOMINALDAYCLOSE (80)
NOMINAL (100)
REJECTEDTRADE (200)
Q_Second *
The seconds (SS) portion of the last time any price field of this symbol was updated.
Q_Ticks *
Tick count as sent by the datafeed (Bridge, Future Source, and DBC subserver).
Q_TickTrend *
The tick trend (+ positive/ - negative/ = neutral) provided by the datafeed.
Q_Time *
The last time HHMM any price field of this symbol was updated.
Q_TradeVolume *
A numeric value representing the trade volume of the last trade.
Q_UpdateDate *
The date of the last trade update.
Q_UpdateTime *
The time of the last trade update.
Q_Year *
The year portion YYY of the last time any price field of the symbol was updated.
Quick_Ratio
Calculated as (cash + short term investment + accounts receivable) / current liabilities.
315
316
APPENDIX C
Random
Returns a pseudo-random number between 0 and num.
Syntax:
Random(num) ;
Usage:
Num: value that determines the range of possible numbers, starting with 0 and ending with Num
Value1 = Random(37);
{randomly returns any value between 0 and 37}
RawAsk
Returns the raw ask value received from the data provider.
Usage:
If RawAsk of Option - Close of Option < .125 Then
Alert("Very Low Ask");
RawBid
Returns the raw bid value received from the data provider.
Usage:
If RawBid of Option - Open of Option > .5 Then
Alert("High Bid");
Red
Specifies color Red (numeric value = 6) for plots and backgrounds.
Repeat
Reserved for future use.
Ret_On_Avg_Equity
Calculated as (income available to common stockholders / average common equity).
RevSize
Reversal size of a Point & Figure chart. Set on the Settings tab under Format Symbol.
Rho
Returns the Rho value of an option, leg, or position.
Returns the Rho value of an option, leg, or position. Debit positions will return positive numbers and credit positions will return negative numbers.
Usage1:
If Rho of Option > HighVal Then Alert("High Rho");
In a Pricing Model, used to set the value of Rho.
Rho(.4);
Usage2:
{sets the value of Rho to .4}
RightSide
Used with ActivityBars to refer to actions on the right side of a bar.
Usage:
AB_AddCell(Open, Rightside, "A", 7, 1);
RightStr
Returns the rightmost (ending) portion of a text string.
Syntax:
RightStr(String,Length);
Usage:
String: A text string to evaluate. Must be enclosed in quotation marks.
Length: The number of characters to return from the end of String.
Value1 = RightStr("Net Profit", 6);
{returns the word "Profit"}
Reserved Words Quick Reference
317
Round
Returns a number rounded to nearest precision.
Divides two numbers and returns the remainder.
Syntax:
Round(Num,Precision)
Usage:
Num: any value or expression
Precision: the number of decimal places to keep
Value1 = Round(9.5687, 3);
{returns a value of 9.569}
Saturday
Specifies day of the week Saturday (numeric value = 6).
Screen
Reserved for future use.
Sell
Initiates a short position. Closes any open positions & reverses an existing position.
Syntax:
Sell [("Order Name")] [num of shares] [execution instruction];
Usage:
execution instructions: this bar on close, next bar at market,
next bar at price stop, next bar at price limit
Sell Next Bar at Market;
Sell("Buy Close") 20 Shares This Bar on Close;
Sell 5 Contracts Next Bar at Low + Range Stop;
Sell("BuyLimit") Next Bar at Price Limit;
SeriesCount
The number of series available in the option chain.
Usage:
Value1 = SeriesCount of Asset;
Sess1EndTime
Ending time of the first trading session for the security in 24-hour format.
Usage:
Value2 = Sess1EndTime;
{returns 1615 for IBM trading on the NYSE}
Sess1FirstBarTime
Completion time of the first bar in the first session in 24-hour format.
sage:
Value2 = Sess1FirstBarTime;
{returns 1000 for IBM using 30 min bars}
Sess1StartTime
Starting time of the first trading session for the security in 24-hour format.
Usage:
Value1 = Sess1StartTime;
{returns 0930 for IBM trading on the NYSE}
Sess2EndTime
Ending time of the second trading session for the security in 24-hour format.
Usage:
Value2 = Sess2EndTime;
{returns 0745 for US Treasury Bonds on CBOE}
318
APPENDIX C
Sess2FirstBarTime
Completion time of the first bar in the second session in 24-hour format.
Value1 = Sess2FirstBarTime;{returns 1715 for S&P 500 Futures on 30 min bars}
Usage:
Sess2StartTime
Starting time of the second trading session for the security in 24-hour format.
Value1 = Sess2StartTime;
Usage:
{returns 1530 for US Treasury Bonds on CBOE}
Sessions
Returns a numeric expression representing the number of sessions.
SetBreakEven
Sets a breakeven stop; specifies the profit required before placing the stop. Used by the
trading signal BreakEvenStop-Floor.
Syntax:
SetBreakEven(Price)
Usage:
Price: the floor, or minimum equity, needed for the stop to become active
SetStopPosition;
{can also use SetStopContract}
SetBreakEven(250);
{places a breakeven stop after a $250 position profit}
SetDollarTrailing
Sets a dollar risk trailing stop; specifies the maximum tolerated loss amount (in dollars) of the maximum open position profit. Used by the trading signal Dllr Risk
Trailing.
Syntax:
SetDollarTrailing(Amount)
Usage:
Amount: the dollar amount you are willing to risk per position or per contract/share
SetStopPosition;
{can also use SetStopContract}
SetDollarTrailing(500); {sets dollar risk trailing stop at $500 for entire position}
SetExitOnClose
Sets a stop to exit the position on the last bar of the day (for intraday charts). Used by
the trading signal Close at end of day.
Usage:
SetExitOnClose;
{exits positions at end of day}
SetPercentTrailing
Sets a percent risk trailing stop; specifies the profit that must be reached to activate
stop and the maximum tolerated loss amount (as a percentage) of the maximum open
position profit. Used by the trading signal Pcnt Risk Trailing.
Syntax:
SetPercentTrailing(Amount,Percent)
Usage:
Amount: the dollar amount representing the minimum needed to activate the stop
Percent: the percentage of the maximum equity needed to be lost to close the trade
SetStopPosition;
{can also use SetStopContract}
SetPercentTrailing(500,15);
{exits after returnof 15% over $500 earned}
Reserved Words Quick Reference
319
SetPlotBGColor
Assigns a specified background color to grid cells for an indicator.
Syntax:
SetPlotBGColor(Num,Color)
Usage:
Num: plot number to set
Color: EasyLanguage color word (e.g., red, black,white) or color number
SetPlotBGColor(1, Green);
{sets background color of Plot1 cells to Green}
SetPlotColor
Sets the color value of a chart's plot line or grid's foreground text color.
Syntax:
SetPlotColor(Num,Color);
Usage:
Num: plot number to set
Color: EasyLanguage color word (e.g. red, black,white) or color number
SetPlotColor(2, Blue);
{sets foreground color of Plot2 text to Blue}
SetPlotWidth
Modifies the width value (thickness) of a plot line in a chart.
Syntax:
SetPlotWidth(Num,Width);
Usage:
Num: plot number to set
Width: Numeric expression representing the plot’s width
SetPlotWidth(1, 5);
{sets the line width of Plot1 to 5}
SetProfitTarget
Sets a profit target stop; this reserved word specifies the profit required in order to exit
the position. Used by the trading signal Profit Target.
Syntax:
SetProfitTarget(Amount)
Usage:
Amount: the dollar value of the profit target
SetStopContract;
SetProfitTarget(400);
{exits a position once it has returned $400}
SetStopContract
Instructs TradeStation to evaluate all stop values of a strategy on a per contract (entry)
basis. Use SetStopPosition to evaluate stop values on a per position basis.
Usage:
SetStopContract;
SetStopLoss(50) ;
{sets a stop for individual contract (entry)}
SetStopLoss
Sets a stop loss order (money management stop); specifies the amount (in dollars) you
are willing to lose on the position/contract before it is liquidated. Used by the trading
signal Stop Loss.
Syntax:
SetStopLoss(Amount)
Usage:
Amount: the dollar amount that must be incurred before position/contract is liquidated
SetStopContract;
{can also use SetStopContract}
SetStopLoss(2);
{exits long position when down $2 per contract}
SetStopPosition
320
APPENDIX C
Instructs TradeStation to evaluate all stop values of a strategy on a per position basis.
To evaluate all stop values on a per contract (entry) basis, use SetStopContract.
Usage:
SetStopPosition;
SetStopLoss(1200);
{places a stop loss order of $1200 for entire position}
SGA_Exp_By_NetSales
Annualized growth rate percentage of sales (calculated from the total revenue divided
by the number of outstanding shares).
Share
Used to specify a contract/share for a particular buy, sell, or exit order.
Usage:
Buy 1 Share Next Bar at Market;
Shares
Used to specify the number of contracts/shares for a particular buy, sell, or exit order.
Usage:
ExitLong 5 Shares Next Bar at Open;
Sign
Returns 1 for a positive num, -1 for a negative num, and 0 for a num of zero.
Syntax:
Sign(Num)
Usage:
Num: a numeric value or expression.
Value1 = Sign(-9.5687)
{returns a value of -1}
Sine
Returns the sine value of num degrees.
Usage:
Value1 = Sine(72);
{returns 0.9511 when num is 72 degrees}
Skip
Reserved for future use.
Slippage
Returns the slippage per contract from the strategy’s Costs tab.
SnapFundExists
True if snapshot fundamental data exists in the data stream; False otherwise.
Spaces
Specifies the number of blank spaces to add to a text or commentary string.
Usage:
Print("Close" + Spaces(5) + NumToStr(Close, 3));
Square
Returns the square (2nd power) of the specified number.
Syntax:
Square(Num)
Usage:
Num: a numeric value or expression
Value1 = Square(6.23)
SquareRoot
{returns a value of 38.8219}
Reserved Words Quick Reference
321
Returns the square root of the specified number.
Syntax:
SquareRoot(Num)
Usage:
Num: a numeric value or expression
Value1 = SquareRoot(5);
{returns a value of 2.2361}
StartDate
Reserved for future use.
StockSplit
Ratio of the stock split reported during a certain period.
Usage:
Value2 = StockSplit(2);
{returns the split ratio reported 2 periods ago}
StockSplitCount
The number of stock splits that have been reported in a given time frame.
StockSplitDate
The date on which a stock split was reported during a certain period.
Usage:
Value1 = StockSplitDate(3);
{date of a stock split reported 3 periods ago}
StockSplitTime
The time at which a stock split occurred during a certain period.
Usage:
Value2 = StockSplitTime;
{time of the last reported stock split}
Stop
In an entry or exit order, means 'or higher' or 'or lower', depending on the context.
Usage:
Buy Next Bar at 65 Stop;
{enters a long position at a price of 65 or higher}
ExitLong Next Bar at 65 Stop; {exits a long position at a price of 65 or lower}
Strike
Returns the strike price of an option or position leg.
Usage:
If OptionType of Option = Call Then
If Close of Asset > Strike of Option Then
Plot1( "Call in-the-money", "Option" )
Else
Plot1( "Call out-of-the-money","Option" );
StrikeConfidence
Returns a numeric expression of the confidence level of the strike price calculation.
StrikeCount
Returns the number of strikes available in the option chain.
Usage:
Value1 = StrikeCount of Asset;
StrikeITMCount
Reserved for future use.
StrikeOTMCount
322
APPENDIX C
Reserved for future use.
String
Defines a function input that accepts a string expression value.
Usage:
{accepts a text string value}
Input: MyMessage(String);
StringArray
Defines a function input array that accepts multiple string expressions.
Usage:
{array that accepts text strings}
Input: Messages[n](StringArray);
StringArrayRef
Defines a function input array that accepts multiple string references.
Usage:
Input: Note[n](StringArrayRef);
{array that accepts strings by reference}
StringRef
Defines a function input that accepts a string expression by reference.
Usage:
Input: SomeText(StringRef);
{accepts a text string by reference}
StringSeries
Defines a function input that accepts string expressions that include history.
Usage:
Input: SomeText(StringSeries);
{accepts text strings with history}
StringSimple
Defines a function input that accepts simple string expressions without history.
Usage:
Input: SomeText(StringSimple);
{accepts text strings without history}
StrLen
The number of characters that make up a text string.
Syntax:
StrLen(String)
Usage:
String : a text string expression (a variable or text contained within quote marks).
Value1 = StrLen("Net Profit");
{returns a count of 10 characters}
StrToNum
Returns the numerical value of a text string, zero if the string not numeric.
Syntax:
StrToNum(String)
Usage:
String : a text string expression (a variable or text contained within quote marks).
Value2 = StrToNum("1170.50");
{returns the numeric value 1117.5}
SumList
Returns the sum of all listed inputs.
Syntax:
SumList(Num1[,NumN...])
Usage:
Num1: the first value or expression
NumN: additional values to add separated by commas
Value1 = SumList(45, 72, 86, 125, 47);
Sunday
Specifies day of the week Sunday (numeric value = 0).
{returns a value of 375}
Reserved Words Quick Reference
323
SymbolName
Returns a string expression representing the symbol name. See also GetSymbolName.
SymbolNumber
Number representing the GlobalServer symbol. See CommodityNumber and Cusip.
SymbolRoot
Returns a text string representing the root of the symbol (for futures and options only).
T
Abbreviation for Time. Returns the closing time of a referenced bar in 24-hour format.
Usage:
If T of 1 Bar Ago >= 1100 Then
Buy at Market;
{buys at or after 11 AM}
Tangent
Returns the tangent value of num degrees.
Usage:
Value1 = Tangent(72);
{returns 3.0776 when num is 72 degrees}
Target
Reserved for future use.
TargetType
Reserved for future use.
Text
Retained for backward compatibility.
Text_Delete
Deletes the specified text object.
Syntax:
Text_Delete(TX_Ref)
Usage1:
Usage2:
TX_Ref: a numeric expression representing the object identification number
Returns: status code indicating whether or not operation was successful
Text_Delete(3);
{deletes text object number 3}
Value1 = Text_Delete(2);
{returns status code after deleting text object 2}
Text_GetColor
Returns the color value of the specified text object.
Usage:
Value1 = Text_GetColor(4);
(see Text_Delete for syntax)
{returns the color of text object 4}
Text_GetDate
Returns the date of the left edge of the specified text object.
Syntax:
Text_Delete(TX_Ref)
Usage:
TX_Ref: a numeric expression representing the object identification number
Value1 = Text_GetDate(2);
{returns the date of text object 2}
324
APPENDIX C
Text_GetFirst
Returns the text object id number for the first object of a specified type.
Syntax:
Text_GetFirst(Type)
Usage:
Type: identifies the origin of the requested first text object
1 = text created by an analysis technique
2 = text created by the text drawing object only, and
3 = text created by either the text drawing object or an analysis technique
Returns: status code indicating whether or not operation is successful
Value2 = Text_GetFirst(2);
{returns the id of first text drawing object}
Text_GetHStyle
Gets the horizontal placement style of the specified text object. (see Text_Delete for syntax)
Usage:
Returns: 0 for left, 1 for right, 2 for center, or status code if operation not successful
Value1 = Text_GetHStyle(5);
{returns horiz style of text object 5}
Text_GetNext
Returns the text object id for the next object of a specified type after specified object.
Syntax:
Text_GetNext(TX_Ref, Type)
Usage:
TX_Ref: a numeric expression representing the object identification number
Type: identifies the origin of the next text object
1 = text created by an analysis technique
2 = text created by the text drawing object only, and
3 = text created by either the text drawing object or an analysis technique
Returns: status code indicating whether or not operation is successful
Value2 = Text_GetNext(2,1);
{returns the id of analysis text after id 2}
Text_GetString
Returns the text string of the specified text object.
Usage:
TextValue1 = Text_GetString(3);
(see Text_Delete for syntax)
{returns text string of object number 3}
Text_GetTime
Returns the time of the left edge of the specified text object.
Usage:
Value2 = Text_GetTime(4);
(see Text_Delete for syntax)
{returns the time of text object 4}
Text_GetValue
Returns the price (vertical axis) of the specified text object.
Usage:
Value1 = Text_GetValue(2);
(see Text_Delete for syntax)
{returns the price of text object 2}
Reserved Words Quick Reference
325
Text_GetVStyle
Gets the vertical placement style of the specified text object. (see Text_Delete for syntax)
Returns: 0 for top, 1 for bottom, 2 for center, or error code if operation not successful
Usage:
Value2 = Text_GetVStyle(5);
{returns vert style of text object 5}
Text_New
Creates and draws a new text object at a specified date, time, and price location.
Syntax:
Text_New(cDate,Time,Price,Text)
cDate: date in YYYMMDD format
Time: time in HHMM 24-hour format
Price: value or numeric expression of the price
Text: text variable or text expression within quotes
Returns: object number if successful, or error code if operation not successful
Note: Drawing objects are numbered by type in the order they are created, from 0 to n. Therefore, 0 is the
identification number of the first drawing object of that type created, and n is the last object of the same type
created.
Usage:
Value1 = Text_New(Date, Time, High + 1, "Stock Split");
Text_SetColor
Changes the color of the specified text object.
Syntax:
Text_SetColor(TX_ref, Color)
Usage:
TX_Ref: a numeric expression representing the object identification number
Color: the color name or numeric value
Text_SetColor(3,red);
{sets text object 3 to color red}
Text_SetLocation
Moves specified text object to a new date, time, and price location.
Syntax:
Text_SetLocation(TX_ref, cDate,Time,Price,Text)
Usage:
TX_Ref: a numeric expression representing the object identification number
cDate: date in YYYMMDD format
Time: time in HHMM 24-hour format
Price: value or numeric expression of the price
Text: text variable or text expression within quotes
Returns: 0 if successful, or error code if operation not successful
Value1 = Text_SetLocation(2,990114,1500,24.5); {moves text obj 2}
Text_SetString
Changes the text of a specified text object.
Syntax:
Text_SetString(TX_ref, Text)
Usage:
TX_Ref: a numeric expression representing the object identification number
Text: text variable or text expression within quotes
Returns: 0 if successful, or error code if operation not successful
Value2 = Text_SetString(1, "New String") ; {changes text for obj 1}
326
APPENDIX C
Text_SetStyle
Changes the horizontal and vertical position style for the specified text object.
Syntax:
Text_SetStyle(TX_ref, Horiz,Vert)
Usage:
TX_Ref: a numeric expression representing the object identification number
Horiz: 0 for left, 1 for right, 2 for center
Vert: 0 for top, 1 for bottom, 2 for center
Returns: 0 if successful, or error code if operation not successful
Value1 = Text_SetStyle(3,0,1) ;
{repositions obj 3 to the left-bottom}
Than
Skip word used to improve readability. Ignored during execution.
Usage:
If High > than the Highest(Close, 14) Then {any operation}
The
Skip word used to improve readability. Ignored during execution. (see Than)
Then
Precedes the operation(s) to be executed when the matching If condition is true.
Usage:
If Condition1 Then Begin
{Operations done if condition is true}
End ;
TheoreticalGrossIn
The amount required (or received) to establish a position at its theoretical value.
Positive numbers represent the amount to receive and negative numbers the amount to be paid.
Usage:
Plot1(TheoreticalGrossIn of Position, "TGI" );
TheoreticalGrossOut
The amount required (or received) to close out a position at its theoretical value.
Positive numbers represent the amount to receive and negative numbers the amount to be paid.
Usage:
Plot1(TheoreticalGrossOut of Position, "TGO" );
TheoreticalValue
Returns the modeled value of an option or position leg.
Usage:
If TheoreticalValue of Option < Close of Option Then
Alert("Overpriced Option");
Theta
Returns the Theta value of an option, leg, or position. Debit positions will return positive numbers and credit positions will return negative numbers.
Usage1:
If Theta of Option > HighVal Then Alert("High Theta");
In a Pricing Model, used to set the value of Theta.
Usage2:
Theta(0);
{sets the value of Theta to zero}
Reserved Words Quick Reference
327
This
Used to reference the current Bar.
Usage:
Buy This Bar on Close;
Thursday
Specifies day of the week Thursday (numeric value = 4).
Ticks
Reserved for backward compatibility. Replaced with Points.
TickType
The kind of tick that triggered an option core event: Asset, Option, Future, or Model.
Time
Closing time of the current bar in 24-hour HHMM format.
Usage:
{returns 2130 if the bar time is 9:30pm}
Value1 = Time;
TL_Delete
Deletes the specified trendline from the chart.
Syntax:
TL_Delete(TL_Ref)
Usage1:
TL_Ref: a numeric expression representing the trendline identification number
Returns: 0 if operation is successful, or error code if not
TL_Delete(2);
{deletes trendline number 2}
Usage2:
Value1 = TL_Delete(3);
{returns status code after deleting trendline 3}
TL_GetAlert
Gets the alert status of the specified trendline object.
Usage:
TL_Ref: a numeric expression representing the trendline identification number
Returns: 0 = no alert, 1 = Breakout Intrabar, 2 = Breakout on Close
Value2 = TL_GetAlert(4);
{returns alert status for trendline number 4}
TL_GetBeginDate
The date of the starting point for the specified trendline.
Usage:
(see TL_Delete for syntax)
{returns the start date of trendline 2}
Value1 = TL_GetBeginDate(2);
TL_GetBeginTime
The time of the starting point for the specified trendline.
Usage:
(see TL_Delete for syntax)
{returns the start time of trendline 3}
Value2 = TL_GetBeginTime(3);
TL_GetBeginVal
The price (vertical axis) of a trendline’s starting point.
Usage:
Value1 = TL_GetBeginVal(4);
(see TL_Delete for syntax)
{returns the start price of trendline 4}
TL_GetColor
Returns the color value of the specified trendline.
Usage:
Value1 = TL_GetColor(3);
(see TL_Delete for syntax)
{returns the color of trendline 3}
328
APPENDIX C
TL_GetEndDate
The date of the ending point for the specified trendline.
Usage:
Value1 = TL_GetEndDate(2);
(see TL_Delete for syntax)
{returns the end date of trendline 2}
TL_GetEndTime
The date of the ending point for the specified trendline.
Usage:
Value2 = TL_GetEndTime(4);
(see TL_Delete for syntax)
{returns the end time of trendline 4}
TL_GetEndVal
The price (vertical axis) of a trendline’s ending point.
Usage:
Value1 = TL_GetEndVal(3);
(see TL_Delete for syntax)
{returns the end price of trendline 3}
TL_GetExtLeft
True if the specified trendline is extended left, False otherwise.
Usage:
Condition1 = TL_GetExtLeft(12) ;
(see TL_Delete for syntax)
{true if trendline 12 extends left}
TL_GetExtRight
True if the specified trendline is extended right, False otherwise. (see TL_Delete for syntax)
Usage:
Condition1 = TL_GetExtRight(5) ;
{true if trendline 5 extends right}
TL_GetFirst
Returns the id number for the first trendline of a specified type.
Syntax:
TL_GetFirst(Type)
Usage:
Type: identifies the origin of the requested first trendline
1 = trendline created by an analysis technique
2 = trendline created by the drawing object only, and
3 = trendline created by either the drawing object or an analysis technique
Returns: ID if operation successful or error code if not
Value2 = TL_GetFirst(2);
{returns id of first trendline of type}
TL_GetNext
Returns the text object id for the next object of a specified type after specified object.
Syntax:
TL_GetNext(TL_Ref, Type)
Usage:
TL_Ref: a numeric expression representing the object identification number
Type: (see TL_GetFirst)
Returns: ID if operation successful or error code if not
Value1 = TL_GetNext(2,1);
{returns id of trendline draw object after id 2}
TL_GetSize
The line thickness setting (weight) for the specified trendline. (see TL_Delete for syntax)
Usage:
Value2 = TL_GetSize(3);
{returns thickness of trendline 3}
Reserved Words Quick Reference
329
TL_GetStyle
The line style for the specified trendline.
Syntax:
TL_GetStyle(TL_Ref)
Usage:
TL_Ref: a numeric expression representing the object identification number
Returns: Tool_Solid = 1 (solid)
Tool_Dashed = 2 (dashed)
Tool_Dotted= 3 (dotted)
Tool_Dashed2= 4 (dashed pattern)
Tool_Dashed3= 5 (dashed pattern)
Value1 = TL_GetStyle(6);
{returns 3 if trendline 6 is dotted}
TL_GetValue
The price (vertical axis) of the specified trendline at date and time.
Syntax:
TL_GetStyle(TL_Ref,cDate,Time)
Usage:
TL_Ref: a numeric expression representing the object identification number
cDate: date in YYYMMDD format
Time: time in HHMM 24-hour format
Returns: price if operation successful or error code if not
Value2 = TL_GetValue(2,991104,0930); {returns the price of trendline 2}
TL_New
Creates a new trendline using specified start and end points.
Syntax:
TL_New(sDate,sTime,sPrice,eDate,eTime,ePrice)
Usage:
sDate: starting point date in YYYMMDD format
sTime: starting point time in HHMM 24-hour format
sPrice: starting point price
eDate: ending point date in YYYMMDD format
eTime: ending point time in HHMM 24-hour format
ePrice: ending point price
Returns: trendline ID if operation successful, error code if not
Value1 = TL_New(990107, 0930, 45, 990125, 1600, 37.250);
TL_SetAlert
Sets the alert status for a specified trendline.
Syntax:
TL_SetAlert(TL_Ref, Status)
Usage:
TL_Ref: a numeric expression representing the object identification number
Status: 0=no alert, 1=breakout intrabar alert, 2=breakout on close alert
TL_SetAlert(3, 1);
{sets intrabar alert for trendline 3}
TL_SetBegin
Changes the starting point of a specified trendline.
Syntax:
TL_SetBegin(TL_Ref,sDate,sTime,sPrice)
Usage:
TL_Ref: a numeric expression representing the object identification number
(see TL_New for descriptions of sDate,sTime,sPrice)
TL_SetBegin(4, 990221, 1015, 107.225);
330
APPENDIX C
TL_SetColor
Changes the color of a specified trendline.
Syntax:
TL_SetColor(TL_Ref, Color)
Usage:
TL_Ref: a numeric expression representing the object identification number
Color: the color name or numeric value
TL_SetColor(3, Blue);
{sets trendline 3 to color blue}
TL_SetEnd
Changes the ending point of a specified trendline.
Syntax:
TL_SetEnd(TL_Ref, eDate, eTime, ePrice)
Usage:
TL_Ref: a numeric expression representing the object identification number
(see TL_New for descriptions of eDate,eTime,ePrice)
TL_SetEnd(2, 990221, 1515, 207.125);
TL_SetExtLeft
Changes the leftward extension status of a specified trendline.
Syntax:
TL_SetExtLeft(TL_Ref, Status)
Usage:
TL_Ref: a numeric expression representing the object identification number
Status: True turns on leftward extension, False turns it off
TL_SetExtLeft(2,True);
{turns on left extend for trendline 2}
TL_SetExtRight
Changes the rightward extension status of a specified trendline.
Syntax:
TL_SetExtRight(TL_Ref, Status)
Usage:
TL_Ref: a numeric expression representing the object identification number
Status: True turns on rightward extension, False turns it off
TL_SetExtRight(3,False);
{turns off right extend for trendline 3}
TL_SetSize
Changes the line thickness setting (weight) for the specified trendline.
Syntax:
TL_SetSize(TL_Ref, Size)
Usage:
TL_Ref: a numeric expression representing the object identification number
Size: numeric value ranging from 0 (the thinnest) to 6 (the thickest).
TL_SetSize(2,4);
{sets trendline 2 to thickness 4}
Reserved Words Quick Reference
331
TL_SetStyle
Changes line style for the specified trendline.
Syntax:
TL_SetStyle(TL_Ref,Type)
Usage:
TL_Ref: a numeric expression representing the object identification number
Type:
Tool_Solid = 1 (solid)
Tool_Dashed = 2 (dashed)
Tool_Dotted= 3 (dotted)
Tool_Dashed2= 4 (dashed pattern)
Tool_Dashed3= 5 (dashed pattern)
TL_SetStyle(4,Tool_Dashed);
{sets trendline 4 to dashed}
To
Used in a For-Loop statement to separate the starting and ending counter values.
Usage:
For Value5 = Start To Start + 10 Begin
{Any operations}
End ;
Today
Retained for backward compatibility. Replaced by This Bar.
Tomorrow
Retained for backward compatibility. Replaced by Next Bar.
Tool_Black
Retained for backward compatibility. Replaced by the color name Black.
Tool_Blue
Retained for backward compatibility. Replaced by the color name Blue.
Tool_Cyan
Retained for backward compatibility. Replaced by the color name Cyan.
Tool_DarkBlue
Retained for backward compatibility. Replaced by the color name DarkBlue.
Tool_DarkBrown
Retained for backward compatibility. Replaced by the color name DarkBrown.
Tool_DarkCyan
Retained for backward compatibility. Replaced by the color name DarkCyan.
Tool_DarkGray
Retained for backward compatibility. Replaced by the color name DarkGray.
Tool_DarkGreen
Retained for backward compatibility. Replaced by the color name DarkGreen.
332
APPENDIX C
Tool_DarkMagenta
Retained for backward compatibility. Replaced by the color name DarkMagenta.
Tool_DarkRed
Retained for backward compatibility. Replaced by the color name DarkRed.
Tool_DarkYellow
Retained for backward compatibility. Replaced by the color name DarkYellow.
Tool_Dashed
Represents a dashed line style (2) used with drawing objects.
Tool_Dashed2
Represents a dashed line style (4) used with drawing objects.
Tool_Dashed3
Represents a dashed line style (5) used with drawing objects.
Tool_Dotted
Represents a dotted line style (3) used with drawing objects.
Tool_Green
Retained for backward compatibility. Replaced by the color name Green.
Tool_LightGray
Retained for backward compatibility. Replaced by the color name LightGray.
Tool_Magenta
Retained for backward compatibility. Replaced by the color name Magenta.
Tool_Red
Retained for backward compatibility. Replaced by the color name Red.
Tool_Solid
Represents a solid line style (1) used with drawing objects.
Tool_White
Retained for backward compatibility. Replaced by the color name White.
Tool_Yellow
Retained for backward compatibility. Replaced by the color name Yellow.
Total
Specifies the number of shares/contracts to exit from a position created by pyramiding.
Usage:
ExitLong 5 Contracts Total Next Bar at Market;
{Exits five contracts/shares from the entire long position}
Reserved Words Quick Reference
333
TotalBarsLosTrades
The total number of bars that elapsed during losing trades for all closed trades.
Usage:
Value2 = TotalBarsLosTrades ;
TotalBarsWinTrades
The total number of bars that elapsed during winning trades for all closed trades.
Usage:
Value1 = TotalBarsWinTrades ;
TotalTrades
The total number of closed trades in the current strategy.
TrailingStopAmt
Retained for backward compatibility with previous versions of the product. Replaced
by the reserved word SetDollarTrailing.
TrailingStopFloor
Retained for backward compatibility with previous versions of the product. Replaced
by the reserved word SetPercentTrailing.
TrailingStopPct
Retained for backward compatibility with previous versions of the product. Replaced
by the reserved word SetPercentTrailing.
True
Represents a true, or correct, conditional expression.
TrueFalse
Defines an input that expects a true/false expression.
Usage:
Input: Switch(TrueFalse);
{accepts a true/false input for Switch}
TrueFalseArray
Defines an input that expects a true/false expression for each array element.
Usage:
Input: MyArray[n](TrueFalseArray)
{accepts t/f inputs by value}
TrueFalseArrayRef
Defines an input that expects a true/false variable reference for each array element.
Usage:
Input: MyArray[n](TrueFalseArrayRef) {accepts t/f inputs by reference}
TrueFalseRef
Defines an input that expects a true/false variable reference.
Usage:
Input: Switch(TrueFalseRef)
{accepts a t/f input by reference}
TrueFalseSeries
Defines an input as a true/false series expression.
Usage:
Input: Flag(TrueFalseSeries);
{taccepts a t/f input with history}
334
APPENDIX C
TrueFalseSimple
Defines an input as a true/false simple expression.
Usage:
Input: Switch(TrueFalseSimple);
{accepts a t/f input without history}
TtlDbt_By_NetAssts
Returns the total debt (long + short term) divided by total assets.
Tuesday
Specifies day of the week Tuesday (numeric value = 2).
Under
Used only with Crosses to detect a value crossing under, or below, another value.
Usage:
If Value1 Crosses Under Value2 Then {Any Operation} ;
UnionSess1EndTime
Latest session 1 end time of all data in a multi-data chart.
UnionSess1FirstBar
Earliest session 1 first bar time of all data in a multi-data chart.
UnionSess1StartTime
Earliest session 1 start time of all data in a multi-data chart.
UnionSess2EndTime
Latest session 2 end time of all data in a multi-data chart.
UnionSess2FirstBar
Earliest session 2 first bar time of all data in a multi-data chart.
UnionSess2StartTime
Earliest session 2 start time of all data in a multi-data chart.
Units
Retained for backward compatibility.
UNSIGNED
Reserved for use with custom DLLs designed for EasyLanguage and ELKIT32.DLL.
Until
Reserved for future use.
UpperStr
Used to convert a string expression to uppercase letters.
Usage1:
Value1 = UpperStr("My TextString");
{returns "MY TEXTSTRING"}
UpTicks
Number of ticks on a bar whose value is higher than the tick immediately preceding it.
Reserved Words Quick Reference
335
V
Abbreviation for Volume. Returns the volume of shares/contracts of a referenced bar.
Usage:
If MyVol > V of 1 Bar Ago Then Sell at Close ;
Var
Declares a variable name to use throughout your analysis technique. Shorthand form.
Usage:
Var: Count(10);
{declares the variable Count with an initial value of 10}
Variable
Declares a variable name to use throughout your analysis technique.
Usage:
Variable: Val(5);
{declares the variable Val with an initial value of 5}
Variables
Declares multiple variable names separated by commas.
Usage:
Variables: Countup(0),Countdown(10); {declares and initializes variables}
Vars
Declares multiple variable names separated by commas. Shorthand form.
Usage:
Vars: MyVal(2), MyPrice(31);
{declares and initializes variables}
VARSIZE
Reserved for use with custom DLLs designed for EasyLanguage and ELKIT32.DLL.
VARSTARTADDR
Reserved for use with custom DLLs designed for EasyLanguage and ELKIT32.DLL.
Vega
Returns the Vega value of an option, leg, or position. Debit positions will return positive numbers and credit positions will return negative numbers.
Usage1:
If Vega of Option > HighVal Then Alert("High Vega");
In a Pricing Model, used to set the value of Vega.
Usage2:
Vega(.5);
{sets the value of Vega to 0.50}
VOID
Reserved for use with custom DLLs designed for EasyLanguage and ELKIT32.DLL.
Volume
Returns the number of shares/contracts traded for the referenced bar.
Usage:
If TestVol > Volume of 3 Bars Ago Then Buy at Market ;
Was
Skip word ignored during execution.
Usage:
If Close was < than the Lowest(Close, 14) Then {any operation} ;
Wednesday
Specifies day of the week Wednesday (numeric value = 3).
336
APPENDIX C
While
Defines instructions that are executed until a true/false expression returns False.
Usage:
While Condition1 Begin
{any operations};
End; {continues to loop until the Condition is no longer true}
White
Specifies color White (numeric value = 8) for plots and backgrounds.
WORD
Reserved for use with custom DLLs designed for EasyLanguage and ELKIT32.DLL.
Year
Year on specified calendar date, in short form (last 2 or 3 digits of year)
Returns the year (YYY) portion of the specified calendar date.
Syntax:
Year(cDate);
cDate: numeric expression for the date in YYMMDD or YYYMMDD format.
Usage:
Value1 = Year(1011004)
{returns the year 101 representing 2001}
Yellow
Specifies color Yellow (numeric value = 7) for plots and backgrounds.
Yesterday
Retained for backward compatibility. Refers to the previous bar.
Note: * Server fields (Q_) may not exist or return the same values for all datafeeds.
Index
#
#BEGINALERT .......................................................43, 275
#BEGINCMTRY .......................................................70, 275
#BEGINCMTRYORALERT ................................44, 71, 275
#END ..............................................................................275
A
A (skip word) ........................................................275
AB_AddCell .......................................................167, 275
AB_AddCellRange ...................................................276
AB_AverageCells ...................................................276
AB_AveragePrice ...................................................276
AB_CellCount ...........................................................276
AB_ColorIntervals ...............................................276
AB_GetCellChar ..............................................170, 276
AB_GetCellColor ...........................................171, 277
AB_GetCellDate ..............................................171, 277
AB_GetCellTime ..............................................172, 277
AB_GetCellValue ...........................................172, 277
AB_GetNumCells ..............................................173, 277
AB_GetZoneHigh ..............................................173, 277
AB_GetZoneLow ................................................174, 277
AB_High ...............................................................174, 278
AB_LetterIntervals ............................................278
AB_Low .................................................................175, 278
AB_Median ..................................................................278
AB_ModeCount ...........................................................278
AB_ModePrice ...........................................................278
AB_RemoveCell ................................................169, 278
AB_RowCalc ...............................................................279
AB_RowHeight ...........................................................279
AB_SetActiveCell .........................................169, 279
AB_SetRowHeight ...........................................168, 279
AB_SetZone .......................................................168, 279
AB_StdDev .................................................................. 279
Above ........................................................................... 279
AbsValue .................................................................... 280
Accumulative Calculations
generating orders for next bar, calculations for ...........58
loading data for ..............................................................9
updating every tick, calculations for ............................58
ActivityBar Studies
bar status, obtaining ........................................... 176, 283
cell color, obtaining ........................................... 171, 277
cell date, obtaining ............................................. 171, 277
cell time, obtaining ............................................ 172, 277
cell value, obtaining ........................................... 172, 277
cells
adding ............................................................ 167, 275
removing ........................................................ 169, 278
highest cell price, obtaining ............................... 174, 278
left side of bar, specifying .................................. 177, 299
lowest cell price, obtaining ................................ 175, 278
number of cells, obtaining ................................. 173, 277
price markers, specifying placement ................. 169, 279
referencing ActivityBar data using data alias ....176, 280
right side of bar, specifying ............................... 177, 316
row height, specifying ....................................... 168, 279
text string, obtaining .......................................... 170, 276
understanding ............................................................. 166
zone
height, obtaining ............................................ 173, 277
low price, obtaining ....................................... 174, 277
properties, specifying .....................................168, 279
ActivityData ...................................................176, 280
Addition, performing ....................................................... 13
Additional EasyLanguage Resources ................................3
AddToMovieChain ........................................... 112, 280
338
Advanced Tips
auto-detect loop, understanding ...................................19
calculation time, speeding up .......................................58
conditional expressions, writing ..................................17
division by zero ............................................................14
series arrays, working with ..........................................49
series values, assigning to inputs .................................32
series variables, working with .....................................29
Ago ................................................................................280
Alert .....................................................................40, 280
AlertEnabled .....................................................42, 280
Alerts
Alert Statement ............................................................40
compiler directives .......................................................43
historical data and ........................................................40
trendlines
obtaining alert status ................................................93
setting alert status ...................................................103
writing ..........................................................................39
Aliases, see Data Aliases
All ................................................................................280
An (skip word) ......................................................280
AND ..........................................................................15, 280
Arctangent ...............................................................281
Arguments, see Parameters
Array ...........................................................................281
Arrays
Array Declaration Statement ........................................46
Array Element Assignment Statement .........................47
dimensions ...................................................................45
DLLs referencing .........................................................49
errors, runtime ..............................................................49
functions, referencing previous values of arrays in .....63
loops
populating arrays using loops ..................................48
sorting arrays using loops ........................................63
parameters, declaring arrays as ....................................62
populating ....................................................................48
series arrays, working with ..........................................49
sorting ..........................................................................63
understanding ...............................................................45
values
assigning to elements ...............................................47
referencing ...............................................................48
ARRAYSIZE ..................................................................281
ARRAYSTARTADDR ......................................................281
Ask ........................................................................229, 281
Ask Value .......................................................................229
Asset ...................................................................196, 281
Asset Data Aliases .........................................................196
Asset, referencing underlying ........................................196
AssetType ..................................................................281
AssetVolatility ...................................................281
The Omega Research EasyLanguage Reference Guide
At (skip word) ...................................................... 281
At$ ................................................................................ 281
AtCommentaryBar .............................................68, 282
Auto-detect Loop, understanding .................................... 19
Auto-Detect, MaxBarsBack ............................................. 19
Automating a Trading Strategy, see Trading Strategy
Testing Engine
Availability of Data, OptionStation ............................... 194
AvgBarsLosTrade ...................................................282
AvgBarsWinTrade ...................................................282
AvgEntryPrice ........................................................ 282
AvgList ....................................................................... 282
AVI Files, playing .......................................................... 111
B
Backtesting Trading Strategies, see Backtesting under
Trading Strategy Testing Engine
Bar ................................................................................ 282
BarInterval ............................................................. 282
Bars .............................................................................. 282
Bars Ago, using ............................................................... 17
BarsSinceEntry ...................................................... 282
BarsSinceExit ........................................................ 282
BarStatus ..........................................................176, 283
Based (skip word) ............................................... 283
Begin ........................................................................... 283
Below ........................................................................... 283
Beta .............................................................................. 283
Beta_Down .................................................................. 283
Beta_Up ....................................................................... 283
Bid ........................................................................230, 283
Bid Value ....................................................................... 230
Bid/Ask Models
ask, setting ................................................................. 229
bid, setting .................................................................. 230
calculate modeled bid/ask values ............................... 223
data availability .......................................................... 194
delta, obtaining .......................................................... 226
gamma, obtaining ...................................................... 227
global variables .......................................................... 234
Rho, obtaining ............................................................ 227
theoretical value, obtaining ........................................226
Theta, obtaining ......................................................... 228
tick type, obtaining .................................................... 232
underlying asset price, referencing ............................ 230
Vega, obtaining .......................................................... 228
volatility, obtaining .................................................... 229
BigPointValue ........................................................ 283
Black ........................................................................... 283
Block IF-THEN Statement .............................................. 34
BlockNumber ............................................................. 283
Blue .............................................................................. 284
Book_Val_Per_Share ............................................ 284
Index
BOOL ..............................................................................284
Boolean Expressions ........................................................12
Bouncing Ticks ..............................................................128
BoxSize .......................................................................284
Brackets ........................................................................... 11
Breakeven Stop-Floor ....................................................145
BreakEvenStopFloor ............................................284
Built-in Stops, see Stops
Buy ........................................................................131, 284
By (skip word) ......................................................284
BYTE ..............................................................................284
C
C ...............................................................................11, 284
C and C++, see DLL Functions
Calculation Time, decreasing ...........................................58
Call ..............................................................................284
CallCount ..................................................................284
CallOTMCount ...........................................................285
CallSeriesCount ...................................................285
CallStrikeCount ...................................................285
CallTMCount .............................................................285
Cancel ...................................................................41, 285
Canceling Orders ...........................................................125
Category ....................................................................285
Ceiling .......................................................................285
CHAR ..............................................................................285
CheckAlert ...................................................41, 42, 285
CheckCommentary ...................................................285
ClearDebug ...............................................................285
Close .....................................................................11, 285
Close at End of Day .......................................................145
Close Orders ..................................................................119
Colon, definition ..............................................................11
Colors
numeric equivalents ...................................................273
plot background, changing
OptionStation .........................................................207
RadarScreen ...........................................................183
plot foreground, changing
OptionStation .........................................................206
RadarScreen ...........................................................183
SuperCharts SE ..............................................189, 212
TradeStation ...................................................150, 152
text
obtaining ..................................................................80
setting .......................................................................86
trendlines
obtaining ..................................................................95
setting .....................................................................104
Comma, definition ...........................................................10
Commentary
Commentary Statement ................................................65
339
compiler directives ....................................................... 70
jump words .................................................................. 67
working with ................................................................ 64
Commentary ......................................................... 65, 286
CommentaryCL .....................................................67, 286
CommentaryEnabled ......................................... 69, 286
Commission ............................................................... 286
CommodityNumber ................................................... 286
Comparing Expressions ................................................... 15
Compiler Directives
alerts ............................................................................. 43
commentary ................................................................. 70
Compression, see Compression under Data
Conditional Expressions ............................................12, 17
Contract .................................................................... 286
ContractMonth ........................................................286
Contracts .................................................................. 286
Contracts/Shares, number to use to open a position ...... 132
ContractYear ...........................................................286
Contributor ............................................................. 286
Control
expression .................................................................... 36
structures ...................................................................... 33
variable ........................................................................38
Cosine ......................................................................... 286
Cost ..............................................................................286
Cotangent .................................................................. 287
Counters, using ....................................................25, 37, 55
CreateLeg .......................................................... 220, 287
Cross ........................................................................... 287
Crosses ....................................................................... 287
Crosses Over .............................................................15
Crosses Under ..........................................................15
Cumulative Calculations, see Accumulative Calculations
Curly Brackets, definition ................................................ 11
Current ....................................................................... 287
Current Bar, understanding ..........................................6, 19
Current_Ratio ........................................................287
CurrentBar ............................................................... 287
CurrentContracts ................................................. 287
CurrentDate ....................................................... 22, 287
CurrentEntries ...................................................... 287
CurrentTime ....................................................... 24, 287
Cusip ........................................................................... 288
CustomerID ............................................................... 287
Cyan ..............................................................................288
D
D ............................................................................... 11, 288
DailyLimit ............................................................... 288
DarkBlue .................................................................... 288
DarkBrown .................................................................. 288
DarkCyan .................................................................... 288
340
DarkGray ....................................................................288
DarkGreen ..................................................................288
DarkMagenta .............................................................288
DarkRed .......................................................................288
Data
ActivityData .......................................................166, 176
aliases, see Data Aliases
appending to text files ..................................................73
charts, evaluating data for ..............................................6
compression
RadarScreen indicators ..........................................180
strategy backtesting ................................................127
date format ...................................................................20
functions, using functions with data aliases .................52
grids
evaluating data for .............................................7, 194
loading data for accumulative calculations ................9
reading data for ......................................................195
historical data, testing with trading strategies ............125
MaxBarsBack setting, see MaxBarsBack
OptionStation
availability of data .................................................194
data analysis process ..............................................194
reading ...................................................................195
outputting .........................................................64, 72, 73
pointer data types, see DLL Functions
previous values, referencing ........................................17
printing .........................................................................73
quote fields, understanding ........................................109
real-time/delayed data, monitoring for
trading strategies ................................................118
referencing for each bar ...............................................11
resolution, for trading strategy testing .......................126
streams, referencing .....................................................52
time format ...................................................................23
trading strategies, evaluating data for ........................117
types, see DLL Functions
Data Aliases
data streams, referencing different ...............................52
functions
parameters, using data aliases as ..............................53
using functions with data aliases .............................52
futures contract
obtaining number in Position Analysis Window ...199
referencing current .................................................196
referencing specific ................................................197
no data alias specified ..................................................52
options
number of, obtaining ..............................................201
referencing current .................................................199
referencing specific ................................................200
The Omega Research EasyLanguage Reference Guide
position
number of legs, obtaining ...................................... 203
referencing current ................................................. 201
referencing leg ....................................................... 202
referencing modeled position ................................ 203
underlying asset, referencing .....................................196
understanding ............................................................. 195
Data Analysis, OptionStation ........................................194
Data Streams, referencing ................................................ 52
DataCompression ...................................................288
DataInUnion ............................................................. 288
DataN ........................................................................... 288
Date .................................................................. 11, 21, 288
Dates, working with ......................................................... 20
DateToJulian .....................................................22, 289
Day ................................................................................ 289
DayOfMonth ............................................................... 289
DayOfWeek .................................................................. 289
Days .............................................................................. 289
Debug Window, using ...................................................... 73
Declaring
arrays ............................................................................ 46
global variables (OptionStation) ................................ 233
inputs ............................................................................ 31
parameters .................................................................... 61
variables ....................................................................... 26
Default ....................................................................... 289
Define Feature, functions ................................................. 51
DefineCustField ...................................................289
DEFINEDLLFUNC ........................................................ 289
DeliveryMonth ........................................................ 289
DeliveryYear ...........................................................289
Delta ...................................................................226, 289
Delta Value ..................................................................... 226
Description ............................................................. 290
Dividend .................................................................... 290
Dividend_Yield ...................................................... 290
DividendCount ........................................................ 290
DividendDate ...........................................................290
DividendTime ...........................................................290
Division by Zero .............................................................. 14
Division, performing ........................................................ 13
DLL Functions
arrays, referencing ....................................................... 49
data types ................................................................... 236
defining ......................................................................236
extension kit ............................................................... 239
pointer data types ....................................................... 237
using ........................................................................... 238
Dllr Risk Trailing ...........................................................146
Does (skip word) ................................................. 290
Index
DOUBLE .........................................................................290
DownTicks ............................................................12, 290
DownTo .........................................................................290
Drawing
text on price charts .......................................................76
trendlines on price charts .............................................89
DWORD ...........................................................................290
Dynamic Link Libraries (DLLs), see DLL Functions
E
EasyLanguage Dictionary, using .....................................51
EasyLanguage DLL Extension Kit ................................235
EasyLanguage Support Center ...........................................3
EasyLanguage Toolkit Library ......................................239
EasyLanguage, defined ......................................................2
EasyLanguageVersion ..........................................291
EL_DateStr ...............................................................291
ELDate ...........................................................................21
ELKIT32.DLL ...............................................................239
ELKIT32.H ....................................................................239
ELKITBOR.LIB ............................................................239
ELKITVC.LIB ...............................................................239
Else ..............................................................................291
End ................................................................................291
Entries
execution method, specifying ............................132, 135
exits, tying exits to an entry ...............................137, 141
limiting per position ...................................................122
naming ...............................................................131, 134
price, specifying .................................................133, 135
shares/contracts, specifying number of ..............132, 134
Entry ...........................................................................291
EntryDate ..................................................................291
EntryPrice ...............................................................291
EntryTime ..................................................................291
EPS ................................................................................291
EPS_PChng_Y_Ago ...................................................291
EPS_PChng_YTD ........................................................292
EPSCount ....................................................................292
EPSDate .......................................................................292
EPSTime .......................................................................292
Errors
arrays, run time ............................................................49
division by zero, avoiding ............................................14
EasyLanguage syntax errors ......................................241
text .......................................................................77, 274
trendlines ..............................................................90, 274
Execution Method
Buy .............................................................................132
ExitLong ....................................................................139
ExitShort ....................................................................142
Sell .............................................................................135
understanding .............................................................116
341
ExitDate .................................................................... 292
ExitLong ............................................................ 136, 292
ExitPrice .................................................................. 292
Exits
entries, tying exits to .......................................... 137, 141
execution method ............................................... 139, 142
naming ............................................................... 136, 141
price, tying to bar of entry ................................. 140, 143
shares/contracts, specifying number of .............. 137, 142
stops, see Stops
ExitShort .......................................................... 141, 292
ExitTime .................................................................... 292
Expert Commentary, see Commentary
ExpirationDate ...................................................... 293
ExpirationMonth ................................................... 293
ExpirationRule ...................................................... 293
ExpirationStyle ................................................... 293
ExpirationYear ...................................................... 293
Expired ....................................................................... 293
Expressions
comparing .................................................................... 15
control .......................................................................... 36
numeric ........................................................................12
order of precedence ...................................................... 13
previous values, referencing ........................................ 17
text string .....................................................................12
true/false (also conditional, logical, boolean) ........12, 17
ExpValue .................................................................... 293
F
False ........................................................................... 293
File ..............................................................................293
FileAppend ......................................................... 75, 293
FileDelete ............................................................... 293
Files, outputting to ........................................................... 73
Filling Orders, precedence of, see Fill precedence under
Orders
Find Feature, functions .................................................... 51
FirstNoticeDate ................................................... 293
FirstOption ..................................................... 231, 294
FLOAT ........................................................................... 294
Floor ........................................................................... 294
For ................................................................................ 294
For Loop .......................................................................... 38
FracPortion ............................................................. 294
FreeCshFlwPerShare ............................................ 294
Friday ......................................................................... 294
From (skip word) ................................................. 294
Function Value Assignment Statement ............................54
Functions
also see Reserved Words
arrays as parameters in ................................................. 62
assigning values to ....................................................... 54
342
counters, series functions as .........................................55
data aliases, using functions with ................................52
Define feature ..............................................................51
DLL Functions, see DLL Functions
EasyLanguage Dictionary, using .................................51
Find feature ..................................................................50
Function Value Assignment Statement ........................54
parameters, see Parameters
referencing previous value of ......................................51
series ............................................................................56
simple ...........................................................................55
understanding ...............................................................50
writing ..........................................................................54
Future .................................................................196, 294
Future (num) ...........................................................197
FutureType ...............................................................294
G
G_Rate_EPS_NY ........................................................294
G_Rate_Nt_In_NY ...................................................294
G_Rate_P_Net_Inc .................................................295
Gamma ...................................................................227, 295
Gamma Value .................................................................227
Generate Orders for Next Bar Calculation ......................58
GetBackgroundColor ............................................295
GetBotBound .............................................................295
GetCDRomDrive ........................................................295
GetExchangeName ...................................................295
GetPlotBGColor ......................................................295
GetPlotColor ...........................................................295
GetPlotWidth ...........................................................295
GetPredictionValue ............................................296
GetRowIncrement ...................................................296
GetStrategyName ...................................................296
GetSymbolName ........................................................296
GetSystemName ........................................................296
GetTopBound .............................................................296
Global Variables
Bid/Ask Model ...........................................................234
Pricing Model ............................................................233
understanding .............................................................233
Volatility Model .........................................................234
Gr_Rate_P_EPS ........................................................296
Green ...........................................................................296
GrossLoss ..................................................................296
GrossProfit .............................................................296
H
H ...............................................................................11, 296
Hard Brackets, definition .................................................11
Help System and Jump Words .........................................67
HELP_KEY WinHelp API Call and Jump Words ...........67
High ........................................................................11, 296
The Omega Research EasyLanguage Reference Guide
Higher .........................................................................297
HistFundExists ...................................................... 297
Historical Testing, see Backtesting under Trading Strategy
Testing Engine
I
I ..................................................................................... 297
I_AvgEntryPrice ...................................................297
I_ClosedEquity ...................................................... 297
I_CurrentContracts ............................................ 297
I_MarketPosition ................................................. 297
I_OpenEquity ...........................................................297
If ................................................................................... 297
IF-THEN Statement
Block IF-THEN ........................................................... 34
IF-THEN ...................................................................... 33
IF-THEN Else .............................................................. 35
nesting .......................................................................... 36
Ignoring Statements Using Compiler Directives
alerts ............................................................................. 43
commentary ................................................................. 70
IncludeSignal ........................................................ 298
IncludeSystem ........................................................ 298
Indicators
availability, specifying .......................154, 191, 204, 214
jump words, indicators as ............................................ 67
OptionStation
adding .................................................................... 205
background color, setting ...............................205, 207
data availability ...................................................... 194
foreground color, setting ................................205, 206
naming ................................................................... 205
RadarScreen
adding .................................................................... 181
background color, setting ...............................181, 183
foreground color, setting ................................181, 183
naming ................................................................... 181
removing ................................................................ 184
writing for ..............................................................180
SuperCharts SE
adding ............................................................187, 210
color, setting ..................................188, 189, 210, 212
formatting ......................................................186, 208
naming ...........................................................187, 210
width, setting ..................................187, 190, 210, 213
writing for ......................................................185, 208
tick type, obtaining .................................................... 232
TradeStation
adding .................................................................... 150
bar chart, displaying as .......................................... 149
color, setting ..................................................150, 152
formatting ..............................................................149
naming ................................................................... 150
Index
width, setting ..................................................150, 153
writing for ..............................................................148
Infinite Loops ...................................................................37
InitialMargin ........................................................298
Input(s) ..............................................................31, 298
Inputs (also see Parameters)
Input Declaration Statement ..................................31, 61
series values, assigning to ............................................32
types .............................................................................30
using .............................................................................30
values, referencing .......................................................31
Inside the Bar Technology, see ActivityBar Studies
Inst_Percent_Held ...............................................298
InStr ...........................................................................298
INT ................................................................................298
IntPortion ...............................................................298
Intrinsic Value, call option .............................................200
Is (skip word) ......................................................298
J
JulianToDate .....................................................22, 299
Jump Words and Commentary .........................................67
L
L ...............................................................................11, 299
LargestLosTrade ...................................................299
LargestWinTrade ...................................................299
Last_Split_Date ...................................................299
Last_Split_Fact ...................................................299
LastCalcJDate ........................................................299
LastCalcMMTime ......................................................299
LastTradingDate ...................................................299
Learning to Use EasyLanguage book .........................3
LeftSide ............................................................177, 299
LeftStr .......................................................................299
Leg ................................................................................299
Leg(num) ....................................................................202
LegType .......................................................................300
Libraries, limits on .............................................................3
LightGray ..................................................................300
Limit ...........................................................................300
Limit Orders ...................................................................120
Limits on Size of Libraries ................................................3
Loading Additional Data for Accumulative
Calculations .......................................................9
Log ................................................................................300
Logical
expressions ...................................................................12
operators .......................................................................15
LONG ..............................................................................300
Long Positions
closing ................................................................134, 136
opening .......................................................................131
343
Loops
arrays
populating ................................................................ 48
sorting ...................................................................... 63
control
expression ................................................................ 36
variables ................................................................... 38
For Loop ...................................................................... 38
infinite .......................................................................... 37
While Loop .................................................................. 36
Losses, limiting, see Stops
Low .......................................................................... 11, 300
Lower ........................................................................... 300
LowerStr .................................................................... 300
LPBOOL ......................................................................... 300
LPBYTE ......................................................................... 300
LPDOUBLE .................................................................... 300
LPDWORD ....................................................................... 300
LPFLOAT ....................................................................... 301
LPINT ........................................................................... 301
LPLONG ......................................................................... 301
LPSTR ........................................................................... 301
LPWORD ......................................................................... 301
M
Magenta ....................................................................... 301
MakeNewMovieRef ........................................... 111, 301
Margin ......................................................................... 301
Market ......................................................................... 301
Market If Touched (MIT)
Buy ............................................................................. 133
ExitLong .................................................................... 139
ExitShort .................................................................... 143
Sell ............................................................................. 135
Market Implied Volatility (MIV)
pricing model, obtaining from ................................... 223
theoretical model, obtaining from .............................. 224
Market Orders ................................................................ 119
MarketPosition ...................................................... 301
Mathematical Operators ................................................... 13
MaxBarsBack
Auto Detect setting ...................................................... 19
definition ..................................................................6, 18
ProbabilityMap studies .............................................. 161
User-defined setting ..................................................... 20
MaxBarsBack ............................................................. 301
MaxBarsForward ...................................................... 301
MaxConsecLosers ................................................... 301
MaxConsecWinners ................................................. 301
MaxContracts ...........................................................302
MaxContractsHeld ................................................. 302
MaxEntries ............................................................... 302
MaxGain ....................................................................... 302
344
MaxIDDrawDown ........................................................302
Maximum Number of Bars Study Will Reference Setting,
see MaxBarsBack
MaxList .......................................................................302
MaxList2 ....................................................................302
MaxLoss .......................................................................302
MaxPositionLoss ...................................................302
MaxPositionProfit ...............................................302
Message Log Window
character limit per line .................................................72
formatting output .........................................................73
installing .......................................................................72
outputting to .................................................................72
overview .......................................................................72
MessageLog .........................................................72, 303
MidStr .........................................................................303
MinList .......................................................................303
MinList2 ....................................................................303
MinMove .......................................................................303
MinutesToTime ..........................................................24
MIT, see Market If Touched (MIT)
MIV, see Market Implied Volatility (MIV)
MIVonAsk ....................................................................303
MIVonBid ....................................................................303
MIVonClose ...............................................................303
MIVonRawAsk .............................................................304
MIVonRawBid .............................................................304
Moc ................................................................................304
Mod ................................................................................304
ModelPosition ................................................203, 304
ModelPrice .......................................................230, 304
Models
Bid/Ask Models, see Bid/Ask Models
global variables ..........................................................233
Price Modeling Engine, see Price Modeling Engine
Pricing Models, see Pricing Models
understanding .............................................................221
Volatility Models, see Volatility Models
ModelVolatility ...........................................229, 304
Monday .........................................................................304
MoneyMgtStopAmt ...................................................304
Month ...........................................................................304
Movie Files, see Video Files
Multimedia Files
AVI files, playing ....................................................... 111
WAV files, playing .....................................................110
MULTIPLE ....................................................................305
Multiplication, performing ...............................................13
Music Files, see Sound Files
N
Neg ................................................................................305
Nesting IF-THEN Statements ..........................................36
The Omega Research EasyLanguage Reference Guide
Net_Profit_Margin ............................................... 305
NetProfit .................................................................. 305
NewLine ....................................................................... 305
Next .............................................................................. 305
NoPlot .................................................156, 158, 184, 305
Not ................................................................................ 305
NthMaxList ............................................................... 305
NthMinList ............................................................... 305
Numeric ....................................................................... 306
Numeric Expressions ....................................................... 12
Numeric Parameters ......................................................... 58
NumericArray ...........................................................306
NumericArrayRef ...................................................306
NumericRef ............................................................... 306
NumericSeries ........................................................ 306
NumericSimple ........................................................ 306
NumFutures .......................................................199, 306
NumLegs ...............................................................203, 306
NumLosTrades ...........................................................306
NumOptions .......................................................201, 306
NumToStr .................................................................... 307
NumWinTrades ...........................................................307
O
O ............................................................................... 11, 307
Of (skip word) ...................................................... 307
OI ..................................................................................... 11
On (skip word) ...................................................... 307
Online User Manual and Jump Words ............................. 67
Open ........................................................................ 11, 307
OpenInt ................................................................. 11, 307
OpenPositionProfit ............................................ 307
Operators
definition ................................................................10, 13
logical .......................................................................... 15
mathematical ................................................................13
relational ...................................................................... 14
string ............................................................................ 13
Option .................................................................199, 307
Option (num) ...........................................................200
Option Data Aliases ....................................................... 199
OptionType ............................................................... 307
OR ............................................................................. 15, 307
Or Higher ....................................................... 116, 120, 124
Or Lower ........................................................ 116, 120, 124
Order of Precedence, controlling ..................................... 13
Orders
acceptable orders ....................................................... 121
bouncing ticks ............................................................ 128
built-in stops, see Stops
canceling .................................................................... 125
exit price, tying to bar of entry ..........................140, 143
Index
fill precedence
close orders ............................................................119
limit orders .............................................................120
market orders .........................................................119
stop orders ..............................................................120
fill prices ....................................................................118
open entries per position, limiting .............................122
pyramiding, effect on order placement ......................124
rules determining which to fill ...................................119
shares, number to use to open position ......................121
stand-by orders ...........................................................123
stops, see Stops
trading verbs ..............................................................131
writing ........................................................................116
Origin Type of Text Object ..............................................83
Output Methods
commentary .................................................................64
Debug window .............................................................73
file ................................................................................73
Message Log window ..................................................72
printer ...........................................................................73
Over ..............................................................................308
P
Pager_DefaultName ...............................................308
Pager_Send ...............................................................308
PaintBar Studies
adding .........................................................................156
bar range to paint, specifying .....................................156
color, setting ...............................................................156
naming .......................................................................156
removing ....................................................................158
width, setting ..............................................................156
writing ........................................................................156
Parameters
arrays, using as parameters ..........................................62
data aliases in ...............................................................52
declaring .......................................................................61
Input Declaration Statement ........................................61
numeric ........................................................................58
offsetting values passed into functions as ....................51
reference .......................................................................59
series ............................................................................59
simple ...........................................................................59
text string .....................................................................58
true/false .......................................................................58
variables as ...................................................................59
Parentheses
definition ......................................................................10
precedence, order of .....................................................13
Percent Risk Trailing .....................................................147
PercentProfit ........................................................308
345
Place (skip word) ............................................... 308
PlayMovieChain .............................................. 112, 308
PlaySound .......................................................... 110, 308
Plot ..............................................................................308
Plot1 ........................................................................... 309
Plot2 ........................................................................... 309
Plot3 ........................................................................... 309
Plot4 ........................................................................... 309
PlotN ...........................................................150, 181, 187
PlotNum ............................................................... 205, 210
PlotPaintBar ...................................................156, 309
PlotPB ................................................................. 156, 309
PM_GetCellValue ........................................... 166, 309
PM_GetNumColumns ......................................... 165, 310
PM_GetRowHeight ........................................... 165, 310
PM_High ............................................................... 164, 310
PM_Low ................................................................. 164, 310
PM_SetCellValue ........................................... 163, 310
PM_SetHigh ....................................................... 162, 310
PM_SetLow .......................................................... 162, 310
PM_SetNumColumns ......................................... 162, 310
PM_SetRowHeight ........................................... 163, 310
Pob ................................................................................ 311
Point ........................................................................... 311
POINTER ....................................................................... 311
Pointer Data Types, see DLL Functions
Points ......................................................................... 311
PointValue ............................................................... 311
Pos ................................................................................ 311
Position ............................................................ 201, 311
Position Analysis Window
futures contract
number in window, obtaining ................................ 199
referencing current ................................................. 196
referencing specific ................................................197
options
number in window, obtaining ................................ 201
referencing current ................................................. 199
referencing specific ................................................200
position
number of legs, obtaining ...................................... 203
referencing current ................................................. 201
referencing leg ....................................................... 202
underlying asset, referencing .....................................196
understanding ............................................................. 204
Position Data Aliases ..................................................... 201
Position Search Engine, understanding ......................... 214
Position Search Wizard
holding period, specifying ......................................... 215
underlying asset target price, specifying ....................217
volatility, specifying .................................................. 216
PositionID ............................................................... 311
346
PositionProfit ......................................................311
Positions (Trading Strategy)
entries, limiting ..........................................................122
opening positions, determining number of shares .....121
PositionStatus ..............................................221, 311
Power ...........................................................................312
PrevContribl ...........................................................312
Previous Values, referencing ................................17, 51, 63
Price Data, see Data
Price Modeling Engine
five step process .........................................................222
understanding .............................................................221
update logic ................................................................224
Price_To_Book ........................................................312
PriceScale ...............................................................312
Pricing Models
also see Price Modeling Engine
ask, obtaining .............................................................229
bid, obtaining .............................................................230
calculations, used in ...................................................221
data availability ..........................................................194
delta, setting ...............................................................226
gamma, setting ...........................................................227
global variables ..........................................................233
market implied volatility (MIV), obtaining ...............223
Price Modeling Engine step, obtaining ......................231
Rho, setting ................................................................227
theoretical value, setting ............................................226
Theta, setting ..............................................................228
tick type, obtaining ....................................................232
underlying asset price, referencing ............................230
Vega, setting ...............................................................228
volatility, obtaining ....................................................229
Print .....................................................................73, 312
Print Log, see Debug Window, using
Print Statement .................................................................73
Printer .......................................................................312
Printer, outputting to ........................................................73
ProbabilityMap Studies
cell value
obtaining ........................................................166, 309
setting .............................................................163, 310
columns, number of
obtaining ........................................................165, 310
setting .............................................................162, 310
lower boundary
obtaining ........................................................164, 310
setting .............................................................162, 310
row height
obtaining ........................................................165, 310
specifying .......................................................163, 310
understanding .............................................................159
The Omega Research EasyLanguage Reference Guide
upper boundary
obtaining ........................................................164, 310
setting .............................................................162, 310
Product ....................................................................... 312
Profit .........................................................................312
Profit Target ................................................................... 147
Profits, taking, see Stops
ProfitTargetStop ................................................. 312
Protective ............................................................... 313
Punctuation marks, definition ..........................................10
Put ................................................................................ 313
PutCount .................................................................... 313
PutITMCount ............................................................. 313
PutOTMCount ............................................................. 313
PutSeriesCount ...................................................... 313
PutStrikeCount ...................................................... 313
Pyramiding
order precedence ................................................120, 124
stand-by orders ...........................................................124
Q
q_Ask ........................................................................... 313
q_AskExchange ........................................................ 313
q_AskSize .................................................................. 313
q_BaseCode ............................................................... 313
q_BaseCodeBidAsk ................................................. 313
q_Bid ........................................................................... 313
q_BidExchange ........................................................ 313
q_BidSize .................................................................. 313
q_Close ....................................................................... 314
q_DatafeedID ...........................................................314
q_Date .........................................................................314
q_ExchangeListed ................................................. 314
q_ExpirationDate ................................................. 314
q_High .........................................................................314
q_Hour .........................................................................314
q_Last .........................................................................314
q_LastTradingDate ............................................... 314
q_Low ........................................................................... 314
q_Margin .................................................................... 314
q_Mid ........................................................................... 314
q_Minute .................................................................... 314
q_Month ....................................................................... 314
q_Open .........................................................................314
q_Open2 ....................................................................... 314
q_OpenInterest ...................................................... 315
q_OptionType ...........................................................315
q_QuoteStatus ........................................................ 315
q_Second .................................................................... 315
q_Ticks ....................................................................... 315
q_TickTrend ............................................................. 315
q_Time .........................................................................315
Index
q_TradeVolume ........................................................315
q_UpdateDate ...........................................................315
q_UpdateTime ...........................................................315
q_Year .........................................................................315
Qualifiers, see Data Aliases
Quick_Ratio .............................................................315
Quotation Marks, definition .............................................11
R
Random .........................................................................316
RawAsk .........................................................................316
RawBid .........................................................................316
Red ................................................................................316
Reference Parameters ......................................................59
Relational Operators ........................................................14
Removing a Plot .............................................156, 158, 184
Repeat .........................................................................316
Reserved Words
also see Functions
definition ......................................................................10
price data, referencing .................................................. 11
quick reference ...........................................................275
skip words ....................................................................12
Resolution, see Compression under Data
Resources, EasyLanguage .................................................3
Ret_On_Avg_Equity ...............................................316
RevSize .......................................................................316
Rho ........................................................................227, 316
Rho Value .......................................................................227
RightSide ..........................................................177, 316
RightStr ....................................................................316
Round ...........................................................................317
Runtime Errors, see Errors
S
Saturday ....................................................................317
Screen .........................................................................317
Search Strategies
data availability ..........................................................194
futures contract
referencing current .................................................196
referencing specific ................................................197
holding period ............................................................215
modeled position, referencing ....................................203
options
referencing current .................................................199
referencing specific ................................................200
position
creating leg .............................................................220
Position Search Engine, understanding .................214
underlying asset
referencing .............................................................196
target price .............................................................217
347
validity of position, determining ................................ 221
volatility ..................................................................... 216
writing ........................................................................ 214
Sell ......................................................................134, 317
Semicolon, definition ....................................................... 10
Series
arrays ............................................................................ 49
functions ...................................................................... 56
inputs, assigning series values to .................................32
parameters .................................................................... 59
variables ....................................................................... 29
SeriesCount ............................................................. 317
Sess1EndTime ...........................................................317
Sess1FirstBarTime ............................................... 317
Sess1StartTime ...................................................... 317
Sess2EndTime ...........................................................317
Sess2FirstBarTime ............................................... 318
Sess2StartTime ...................................................... 318
Sessions .................................................................... 318
SetBreakEven ...................................................145, 318
SetDollarTrailing ....................................... 146, 318
SetExitOnClose .............................................. 145, 318
SetPercentTrailing .................................... 146, 318
SetPlotBGColor ......................................183, 207, 319
SetPlotColor ...................152, 183, 189, 206, 212, 319
SetPlotWidth ...................................153, 190, 213, 319
SetProfitTarget ........................................... 147, 319
SetStopContract ........................................... 148, 319
SetStopLoss ..................................................... 147, 319
SetStopPosition ........................................... 148, 320
SGA_Exp_By_NetSales .......................................... 320
Share ........................................................................... 320
Shares ......................................................................... 320
Shares/Contracts, number to use to open a position ...... 132
Short Positions
closing ................................................................ 131, 141
opening ......................................................................134
ShowMe Studies
adding ........................................................................ 150
color, setting ............................................................... 150
naming ....................................................................... 150
removing .................................................................... 156
width, setting .............................................................. 150
writing ........................................................................ 155
Sign ..............................................................................320
Signals, see Trading Signals
Simple
functions ...................................................................... 55
parameters .................................................................... 59
variables ....................................................................... 29
Sine ..............................................................................320
Skip ..............................................................................320
Skip Words ....................................................................... 12
Slippage .................................................................... 320
348
SnapFundExists ......................................................320
Sorting Arrays ..................................................................63
Sound Files, playing ......................................................110
Spaces .........................................................................320
Square .........................................................................320
Square Brackets, definition ..............................................11
SquareRoot ...............................................................321
STAD Club .........................................................................3
Stand-by Orders .............................................................123
StartDate ..................................................................321
Statements, definition ......................................................10
StockSplit ...............................................................321
StockSplitCount ...................................................321
StockSplitDate ......................................................321
StockSplitTime ......................................................321
Stop ..............................................................................321
Stop Loss ........................................................................148
Stop Orders ....................................................................120
Stops
Breakeven Stop-Floor ................................................145
Close at End of Day ...................................................145
contract basis ..............................................................148
Dllr Risk Trailing .......................................................146
Percent Risk Trailing .................................................147
position basis ..............................................................148
Profit Target ...............................................................147
Stop Loss ....................................................................148
understanding .............................................................144
Storage, limitations ............................................................3
Strategy Testing and Development Club ...........................3
Strike .........................................................................321
StrikeConfidence .................................................321
StrikeCount .............................................................321
StrikeITMCount ......................................................321
StrikeOTMCount ......................................................322
String .........................................................................322
String Operators ...............................................................13
StringArray .............................................................322
StringArrayRef ......................................................322
StringRef ..................................................................322
StringSeries ...........................................................322
StringSimple ...........................................................322
StrLen .........................................................................322
StrToNum ....................................................................322
Studies
ActivityBar studies, see ActivityBar Studies
PaintBar studies, see PaintBar Studies
ProbabilityMap studies, see ProbabilityMap Studies
ShowMe studies, see ShowMe Studies
Subtraction, performing ...................................................13
SumList .......................................................................322
Sunday .........................................................................323
SymbolName ...............................................................323
The Omega Research EasyLanguage Reference Guide
SymbolNumber ...........................................................323
SymbolRoot ............................................................... 323
Syntax Errors ................................................................. 241
T
T ............................................................................... 11, 323
Tangent ....................................................................... 323
Target .........................................................................323
TargetType .......................................................231, 323
Testing Trading Strategies, see Trading Strategy Testing
Engine
Text
adding
price chart ................................................................78
RadarScreen ...........................................................182
alignment, setting ......................................................... 88
color
obtaining .................................................................. 80
setting ....................................................................... 86
date, obtaining .............................................................. 81
deleting ........................................................................79
error codes ........................................................... 77, 274
files, outputting to ........................................................ 74
first object, obtaining ................................................... 81
horizontal alignment, obtaining ................................... 82
location, setting ............................................................ 87
next object, obtaining ................................................... 83
origin type, number representing ................................. 83
price charts, drawing on ............................................... 76
price value, obtaining ................................................... 85
text string
obtaining .................................................................. 84
setting ....................................................................... 88
time, obtaining .............................................................84
vertical alignment, obtaining .......................................85
Text .............................................................................. 323
Text String Expressions ................................................... 12
Text String Parameters .....................................................58
Text_Delete ....................................................... 79, 323
Text_GetColor .................................................. 80, 323
Text_GetDate .....................................................81, 323
Text_GetFirst .................................................. 81, 324
Text_GetHStyle ................................................ 82, 324
Text_GetNext .....................................................83, 324
Text_GetString ................................................ 84, 324
Text_GetTime .....................................................84, 324
Text_GetValue .................................................. 85, 324
Text_GetVStyle ................................................ 85, 325
Text_New .............................................................. 78, 325
Text_SetColor .................................................. 86, 325
Text_SetLocation ........................................... 87, 325
Text_SetString ................................................ 88, 325
Text_SetStyle .................................................. 88, 326
Index
Than (skip word) .................................................326
The (skip word) ...................................................326
Then ..............................................................................326
TheoreticalGrossIn ............................................326
TheoreticalGrossOut ..........................................326
TheoreticalValue .........................................226, 326
Theta ...................................................................228, 326
Theta Value ....................................................................228
This ..............................................................................327
Thursday ....................................................................327
Tick Type, obtaining ......................................................232
Ticks .....................................................................11, 327
TickType ............................................................232, 327
Time .................................................................. 11, 23, 327
Times, working with ........................................................23
TimeToMinutes ..........................................................24
Tips, see Advanced Tips
TL_Delete ............................................................92, 327
TL_GetAlert .......................................................93, 327
TL_GetBeginDate .............................................94, 327
TL_GetBeginTime .............................................94, 327
TL_GetBeginVal ................................................95, 327
TL_GetColor .......................................................95, 327
TL_GetEndDate ..................................................96, 328
TL_GetEndTime ..................................................97, 328
TL_GetEndVal .....................................................97, 328
TL_GetExtLeft ..................................................98, 328
TL_GetExtRight ................................................98, 328
TL_GetFirst .......................................................99, 328
TL_GetNext .......................................................100, 328
TL_GetSize .......................................................101, 328
TL_GetStyle .....................................................101, 329
TL_GetValue .....................................................102, 329
TL_New ...................................................................91, 329
TL_SetAlert .....................................................103, 329
TL_SetBegin .....................................................104, 329
TL_SetColor .....................................................104, 330
TL_SetEnd ..........................................................105, 330
TL_SetExtLeft ................................................106, 330
TL_SetExtRight ..............................................106, 330
TL_SetSize .......................................................107, 330
TL_SetStyle .....................................................108, 331
To ...................................................................................331
Today ...........................................................................331
Tomorrow ....................................................................331
Tool_Black ...............................................................331
Tool_Blue ..................................................................331
Tool_Cyan ..................................................................331
Tool_DarkBlue ........................................................331
Tool_DarkBrown ......................................................331
Tool_DarkCyan ........................................................331
Tool_DarkGray ........................................................331
Tool_DarkGreen ......................................................331
Tool_DarkMagenta .................................................332
349
Tool_DarkRed ...........................................................332
Tool_DarkYellow ................................................... 332
Tool_Dashed ............................................................. 332
Tool_Dashed2 ...........................................................332
Tool_Dashed3 ...........................................................332
Tool_Dotted ............................................................. 332
Tool_Green ............................................................... 332
Tool_LightGray ...................................................... 332
Tool_Magenta ...........................................................332
Tool_Red .................................................................... 332
Tool_Solid ............................................................... 332
Tool_White ............................................................... 332
Tool_Yellow ............................................................. 332
Total ........................................................................... 332
TotalBarsLosTrades ............................................ 333
TotalBarsWinTrades ............................................ 333
TotalTrades ............................................................. 333
Trading Signals
also see Orders
bouncing ticks ............................................................ 128
built-in stops, see Stops
execution methods, see Execution Method
exit price, tying to bar of entry ..........................140, 143
exits to entries, tying .......................................... 137, 141
naming ...............................................131, 134, 136, 141
shares/contracts, specifying number
to use ..........................................132, 134, 137, 142
stops, see Stops
Strategy Testing Engine, see Trading Strategy
Testing Engine
testing, see Trading Strategy Testing Engine
trading verbs, see Trading Verbs
understanding ............................................................. 116
Trading Strategy Testing Engine
automation
canceling orders ..................................................... 125
contracts/shares, specifying number ...................... 121
open entries, limiting per position ......................... 122
orders, determining which to fill ........................... 119
price for placing and filling orders ........................ 118
stand-by orders ....................................................... 123
backtesting
bar assumptions ..................................................... 127
bouncing ticks ........................................................128
data resolution ........................................................126
overview .................................................................... 117
Trading Verbs
Buy ............................................................................. 131
ExitLong .................................................................... 136
ExitShort .................................................................... 141
or higher ..................................................... 117, 120, 124
or lower ......................................................117, 120, 124
orders ......................................................................... 116
350
Sell .............................................................................134
understanding .............................................................116
TrailingStopAmt ...................................................333
TrailingStopFloor ...............................................333
TrailingStopPct ...................................................333
Trendlines
adding to price charts .............................................89, 91
alert status
obtaining ..................................................................93
setting .....................................................................103
color
obtaining ..................................................................95
setting .....................................................................104
deleting .........................................................................92
ending point
obtaining date ...........................................................96
obtaining price value ................................................97
obtaining time ..........................................................97
setting .....................................................................105
error codes ............................................................90, 274
extending
left ..........................................................................106
obtaining status ........................................................98
right ........................................................................106
first object, obtaining ...................................................99
next object, obtaining .................................................100
starting point
obtaining date ...........................................................94
obtaining price value ................................................95
obtaining time ..........................................................94
setting .....................................................................104
style of line
obtaining ................................................................101
setting .....................................................................108
thickness of line
obtaining ................................................................101
setting .....................................................................107
value of line at specific bar, obtaining .......................102
True ..............................................................................333
True/False Expressions ....................................................12
True/False Parameters ......................................................58
TrueFalse ..................................................................333
TrueFalseArray ......................................................333
TrueFalseArrayRef ...............................................333
TrueFalseRef ...........................................................333
TrueFalseSeries ...................................................333
TrueFalseSimple ...................................................334
TtlDbt_By_NetAssts ............................................334
Tuesday .......................................................................334
TXT Files, outputting information to ..............................74
U
Under ...........................................................................334
Underlying Asset, referencing .......................................196
The Omega Research EasyLanguage Reference Guide
UnionSess1EndTime ............................................... 334
UnionSess1FirstBar ............................................ 334
UnionSess1StartTime .......................................... 334
UnionSess2EndTime ............................................... 334
UnionSess2FirstBar ............................................ 334
UnionSess2StartTime .......................................... 334
Units ........................................................................... 334
UNSIGNED .................................................................... 334
Until ........................................................................... 334
Update Every Tick Calculation ........................ 58, 156, 158
UpperStr .................................................................... 334
UpTicks ................................................................. 12, 334
User Defined, MaxBarsBack ........................................... 20
User Functions, see Functions
USER32.DLL, see DLL Functions
V
V ............................................................................... 11, 335
Var .......................................................................... 27, 335
Variable .............................................................. 26, 335
Variables
arrays, see Arrays
assigning ...................................................................... 27
benefit of ...................................................................... 25
counters, variables used as .....................................37, 38
declaring ...................................................................... 26
generate orders for next bar calculations ..................... 58
global, see Global Variables
loops and control variables ..........................................38
parameters, using variables as ..................................... 59
series variables .............................................................29
simple variables ........................................................... 29
update every tick calculations ...................................... 58
values, referencing ....................................................... 28
Variable Assignment Statement ................................... 27
Variable Declaration Statement ................................... 26
working with ................................................................25
Vars .............................................................................. 335
VARSIZE ....................................................................... 335
VARSTARTADDR ...........................................................335
Vega ......................................................................228, 335
Vega Value ..................................................................... 228
Video Files, playing ....................................................... 111
VOID .............................................................................. 335
Volatility Models
ask, obtaining ............................................................. 229
bid, obtaining ............................................................. 230
calculating volatility in OptionStation Price
Modeling Engine ............................................... 223
data availability .......................................................... 194
delta, obtaining .......................................................... 226
first option analyzed, confirming ............................... 231
gamma, obtaining ...................................................... 227
Index
global variables ..........................................................234
Rho, obtaining ............................................................227
theoretical value, obtaining ........................................226
Theta, obtaining .........................................................228
tick type, obtaining ....................................................232
underlying asset price, referencing ............................230
Vega, obtaining ..........................................................228
volatility, setting .........................................................229
Volatility, setting and obtaining values ..........................229
Volume ...................................................................11, 335
W
Was (skip word) ...................................................335
WAV Files, playing ........................................................110
Wednesday ..................................................................335
While ...........................................................................336
While Loop
infinite loops ................................................................37
understanding ...............................................................36
White ...........................................................................336
Widths
EasyLanguage numeric values ...................................273
plots, setting ...............150, 153, 156, 187, 190, 210, 213
WORD ..............................................................................336
Y
Year ..............................................................................336
Yellow .........................................................................336
Yesterday ..................................................................336
Z
Zero, division by ..............................................................14
351
352
The Omega Research EasyLanguage Reference Guide