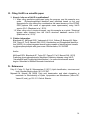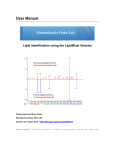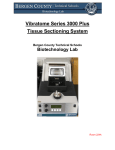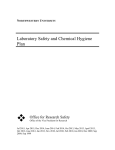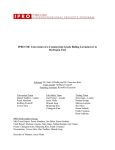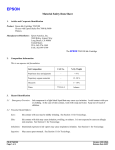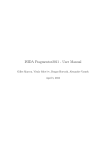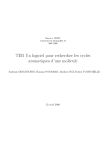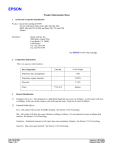
1
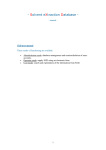
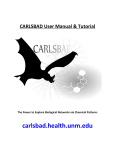
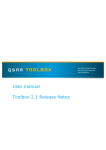
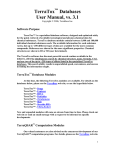
VaLID: Visualization and Phospholipid Identification
a glycerophospholipid m/z-based prediction database
User guide
Version 2.0.0
Developed by:
Graeme S.V. McDowell, Alexandre P. Blanchard, and Nico Valenzuela as part of the
Canadian Institute of Health Research (CIHR) Training Program in Neurodegenerative Lipidomics.
Citations:
Blanchard AP, McDowell GSV, Valenzuela N, Xu H, Gelbard S, Bertrand M, Slater
GW, Figeys D, Fai S, Bennett SAL (2013) Visualization and Phospholipid Identification (VaLID): An online integrated search engine capable of identifying and visualizing glycerophospholipids with given mass. Bioinformatics, 29: 284-285
And/or:
McDowell GSV, Blanchard AP, Taylor GP, Figeys D, Fai S, Bennett SAL (2013) Predicting glycerophosphoinositol identities in lipidomic datasets using VaLID (Visualization and Phospholipid Identification) – an online bioinformatic search engine. Submitted to BioMed Research International
Supported by:
A Strategic Training Initiative in Health Research grant from CIHR and the Institute of
Aging (TGF-96121) to Stephen Fai, Daniel Figeys, and Steffany A.L. Bennett
Online at:
https://www.med.uottawa.ca/lipidomics/resources.html
For tech and resource support:
Please email: [email protected]
I. What is VaLID? ........................................................................................................... 3 II. Using VaLID ............................................................................................................... 4 1. VaLID requirements ............................................................................................... 4 2. Running VaLID ....................................................................................................... 5 3. Searching VaLID’s glycerophospholipid database ................................................. 6 4. Displaying glycerophospholipid structures ............................................................. 8 5. Downloading glycerophospholipid structures ....................................................... 10 6. Exiting the application .......................................................................................... 13 7. Supplementary information .................................................................................. 13 III. Citing VaLID in a scientific paper ............................................................................ 14 1. How do I cite use of VaLID in publications? ......................................................... 14 2. Citation information: ............................................................................................. 14 IV. References ............................................................................................................. 14 2
I. What is VaLID?
“Visualization and Phospholipid Identification” (VaLID) is a web-based application
linking a convenient search engine, a phospholipid database, and multiple visualization
features for the identification and dissemination of large-scale lipidomic datasets. Given
the still developing nature of the lipidomic field, many mass to charge (m/z) values are
not yet represented in open-access web-based engines. To address this need, VaLID
returns all theoretically possible species based on user-defined m/z and MS conditions
in addition to highlighting species identified by members of the Canadian Institutes of
Health Research (CIHR) Training Program in Neurodegenerative Lipidomics (CTPNL)
as of high interest to the neuroscience field. The intent is to complement existing
curated databases by enabling users to predict the identity of “new”, unrepresented,
species detected in their particular mass spectrometry (MS) datasets and thus proceed
more rapidly to validation. While useful for lipid discovery, the user is cautioned that
VaLID includes lipids (and isomeric bond configurations) that may not be biologically
relevant. Investigators are encouraged to mine the presented possibilities for species
most relevant to their specific biological system for subsequent validation. To assist in
decision-making, a “best guess” feature is available whereby lipids listed in blue are
predicted to be the most likely based on the prevalence of constituent fatty acid chains
in mammalian cells (Miyazaki and Ntambi, 2008). Every theoretical conformation (in cis
configuration) for each species can be viewed in 2D and 3D. In this version, curated
species detected in brain tissue by members of the Canadian Institutes of Health
Research (CIHR) Training Program in Neurodegenerative Lipidomics (CTPNL) can also
be downloaded in multiple high-resolution representations for further visualization and
model production.
In version 2.0.0, the VaLID search engine encompasses:
PA [GP10]: glycerophosphates
PPA [GP11]: glyceropyrophosphates
PC [GP01]: glycerophosphocholines
PE [GP02]: glycerophosphoethanolamines
PG [GP04]: glycerophosphoglycerols
PGP [GP05]: glycerophosphoglycerophosphates
PI and PIPX [GP06-09]: glycerophosphoinositols and glycerophosphoinositol mono-, bisand tris-phosphates
PS [GP03]: glycerophosphoserines
CDP-DG [GP13]: cytidine 5'-diphosphate glycerols
VaLID follows the LIPID MAPS classification and nomenclature system in lipid naming
(Fahy et al., 2011).
3
II. Using VaLID
1. VaLID requirements
1.1. An Internet connection is required.
1.2. VaLID is accessible at https://www.med.uOttawa.ca/lipidomics/resources.html
1.3. VaLID 2.0.0 has been tested to work with JavaTM v7 on the following web
browsers:
1.3.1. Safari: v6.1 - OS X
1.3.2. Opera: v17.0.1241.53- Windows
1.3.3. Firefox: v25.0 - Windows; v25.0 - OS X
1.3.4. Internet Explorer: v10.0.9200.16721 - Windows
1.3.5. Chrome: 30.0.1599.101 m - Windows
1.4. The help feature and structure drawing features of VaLID require that the user
enable pop-up windows for the site.
1.5. Before starting VaLID, verify that JavaTM is installed and up to date on your
computer. Java is a programming language required for VaLID to function and it
is free to download. Go to http://java.com/en/download/installed.jsp and click on
“Verify Java version.”
1.6. If you do not have JavaTM installed, follow the instructions on the Java website to
install. Alternatively;
For Microsoft Windows, the latest Java version can be found at:
http://java.com/en/download/manual.jsp.
For Apple OS X, Java can be updated through Software Update (for more information concerning Software Update, go to: http://support.apple.com).
4
2. Running VaLID
2.1. You will be asked to accept the security certificate for our lipid database. This
message will not appear again once you have accepted the certificate.
In some browsers, VaLID will not start until you click once in the center of the
browser window to initiate Java. Once properly loaded, this window will appear:
5
3. Searching VaLID’s glycerophospholipid database
3.1. Choose Exact Mass or Average Mass
3.2. Input the m/z of your lipid of interest into the “Ionic Mass” field.
3.3. Use the drop-down menus to select:
3.3.1. Chain Lengths: Even Chain, Odd Chain or All
3.3.2. Mass Tolerance: ± 0.0001 to ± 2
3.3.3. Lipid Subclass: PA, PPA, PC, PE, PG, PGP, PI and PIPX (PI[3]P, PI[4]P,
PI[5]P, PI[3,4]P2, PI[3,5]P2, PI[4,5]P2, and PI[3,4,5]P3), PS and CDP-DG.
3.3.4. Fatty Chain Linkage: All, Alkenyl-Acyl, Alkyl-Acyl, Diacyl, Dialkyl, or MonoAcyl, Alkyl and Alkenyl.
3.3.5. Lipid ions: [M+H]+, [M+K]+, [M+Li]+, [M+Na]+, [M-H]- or [M(Neutral)].
Note: The glycerophospholipid database contains phospholipids with fatty
chains from 0 to 30 carbons and up to 6 cis unsaturations. The differential
combinations of these individual fatty acyl chains at the sn-1 and sn-2
positions with ester, ether, or vinyl ether linkages lead to the formation of
the majority of biologically relevant lipids.
3.4. When all of the search options are selected based on your MS conditions, click
on the “Search” button or press the “Enter” key on the keyboard.
Note: The program currently does not support parallel searches of
multiple lipid species in different tabs of the same web browser.
3.5. Initial searches may take longer than a minute, depending upon the connection
speed, and search options selected. Why? When a new search is started the
program loads all the lipids with the mass you are searching for into memory, as
well as lipids with mass ratios 25 m/z above and below the target mass. This
cached buffer of lipids with 50 m/z of your target range allows for subsequent
searches close to the original search to occur much faster than if the program
reloaded the database each time.
6
3.6. The possible lipids based on the search criteria will appear in two panels, (i)
“Possible Lipids Include” and (ii) “Possible Isomeric Lipids Include.”
3.7. The left panel (Possible Lipids Include) shows lipid predictions with different
chains at sn-1 and sn-2 positions of the glycerol backbone while the right panel
(Possible Isomeric Lipids Include) shows corresponding isomers with the same
chains but at different positions on the glycerol backbone. Lipid location in these
lists is not sorted by biological significance but grouped according to lipid
subclass (polar head group) and ascending (i) m/z, (ii) number of carbons (sn-1
chain), (iii) degree of unsaturation (sn-1 chain), (iv) number of carbons (sn-2
chain), and (v) degree of unsaturation (sn-2 chain).
7
3.8. Each lipid entry is selectable (click once to highlight a given species). Name and
m/z value can be copied by pressing “CTRL + C” and pasted by “CTRL + V”.
4. Displaying glycerophospholipid structures
4.1. All possible lipid structures can be viewed in a new pop-up window. Make sure
that pop-up windows are allowed on your web browser. The text colour helps
the user to restrict the number of structures presented:
4.1.1. Lipids in black represent theoretically possible combinations.
4.1.2. Lipids in blue are predicted to be the most likely based on prevalence of
fatty acid chains in mammalian cells (Miyazaki and Ntambi, 2008).
4.1.3. Lipids in red indicate that (i) the lipid is part of our CTPNL curated
database of lipids detected by MS methodologies in brain tissue or neural
cells (neurons, astrocytes, or oligodendrocytes including precursor
populations) and (ii) we have generated multiple high-resolution
representations for further visualization and model production.
4.2. To view all possible lipid structures, click once on the lipid of interest. Then click:
4.2.1. The “Display All” button to display all theoretically possible lipid species in
2D. All entries in the database can be visualized in this mode.
Note: Displayed species contain only cis double bonds separated by a
minimum of 2 carbons.
8
4.2.2. The “Best Prediction” button displays only lipid species that are predicted
to be the best guess. This function works only with lipid entries in blue font.
Note: Lipids in VaLID’s “Predicted to be Common” database were
identified based on the relative abundance of certain fatty acid chains in
mammalian cells (Miyazaki and Ntambi, 2008). If both of the fatty acid
chains at the sn-1 and sn-2 positions or if a single chain in a
lysophospholipid are considered common, the lipid is included in the
Predicted Common database and appears in blue.
9
4.2.3. The “Structural representations” button displays lipids that are part of our
CTPNL curated database of neural lipids. This button displays a known
structural representation present in mammalian membranes as a (i) 2D
skeletal model, (ii) 3D “Ball and stick” model, (iii) “Space filling” model and
(iv) our own rendered “VaLID view” model.
5. Downloading glycerophospholipid structures
5.1. To save a lipid structure from the “Display All” or “Best Prediction” windows,
double-click on a structure of interest in the pop-up window displaying all
possible configurations. A new window will open with the selected lipid structure.
10
5.1.1. The image can now be saved in low resolution in two different file types:
5.1.1.1. As an image file, go to the “File” menu, select “Save As Image.” You
will have a choice of the following formats: joint photographic experts
group (.jpg, .jpeg), portable document format (.pdf), portable network
graphics (.png), portable pixmap (.ppm), scalable vector graphics
(.svg, .svgz), Windows BMP (.bmp) and Windows enhanced
metafiles (.emf).
5.1.1.2. As a chemical structure information file that is compatible with
ChemDraw and Marvin, go to the “File” menu and choose “Save
Selection.” A save dialogue box will appear, allowing you to save the
file on your hard drive. You can save the file as one of many file
formats, including ChemAxon Marvin (.mrv), MDL Mol file (.mol) and
CDX file (.cdx, suitable for ChemDraw) formats.
11
5.1.2. To save the high quality (300 dpi) lipid structures present in our “Structural
Representation” databases, click on the model of interest: (i) 2D skeletal
model, (ii) 3D “Ball and stick” model, (iii) “Space filling” model, or (iv) our
own rendered “VaLID view” model.
5.2. A new window will open in the web browser with the name of the species you
have selected. Right click (or double click) on the image and click on “Save
Image” or choose “Save As” from the browser menu.
12
6. Exiting the application
6.1. To close the application, navigate away from the page.
6.2. To free up all resources the application has used, quit/close your browser. By
closing your browser, you close Java and any system resources used by the
application.
7. Supplementary information
7.1. Coding:
7.1.1. The numerical database is contained in Excel™ files.
7.1.2. The search engine and applet are coded in Java™.
7.1.3. The Excel files are read with JExcelApi.
7.1.4. The 2D structures are visualized with ChemAxon’s Marvin View plugin.
7.1.5. The structural representations have been created with ChemDraw® and
Autodesk® Maya® of curated lipid species identified by our CTPNL
researchers by MS methodologies in neural tissue. The models have
been developed by CTPNL researchers for purposes of representation
and dissemination of simulation readouts. Of these models, VaLID view
representations can be used as components of comprehensive membrane
structures. Each lipid is first assembled in ChemDraw 3D. Structures
drawn in 2D with ChemDraw’s drawing tools are automatically translated
into a 3D model in an adjacent panel where each atom of the visualized
molecule are marked by an x, y and z coordinate. These points are then
exported into the 3D modeling and animation software package, Autodesk
Maya v2012. Rigid and dynamic VaLID view models are derived using
Maya’s nParticles tools. Typically, these tools are used in the animation of
dynamic systems such as fire, smoke and water. nParticles are easily
converted into smooth and organic polygonal meshes. By directing these
particles to the x, y, and z coordinates originally generated in ChemDraw
3D and imported in Maya as points in space, a mesh that recapitulates the
original molecular structures in an abstracted, organic, form. Here, VaLID
view models are available for download as rigid polygon models however
in Maya, we have fitted each species between each atom with a rig of
movable joints, a process typically used by graphic artists to animate
human or animal characters. By creating a skeleton embedded within the
mesh model, we have enabled each of these structures to move in a
‘biological’ or dynamic way. Joint attributes are modified to restrict or limit
movement (i.e., in the case of a double bond) and can be reassembled
into membrane form.
13
III. Citing VaLID in a scientific paper
1. How do I cite use of VaLID in publications?
1.1. When citing predictions performed using the program, use this example as a
guide:
Glycerophospholipid identities were predicted based on m/z and
appropriate ion type taking into consideration the mass tolerance of the QTRAP
5500 [replace with name of appropriate mass spectrometer] using VaLID
version 2.0.0 (Blanchard et al., 2013).
1.2. When citing use of structural images, use this example as a guide: “Structural
images were obtained from the VaLID structural database version 2.0.0
(Blanchard et al., 2013).”
2. Citation information:
Blanchard AP, McDowell GSV, Valenzuela N, Xu H, Gelbard S, Bertrand M, Slater
GW, Figeys D, Fai S, Bennett SAL (2013) Visualization and Phospholipid Identification (VaLID): An online integrated search engine capable of identifying and visualizing glycerophospholipids with given mass. Bioinformatics, 29: 284-285
And/or:
McDowell GSV, Blanchard AP, Taylor GP, Figeys D, Fai S, Bennett SAL (2013)
Predicting glycerophosphoinositol identities in lipidomic datasets using VaLID
(Visualization and Phospholipid Identification) – an online bioinformatic search
engine. Submitted to BioMed Research International
IV. References
Fahy E, Cotter D, Sud M, Subramaniam S (2011) Lipid classification, structures and
tools. Biochim Biophys Acta 1811:637-647.
Miyazaki M, Ntambi JM (2008) Fatty acid desaturation and chain elongation in
mammals. In: Biochemistry of Lipids, Lipoproteins and Membranes (Vance DE,
Vance JE, eds), pp 191-211. Oxford: Elsevier.
14