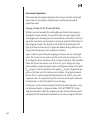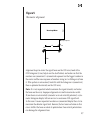
1
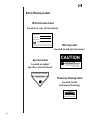
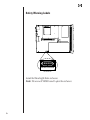
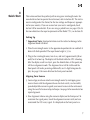
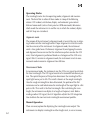
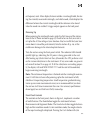
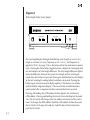
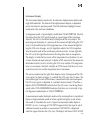
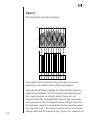
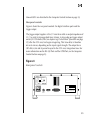
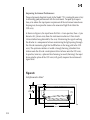
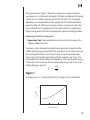
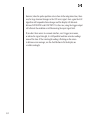
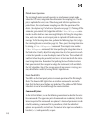
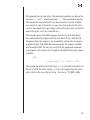
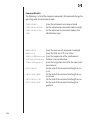
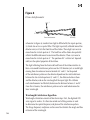
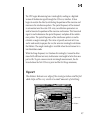
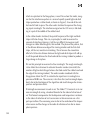
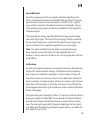
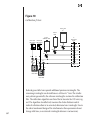
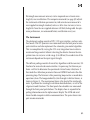
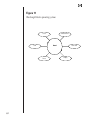
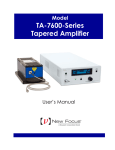
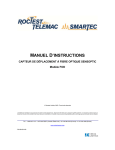
Model 7711 User’s Manual
The Fizeau Wavelength Meter
Patent No. 5,420,6876
CAUTION: Use of controls or adjustments, or performance
of procedures other than those specified herein,
may result in hazardous radiation exposure.
Contents
I
User Safety
Laser Safety Warnings
II
III
IV
Quick Start
Instrument Operation
9
Operating Modes
Manual Operation
Instrument Operation
10
10
16
Computer Control
Principles of Operation
23
24
26
27
35
35
36
39
39
41
43
Power-On Self Test
Error Codes
43
43
VII
AC Operating Voltages
44
VIII
Warranty, Service and Support
IX
Specifications
Input Requirements
Performance
Physical
Environmental
Alignment Laser
2
23
Hardware Error Codes
Warranty
Service
Calibration
700168 Rev. D
7
7
7
8
Interferometer Design
Wavelength Calculation Algorithm
Linewidth Limit
Calibration
The Instrument
VI
3
Setting Up
Aligning Your Source
Making a Measurement
Computer-Control Features
Command Syntax
Command Index
Command Definitions
V
3
46
46
46
46
47
47
47
47
47
47
Is a registered trademark of
New Focus Inc.
I
User
Safety
Laser Safety
Warnings
Your safe and effective use of this product is of utmost importance to us at
New Focus. Please read the “Laser Safety Warnings” before attempting to
operate the wavelength meter.
Caution: Use of controls or adjustments or performance of procedures other
than specified herein may result in hazardous laser light exposure.
Up to 1-mW of diode-laser radiation, at a wavelength of 633 nm, is emitted by
this unit. The laser light emitted from this unit could be harmful to the
human eye. Avoid looking at the laser beam directly. The safety labels shown
on the following pages are attached to this product.
Note: The user will NEVER need to open the wavelength meter enclosure or
the interferometer module inside. The interferometer module contains all the
optics in the instrument including the diode alignment laser. Unauthorized
opening of the wavelength meter will void the warranty, and may result
in misalignment of the interferometer and/or irreparable damage to the
internal components. Diode laser power of 5 mW maximum at a wavelength
of 633 nm could be accessible in the interior of the interferometer module.
3
Safety Warning Labels
ID/Certification Label
Located on rear of instrument.
Model Number:
Serial Number:
Manufactured:
NEW FOCUS, Inc.
2630 Walsh Ave. • Santa Clara, CA • 95051–0905
This product conforms to the applicable requirements of
21 CFR 1040.10 and 1040.11 at the date of manufacture.
Warning Label
Located on top of instrument.
Aperture Label
Located at output
aperture of instrument.
CAUTION
LASER LIGHT
DO NOT STARE INTO BEAM
Power Output: 1 mW max
Diode Laser - Wavelengths emitted may range
from 600nm to 700nm. Consult users manual.
CLASS II LASER PRODUCT
AVOID EXPOSURE
LASER LIGHT EMITTED
FROM THIS APERTURE
Protective Housing Label
Located inside
instrument housing.
DANGER
Laser Radiation When Open
AVOID DIRECT EYE EXPOSURE
4
Safety Warning Labels
ID/Certification Label
Warning Label
Aperture Label
5
Safety Warning Labels
DANGER
Laser Radiation When Open
AVOID DIRECT EYE EXPOSURE
Inside the Wavelength Meter enclosure.
Note: The user will NEVER need to open the enclosure.
6
II
Quick Start
This section outlines the quickest path to using your wavelength meter. For
more detail on how to operate the instrument, refer to Section III. The instrument is configured at the factory for the line voltage and frequency appropriate for your country. If you are unsure how your unit is configured, check
Section VII for more details. If you are using a pulsed laser, see pages 19 & 24.
For more details on the input requirements of the Model 7711, see Section IX.
Setting Up
* Important Note: Input polarization must be vertical or damage to the
alignment diode will occur.
1. Place the wavelength meter in the approximate position for use and lock it
down with forks provided. The input beam height is 3.5 in.
2. Plug in the wavelength meter, turn it on, and wait (approximately 30 seconds) for it to boot up. The display will be blank while the CPU is booting.
After the display reads Low Input, press the Mode button. At this point you
will be in alignment mode. The alignment laser will be visible and the
front panel will read a percentage followed by an 11-digit histogram display. See page 11 for more detail on the front-panel controls.
Aligning Your Source
3. Coarse align your beam into the wavelength meter by overlapping your
source’s beam with the alignment beam. For best results, use two widely
spaced adjustable mirrors to guide your source beam into the instrument
using the near/far beam overlap technique. See page 16 for more detail on
input alignment.
4. Fine alignment is done using the numeric display on the front panel. To
maximize the signal power, tweak the alignment mirrors until you have
maximized the CCD array signal. It is displayed on the front panel as a
7
percentage of the saturation power. Then center the signal beam on the
CCD array using the histogram display. The instrument uses automatic
gain control, so the peak of the histogram display will often remain at 7, 8
or 9 while the power display rises and falls. If the power display reaches
100%, you’ll need to attenuate your beam. See page 13 for more details on
the instrument display.
Making a Measurement
5. Once you have optimized the alignment, switch the unit into measurement mode by pressing the Mode button again. The wavelength of your
laser should now appear on the display.
6. Choose the units, or other functions, appropriate to your application. See
page 11 for a complete description of front-panel operation.
7. You can now operate the unit remotely through the GPIB or RS232 ports.
Refer to the computer control section on page 23 for details.
8
III
Instrument
Operation
The New Focus Model 7711 Fizeau Wavelength Meter is a robust instrument
that performs precision wavelength measurements over a spectral range of
400 nm to 1.0 µm. Wavelength from both cw and pulsed sources can be measured with 0.001 nm resolution. The instrument consists of an interferometer
and an electronics package, as shown in Figure 1. A CCD array detector captures the interference pattern generated by the interferometer. The detector
driver digitizes this interference pattern and transfers it to the on-board CPU.
The CPU performs the wavelength calculation by analyzing the digitized
interference pattern with a specialized algorithm. For more detail on the
principles of operation see Section V.
Several user interface features are designed into the unit. An automatic gain
control (AGC) algorithm adjusts the CCD signal for optimum performance
through variations in the source power of up to two orders of magnitude. A
visible guide beam and a proportional numeric display of the CCD array signal simplifies input alignment. The onboard CPU allows you to operate the
instrument both manually through the front panel and remotely using computer control.
Figure 1
Inside the Wavelength Meter enclosure.
Note: The user will NEVER need to open the enclosure.
CPU
Electronics
Package
Front
Interferometer
9
Operating Modes
The wavelength meter has two operating modes, alignment and measurement. The basic flow in either of these modes is a loop of the following
actions: CCD readout, calculation, display, and automatic gain control.
External commands (such as front-panel or GPIB commands) determine
which mode the instrument is in and the way in which the readout, display
and AGC steps are carried out.
Alignment mode
The purpose of the instrument’s alignment mode is to assist the user in aligning a source into the wavelength meter. Proper alignment is critical to maintain the accuracy of the instrument. In alignment mode, the instrument
emits a laser guide beam. Preliminary alignment by overlapping the source
and alignment beams ensures that the interference pattern reaches the CCD
array. Final alignment is performed based on a histogram of the CCD array
signal. After 15 minutes in alignment mode, the instrument reverts to measurement mode to conserve alignment-laser lifetime.
Measurement Mode
In measurement mode, the instrument uses the CCD array signal to calculate
the laser wavelength. The CCD signal consists of a sinusoidal interference pattern. The spatial frequency of this pattern determines the wavelength of the
input light to one part in 104. This result is known as the rough wavelength.
Once the rough wavelength has been determined, the position of the first
minimum can be used to determine the wavelength of the input light to a few
parts in 106. This result is the final wavelength. After calculating the wavelength, the instrument can display it in length or frequency units. Before
reading another CCD signal, the AGC algorithm adjusts the CCD integration
time to obtain the most accurate wavelength measurement possible.
Manual Operation
There are many options for displaying the wavelength meter output. The
instrument can display wavelength in either length units, in air or vacuum,
10
or frequency units. Other display features include a wavelength hold, for storing the currently measured wavelength, and a delta mode, which displays the
difference between the current wavelength and the reference value stored
when the mode was enabled. A trigger output appears on the back panel.
Powering Up
Before powering the wavelength meter up for the first time read the instructions in the AC Power section on page 43. Check to be sure that your unit is
set up for the AC line voltage at your location. Also, be careful that your laser
source doesn’t exceed the peak intensity listed in Section IX, p. 46, as this
could cause damage to the internal optical elements.
Turn the unit on using the front-panel switch. The indicator LEDs should
quickly light up, indicating the DC power is being generated in the unit.
After booting up (which takes less than 30 seconds) the CPU performs a test
on the various subsystems in the instrument. If any error codes are generated, consult Section VI on page 42. If all the subsystems are working properly, the display will read NEW FOCUS 7711 and the unit will immediately
begin measuring wavelength.
Note: The instrument temperature is factored into the wavelength measurement. It will take six hours after powering up for the instrument to fully
stabilize at its operating temperature. Small temperature gradients during
warm-up can cause measurement errors, so we recommend that you leave
the unit on at all times to minimize this error. Our accuracy specifications
do not apply to a unit that hasn’t fully warmed up.
Front Panel Controls
The controls on the front panel, shown in Figure 2, implement a number
of useful features. The Mode button toggles the instrument between
Measurement and Alignment Modes. The Resolution button toggles between
high and low resolution modes. In low resolution mode, the rough estimate
of the input wavelength is displayed. Pressing the Units button will cycle
11
Figure 2
Wavelength Meter front panel.
Fizeau Wavelength Meter
7711
User Cal.
Temperature Error
Addressed
Low Res.
Alignment Mode
Remote
Made in USA
Display Options
Instrument State
Mode
Resolution
Units
Delta
Hold
Local
Power
NEW FOCUS, Inc.
GPIB Address
Baud Rate
Set
GPIB Address
Set
Baud Rate
the wavelength display through the following units: length in air (nm air),
length in vacuum (nm vac), frequency in cm-1 (cm-1), and frequency in
gigahertz (GHz). See page 37 for a discussion of how the instrument converts
units. Pressing the Delta button toggles between a display of wavelength readout and a display of wavelength difference. The wavelength difference display
shows the difference between the current wavelength and the wavelength
stored when the button was pressed. Pressing the Hold button fixes the display
to the last wavelength reading before the button was pressed. Pressing the
button again returns to normal display updates. (This feature can also be
used to hold the alignment display.) The Local button reestablishes frontpanel control after a computer-interface command has been received.
Pressing and holding the GPIB Address button displays the instrument’s
GPIB address. Pressing and holding the Baud Rate switch displays the baud
rate. The Set switch will change either the address or baud rate of the instrument. To change the GPIB address, hold the GPIB Address button then press
the Set switch. To change the baud rate, hold the Baud Rate button then
press the Set switch.
12
Instrument Display
The instrument display consists of a 16-character alphanumeric display and
eight LED indicators. The format of the alphanumeric display is dependent
on the instrument’s operating mode. The LED indicators highlight various
instrument states and error conditions.
In alignment mode, a typical display would show 2% 66778887766. The first
characters show the CCD signal strength as a percentage of the saturation
intensity. The last 11 characters form a histogram of the array output. The
percentage on the display is a measure of the amount of light hitting the CCD
array. It is derived from the CCD integration time. As the amount of light hitting the CCD array changes, an AGC algorithm adjusts the CCD integration
time to keep the peak of the interference pattern constant. As more light hits
the CCD array the algorithm decreases the integration time to compensate.
The display is related to the inverse of the integration time; therefore it is not
a linear function of input intensity. A display of 0% means that the minimum
detectable intensity (or less) is hitting the CCD array and the CCD integration
time is a maximum. Similarly, a display of 100% means that the array is saturated (or nearly so) and the integration time is minimum.
The eleven numbers on the right of the display create a histogram of the CCD
array signal. As shown in Figure 3, we divide the CCD array into 11 zones. The
maximum signal in each of these zones, normalized to the maximum possible CCD array signal, is displayed as a number between 0 and 9. Therefore, a
display of 0% 00000000000 indicates that the CCD array is not being illuminated, while 100% 99999999999 indicates that the array is saturated. A typical alignment-mode display is 16% 67788888765.
In measurement mode, the display reads out the wavelength to six significant
figures in high resolution mode or to four significant figures in low resolution mode. It also shows the units. A typical measurement mode display is
632.991 nm vac. A message of LOW INPUT appears when the input is not of
sufficient intensity to perform a measurement. SATURATED is displayed
when the signal saturates the CCD array. The display will show CHECK ALIGN
13
Figure 3
Wavelength Meter alignment histogram.
4096
0
0
1024
9
8
7
6
5
4
3
2
1
0
7 7 8 8 8 8 8 8 8 7 7
when problems with the interference fringe pattern prevent an accurate
measurement. This condition is often caused by poor alignment.
Eight individual LED displays highlight some of the instrument’s operating
modes and error conditions. The Delta and Hold buttons illuminate when
their respective functions are activated. Similarly, the Low Res. and
Alignment Mode LED’s, located behind the front bezel, light up when those
instrument states are valid. The Temperature Error LED lights to show that
the interferometer temperature is beyond the instrument’s operating temperature range of 10° to 40° C. We cannot guarantee the accuracy of wavelength
readings made outside this temperature range. The User Cal., Addressed, and
14
Remote LED’s are described in the Computer Control Section on page 23.
Rear-panel controls
Figure 4 shows the rear panel controls: the digital interface ports and the
trigger output.
The trigger output supplies a 0 to 5 V wave form with an output impedance of
1 kΩ to assist in timing pulsed-laser systems. A rising edge on trigger output
occurs 32 CCD clock cycles (see Improving Pulsed-Laser Operation on page
19) after the CCD array has begun integrating. This time delay is therefore
64 ms to 4.6 ms, depending on the input signal strength. The output has a
50% duty cycle and its period is equal to the CCD array integration time. For
more information on the RS-232 Port and the GPIB Port, see the Computer
Control Section on page 23.
Figure 4
Rear-panel controls
WARNING
For continued protection against fire hazard,
replace only with the same type and rating of fuse.
Input VAC
90 - 120
200 - 250
Fuse
1.6 A T
0.8 A T
!
CAUTION
Risk of electric shock, do not remove cover.
Refer servicing to qualified service personnel.
100 - 250
VAC
0.4 - 0.2 A, 48-66 Hz
NEW FOCUS, Inc.
Model Number:
Serial Number:
Manufactured:
NEW FOCUS, Inc.
2630 Walsh Ave. • Santa Clara, CA • 95051–0905
TRIGGER
OUTPUT
RS232
IEEE 488
This product conforms to the applicable requirements of
21 CFR 1040.10 and 1040.11 at the date of manufacture.
15
Instrument Operation
This section discusses proper alignment of your source into the wavelength
meter, some ways to improve its performance, and the special needs of
pulsed-laser users.
Aligning An Input To The Wavelength Meter
Whether you plan to control the wavelength meter from the front panel or
through the remote interface, you must first align your input signal to the
wavelength meter. To begin, place the instrument on a flat surface. After turning on the instrument and waiting for it to boot up, push the Mode button to
enter alignment mode. The Alignment Mode LED on the front panel will
light up to show that the unit is in alignment mode and the guide beam will
emerge from the opening in the instrument enclosure.
Figure 5 shows a typical setup for aligning your source into the wavelength
meter. The two mirrors are used to steer the source into the instrument. Use
M1 to align the source’s position, and M2 to align its direction. This procedure
works best if these two mirrors are at least 18 in. apart. To begin the alignment procedure, simply overlap the source and alignment beams at the point
Pnear using M1, then overlap them at the point Pfar using M2. Repeat this procedure a few times until the two beams are collinear. Using gimbal mounts
like our 9812’s, and increasing the distance between M1 and M2, will make
alignment easier. It’s important to get the two beams to overlap to within one
beam diameter, as this will simplify the next two steps.
At this point, use the instrument display to refine the input alignment. A typical instrument display in alignment mode is 35% 67778887776. To fine
align the instrument, adjust the alignment mirrors to maximize the percentage displayed. The instrument should now be very close to aligned. The final
16
Figure 5
Front
Wavemeter alignment
Wavelength Meter
Input Aperture
>18"
Pnear
M1
M2
Pfar
alignment step is to center the signal beam on the CCD array. Look at the
CCD histogram (it may help to use the Hold button) and make sure that the
numbers are symmetrical. A symmetrical sequence has the biggest number in
the center and the same sequence of numbers rising to it as falling away from
it. If the pattern is not centered, tweak M2 until the histogram is symmetrical;
then re-optimize the intensity on the CCD array.
Note: It is very important to both maximize the signal intensity and center
the beam on the array. Improper alignment can lead to inaccurate results.
If your beam is not circularly symmetric or is not vertically polarized, a symmetric histogram display will not occur at a maximum CCD signal level.
In this case it’s more important to achieve a symmetrical display than it is to
maximize the detector signal level. However, the best course of action in this
case is to filter the beam or rotate its polarization. Non-vertical polarization
can damage the alignment laser.
17
Improving Instrument Performance
Proper alignment of optical inputs to the Model 7711 wavelength meter is key
to achieving good performance with the instrument. To speed up its operation, or to reduce the input power requirement of the instrument some beam
shaping may be required to increase the amount of light that strikes the
CCD array.
As shown in Figure 6, the input beam first hits a 1 mm aperture, then a 5 µm
diameter slit, 38 mm away from the instrument enclosure. It then travels
148 mm before being detected by the array. Maximizing the signal reaching
the detector is a compromise between maximizing the light passing through
the slit and minimizing light lost to diffraction in the long path to the CCD
array. The optimum solution is to add a strongly focusing cylindrical lens
to focus onto the slit and a weak spherical lens to focus onto the CCD array.
In practice, however, a spherical lens focusing (or nearly focusing) the input
beam onto the plane of the CCD array will greatly improve the instrument’s
signal level.
Figure 6
Interferometer detail
1.51"
(38 mm)
Slit
2.28"
(58 mm)
CCD
Array
Étalon
7.47"
(190 mm)
18
The graph shown in Figure 7 shows the average power required to make a
measurement as a function of wavelength. The data was obtained by focusing
a HeNe laser to a 300 µm diameter spot on the CCD array. The wavelength
dependence was extrapolated from the responsivity of Si and the diffraction
properties of the slit. While measurements at lower average powers than this
can be achieved, this is a good practical limit to the instrument’s performance.
Higher average powers than these will improve the speed of wavelength readout.
Improving Pulsed-Laser Operation
* Important Note: Input polarization must be vertical or damage to the
alignment diode will occur.
Until now, we have discussed wavelength meter operation irrespective of the
kind of source being measured. While the instrument can be used to measure
the wavelength of a diverse set of sources, there are special considerations
when using it with pulsed (particularly with low repetition rate) lasers. The
wavelength meter’s optical damage threshold sets a limit on the pulse energy
of the source to be measured. The maximum pulse energy that can be used
without damage is given by
πω 2
I MAX ⋅ τ ⋅
0
4
Figure 7
Average power vs. λ through the spectral range of the instrument.
Pmin (µW)
100
10
1
400
600
800
1000
Wavelength (nm)
19
where Emax is the maximum pulse energy before damage occurs, Imax is the
instrument damage threshold (1MW/cm2), τ is the pulse width, and ω0 is the
beam diameter. So, the maximum energy content of the pulse depends on the
pulse width and the size of the beam. For example, consider a 1 µm laser
making 10 ns pulses. If it had a beam diameter of 300 µm, it could have a
pulse energy of 2 µJ before damaging the alignment laser. It is important to
keep in mind that the laser must also have an average power greater than the
minimum detectable input power. The laser in the previous example would
need an average power of 200 µW to be measured. At a 10 Hz repetition rate
this equals 20 µJ per pulse. It is clear from this analysis that this laser cannot
be measured without damaging the instrument. There are two ways to remedy this situation. One is to increase the pulse repetition rate; the other is to
use a cylindrical lens to reduce the minimum average power requirement as
discussed above.
While the integrating effects of the CCD array make wavelength meter operation insensitive to pulse width (until the pulses get short enough to violate the
minimum pulse length specification, see page 46), the pulse repetition rate
will greatly affect the instrument’s performance. Use of this instrument can be
divided into three classes of repetition rates. Basically, this is due to the number of pulses detected during the integration time. If the pulse repetition rate
is 1 kHz or higher, your source is equivalent to a cw source and timing issues
will not affect the measurement. If you are having trouble getting a wavelength reading when your pulse repetition rate is between 10 Hz and 1 kHz,
try attenuating the beam. This will increase the integration time and capture
more pulses. If your pulse repetition rate is less than 10 Hz, you will probably
need to synchronize your laser’s output to the wavelength meter’s time base.
See the description of the trigger output on page 15.
To further understand why there are three classes of pulse repetition rates, you
need to understand how CCD arrays work.* Our CCD array consists of two
* See R. S. Muller and T. L. Kamins, Device Electronics for Integrated Circuits, 2nd ed.
(Wiley and Sons, New York, 1986), p. 409 for more detail on CCD arrays.
20
arrays of analog memory. The integrating array stores the charge generated by
the incident radiation. The second array, the storage array, is read out by the
CCD clock. This clock’s frequency is variable; therefore the time it takes to
read out the storage array is also variable. As the storage array is being read
out, the integrating array is storing charge. Once the storage array has been
read out, the integrating array’s contents are shifted to the storage array. Then
the entire process begins again.
The automatic gain control (AGC) algorithm changes the CCD clock rate to
achieve an optimum signal level. This affects both the readout rate and the
CCD integration time. When the input is a cw source, the CCD array signal
level depends linearly on the integration time. With a pulsed source, however,
the CCD array signal level is a stepwise function of integration time. As the
integration time is increased, more pulses fall within the integration window
and the CCD signal level increases discontinuously. This is not a problem if
the pulse repetition period is much shorter than the integration time, because
the contribution of each additional pulse is small. In this case the AGC algorithm works well.
When the pulse repetition period is similar to the integration time, problems
can arise. As the algorithm adjusts the integration time, nothing happens
until another pulse is caught. The CCD intensity then suddenly jumps, often
saturating the array. The display will then either alternate between LOW
INPUT and SATURATED or between a measurement and SATURATED. In this
situation there are two possible solutions. One is to decrease the signal intensity, which increases the required integration time and the number of pulses
captured. The other is to turn off the AGC algorithm, which can only be done
remotely (see the TIMe:INTegrate command in Section IV).
Another potential problem is that the CCD clock and the input pulse train are
not synchronized. As the phase between these two time bases drifts, you may
catch a different number of pulses within the CCD integration time. When the
number of pulses in the integration window is high, this is rarely a problem.
21
However, when the pulse repetition rate is close to the integration time, there
may be large transient changes in the CCD array signal. Once again the AGC
algorithm will respond to these changes and the display will alternate
between SATURATED and LOW INPUT. In this case, using the trigger output
will alleviate the condition as will decreasing the input signal level.
If you don’t have access to a remote interface, can’t trigger your source,
or reduce the signal strength, it is still possible to obtain accurate readings
some of the time. If the wavelength reading is flashing on the screen
in between error messages, use the Hold button to fix the display on
a valid wavelength.
22
IV
Computer
Control
The Model 7711 wavelength meter can be programmed remotely by either a
IEEE-488 or RS-232 interface. You can use any computer that supports either
of these standards to interface with the wavelength meter. Before communicating with the instrument set the device address or the baud rate by following the instructions in Front Panel Controls on page 11. GPIB connections
are made through a standard IEEE-488 cable. For serial communications,
the wavelength meter is configured as a DCE port. This means that the instrument receives data on pin 2 and sends data on pin 3 of its 9-pin RS-232 connector. Therefore, you’ll need a null modem cable to connect the instrument
to the host computer.
Upon receiving a computer command, the front panel functions are locked
out. Use the Local front-panel button to re-enter front panel control. The
operating mode (i.e., high or low resolution mode, as well as delta or hold
mode) is not changed by pressing the Local button. There is no provision for
arbitrating between IEEE-488 and RS-232 commands.
Computer-Control Features
The computer commands allow you to perform all front-panel operations
as well as access several functions that can only be reached through
computer control.
User Calibration
If you desire greater accuracy near a particular operating wavelength, or if
you suspect that the instrument has drifted since it was calibrated at the factory, you can attempt a user recalibration. To recalibrate the unit, apply a
precisely known wavelength standard and execute the user calibration command (see page 31). If performance degrades (precise instrument calibration requires several wavelengths, see Calibration on page 37) simply reset
the instrument by powering down. The User Cal. LED lights up when the
instrument is using user-corrected calibration parameters. Our accuracy
specifications do not apply in this operating mode. To be sure of the performance of your unit, see Section VIII for information on factory recalibration.
23
Pulsed-Laser Operation
The wavelength meter normally operates in asynchronous sample mode,
where the CCD array integration time determines the sampling rate. The display is updated after every scan. When being used with low repetition rate
pulsed lasers, this asynchronous sampling can affect the operation of the
device. (See Improving Pulsed-Laser Operation on page 19.) Turning off the
automatic gain control (AGC)algorithm with the TIMe:INTegrate command can often lead to a more meaningful display. By fixing the integration
time, only cases where an extra input pulse is captured will lead to an error
message. To fix the integration time, perform the following steps. First, align
the wavelength meter as usual(see page 16). Then, query the integration time
by issuing a TIMe:INTegrate? command. Then simply issue another
TIMe:INTegrate command, this time specifying the integration time as
the fixed value. Finally, adjust this integration time by a few percent to reach
a value that provides an error-free display most of the time. This method will
work best when the pulse period of your laser is at least one fourth the instrument integration time. Remember that pushing the Local button to return
front-panel control (for example to realign the instrument) will reestablish
the AGC algorithm. Also, if the average power of your source is varying, you
may obtain better results by leaving the AGC algorithm on.
Front-Panel LED’s
Two LED’s on the front panel pertain to remote operation of the Wavelength
Meter. The Remote LED lights when an interface command is received to
show that the front-panel buttons are locked out. The Addressed LED flashes
when data is sent or received through the remote interfaces.
Command Syntax
In the list that follows, we use the following conventions to describe the interface commands. The uppercase parts of commands are mandatory, while the
lowercase parts of the commands are optional. A choice of parameters is indicated by enclosing a command list in parentheses, while the individual
options are separated by vertical bars. Parameters to be input are enclosed in
brackets (<>) and separated by a space.
24
All commands are case insensitive. The command preambles are either of the
characters “*” and “:” while the character “;” is the command terminator.
The command is not parsed until a new line character is received. Numbers
may contain at most 15 characters. In most cases, this constraint will not be
an issue. Commands that expect integer values will truncate after any decimal
point in the input, so 11.56 is truncated to 11.
The examples given in the following pages show the text to be included in
the command and the response from the instrument (if any). With RS-232
communications, the response is sent immediately and the user may process
or ignore the data. With IEEE-488 communications, the response is loaded
into the output buffer. The user may read it with the appropriate command
or else ignore it. For instance, the example for the identification query appears
as follows:
IDN?
—> New Focus, 7711,00012,1.00a
The example demonstrates that the string IDN? is sent to the instrument over
RS-232 or GPIB. The arrow symbol (—>) shows the response from the instrument, which in this case is the text string, “New Focus, 7711,00012,1.00a.”
25
Command Index
The following is a list of the computer commands. All commands change the
operating mode to measurement mode.
CONF:MODe?
CONF:MODe:ROUGh
CONF:MODe:FINe
IDN?
Query the instrument measurement mode.
Set the instrument measurement mode to rough.
Set the instrument measurement mode to fine.
Identification query.
MEAS:WAVe
MEAS:CCD
SENSe:TEMPerature
SYSTem:CALibrate
TIMe:INTegrate?
Query the most recently measured wavelength.
Query the 1024 raw CCD array values.
Query the temperature of the interferometer.
Perform a user recalibration.
Query the integration interval for the most recent
measurement.
Set the units of the measured wavelength to nm
in air.
Set the units of the measured wavelength to nm
in vacuum.
Set the units of the measured wavelength to cm-1.
Set the units of the measured wavelength to
gigahertz.
UNIT:WAVe?
UNIT:WAVe:NMV
UNIT:WAVe:ICM
UNIT:WAVe:GHZ
26
Command Definitions
The following pages detail the computer command set.
Configure Measurement Mode
Command
CONF:MODe:(FINe|ROUGh)
Query
CONF:MODe?
Description
state.
Set and recall the instrument’s measurement
Explanation
Configures the instrument to measure either fine
(six-digit) or rough (four-digit) wave-
length.
Example
ment)
The query form returns the current state as fine
or rough.
CONF:MOD:FIN (Sets six-digit measurement)
CONF:MOD:ROUG (Sets four-digit measureCONF:MOD?
—>ROUGH
27
Identification Query
Command
N/A
Query
IDN?
Description
Returns the instrument’s identification string.
Explanation
Returns the string, “New Focus,
7711,<s/n>,<ver>” where s/n is the unit’s
serial number and ver reflects the firmware
version number.
Example
IDN?
—> New Focus, 7711,00012,1.00a
28
Measure Wavelength
Command
MEAS:WAVe
Query
N/A
Description
Returns the result of the most recent wavelength
measurement.
Explanation
Returns a floating point number to the precision
determined by the measurement state (fine or
rough) in the current units (NMA, NMV, ICM,
GHz). If the result of a wavelength measurement
was an error, it returns the following codes:
-1 Low Input
-2 Saturated
-3 Check Alignment
Example
MEAS:WAV
—>632.992 NMV
29
Measure CCD Array Command
MEAS:CCD
Command
Query
N/A
Description
Returns the CCD array image.
Explanation
Returns 1024 integers between 0 and 4096
representing the intensity at each CCD array
pixel. The numbers are separated by commas.
Example
MEAS:CCD
—>1002,1118,1347...
30
Sense Interferometer Temperature Command
SENSe:TEMPerature
Command
Query
N/A
Description
Returns the interferometer’s temperature.
Explanation
Returns the interferometer temperature in degrees
C as a real number with two decimal points.
Example
SENS:TEMP
—>20.88 C
31
Recalibrate Instrument Command
SYSTem:CALibrate<lambda >
Command
32
Query
N/A
Description
Performs a user calibration.
Explanation
Adjusts the instrument calibration parameters to
read the wavelength specified by lambda. The
parameter lambda must be a six-digit, floating
point number between 400 and 1000 representing
the vacuum wavelength of the current input
source in nm.
Example
SYSTem:CALibrate 633.991
Integration Time Command
TIMe:INTegrate<period >
Command
Query
TIMe:INTegrate?
Description
Changes the CCD integration time.
Explanation
Sets the CCD integration time to period in
milliseconds. The valid range for period is 8 to
500 ms. Integration times between 1 and 7 ms
are interpreted as 8 ms, while values greater
than 500 ms are set to 500 ms. If a valid period
is received, AGC is turned off. If period is zero,
AGC control of integration time is reestablished.
The query form returns the most recent
integration time in integer milliseconds.
Example
TIM:INT 100
(Sets the integration time
to 100 ms)
TIM:INT?
—>100ms
TIM:INT 0
(Reestablishes AGC)
33
Measurement Units Command
UNIT:WAVe:(NMA|NMV|ICM|GHZ)
Command
Query
UNIT:WAVe?
Description
Sets the units that wavelength is measured in.
Explanation
Changes the measurement unit to:
NMA (nanometers in air),
NMV (nanometers in vacuum),
ICM (inverse centimeters),
GHz (gigahertz).
The query form returns the current unit choice.
Example
UNIT:WAV:GHZ
UNIT:WAV?
—>GHZ
34
(Changes the units to GHz)
V
Principles
of Operation
The New Focus Model 7711 Fizeau Wavelength Meter measures laser wavelength by numerically analyzing an interference pattern. As shown in Figure
1, page 9, the instrument consists of two main functional blocks: the interferometer and the electronics package. The interferometer generates a sinusoidal pattern on the detector (a silicon CCD array). The electronics package
consists of CPU, CCD array interface, and user interface boards. The CPU (a
486 PC) reads in a digitized version of the detector signal through the CCD
array interface and performs the calculations necessary to determine the
input’s wavelength. It also processes user commands from the front panel or
computer interface. Calibration of the instrument is done during manufacture at New Focus using multiple precision stabilized wavelengths throughout the visible spectrum. Small calibration adjustments can be performed by
the user using the remote interface.
Interferometer Design
Typical wavelength-measuring interferometers can be divided into three
classes. The first class is based on scanning Michelson interferometers, the
second is based on Fabry-Perot étalons, and the third employs dispersive elements such as gratings. All these designs contain many optical elements in
complex arrangements. When making high-precision measurements with
these instruments, problems of optical alignment and thermal drift are often
solved by using an on-board wavelength reference. This reference adds cost
and complexity to these systems. In contrast to these designs, the Model 7711
is based on a simplified Fizeau interferometer.* The only optic in this interferometer is a fused-silica étalon.
The wavelength-measuring interferometer consists of three elements: a
precision input aperture, a thin fused silica étalon, and a silicon CCD array.
This system is housed in a thermally isolated enclosure. As shown in the
* Actually, it’s closer to a Haidinger-fringe interferometer, see M. V. Klein, Optics, (Wiley &
Sons, New York, 1970), p. 193.
35
Figure 8
Fizeau Interferometer
S
S'
S"
Fizeau Interferometer
CCD Array
schematic in Figure 8, incident laser light is diffracted by the input aperture,
S, which also acts as a spatial filter. This light is partially reflected toward the
detector array as it hits the front face of the étalon. These light rays seem to
come from the virtual aperture S’. The back face of the étalon also partially
reflects the diffracted source beam toward the detector. These rays seem to
come from the virtual aperture S”. The position of S” relative to S’ depends
solely on the optical properties of the étalon.
The light reflecting from the front and back faces of the étalon interfere to
form a sinusoidal interference pattern on the CCD detector just as would light
coming from two coherent sources located at S’ and S”. So the period
of the interference pattern on the detector depends on the relative distance
between the two virtual apertures (S’ and S”), the distance between them
and the detector, and on the wavelength of the input light. We calibrate
each interferometer to effectively determine the distance between S’ and S”.
Once this is known, the interference pattern can be used to determine the
laser wavelength.
Wavelength Calculation Algorithm
Wavelength calculation consists of four basic steps. First, the digitized CCD
array signal is read in. It is then linearized and a fitting routine is used
to determine the spatial frequency and phase of the interference pattern.
The fringe frequency and phase are then used to calculate the rough and fine
estimates of the wavelength.
36
The CPU begins determining laser wavelength by reading in a digitized
version of the detector signal through the CCD array interface. It then
begins to analyze the data by calculating the positions of the maxima and
minima in the interference pattern. The spatial frequency of the sinusoid
is not constant over the entire CCD array, so calibration parameters are
used to linearize the positions of the maxima and minima. This linearized
signal is used to determine the spatial frequency and phase of the interference pattern. The spatial frequency of the interference pattern is used to
calculate a rough wavelength. This value is typically accurate to 0.1 nm
and is used mainly to prepare the way for accurate wavelength calculation
that follows. The rough wavelength is available when the instrument is in
Low Resolution mode.
While the fringe frequency is a function of wavelength, it cannot be determined with sufficient accuracy to determine wavelength to better than one
part in 104. To gain a more accurate wavelength measurement, the distance between the first CCD array pixel and the first fringe minimum,
Figure 9
The distance between one edge of the viewing window and the first
dark stripe will be very sensitive to small amounts of stretching.
Rubber band
Window
37
which is equivalent to the fringe phase, is used. To see how this works, imagine that the interference pattern is a series of equally spaced light and dark
stripes painted on a rubber band, as shown in Figure 9. One end of the rubber band is fixed in space. The other end is stretched to represent the changing input wavelength. The interference signal on the CCD array is like looking at a part of the middle of the rubber band.
As the rubber band is stretched, the spatial frequency of the light and dark
stripes will also change. This can, in principle, be used to measure the
amount of stretching. However, it will be very difficult to measure small
changes in rubber band length by this method. The phase of the pattern, that
is the distance between one edge of the viewing window and the first dark
stripe, will be very sensitive to stretching. This is because the cumulative
effect of a little extra distance between the light and dark stripes will add up
in all the periods between the fixed end and the viewing window to produce a
large change in this phase.
We use this principle to measure the fine wavelength. The rough wavelength
value allows the instrument to estimate the order number (essentially the
number of light or dark fringes between the fixed end of the rubber band and
the edge of the viewing window). The order number combined with the
fringe phase allows the CPU to calculate the input laser’s wavelength to a
precision of 0.001 nm. The accuracy is less than this (and wavelength dependent) due to the limitations of the algorithm and small changes due to temperature and pressure effects.
Wavelength measurement is made in air. The Model 7711 converts air to vacuum wavelength by using a standard formula for the index of refraction of
air. This formula compensates for the dispersion and temperature variations
in the index of refraction of air. Inaccuracies in this conversion are a few
parts per million. The remaining error is due to the resolution of the temperature sensor and the change in the index of refraction of air due to atmospheric pressure.
38
Linewidth Limit
One of the consequences of the wavelength calculation algorithm is that
there is a fundamental limit on the linewidth of the input signal. The power
spectrum of your source must be contained in a 30 GHz (1 cm-1) spectral
range, whether continuous (broadband) or discrete (multimode). Sources
with significant energy content outside this linewidth limit will degrade the
interference signal.
The wavelength measuring algorithm effectively averages spectral components of the input signal. The result of this averaging is that the centroid of
the input signal’s spectrum is calculated. If the spectral input signal’s spectrum is symmetrical, the algorithm computes the center wavelength.
Note: The input bandwidth limit also applies to narrowband sources
being scanned. A source will violate the input bandwidth limit if its
frequency varies by more than 30 GHz in one CCD integration time (between
8 and 500 ms).
Calibration
Accurate wavelength measurements are insured by precision calibration techniques and a robust mechanical design. Calibration of each instrument is
done using several stabilized wavelengths in a fixture shown in Figure 10.
Two of these sources are New Focus external cavity diode lasers stabilized to
atomic transitions. As shown in Figure 10, the laser’s output is split into three
paths. Most of the laser power is sent to the instrument to be calibrated. The
remaining power forms the signal and reference beams used for stabilization
of these wavelengths.
The signal beam passes through the (Rb or Cs) vapor cell, while the reference
beam goes straight to a Model 2007 Nirvana detector. The detector balances
and subtracts the Signal and Reference beams to cancel out laser intensity
noise. The error signal generated by frequency modulating the laser output
and subsequently demodulating the detector output allows us to stabilize the
laser output to 1 part in 106.
39
Figure 10
Calibration fixture
488–514-nm
Ar+
543-nm
HeNe
633-nm
Stabilized HeNe
To
Wavelength
Meter
Model 6224 Model 6226
780-nm ECDL 850-nm ECDL
HR
HR
HR
BS
BS
Rb
Cell
Sig.
HR
Flipper
HR
Flipper
HR
Flipper
HR
Flipper
BS
BS
Ref.
HR
Flipper
Cs
Cell
Sig.
Switch Yard
Ref.
Nirvana Det.
Model 2007
Nirvana Det.
Model 2007
Red and green HeNe lasers provide additional precision wavelengths. The
remaining wavelengths are derived from an all-lines Ar+ laser. The interference patterns generated by the reference wavelengths are stored in calibration
files. The calibration algorithm uses these files to linearize the CCD array signal. The algorithm also effectively measures the étalon thickness and its
index of refraction allow us to accurately determine laser wavelength. Due to
the robust mechanical design of the interferometer these parameters do not
change with time, so an internal wavelength reference is not necessary.
40
Wavelength measurement accuracy can be improved near a known wavelength by user recalibration. This computer command (see page 30) adjusts
the instrument calibration parameters to yield accurate measurement of a
user-supplied wavelength standard, such as a HeNe laser. Accuracy at wavelengths far from the user-supplied reference will likely be degraded. For optimum performance, we recommend factory recalibration every year.
The Instrument
The electronics package consists of CPU, CCD array interface, and user interface boards. The CPU processes user commands from the front panel or computer interfaces and also implements the automatic gain control algorithm.
This is accomplished by varying the CCD array integration time to achieve
maximum fringe contrast without saturating the detector. Because the integration time can vary over a wide range (8 to 500 ms) the readout rate of the
instrument depends on the input signal strength.
The software package consists of several key algorithms and the necessary I/O
functions for manual and remote interface. On power-up, the firmware performs a self-test to determine the operational status of many subsystems. It
then loads the calibration parameters from an EEPROM and enters the data
processing loop. The firmware’s data processing loop executes a round robin
operation system. The loop periodically cycles through six distinct chores, as
shown in Figure 11. The measurement chore is the heart of the wavelength
meter. It performs the wavelength calculation described above, as well as the
alignment mode functions. The front panel chore handles user commands
through the front-panel push buttons. The display chore is responsible for
putting information onto the alphanumeric display. The GPIB and serial
chores handle computer interface communications. The parser chore interprets remote commands.
41
Figure 11
Wavelength Meter operating system
Serial
GPIB
Front Panel
Kernel
Parser
42
Measurement
Display
VI
Hardware
Error Codes
This section describes the boot up sequence and various hardware error codes.
Power-On Self Test
When you turn on the power the digital electronics will reset themselves. The
CPU board will begin executing its self tests from the BIOS in ROM. Once validated, the CPU will load DOS and then the wavelength meter’s firmware
from the flash file system. The firmware’s power-on self test routines will test
each element of the supporting hardware and configure them for operation.
Error Codes
When the instrument detects a non-recoverable (fatal) error it halts and displays an error code on the front panel (ERROR CODE:0000). Please be prepared to give us the error code number when you call. The errors are encoded
as follows:
ERROR CODE 1 A front panel subsystem reported an error during
initialization.
ERROR CODE 2 The serial library reported an error during initialization.
ERROR CODE 3 The GPIB library reported an error during initialization.
ERROR CODE 4 The chore management module encountered an
internal error.
ERROR CODE 5 An illegal instrument configuration was detected.
ERROR CODE 6 The Solid State Disk subsystem reported an error.
ERROR CODE 7 The calibration EEPROM reported an error.
ERROR CODE 8 Unknown error condition.
43
VIl
AC Operating
Voltages
The Model 7711 Fizeau Wavelength Meter can operate at 100 to 240 VAC at
line frequencies of 47 to 63 Hz. The unit is configured at the factory for the
standard AC voltage in the purchaser’s country. Changing operating voltage
requires only a change in the fuses. The power entry module requires two
5x20 mm, slow-blow fuses, such as Littlefuse’s© Slo-Blo 239 series. One fuse is
for the hot line and the other is for the neutral line.
Replacement fuses should be as follows:
AC Voltage
Fuse Rating
Littlefuse© Part#
100 VAC
1.6 A
23901.6
120 VAC
1.6 A
23901.6
220 VAC
0.8 A
239.800
240 VAC
0.8 A
239.800
44
Figure 12
Power module
Fuse
Release
To replace a fuse, disconnect the power cord. Then open the fuse drawer,
shown in Figure 12, by pushing the small tab. The fuses are now accessible.
45
VIII
Warranty
Service and
Support
Your model 7711 Fizeau Wavelength Meter has been designed to provide
years of trouble-free operation. Any questions regarding the operation or
performance of the wavelength meter will be gladly answered by New
Focus engineers.
Warranty
New Focus, Inc. guarantees its wavelength meter to be free of defects for one
year from the date of shipment. This is in lieu of all other guarantees,
expressed or implied, and does not cover incidental or consequential loss.
Service
Virtually no maintenance is required except for ensuring that the unit is not
damaged, contaminated, or used in an unsafe manner.
Calibration
To guarantee 0.01 nm accuracy in wavelength readout, the system should be
recalibrated every year.
For service, repair or calibration, please call for a return authorization number before shipping the unit to New Focus. You can reach us at:
NEW FOCUS, Inc.
2630 Walsh Avenue
Santa Clara, CA 95051-0905 USA
Phone: (408) 980-8088
Fax: (408) 980-8883
Email: [email protected]
46
IX
Specifications
INPUT REQUIREMENTS
Wavelength Range
400 to 1000 nm
Measurement Accuracy
±0.01 nm*
Wavelength Resolution
0.001 nm
Display Update Rate
1 Hz to 10 Hz†
* Guaranteed after a 6-hour warm-up interval.
† Input signal dependent.
PERFORMANCE
Input Aperture
1 mm diameter
Spatial Mode Quality
Any zero order beam
Polarization
Vertical (30:1)
Maximum Input Linewidth
30 GHz (1 cm-1)‡
Maximum Peak Intensity
1 MW/cm2 (10 ns pulse)§
>15 ps (transform limited)
Pulse Duration
‡ May limit the maximum scanning rate, see page 24.
§ Applies only if the input is vertically polarized. If the input is horizontally polarized, the
damage threshold is 10 kW/cm2.
PHYSICAL
Dimensions
7 in. x 13 in. x 18 in.
Weight
19 lbs.
Input Beam Height
3.5 in.
E N V I R O N M E N TA L
Guaranteed Operating
Temp. Range
10° to 40°C
Absolute Max.Temp. Range
-10° to 60°C
Atmospheric Pressure
1000 to 1025 mbar
Relative Humidity
0 to 80%, non-condensing
ALIGNMENT LASER
Wavelength
633 nm
Power Output
< 1mW
47