1
Weather Wizard
User Manual
Updated on 04/30/12
© Olivier Le Diouris, 2012.
2
Table of Contents
Preamble..................................................................................................................................................5
Requirements...........................................................................................................................................9
Post installation.....................................................................................................................................10
Get started, in one click........................................................................................................................11
Main Concepts.......................................................................................................................................12
THE GRAPHICAL USER INTERFACE................................................................................................................12
COMPOSITE................................................................................................................................................13
Loading and Saving.........................................................................................................................13
PATTERN...................................................................................................................................................13
A note about backgrounds...............................................................................................................14
PRE-DEFINED FAXES....................................................................................................................................15
PRE-DEFINED GRIB REQUESTS...................................................................................................................16
Create your own pre-defined GRIB Request....................................................................................17
Choices & Options................................................................................................................................18
OPACITY, FUZZINESS...................................................................................................................................19
Opacity............................................................................................................................................19
Fuzziness.........................................................................................................................................19
PROJECTIONS.............................................................................................................................................19
OPTIONS...................................................................................................................................................20
For the Wind and GRIB Data..........................................................................................................20
3D Panel..........................................................................................................................................20
User-Exits........................................................................................................................................21
Dustlets User-Exit...................................................................................................................................21
Processing User-Exit..............................................................................................................................22
Preferences.............................................................................................................................................23
DEFAULT COMPOSITE .................................................................................................................................23
Auto save default Composite............................................................................................................23
Routing...................................................................................................................................................25
THE ROUTING CALCULATION.........................................................................................................................25
MORE THAN TWO WAY POINTS FOR THE ROUTING.............................................................................................26
COMMAND LINE INTERFACE .........................................................................................................................27
THE POLARS..............................................................................................................................................28
3
Updated on 04/30/12
Advanced topics.....................................................................................................................................31
AT SEA.....................................................................................................................................................31
GRIB FILES SIZE, SMOOTHING.....................................................................................................................32
THE TEMP DIRECTORY.................................................................................................................................33
DESIGN YOU OWN PATTERNS........................................................................................................................33
Using the Graphical User Interface.................................................................................................34
Interfaces...............................................................................................................................................35
WITH GOOGLE MAP & EARTH....................................................................................................................35
GPX.......................................................................................................................................................36
USER EXITS...............................................................................................................................................37
Archiving...............................................................................................................................................38
GENERATING IMAGES..................................................................................................................................38
The importance of naming conventions...........................................................................................38
Regular expressions.........................................................................................................................38
Hints.......................................................................................................................................................40
Change the mouse behavior....................................................................................................................40
Display faxes – now – 24h forecast – 48h forecast – 96h forecast – one by one.....................................40
Scroll through several Composites.........................................................................................................40
Export the result of a routing computation to another software.............................................................41
Show on the File System.........................................................................................................................41
Alternate tooltips on the chart................................................................................................................41
GRIB Slicing...........................................................................................................................................42
Use the “Fax Preview” control pane......................................................................................................43
Use the “GRIB at the mouse” feature.....................................................................................................44
Use the Geostrophic Wind feature..........................................................................................................44
Position Acquisition................................................................................................................................45
Use the comments in a Composite..........................................................................................................45
Customize the pre-defined places............................................................................................................45
Contour Detection..................................................................................................................................46
Use color range and wind direction for the GRIB wind..........................................................................47
Report a bug, request an enhancement...............................................................................................48
4
Preamble
This tool has been designed to superimpose weather and geographic data from different origins, like weather faxes, GRIB1
files, charts, etc.
On top of that, you can also plot different data, like the boat position, a track, a suggested routing, whatever involves a latitude
and a longitude.
It is designed to be used at sea as well as ashore. That means that the data to display can come from the Internet, from your
local file system, and/or from the serial port of your computer, to get data from your NMEA 2 station.
It is written in Java, and as such it runs wherever Java runs, on several platforms, Windows, Linux, Mac OS.
This tool is not a fax viewer, there are already many other tools for that.
This is not a GRIB viewer either, many other tools can do it.
Again, the main goal of this tool is to stack several documents.
A fax is received as an image on the computer, several formats are used (gif 3, jpeg4, tiff5, png6, etc).
Most of the faxes are pure black and white, some use gray scales, some other are colored.
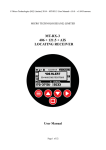
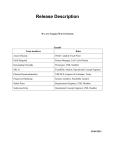
Many projections are used for weather faxes. Mercator, Lambert, Anaximandre (aka square), Polar Stereographic are some of
them.
MET Fax, Polar Stereographic projection, using gray scale
1 GRIB (GRIdded Binary)
2 National Marine Electronic Association
3 Graphics Interchange Format
4 Joint Photographic Expert Group
5 Tagged Image File Format
6 Portable Network Graphic
5
Updated on 04/30/12
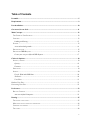
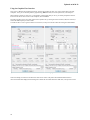
Black and white Lambert projection from the Australian Bureau of Meteorology
Black and white Mercator projection from the NOAA
6
Color fax using Anaximandre projection, US National Weather Service
Even if they are using the same projection and covering the same zone, faxes are not necessary using the same scale. Some
faxes also arrive rotated on their side.
So, in order to display several faxes on top of each other – like a surface fax and a 500mb fax – you need to:
•
Rotate then when necessary
•
Re-scale the faxes so they all fit the chart to display them on
•
Make them transparent so you can see all of them – not only the top one
And for clarity and readability
•
Possibly change their color (turn the black into something else)
7
Updated on 04/30/12
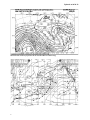
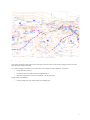
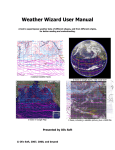
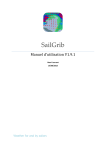
Chart of the Pacific, Mercator projection, Surface fax, 500mb fax, Tropical streamlines
On the image above, all the faxes arrive in black & white and opaque, the tropical streamline analysis one has been rotated by
90 degrees. A chart has been added, some places are displayed.
This is the kind of simple output the tool can produce.
It is also possible to add GRIB Data (like wind speed and direction, Pressure at the Mean Sea Level (PRMSL), 500mb isobar
altitude, waves height, air temperature, precipitation rate...
Among other features, you can also plot the boat position and heading, along with its track. We'll see how in other sections.
8
Requirements
This software is written in Java. To run it, you need to have Java installed on your system
Java is available for free at http://java.sun.com. You need at least a JRE7 for Java SE8.
An Internet connection will allow you to access some features, but it is not mandatory.
Those features include:
•
Automatic updates (of the product itself)
•
Notifications (from the development team)
•
Download faxes and GRIB files from the Internet
The amount of memory required is at least around 512Mb. The more you have, the more data you will be able to display
simultaneously.
7 Java Runtime Environment
8 Java Standard Edition
9
Updated on 04/30/12
Post installation
After installing the software, you need to make sure everything is OK. The most important is to make sure Java is available.
The java executable has to be available in the system path.
The software is started from a script, named olivsoft.bat on Windows, and olivsoft on other operating systems.
On Linux, a script named olivmenu is now available.
If you are experiencing problems at startup, you will probably need to edit and modify those scripts.
10
Get started, in one click
The easiest way to get started is probably to load and display the default composite.
To do so, make sure you have access to an Internet connection, and launch the software.
When prompted, accept to load the Default Composite.
This composite will display three faxes and one GRIB, for the Pacific, the projection is Mercator.
In a nutshell, this is what the software does.
Notice on the right side of the chart, check boxes are available. They can be used to display or hide the different components of
the Composite, faxes and GRIB. You can also hide or show the chart's contours, its grid, some predefined places, SailMail
stations, and Weather Stations.
The default Composite is just a regular composite (like the ones you find in the Patterns tree pane, on the left side of the chart).
What makes it the Default Composite is the fact that it is mentioned in a Preference.
11
Updated on 04/30/12
Main Concepts
This document will detail the aspects of the software deserving more explanation than what you can get intuitively. It will not
spend time describing all the elements of the graphical user interface (GUI). We assume everyone can guess that a button
labeled “Save” will be use to save something...
If you believe any uncovered aspect of the software would deserve a section in this document, please request it using the Report
a bug, request an enhancement section, on page 48.
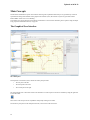
The Graphical User Interface
The 3 main panes
The Graphical User Interface (GUI) is made out of three principal zones:
•
The tree pane on the left
•
The chart panel in the center
•
The control pane on the right.
We will constantly refer to those three zones in the document. The control pane can be shown or hidden by using the right-most
icon of the toolbar .
Each section of the tree pane can be expanded or collapsed by clicking on its header.
The whole tree pane panel can be collapsed on the left, to leave more room for the chart.
12
Lateral panes collapsed, more room for the chart
Composite
This is probably the most important concept in this application. Whenever you display something, it is a composite. You can
save a composite, you can restore a composite. What you see is a Composite, what you save, what you restore, is a Composite.
A composite can contain zero or more faxes, zero or one GRIB file, comments, the boat position, a track. The composite
records the area on the chart you want to display, the projection to use, the scale of each fax, the color you want to display them
with, their possible rotation or expansion, their zoom level, and their coordinates on the chart.
If you want to display just one fax, or just one GRIB file, you have to do it within a composite.
There are several ways to edit a composite. Ctrl-O, menu File > Open File / Edit Composite..., right-click on the
chart, then Composite Options > Open File / Edit Composite...
Loading and Saving
A composite can be stored on your system as a “waz 9” file. The waz file is an archive, and if you are curious, you can visualize
its content with any archive tool (Winzip, 7z, etc).
The composite (waz file) can be sent to someone else to be reopened on another machine. It contains all it needs to be
displayed.
Once it has been stored, the composite can be re-opened later on.
Pattern
If you start from scratch (and we will see later on that this is not mandatory), if you want to display a fax, you will have to:
9 WA used to stand for Weather Assistant, and the Z means it is an archive (a zip).
13
Updated on 04/30/12
1.
For the chart you want to display the fax on, choose boundaries and projection
2.
Select the fax you want to display on the file system
3.
Rescale the fax so it fits the chart (or vice-versa)
4.
Set the offsets (X and Y) of the fax
5.
Make it transparent (except if it is a satellite picture, maybe)
6.
Change its color (if you want)
For each fax, redo the steps 2 to 6.
The pattern allows you to have all those settings stored, you you don't have to set them every time. You can think of it as the
template for a composite.
When you have setup a composite of the North Pacific Ocean for example, it is very likely that next time you want to create a
composite on the same area, the setting will be the same. That's what the pattern takes care of.
There are two main kinds of patterns, static patterns and dynamic patterns.
Static patterns will prompt you for the location of every resource (fax(es) and GRIB file).
Dynamic patterns will get the resources where they are, from the Internet, or from the file system (based on some criteria 10).
A note about backgrounds
Some already available patterns provide a background. Some people like it.
The backgrounds are managed like satellite pictures, but they do not require an Internet connection.
It could be an interesting feature, to produce the report of a trip, for example.
In that case, having a base color for the GRIB wind close to white could increase the readability of the Composite.
10 Typically when you are at sea, you might use your SSB to download faxes and GRIB files. There are some built-in utilities
that will help you find the most recent document of a given sort, and grab it from the pattern. We'll talk more about that.
14
Pre-defined faxes
Even if you just want to display one fax - and one fax only, with no GRIB – in your Composite, you have to do it within a
Composite. To facilitate this operation, you can use the pre-defined faxes.
Double-click on one pre-defined fax, and it will be displayed on the chart (if the area it represents matches the fax' one).
The definition of those pre-defined faxes is stored into a file named dyn.fax.xml. You can add your own pre-defined faxes
in this file.
<dyn-fax-collection>
<folder label="Pacific">
<folder label="By Type">
<folder label="Surface">
<dyn-fax title="North Pacific Surface"
rotation="0.0"
origin="http://www.opc.ncep.noaa.gov/P_sfc_full_ocean.gif"
top="64.9545583188057"
left="135.0028275212064"
bottom="14.346382057020733"
right="-115.2836946277097"
transparent="true"
change-color="true"
color="255;0;0"/>
<dyn-fax title="Central Pacific Streamline"
rotation="90.0"
origin="http://weather.noaa.gov/pub/fax/PWFA11.gif"
top="40.888477308459926"
left="130.08294062205468"
bottom="-44.69929101310054"
right="-110.24081055607917"
...
Notice in the snippet above that you need the precise coordinates of the faxes. To facilitate this step, you can run the program
with a system variable named “ display.fax.coordinates”, you can modify the launching script olivsoft[.bat]
like this:
java
-Ddisplay.fax.coordinates=true ... main.splash.Splasher
Whenever a fax is displayed in a composite, its coordinates will be spitted out in the console. Its boundaries will be enhanced
with a dotted line on the chart.
<dyn-fax title="North Pacific Surface"
rotation="0.0"
origin="http://www.opc.ncep.noaa.gov/P_sfc_full_ocean.gif"
top="64.9545583188057"
left="135.0028275212064"
bottom="14.346382057020733"
right="-115.2836946277097"
transparent="true"
15
Updated on 04/30/12
change-color="true"/>
<dyn-fax title="North Pacific 500mb"
rotation="0.0"
origin="http://www.opc.ncep.noaa.gov/shtml/P_06hr500bw.gif"
top="63.94678818178383"
left="135.86380772855796"
bottom="14.107932806549755"
right="-114.79170593779453"
transparent="true"
change-color="true"/>
<dyn-fax title="Central Pacific Streamline"
rotation="90.0"
origin="http://weather.noaa.gov/pub/fax/PWFA11.gif"
...
Dotted lines around the faxes
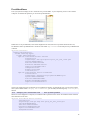
Pre-defined GRIB Requests
Similarly, an equivalent feature exists for the GRIB data.
In the Composite editor dialog (Ctrl + O), check the box labeled “GRIB Request”, and hit the “Browse...” button.
16
GRIB Request check box, and Browse button
The “Browse” button will lead you to those dialogs:
You can modify an existing request before executing it.
Create your own pre-defined GRIB Request
Once you have defined your own request in the GRIB Request Editor tab, you can use the “Save” button to store it, in order to
reuse it later. You will be prompted for the folder you want to store it in.
17
Updated on 04/30/12
Choices & Options
There is a lot of ways to customize and modify the way a composite looks. Pretty much all colors can be customized through
the Preferences
Whatever is set at the Preference level will become the default for further displays.
Those colors can also be modified for the current composite only, by right-clicking on the chart.
The “Chart Options” section allows you to do such changes, as well as the “Wind and GRIB Options” section.
18
Opacity, fuzziness
Opacity
The opacity of the different components – namely faxes and GRIBs – can be adjusted using the two sliders right next to the
chart, on top of the check boxes. There is one slider for the fax opacity, and the other is for the GRIB opacity. The default value
for opacity is set at the Preferences level, Display > Others > Fax transparency [0-1]. 0 is transparent, 1 is opaque.
Fuzziness
The fuzziness of the faxes can be adjusted. This is done with the three radio buttons available on the right of the chart, at the
bottom, under the check boxes. The available values are “Sharp”, “As is”, “Blur”. The default value is set at the Preferences
level. Display > Others > Default blur/sharp for faxes.
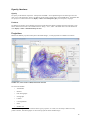
Projections
Based on the different projections used by faxes and satellite images 11, several projections are available in the software.
Satellite view, used to render a GRIB, with contour detection.
The current list includes:
•
Anaximandre
•
Mercator
•
Polar Stereographic
•
Stereographic
•
Lambert
•
Conic Equidistant
•
Globe
•
Satellite view
11 Yes, satellite images are often reworked to match a given projection. As a result, it is not always a satellite view they
produce. Mercator, Polar Stereographic are some of the projections used for satellite images.
19
Updated on 04/30/12
The Projections Control Panel is available at the right of the chart, and is labeled “Projection Controls”.
Options
For the Wind and GRIB Data
GRIB files can contain many different types of data.
Currently, the following data are available for rendering:
•
WIND – Surface wind, force and direction
•
PRMSL – Pressure at the Mean Sea Level
•
500HGT – Altitude of the 500mb isobar
•
WAVES – Waves height
•
TEMP – Air Temperature (at 10 meters of altitude)
•
RAIN – Precipitation rate
•
CURRENT – When available (RTOFS GRIB Requests), Gulf Stream speed and direction.
Those options are available in the Composite Editor dialog, and at the bottom left of the chart.
3D Panel
GRIB Data can also be visualized in 3D. The data you want to visualize this way have to be selected in the Composite Editor
dialog. The data displayed are the ones corresponding to the time displayed on the chart. This time can be visualized in the
GRIB Control pane, on the right of the chart.
20
3D rendering of PRMSL
User-Exits
User-exits provide alternate choices for the rendering of the documents part of a composite (mostly GRIB files, as of now).
Several examples are provided with the software.
User-exits can be managed by the menu Tools > Administration Tools > Manage User-Exits...
Dustlets User-Exit
Dustlets is a concept elaborated by Nick Thompson, http://nixweb.com.
They provide an animated rendition of the wind in the GRIB files.
21
Updated on 04/30/12
Processing User-Exit
Processing is a development framework based on Java, available for free at http://www.processing.org/. The
software comes with an example of a 3D animated GRIB rendering written with Processing.
22
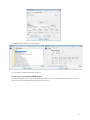
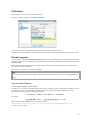
Preferences
Many preferences can drive the way you use the software.
They are all available through the menu Tools > Preferences.
When a line is selected, some additional help about its meaning is displayed in the bottom pane.
Most preferences are self-explanatory, and will no deserve any entry in this document. Some others deserve some more details.
Default Composite
There is a preference labeled “Load Composite at Startup” that is used to automatically load the composite mentioned in this
preference. A dialog box will be displayed to confirm this automatic load, during a time defined by the preference named “On
startup, wait for”.
If the pattern mentioned in this preference is a dynamic pattern, and if you have an Internet connection, you will download
faxes from the Internet, automatically.
If this preference is left blank, none of the above happens.
Nothing is preventing you from deleting a pattern mentioned in this preference. If you do so, an error might happen at
startup...
Auto save default Composite
Preference Default composite "Save as" pattern
The goal here is to “auto-save” the default composite, the one that is suggested at startup. This preference will define the way to
generate the name to use to save the default composite. If this field is not blank, then default composite will be saved
automatically, as stated by the pattern. Pattern must look like
"directory | prefix | file-pattern | extension"
for example
"/yyyy/MM-MMM | Auto_ | yyyy_MM_dd_HH_mm_ss_z | waz"
Patterns follow the Java SimpleDateFormat specification, found at
http://docs.oracle.com/javase/1.4.2/docs/api/java/text/SimpleDateFormat.html.
Let's give a concrete example:
23
Updated on 04/30/12
If the name pattern is defined as "/yyyy/MM-MMM | Auto_ | yyyy_MM_dd_HH_mm_ss_z | waz", and we are
starting the program on Saturday, April the 7th, 2012, at 19:01:20 in San Francisco; the default composite will be saved under
the Composite directory (preference “Composite files location”), in a file named
“2012/04-Apr/Auto_2012_04_08_02_01_20_GMT.waz”.
See about this the section named The importance of naming conventions, page 38.
The default composite can also be reloaded and saved on a regular basis, driven by the preference “Miscellaneous > Reload
default composite every (in minutes)”.
24
Routing
Routing is a vast topic, be prepared.
The routing calculation
Routing is this process that will find the best route for your boat, based on GRIB data and the polars of the boat.
From the starting point, based on the polars that will predict the boat speed for the different headings, using the GRIB data, the
routing process will calculate all the points reachable in a given amount of time. The curve joining all those points reached in
the same amount of time is called an isochron12. Then, from all the points of the isochron just calculated, the same process is
started again, defining this way another isochron. As all those points are in different locations, the wind for each of them (speed
and direction) is given by the GRIB. Like that, step by step, a series of several isochrons is calculated from the starting point to
the arrival. From the position where the last isochron goes through the arrival point, it is then easy to back-track to the starting
one, defining this way the best route from start to arrival.
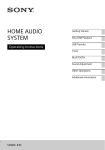
Completed routing, showing all the isochrons, and the best route
If done this way, the isochron calculation is an exponential process. If you calculate 10 reachable points from each starting
point, the first isochron has 10 points, the second one 100, the third one 1000, the fourth one 10000, etc. This can put any
computer on its knees if nothing else is done. A substantial part of the routing process consists in removing the unnecessary
points of an isochron before starting the calculation of the next one.
To start a routing, you need to have a GRIB file available in the Composite, and click on the chart to define an origin and a
destination (drop pushpins). Then go to Tools > Routing > Routing...
12 From the Greek iso, which means same, and chronos, which means time. An isochron contains all the points the boat can
reach within the same amount of time, starting from the origin point.
25
Updated on 04/30/12
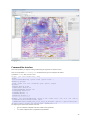
Once the routing computation is completed, its details are available in the control panel on the right, under the tab labeled
“Routing Details”. A routing slice panel is also available above the chart, with the different data represented as a smoothed
curves. Drag the mouse (with the left button clicked) on this panel to display details, at the mouse location.
After routing, details in the Routing Slice Panel
More than two way points for the routing
You can force the routing to use mandatory way points. Once you have defined origin and destination, you can right-click on
the chart, and “Insert Routing Way Point(s)”. On the chart, all routing way points are draggable. Move the mouse cursor on
the way point, and when it turns into an open hand, you can drag it from its original position, and drop it in its new one.
All those intermediate way points – other than origin – can be edited with a right-click on the chart, option “Edit routing way
points”. They can be reordered or deleted.
26
Dragging a way point
Command line interface
There is the possibility to compute a routing without using the Graphical User Interface (GUI).
There is a script named cli.routing.bat (on Windows) that gives an example of this feature.
A parameter “-help” tells you how to use it.
Prompt> java main.BlindRouting -help
Usage:
java main.BlindRouting -option value -option value ...
Mandatory options:
-fromL -fromG -toL -toG -startTime -grib -polars -output
Optional:
-verbose default false
-timeInterval default 24
-routingForkWidth default 140
-routingStep default 10
-limitTWS default -1
-limitTWA default -1
-speedCoeff default 1.0
----------------------Example: java main.BlindRouting -fromL 37.122 -fromG -122.5 -toL -9.75 -toG -139.10
-startTime "2012-03-10T12:00:00" -grib
".\GRIBFiles\2012\03\GRIB_2012_03_01_08_22_55_PST.grb" -polars ".\polars\cheoy-lee42.polar-coeff" -output "my.routing.gpx" -speedCoeff 0.75
The output type is based on the extension of the file:
•
.gpx for a GPX file (compatible with other softwares, like OpenCPN)
•
.csv, comma separated values, compatible with spreadsheets
27
Updated on 04/30/12
•
.txt for a plain text output
The -startTime parameter follows the specification of an XSD Duration, it is representing a UTC date and time.
You can notice that the parameters used from the command line are identical to the ones used from the GUI.
The polars
Polars are those curves predicting the speed of the boat (BSP or STW 13) for given true wind speed (TWS) and true wind angle
(TWA). Without the polars of your boat, there is no way to compute any routing, it is as simple as that.
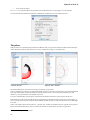
Polars for all TWS
Polars for TWS = 20 knots
The Weather Wizard now comes with a tool to help you elaborate you own polars.
They are called polars, because they are represented around a pole (the center of the true wind angles), each point being defined
by its angle and its radius. Another representation commonly used for curves is the Cartesian way, with abscissa (x) and
ordinates (y). This representation is also available in this tool.
For a given TWS and TWA, the boat speed is represented by the distance between the center (the pole) and the curve.
Polars elaboration is the process that will smooth the logged points (provided by the designer of the boat, by some logging) so
you can come up with a bunch of coefficients used to calculate the boat speed for any true wind speed and any true wind angle
at any time.
Notice on the snapshot above that the polars can – and often will – be made out of different sections, typically one for upwind,
and one for downwind. But anyway, there is no limit in the number of sections used for the polars of a given boat.
13 STW stands for Speed Through Water
28
But be warned, this is a long and uneasy process.
MaxSea has its own polar format, the Weather Wizard polar tool is aware of it, and can digest those data.
The polars used by the Weather Wizard are stored as XML files containing the coefficients of the polynomials that can be used
to represent the polars.
For a given TWS, the STW is given for any TWA by a polynomial function like
STW = fTWS(TWA)
where fTWS is a polynomial function of degree n, like
fTWS(TWA) = (Coeff0 * TWA0) + (Coeff1 * TWA1) + (Coeff2 * TWA2) + … + (Coeffn * TWAn)
also written
f TWS TWA =
n
∑ Coeff i
∗ TWAi
i=0
Those coefficients are obtained from raw data, by using the least squares method.
Those coefficients can themselves be smoothed across the true wind speed, with the same least square method, to obtain a
function that would compute the coefficients for any TWS.
This way, a boat speed can be obtained for any true wind speed and true wind angle.
Some boats can have very different behaviors depending on their point of sail. This is why we have here the possibility to have
several sections in the polars. Like one for upwind, and one for downwind, when the kite is up. You can have as many sections
as you want.
The smoothing is done section by section, the parameters of the smoothing are set at this level, they are accessible with a rightclick on the section in the tree in the left pane (Edit Node).
Notice the two degrees, one for the polar curves, and another one used to smooth the coefficients of the curves. The sections are
sorted in the tree by name. It is your responsibility to name them so they're displayed in a significant order.
Two kinds of files are managed by this tool.
The files that contain the data to smooth, namely the boat speed for given tuples (TWS, TWA), have an extension like
“polar-data”.
The files that contained the final coefficients, needed by the Weather Wizard, have an extension like “polar-coeff”.
Those two sorts of files are XML files, and can be read and edited in any editor. Each of them will be validated against an
XML Schema. This means that if you have modified those files with an editor, if they're not valid (i.e. screwed up during the
modification), you will have an error message when re-opening them using this tool.
29
Updated on 04/30/12
To produce the “polar-coeff” file, ultimately used in the Weather Wizard, you modify the points and parameters of the
smoothing until you are happy with the representation, and you use the menu File > Generate Polar Coeff...
You will be prompted to give this file a name, and then you will need to mention this file in the Weather Wizard preferences,
section “Polars, Routing, NMEA”, preference “Polar file location”.
This tool also understands the format used by MaxSea, the files with a “.pol” extension. The can be read (File >
Import from MaxSea...), or produced (File > Export to MaxSea...).
Those files are text files, looking like this:
TWA
45
50
55
…
30
2
2.0
2.0
2.0
3
3.0
3.0
3.0
4
3.0
4.0
4.0
5
4.0
5.0
5.0
6
5.0
6.0
6.0
7
6.0
7.0
7.0
8
6.0
7.0
8.0
9
9.0
10.0
11.0
10
12.0
13.0
13.0
11
13.0
14.0
14.0
…
…
…
…
Advanced topics
At sea
At sea, you will probably not have access to an Internet connection. Faxes and GRIB files will be downloaded through the SSB
and stored on the file system.
This is where you would be tempted to use static patterns, they would prompt you for each document, and you would be able to
refer to the document you've downloaded with the SSB so they'd be part of a Composite. This is certainly possible, but this is
time consuming. It is also error prone, you can easily pick up the wrong fax when prompted by the pattern.
The idea here is to mimic the behavior of a dynamic pattern, but instead of pulling the documents from the Internet, we will
grab them from the file system, based on some criteria, like “the most recent surface fax for the pacific found in the X:\XXX
directory”. We are going to see how to express such criteria.
When creating or editing a pattern, in the URL cell, you have the possibility to use an expression like this:
search:chartview.util.SearchUtil.findMostRecentFax(".*Tropical Surface Analysis.*",
"${fax.path}")
This example is searching the faxes downloaded with SailMail. When SailMail is downloading a fax, it stores it as an image
(usually a tif file), along with a header (a file with an .hdr extension) describing its content.
Here is an example of a SailMail header:
DecoderMode=Fax
SizeLimit=2200
Start=2010/02/24 15:18:15
StartMode=Auto
FileName=C:\Program files\Airmail\Faxfiles\1002241518.tif
Freq= 4346.00
Comment=NMC 15:18 Prelim Surface Analysis (Part 2 - NW Pac)
Skew=0.0000
Timer=Auto
LPM=120
IOC=576
Stop=2010/02/24 15:30:53
StopMode=Auto
The search string above is scanning the directories mentioned in the Preference named “Fax files location”, which is a path,
made out of one or more directories, looking for the most recent fax that has a header having the “Comment” property
matching the regular expression ".*Tropical Surface Analysis.*".
You can write your own search utilities (in Java). We will discuss this in another section.
One of the advantages of this software is that even fuzzy faxes – like the ones you sometimes receive at sea – can make sense.
31
Updated on 04/30/12
Faxes received at sea, with the SSB
GRIB files size, smoothing
Depending of the data you request and the area you want to cover, GRIB files can be pretty big, and the time they take to get
downloaded with the SSB can reach unacceptable amounts.
Reducing the GRIB cells size has quite an impact on the document size. Going from 1°x1° to 2°x2° will reduce the document
size by 4, and the time it takes to download it as well. The inconvenient of such a downsizing is that we lose the precision given
by fine cells.
In order to restore this precision without having to download too big files, the software provides some smoothing features.
Two smoothing axis exist, geographical smoothing, and time smoothing.
If you receive a GRIB defining 2°x2° cells, you can smooth them so it will render 1°x1°
cells.
As well, if the GRIB contains a frame every 24 hours, you can display a frame every 6
hours (again, this makes the document size 4 times smaller, in this case).
It is a mathematical smoothing. It is of course not as valid as the real GRIB, but at sea,
that is generally good enough. Actually, the GRIB generation itself involves some
smoothing algorithms.
In short, if you have a GRIB, with 2°x2° cells, with a frame every 24 hours, you can
render it as if it had 1°x1° cells, with a frame every 6 hours. The document in that case is
16 times smaller than what it would be. The download time is proportional to the
document size.
Think of it like this: a document that would take 16 minutes to download can be obtained
in about one minute. That could make some sense...
The smoothing is available from the GRIB Control Panel (on the right of the chart).
32
The temp directory
The “temp” directory under “all-scripts” is used by different components of the Weather Wizard to generate temporary
data. This directory is to be cleaned up from time to time.
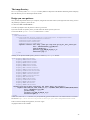
Design you own patterns
Once you have disposed the faxes in your composite, using the fax and charts control (on the right side of the chart), you have
the possibility to generate a pattern out of it.
Use the menu “File > Create Pattern...”.
You will be prompted to save the pattern in a directory you choose.
If you want to make it a dynamic pattern, you will need to edit the file you have just saved.
You need to add the dynamic-resource element at the fax level.
<pattern>
<fax-collection>
<fax hint="North Pacific Surface" color="255;0;51" transparent="true">
<faxScale>0.33790467906521593</faxScale>
<faxXoffset>183</faxXoffset>
<faxYoffset>94</faxYoffset>
<faxRotation>0.0</faxRotation>
<dynamic-resource url="http://www.opc.ncep.noaa.gov/P_sfc_full_ocean.gif"
dir="./WeatherFaxes/yyyy/MM/sfc"
prefix="NOAA_sfc_"
pattern="yyyy_MM_dd_HH_mm_ss_z"
extension="png"/>
</fax>
...
Similarly, for the dynamic GRIB requests, you have to add the dynamic-grib element:
<grib display-TWS-Data="true"
display-PRMSL-Data="true"
display-500HGT-Data="true"
display-WAVES-Data="false"
display-TEMP-Data="false"
display-PRATE-Data="false"
display-TWS-contour="false"
display-PRMSL-contour="false"
display-500HGT-contour="false"
display-WAVES-contour="false"
display-TEMP-contour="false"
display-PRATE-contour="false"
display-TWS-3D="false"
display-PRMSL-3D="false"
display-500HGT-3D="false"
display-WAVES-3D="false"
display-TEMP-3D="false"
display-PRATE-3D="false">
<dynamic-grib hint="Zone covered by the faxes above (All Pacific)"
request="GFS:65N,45S,130E,110W|2,2|0,6..24|PRMSL,WIND,HGT500,TEMP,WAVES,RAIN"
dir="./GRIBFiles/yyyy/MM"
prefix="GRIB_"
pattern="yyyy_MM_dd_HH_mm_ss_z"
extension="grb"/>
</grib>
In both cases, notice the “dir” attributes, they can dynamically generate sub-directories. The names follow the conventions
described at http://docs.oracle.com/javase/6/docs/api/java/text/SimpleDateFormat.html.
Take a look at the already existing patterns, to see how it goes.
An graphical editor is also available.
33
Updated on 04/30/12
Using the Graphical User Interface
There is now a Wizard to do this kind of operation. The first step remains the same, you create a pattern after an existing
Composite. Then, you can edit this pattern by right-clicking (Edit menu item) on it in the pattern tree, in the left pane.
When created, a pattern is a static one (i.e. non dynamic), meaning that when you use it, you will be prompted to enter the
location on the disc for each resource of the composite, faxes and GRIB..
The editor will allow you to turn a static pattern into a dynamic one, by entering the on-line location (URL) for each fax, as
well as the GRIB request you want to make.
You will also have to enter a generic name for each resource, so they can be saved on disc after having been downloaded.
Dynamic Patterns
Other fax properties
Notice the naming conventions for the directories and resource names. They follow the standards mentioned above.
Also notice that the data displayed in the dialogs above match the ones mentioned in the XML files, in the previous section.
34
Interfaces
With Google Map & Earth
Once a Composite is loaded, and when you can access an Internet connection, you can render it in Google Earth or Google
Map.
The fax rendering in Google is available when the faxes use a Mercator projection.
This interface with Google is available
•
Through the menu File > View Composite in Google
•
Through the popup menu on the chart (right-click) Composite Options > View Composite in Google
Three faxes in Google Earth, with cloud layer
In the Google case (Earth and Maps), some files have to be generated (KML or KMZ for Google Earth, JavaScript for Google
Maps). This generation happens in the temp directory, under the all-scripts directory, part of the directory where you installed
the software. This directory has to be cleaned up from time to time.
35
Updated on 04/30/12
GPX
GPX14 is an XML15 Standard, used by many navigation softwares.
The Weather Wizard can both consume and produce GPX data.
You can display a GPX route as part of a Composite.
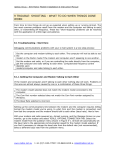
You can generate a GPX route after a routing computation, to display it – for example – in your navigation software 16 (if it
supports GPX, of course).
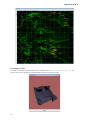
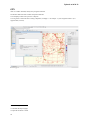
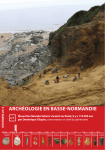
Rendering of a GPX Track, en route to San Francisco
14 GPs eXchange format.
15 eXtensible Markup Language
16 OpenCPN works like a charm.
36
San Francisco – Hawai'i GPX Routing displayed in OpenCPN
User exits
You can write your own user-exits, in Java.
That is definitely the job of a Java developer.
A user-exit has to implement a Java interface named chartview.util.UserExitInterface.
You can also request a user exit, using the “Issues” section of the project home web site, see the section “Report a bug, request
an enhancement”, page 48.
37
Updated on 04/30/12
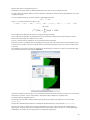
Archiving
There are several things that can be done on Composites, for reporting or analysis purposes.
Generating images
Going to the menu File > Generate Image will allow you to generate an image file from the rendering of a Composite. You
will be prompted to provide a location for the image file to generate.
You can also generate images from the Composites stored under some given directory, by going to the menu Tools >
Administration Tools > Generate Images from Composites.
This utility will scan a directory you provide, will find all the composites having a name matching a regular expression you
provide; you can choose to display all or parts of the matching composites, and images will be generated in a directory, located
where you want. Optionally, you can generate a pdf file, holding the generated images.
The last regular expression you used will be stored, to be re-displayed next time you come to that screen..., just in case.
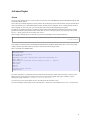
The importance of naming conventions
Sticking to a naming convention will allow further analysis of your weather data. The regular expression mentioned above
applies to the Composite file names. Having a strict naming convention describing the date and the content of the Composite
will allow you to search and find them appropriately. The next section is enhancing this aspect.
Regular expressions
OK, it is a bit technical, it sounds a bit like some computer geek stuff, agreed. But that is an extremely powerful tool. The
syntax of a regular expression can look very scary.
/^[0-9a-zA-Z]([-.\w]*[0-9a-zA-Z_+]*@(0-9a-zA-Z][-\w]*[0-9a-zA-Z]\.)+[a-zA-Z]{2,9}$/
The one above can be used to validate the syntax of an email address...
It's based on pattern matching. You apply a regular expression on a text, and you will know if it matches, or if it does not
match.
Many software are available – and most of them for free – to help you with regular expressions 17.
A dot “.” means “any character”. A star “*” means “any number of times”.
17 We would recommend Expresso, available for free at http://www.ultrapico.com
38
An expression like ".*Tropical Surface Analysis.*" would match any character string containing “Tropical Surface Analysis”,
whatever is before or after.
When you want to generate images after some composites generated at some given dates, an expression like
.*(2012.*|2011-(?<Month>09|1[0-2])-(?<Day>0[1-9]|[1-2][0-9]|3[0-1]))_(?<Hour>00|06|
12|18).*AllPacific.waz
will find all the composites having a name containing “2012”, or containing “2011” followed by a dash “-”, then by 09, 10, 11
or 12, another dash “-”, then a sequence of two digits, from 01 to 31, an underscore “_”, a two digit sequence like 00, 06, 12 or
18, any number of any character, and finally finishing with “AllPacific.waz”.
That brings us back to the importance of naming conventions for your composites. The expression above will eventually find
all the composites of the All Pacific, generated in 2012, or between September 1 st 2011 and December 31st 2011. The
expression is a bit cryptic, but it works well!
39
Updated on 04/30/12
Hints
Change the mouse behavior.
There are four predefined behaviors for the mouse on the chart, set by the radio buttons available in the toolbar on top of the
chart.
The four behaviors are:
•
Drag & Drop Zoom. You click on the chart to define the top left corner of a rectangle, and drag to the bottom right of
it. When you release the mouse, it zooms on the just defined rectangle (the confirmation of the zoom is driven by a
preference, you can turn it off).
•
Grab-Scroll. Drag the chart itself to move it.
•
Draw Line. Click to define a start, drag to the arrival. This will draw rhumbline and great circle, a bubble giving the
different data. A dialog will summarize the operation.
•
Just Pointer (and nothing specific)
The default behavior is Drag & Drop Zoom.
When the Drag & Drop Zoom radio button is selected, you can turn the mouse behavior to Grab-Scroll by pressing the Shift
key when dragging the mouse. Pressing the Ctrl key will turn the Draw Line behavior on. Releasing Shift or Ctrl keys will
return to the Drag & Drop Zoom.
Display faxes – now – 24h forecast – 48h forecast – 96h forecast – one by one
Some Composites are containing faxes that are not to be displayed on top of each
others, because they are not representing the same slot of time.
In this case, it is possible to turn the check boxes displayed on the right side of the
chart into radio-buttons. A right-click on the panel will do the job.
This option will be stored in the Composite.
Scroll through several Composites
Along the same lines as the section before, it could be interesting to see the evolution of a situation, by scrolling through
several Composites, elaborated from the same pattern on a regular base. For example, you have saved a Composite based on
the same pattern, every 6 hours.
To visualize how the situation is evolving, open those composites, by double-clicking on them in the Composite tree panel on
the left of the chart.
You can re-order those Composites if necessary, with a right-click on their corresponding tab.
40
Once the Composites are chronologically ordered, you can “animate” the sequence with the button located next to the
Expand/Collapse button, at the right of the Composite toolbar.
This will display the tabs one by one, every 2 seconds. Clicking the same button again will stop the process.
Export the result of a routing computation to another software
The result of a routing computation can be re-used. Beside what is displayed on the chart, you can generate the data in three
formats:
•
Text
•
CSV (Comma Separated Values), compatible with spreadsheets.
•
GPX
After the routing is completed, the result is copied in the clip-board, using the format you specified in the preferences, Tools >
Preferences > Polars, Routing, NMEA > Routing Output Type. You also have the possibility to ask the user every time a
routing calculation is completed. In this last case, the result of the computation can be stored into a file on the file system.
As it is also in the clip-board, a Ctrl+V in any editor will also do the job.
Show on the File System
All the tree panes on the left reflect the structure of the directories and files on the File System. There is in the software nothing
to rename or delete those files, this is to be done at the File System level. For that reason, there is an option labeled “Show on
the File System”, available through a right-click on in those tree pane. This will lead you to the location of the files or
directories you right-clicked on, so you can manipulate those elements to your convenience.
Along the same lines, there is also a “Refresh Tree” option, available at the root of each tree, that will refresh the data, after one
of the manipulations mentioned above.
Alternate tooltips on the chart
A right-click on the chart gives you access to Chart Options.
The default is to have the usual bubble (option Tooltip on Chart).
You can remove the tooltip (option No Tooltip)
41
Updated on 04/30/12
You can also have a Tooltip Window.
Tooltip Window
You can also enlarge or shrink it, as you wish.
It displays the GRIB data at the mouse location
When you close the tooltip window using its “Close” button, the option is set to “No tooltip”. You have to use the
menu to set it back to any other option you want.
GRIB Slicing
With a right-click on the chart, you can use the menu “Wind and GRIB Options > Enable GRIB Slicing”.
This will switch the mouse behavior to “Draw Line”. And use the mouse to draw a line on the chart, this will display the
values of the GRIB along this line.
If you hold the left button clicked on the GRIB Slice panel, the values will be displayed on the graphic, and the corresponding
position will be plotted on the chart.
42
Use the “Fax Preview” control pane
This feature is here to preview a fax, before loading it into a Composite. You have a “Fax Preview” section in the Control
Pane, at the right of the chart. To view the faxes, expand it, and select a fax already stored on your computer, available in the
“Faxes” tree pane on the left of the chart.
43
Updated on 04/30/12
This will allow you to see if the fax you want to display is the right one. A right-click on the fax preview will give you access
to some zoom options.
Use the “GRIB at the mouse” feature
When a GRIB is available in the composite, there is a pane in the Control Panel that displays the GRIB conditions at the
mouse. It changes when the mouse moves.
Use the Geostrophic Wind feature
Some faxes come with a Geostrophic Scale.
It is here to estimate – at a given latitude – the wind speed, based on the distance
between 2 given isobars.
This feature is available in the Weather Wizard, for the Mercator projections. To
use it, display a surface fax, and drop pushpins (just click on the chart) on two
isobars of the fax.
Then use the menu Tools > Geostrophic Wind.
44
Position Acquisition
The position of the boat can be plotted on a Composite. It can be done manually, or automatically, from GPS data. The port to
read to get the GPS (NMEA) data is to be set at the preferences level, Tools > Preferences > Polars, Routing, NMEA >
NMEA Serial Port.
Use the comments in a Composite
There is the possibility to store some text with a Composite. The amount of text is not limited, it could be useful to store data
like the text bulletins received at the same time as the documents part of the Composite.
The comment text can be accessed through the Composite Editor dialog, tab “Comments & GPX”.
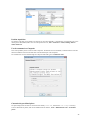
Customize the pre-defined places
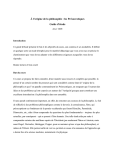
The places displayed on the chart are stored into a file named places.xml, located in the “all-scripts” directory.
It can be edited with any editor, and it can be modified from the software, Tools > Administration Tools > Pre-defined
places...
45
Updated on 04/30/12
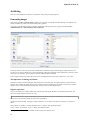
Pre-defined places user interface
You can add lines, remove lines, etc. You also have the possibility to show or hide a given place.
A label can be displayed on several lines. To insert a line break, just add “\n” in the label. Like in “Cook Islands\nRarotonga”.
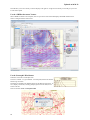
Contour Detection
In a GRIB, you have the possibility to detect the contours; this will be specially useful for PRMSL and HGT500. All the data in
the GRIB can have their contours detected, but this would not be as interesting as those two.
You can set the interval and limits of the contours to detect, using Tools > Preferences > Miscellaneous > Isobars list.
46
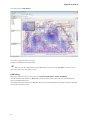
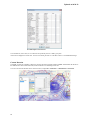
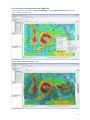
Use color range and wind direction for the GRIB wind
A right-click on the chart, and the menu “Wind and GRIB Options > Use Color Range for Wind Speed” will display
another rendering of the GRIB wind.
If you want to add the wind direction to this rendition, you have to set the preference “Display > Others > Display wind
direction with color range wind speed” to “true”.
47
Updated on 04/30/12
Report a bug, request an enhancement
In order to improve the software, use http://code.google.com/p/weatherwizard/, in the “Issues” section.
48
49