1
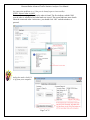
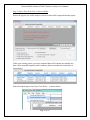
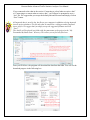
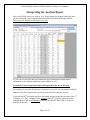
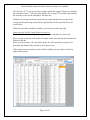
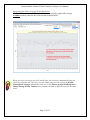
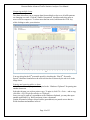
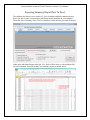
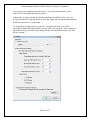
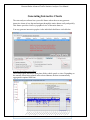
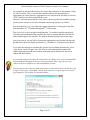
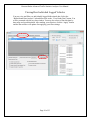
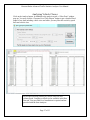
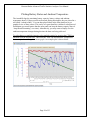
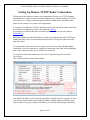
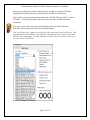
Houston Radar Advanced Traffic Statistics Analyzer User Manual
Comparing multiple charts
The charts also allow you to compare data from multiple weeks to see if traffic patterns
are changing over time. Click the “Enable Comparison” checkbox and select more or
more weeks to compare to. To select more than one week, hold down the CTRL key
while clicking to make your selection.
You may also plot the 85th percentile speeds by checking the “Plot 85th Percentile
Speeds” checkbox found next to the week selector box as shown by the red circle in the
image above.
Printing and exporting tables or charts
All tables or charts may be printed or copied to the “Windows Clipboard” for pasting into
another document.
Select the tab page you wish to print or copy. To print it, click File->Print… and to copy
click Edit->Copy Graph/Spreadsheet to Clipboard…
Once you copy a graph or a spreadsheet to the Windows clipboard, you may then open
another application (e.g. Word) and paste it into a document.
Graphs are pasted as images whereas tables (spreadsheets) are pasted as text data in a
Word document and numbers in Excel.
Page 18 of 35