1
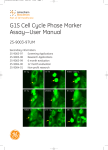
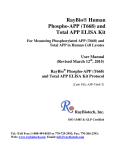
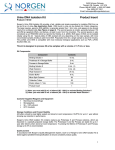
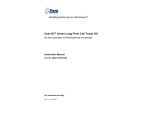
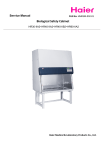
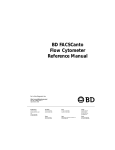
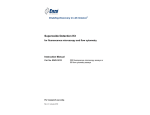
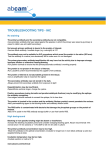
GFP-Certified™ Nuclear-ID™ Red Cell Cycle Analysis Kit for Flow Cytometry Instruction Manual Cat. No. 51008-100 For research use only. Rev. 1.0.1 April 2009 100 assays Notice to Purchaser The GFP-Certified™ Nuclear-ID Red Cell Cycle Analysis Kit is a member of the CELLestial product line, reagents and assay kits comprising fluorescent molecular probes that have been extensively benchmarked for live cell analysis applications. CELLestial reagents and kits are optimal for use in demanding imaging applications, such as confocal microscopy, flow cytometry and HCS, where consistency and reproducibility are required. This product is manufactured and sold by ENZO LIFE SCIENCES, INC. for research use only by the end-user in the research market and is not intended for diagnostic or therapeutic use. Purchase does not include any right or license to use, develop or otherwise exploit this product commercially. Any commercial use, development or exploitation of this product or development using this product without the express prior written authorization of ENZO LIFE SCIENCES, INC. is strictly prohibited. Limited Warranty These products are offered under a limited warranty. The products are guaranteed to meet appropriate specifications described in the package insert at the time of shipment. Enzo Life Sciences’ sole obligation is to replace the product to the extent of the purchase price. All claims must be made to Enzo Life Sciences, Inc. within five (5) days of receipt of order. Trademarks and Patents Enzo, GFP-Certified and Nuclear-ID are trademarks of Enzo Life Sciences, Inc. Several of Enzo’s products and product applications are covered by US and foreign patents and patents pending. Contents I. Introduction ............................................................... 1 II. Reagents Provided and Storage.............................. 1 III. Additional Materials Required ................................. 2 IV. Safety Warnings and Precautions........................... 2 V. Methods and Procedures ......................................... 3 A. REAGENT PREPARATION ........................................... 3 B. CELL PREPARATIONS ................................................. 4 C. STAINING LIVE CELLS ................................................. 4 D. STAINING ETHANOL FIXED CELLS............................. 5 E. STAINING PERMEABILIZED CELLS ............................ 6 F. COMBINING GFP ANALYSIS OR IHC WITH DNA STAINING.................................................... 6 VI. Appendices ............................................................... 7 A. FLUORESCENCE CHANNEL SELECTION FOR DATA COLLECTION ............................................ 7 B. RESULTS ..................................................................... 7 VII. References ................................................................ 9 VIII. Troubleshooting Guide ........................................... 9 I. Introduction Enzo Life Sciences’ GFP-Certified™ Nuclear-ID™ Red Cell Cycle Analysis Kit provides a convenient approach for studying the induction and inhibition of cell cycle progression by flow cytometry. The kit is suitable for (1) determining the percentage of cells in a given sample that are in G0/G1, S and G2/M phases, as well as to quantify cells in the sub-G1 phase, and (2) DNA studies in live, permeabilized and fixed cells for normal cell lines and cell lines exhibiting multiple ploidy levels. The progression of the cell cycle is controlled by a complex interplay among various cell cycle regulators that either stimulate or inhibit the cell from entering each stage of the cell cycle. These regulators activate transcription factors, which bind to DNA and turn on or off the production of proteins that result in cell division. Dysfunction of any step in this regulatory cascade causes abnormal cell proliferation which underlies many human pathological conditions, such as cancer. A crucial step to understanding these conditions is the ability to understand the mechanisms underlying alterations in cell cycle progression. A control cell cycle perturbation agent, Nocodazole, is provided for monitoring changes in cell cycle dynamics. Potential applications for live-cell studies are in the determination of cellular DNA content and cell cycle distribution for the detection of variations in growth patterns, for monitoring apoptosis, and for evaluating tumor cell behavior and suppressor gene mechanisms. II. Reagents Provided and Storage All reagents are shipped on dry ice. Upon receipt, the kit should be stored at ≤-20°C, protected from light. When stored properly, these reagents are stable for at least twelve months. Avoid repeated freezing and thawing. Reagents provided in the kit are sufficient for approximately 100 assays using either live, permeabilized or fixed cells. Reagent Quantity Nuclear-ID™ Red Cell Cycle Detection Reagent 200 µL Nocodazole Control 10 µL 10X Assay Buffer 15 mL 1 III. Additional Materials Required Flow cytometer Tubes appropriate for holding cells for the flow cytometer Calibrated, adjustable precision pipetters, preferably with disposable plastic tips Adjustable speed centrifuge with swinging buckets (for suspension cultures) Deionized water Anhydrous DMSO (optional) Total growth medium suitable for cell type 70% Ethanol 10% Triton X-100 in water IV. Safety Warnings and Precautions This product is for research use only and is not intended for diagnostic purposes. The Nuclear-ID™ Red Cell Cycle Detection Reagent contains DMSO which is readily absorbed through the skin. DMSO is harmful if ingested or absorbed through the skin and may cause irritation to the eyes. Observe appropriate precautions when handling these reagents. Reagents should be treated as possible mutagens and should be handled with care and disposed of properly. Observe good laboratory practices. Gloves, lab coat, and protective eyewear should always be worn. Never pipet by mouth. Do not eat, drink or smoke in the laboratory areas. All blood components and biological materials should be treated as potentially hazardous and handled as such. They should be disposed of in accordance with established safety procedures. To avoid photobleaching, perform all manipulations in low light environments or protected from light by other means. 2 V. Methods and Procedures The procedures described in this manual assume that the user is familiar with the basic principles and practices of flow cytometry and is able to run samples according to the operator’s manual pertaining to the instrument being used. NOTE: Allow all reagents to thaw at room temperature before starting with the procedures. Upon thawing, gently hand-mix or vortex the reagents prior to use to ensure a homogenous solution. Briefly centrifuge the vials at the time of first use, as well as for all subsequent uses, to gather the contents at the bottom of the tube. A. REAGENT PREPARATION 1. Positive Control Nocodazole, a cell cycle perturbation agent, is an anti-neoplastic agent which exerts its effect by depolymerizing microtubules, causing arrest in the G2/M phase of the cell cycle. It may be used as a positive control for cell cycle distribution changes . The Nocodazole provided in the kit is supplied at a stock concentration of 1 mg/mL in DMSO. It is recommended that treatment with the agent be performed using 0.1 - 0.2 µg/mL (1-2 µL stock per 10 mL medium) in order to observe changes in nuclear morphology and that the final DMSO concentration in the assay not to exceed 0.2%. To prepare a 0.1 µg/mL solution, add 1 µL stock Nocodazole Control per 10 mL medium. Use 2 µL stock Nocodazole Control per 10 mL medium for a 0.2 µg/ml solution. If small volumes are required, an intermediate dilution (e.g., 10 µg/mL) can be made. 2. 1X Assay Buffer NOTE: The 1X Wash Buffer will be used for staining of fixed cells. See section D, page 5. Allow the 10X Assay Buffer to warm to room temperature. Make sure that the reagent is free of any crystallization before dilution. Prepare enough 1X Assay Buffer for the number of samples to be assayed by diluting each milliliter (mL) of the 10X Assay Buffer with 9 mL of deionized water. 3. DNA Staining Solutions The concentration of Nuclear-ID™ Red dye for optimal staining will vary depending upon the application. Suggestions are provided to use as guidelines, though some modifications may be required depending upon the particular cell type employed and other factors such as the permeability of the dye to the cells or 3 tissues. To reduce potential artifacts from overloading the cells, the concentration of the dye should be kept as low as possible. Refer to sections C, D and E for details on the preparation of the staining solution for specific applications. Prepare sufficient amount of the staining solution for the number of samples to be assayed.. B. CELL PREPARATIONS Cells should be maintained via standard tissue culture practices. Positive control cells should be pretreated with Nocodazole Control for 18-24 hours. Response to the perturbation agent, Nocodazole, is time and concentration dependent and may also vary significantly depending upon cell type and cell line. Negative control cells should be treated with a vehicle (DMSO, media or other solvent used to reconstitute or dilute an inducer or inhibitor) for an equal length of time under similar conditions. C. STAINING LIVE CELLS 1. Grow cells overnight to log phase in a humidified incubator at 37°C, 5% CO2. 2. Treat cells with or without experimental compounds. 3. Prepare positive control cells by incubating with pre-diluted Nocodazole (0.1-0.2 µg/mL, see section A-1, page 3) for 18-24 hours under normal tissue culture conditions. 4. At the end of treatment, trypsinize (adherent cells), or collect cells (suspension cells). Adjust cell count to 1 x 10⁵ to 5 x 10⁵ cells/mL. 5. Centrifuge at 400 x g for 5 min. to pellet the cells. Re-suspend in media or other buffer of choice and centrifuge as before. 6. Immediately prior to staining the live cell samples, prepare fresh DNA Staining Solution as follows: NOTE: A concentration of 20-40 µM Nuclear-ID™ Red dye is recommended for live cell DNA analysis. The procedure described below is for preparation of 40 µM dye solution. For each sample to be stained, dilute 2 µL Nuclear-ID™ Red Cell Cycle Detection Reagent to a final volume of 500 µL with media or buffer of choice. 7. Resuspend each live cell sample in 0.5 mL of freshly prepared DNA Staining Solution (from step 6). Incubate for 30 minutes at 37°C in the dark. It is important to achieve a monodisperse cell suspension at this step by gently pipetting up and down repeatedly. 4 8. Analyze the samples in the PerCP-Cy5.5, PI or FL3 channel of a flow cytometer with a 488 nm excitation laser. For a 633 nm excitation, use appropriate collection filters >700 nm, FL4 or FL5, APC-Cy7 channel. D. STAINING ETHANOL FIXED CELLS 1. Grow cells overnight to log phase in a humidified incubator at 37°C, 5% CO2. 2. Treat cells with or without experimental compounds. 3. Prepare positive control cells by incubating with pre-diluted Nocodazole (0.1-0.2 µg/mL, see section A-1, page 3) for 18-24 hours under normal tissue culture conditions. 4. At the end of treatment, trypsinize (adherent cells), or collect cells (suspension cells). Centrifuge at 400 x g for 5 min. to pellet the cells, washing twice with 1X Assay Buffer. 5. Resuspend the pellet in 100-200 µL 1X Assay Buffer. This helps to prevent clumping. 6. Slowly add ice cold 70% Ethanol (-20°C) drop-wise to each sample (106 cells/mL) while vortexing. At this point, cells may be stored at -20°C for several months before staining. Cells must be in fixative for at least one hour prior to staining. 7. When ready to stain the cells with Nuclear-ID™ Red Cell Cycle Detection Reagent, centrifuge the fixed cells at 400 x g for 5 min. Decant fixative thoroughly. 8. Wash cells by adding 5 mL of 1X Assay Buffer to each sample and gently resuspend the pellet. Centrifuge the cells for 5 min. at 500 x g and carefully remove the supernatant. 9. Immediately prior to staining the ethanol-fixed cell samples, prepare fresh DNA Staining Solution as follows: NOTE: A concentration of 5-20 µM Nuclear-ID™ Red dye is recommended for ethanol-fixed cells. The procedure described below is for preparation of 20 µM dye solution. For each sample to be stained, dilute 1 µL Nuclear-ID™ Red Cell Cycle Detection Reagent to a final volume of 500 µL with media or buffer of choice. 10. Re-suspend each fixed cell sample in 0.5 mL freshly prepared DNA Staining Solution (from step 9) to a final concentration of 1 x 10⁵ to 5 x10⁵ cells/mL. Incubate for 30 min. at 37°C in the dark. 5 11. Analyze the samples in the PerCP-Cy5.5 or FL3 channel of a flow cytometer with a 488 nm excitation laser. For 633 nm excitation, use appropriate collection filters >700nm, FL4 or FL5, APC-Cy7 channel. E. STAINING PERMEABILIZED CELLS 1. Grow cells overnight to log phase in a humidified incubator at 37°C, 5% CO2. 2. Treat cells with or without experimental compounds. 3. Prepare positive control cells by incubating with pre-diluted Nocodazole (0.1-0.2 µg/mL, see section A-1, page 3) for 18-24 hours under normal tissue culture conditions. 4. At the end of treatment, trypsinize (adherent cells), or collect cells (suspension cells). Adjust cell count to 1 x 10⁵ to 5 x 10⁵ cells/mL. 5. Centrifuge at 400 x g for 5 min. to pellet the cells. Re-suspend in media or other buffer of choice and centrifuge as before. 6. Immediately prior to staining the cell samples, prepare fresh DNA Staining/Permeabilizing Solution as follows: NOTE: A concentration of 5-20 µM Nuclear-ID™ Red dye is recommended for permeabilized cells. The procedure described below is for preparation of 20 µM dye solution. For each sample to be stained, dilute 1 µL Nuclear-ID™ Red Cell Cycle Detection Reagent and 10 µL of 10% Triton X-100 to a final volume of 500 µL with media or buffer of choice. 7. Re-suspend each fixed cell sample in 0.5 mL freshly prepared DNA Staining/Permeabilizing Solution (from step 6) to a final concentration of 1 x 10⁵ to 5 x10⁵ cells/mL. Incubate for 30 min. at 37°C in the dark. 8. Analyze the samples in the PerCP-Cy5.5 or FL3 channel of a flow cytometer with a 488 nm excitation laser. For 633 nm excitation, use appropriate collection filters >700nm, FL4 or FL5, APC-Cy7 channel. F. COMBINING GFP ANALYSIS OR IHC WITH DNA STAINING The live-cell Nuclear-ID™ Red dye allows the simultaneous analysis of a cell population for other parameters as well, such as fluorescent protein expression levels (BFP, CFP, GFP and/or YFP) or immunohistochemistry (IHC) with coumarin- or fluorescein-labeled cell surface antibodies. Analysis of intracellular targets by IHC requires permeabilization and fixation. 6 VI. APPENDICES A. Fluorescence Channel Selection for Data Collection Fluorescence channels suitable for Propidium iodide, PerCPCy5.5 (>650nm) or FL3 channel are recommended for imaging Nuclear-ID™ Red Detection Reagent with 488 nm excitation or for 633nm excitation use appropriate collection filters >700nm, APC-Cy7, FL4 or FL5 channels. B. Results Propidium iodide staining of DNA in permeabilized cells and subsequent detection by flow cytometry has been widely employed to determine the percentage of cells in each phase of the cell cycle.1,2 While prodium iodide is impermeable to plasma membrane and nuclear membranes, Nuclear-ID™ Red dye freely enters cells, allowing cell cycle analysis without the need for laborious permeabilization and fixation steps. Propidium iodide additionally has the disadvantage that it stains all double stranded nucleic acids, so cells must be incubated with RNase to remove any double stranded RNA. Since Nuclear-ID™ Red dye intercalates exclusively into the base pairs of double-stranded DNA, no RNase treatment is required and the fluorescence intensity of a stained cell is directly proportional to the DNA content in the cell. Cells in the G0/G1 phase are either quiescent or preparing to enter the S phase (DNA synthesis) and contain one set of chromosomes. An exponentially growing population of cells displays a DNA content distribution containing two major peaks, a narrow peak representing G0/G1 phase cells and a second smaller peak representing G2/M phase cells which contain four copies of each chromosome and thus twice the dye content of G0/G1 phase cells (Figure 1). Cells in S phase are in the process of DNA replication and hence their DNA content distribution will fall between the G0/G1 and G2/M peaks. G0/G1 Dean-Jett-Fox RMS = 27.62 % G1 = 51.35 % S = 30.99 % G2 = 17.16 No. Cells G1 µ = 193.3 G2 µ = 352.15 G1 CV = 10.05 G2 CV = 8.08 % < G1 = -1.39 S % > G2 = 0.33 G2/M FL3 7 Figure 1. Typical DNA profile from asynchronously growing Jurkat cells. Normally, about 40% of the cells are in G1 phase and about 20% each in S and G2/M phases. Using standard 1-D flow cytometry, it is not possible to separate G2 phase cells from mitotic cells. The quality of a DNA histogram is estimated from the width of the peak of DNA from cells in G1 of the cycle. This is measured by the coefficient of variation (CV) across the peak and is calculated from the standard deviation (SD). % CV = SD______ Peak Channel x 100 In the above equation, the peak channel is the mean channel number of the peak. The smaller the CV of the peaks in the DNA histogram, the more accurate is the measurement of ploidy and the better the estimation of the percentage of cells in the different parts of the cell cycle. It is essential that any unnecessary broadening of the peaks due to misalignment of the instrument or suboptimal dye-to-DNA ratio should be minimized. The number of cell clumps and the amount of debris present are also important factors influencing peak broadness. The microtubule inhibitor, Nocodazole can arrest the cell cycle at the G2+M phase. Flow cytometric analysis (figure 2) below demonstrates the ability of the Nuclear-ID™ Red dye to reflect the DNA content and cell cycle distribution. G2/M Dean-Jett-Fox RMS = 16.59 % G1 = 10.55 % S = 27.3 No. Cells % G2 = 62.17 G1 µ = 188.4 G2 µ = 376 G1 CV = 13.61 G2 CV = 13.21 G0/G1 % < G1 = -1.38 % > G2 = -2.49 S FL3 8 Figure 2: Effect of a cell cycle perturbation agent on DNA synthesis in Jurkat cells. The cells were treated with 0.1 µg/mL Nocodazole for 20 hours. Cells were then washed and stained with Nuclear-ID™ Red Cell Cycle Detection Reagent. VII. References 1. Darzynkiewicz, Robinson and Crissman (eds.) (1994) Flow Cytometry. Methods in Cell Biology, 41 & 42, Academic Press, Inc., San Diego. 2. Nunez (2001) “DNA measurement and cell cycle analysis by flow cytometry” Curr. Issues Mol. Biol. 3(3): 67-70. VIII. Troubleshooting Guide Problem Potential Cause Suggestions DNA histograms are of The key elements in obtaining a histogram of high quality are good sample preparation, correct cell-to-dye ratio and proper instrument alignment. Live cell histograms are more challenging to generate than fixed cell ones. Make sure the cell preparation poor overall quality. protocol generates single cells with minimal clumping. Filtration or trituration of cell suspensions may be required. Systematically vary the dye to cell ratio. Optimize for cell type, medium or buffer used, time of incubation, temperature of incubation. Gate on the live cells and increase the number of cycle events being analyzed. Verify that the flow cytometer is correctly aligned, with stable fluidics, using calibrated fluorescent beads of known CV. Verify that the cell concentration is 1 x 10⁵ to 5 x1 05 cells/mL. For permeabilized cells ensure that sufficient Triton X-100 has been added to the staining solution to permeabilize the cells. For ethanol fixed cells ensure that the cells were fixed and stored correctly. No G2 block observed in cells treated with Nocodazole. Incorrect drug concentration or time of incubation for cell type. 9 Optimize for cell type, medium or buffer used, time of incubation, temperature of incubation. NOTES 10 www.enzolifesciences.com