1
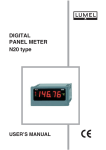
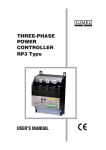
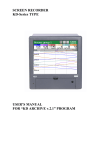
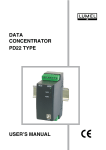
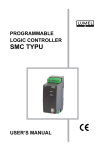
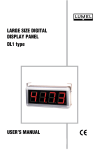
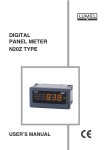
N16SETUP SOFTWARE CO-OPERATING WITH THE N16 PORTABLE 3-PHASE NETWORK ANALYSER USERS MANUAL N16SETUP SOFTWARE CO-OPERATING WITH THE N16 PORTABLE 3-PHASE NETWORK ANALYSER USERS MANUAL CONTENTS 1. INTRODUCTION ......................................................................................................................... 5 2. INSTALLATION AND PROGRAM SETUP WORKING ............................................................... 5 3. DESCRIPTION OF THE N16Setup.exe PROGRAM ................................................................. 5 3.1 Connection with N16 ............................................................................................................ 6 3.2 Visualization ......................................................................................................................... 6 3.3 Display of maximal and minimal values ............................................................................... 8 3.4 Display of harmonics ............................................................................................................ 8 3.5 Programming ........................................................................................................................ 9 3.6 Configuration ........................................................................................................................ 9 3.7 Archiving ............................................................................................................................. 11 4. DESCRIPTION OF THE CHART PROGRAM .......................................................................... 4.1 Assignment ......................................................................................................................... 4.2 Program functions .............................................................................................................. 4.3 Program description ........................................................................................................... 12 12 12 12 ! " 1. INTRODUCTION The N16Setup software is destined to service the N16 analyser through the serial link. Taking advantage of it, one can observe in an easy way measured and assigned quantities by the device and archive measuring processes. Basic features: l visualization of the current state of the measuring process, l tracing changes in time ( in the trend form) of the most important measured quantities, l archiving of current values in the file, l graphical presentation of quantity values in the form of columns, l choice of connection parameters with the device, l review and setup of device parameters, l configuration and readout of the storage buffer in N16, l creation of reports from archived data, l printing of reports. Minimal requirements necessary for a correct work: l operating system Windows 95/98/Me/NT/2K/XP, l serial port (physical or virtual) correctly configured in the operating system. The software is composed of N16Setup.exe and Chart.exe. 2. INSTALLATION AND PROGRAM SET WORKING The software is delivered on a CD together with the documentation for the N16 analyser. The installation and set working consists on the Setup.exe program from the installation catalog. After installing and starting the software, one must proceed acc. to information described in next items. The N16Setup program desinstallation is possible through the option Add/Delete programs in the Control panel. 3. DESCRIPTION OF THE N16Setup.exe PROGRAM After starting, the program is presented by the window with a visible: menu, quick choice bar, status bar on the window bottom and the window table. The view of the program is shown on the fig.1 Fig.1 Main window of the program # The program menu includes all commands necessary to service the program and N16 analyser. The most important of them are repeated in the quick choice bar in the shape of key buttons. The program has two windows between which the user can switch by means of two keys, at the left side on the quick choice bar or through the menu Option/table or Option/Chart. Window dimensions can be changed by means of the mouse. The change of the window dimensions inside the Table window is carried out by means of the drag of beams between constituent windows. 3.1. Connection with N16 The Connection... option from the Option menu serves for connecting/disconnecting from N16. The highlighting by the option informs about the active connection with the device. After its selection, depending on the highlighting, the program closes or opens the connection. When opening the connection, the dialog from the fig. 2 appears on the screen. Fig.2 Dialogue for the communication link configuration. Dialog fields include current link settings. The change of parameters consists on set up new values and accept them by the OK button. The field Settings includes the list of MODBUS protocol transmission modes implemented in the device (one must choose the mode set up in the device). Port and Baud rate fields include the identifier of the serial port and the set up baud rate. After accepting the settings, the program checks the connection and displays the result in the dialog Connection checking. After establishing the liaison, the program reads out current measuring values from the device and enables the execution of other operations on it. 3.2. Visualization The visualization of quantities and device parameters is carried out in the shape of: tables, trends, columns and event lists. The presentation was divided on two windows Table and Chart, between which the user can switch. The window Table presents current values in the shape of tables. The setup of the mouse index over the cell causes the display of the quantity description in the status bar at the bottom of the window. In this window, there is also a list of events including the history of events from the beginning of the program start. The established liaison and break of transmission with the device are stored on the list. The bar chart, including quantities expressed in the same unit, e.g. phase voltages, are an additional form of data presentation. The tab pages being above the chart enable to switch between different sets of quantities. $ The Chart window includes trends of most important quantities measured and calculated by the device. Above the window there are tab pages enabling the switching between different sets of trends. There are: phase voltages, phase currents, active power, cos fi and others. The tab Others enables the tracing of any accessible quantity from the list, on the trend left side. Each trend can include maximally 200 points. The trend length depends on the tracing frequency of this trend. This parameter is changed by means of a list being below the trend by the Tracing time text. Following tracing times are accessible: 1 s, 2 s, 5 s, 10 s, 15 s, 30 s, 1 min, 2 min, 5 min, 10 min. On the same bar, there are buttons enabling following operations on the chart, such as: l Auto - switches the automatic axis scaling on, l Clear - clears the trend contents, l Auto X - switches the automatic scaling of the time axis on, l << and >> - shifts the trend to the right and left, l Up and Down - shifts the trend up and down, l <> - increases the trend, l >< - decreases the trend. One can carry out operations of increasing and shifting by means of the mouse. The increase consists on setting the mouse index on the trend, pressing and holding the left mouse key and next, marking the rectangle which is to be magnified. The release of the key will cause the operation execution. When magnifying, the right lower corner of the rectangle should be at the right and below the initial point. The inverse marking will cause the restoration of the auto mode. The trend shifting is possible after setting the mouse index on the trend and next pressing and holding the right mouse key. Mouse movements will cause the trend shifting. The key release will cause the operation end. The view of the charts window is shown on the fig.3. Fig. 3 Charts window % The program allows to print reports in the form of a chart from the trend currently active. For this aim, one must choose the button with the symbol of the printer on the quick choice bar or the Print command from the menu File. The report will be printed on the default printer set up in the system. 3.3. Display of maximal and minimal values The Extrema command from the Option menu causes the display of maximal and minimal values and all measured and calculated parameters read out from the device. Tab pages: Voltages and currents, powers, coefficients, 3-phase parameters, THD harmonics allow the switching between parameter groups. Fig. 4 Extremal values window 3.4. Display of harmonics The program allows to observe results of harmonic analysis carried out in the N16 analyser. The analysis of harmonics in N16 is only carried out when the Har parameter is set in the Setup menu in the device. Fig. 5. Dialog for harmonic display & The program function related with the harmonic display is called by the Harmonics... command from the Option menu. The option choice will cause the creation of the Harmonics dialog. The window view of the Harmonics dialog is presented on the fig.5. The change of the displayed quantity set is carried out through the switching of tab pages at the top of the window. The dialog window includes the bar chart of particular harmonics and numeric values of harmonics related to the chosen phase, set up in the table. Chart values are automatically scaled to the higher value of the series. The restore button causes the renewed readout of the chosen series. The return to Tabel or Chart windows follows after closing the dialog. 3.5. Programming The successive option of the program is the programming of device parameters. It is called by the Parameters ... command from the Option menu. The option choice causes the creation of the N16 meter of network parameters dialog. The dialog includes following fields: l Menu - list of parameter groups in the meter, l Parameter name - list of parameter description and their values, l Value - field to change the value of chosen parameter from the parameter list, l Apply - button for change the confirmation, l Close - button for dialog closure. To change the parameter value, one must choose the parameter group, and next, the parameter from the group and modify its value on the Value field. After the modification of the parameter value, one must approve by the Apply button. If the parameter value is correct and was stored in the meter or transducer, it will be also updated on the parameter list. In case of error, an appropriate message appears below the Value field. The parameter updating is carried out through a renewed choice of the given parameter group from the Menu list. 3.6. Configuration The Configuration option in the Option menu opening the Configuration window is shown on the fig. 6. This window is destined for the archiving parametrisation of current measurement values and servicing the storage buffer in N16 versions with a storage buffer (memory module). The N16 analyser position includes the list of quantities which are traced by the program. Each quantity can be archived with individual parameters. One must mark the Archive field if we want to archive the variable. Successive fields define the storage frequency of samples, the condition and its parameter which the sample storage is fulfilled from. The storage of settings is carried out by the Apply button. The next position of N16 storage buffer includes the list of quantities which should be memorized in the storage buffer. It is configured in the same way as the previous list. The created configuration for the N16 storage buffer should be transmitted to N16 and since this moment, the buffer will memorize data in accordance with the configuration. Functions from the N16 buffer or the Configuration window for the N16 storage buffer position, are dedicated to service the buffer. They are visible on the fig. 7, The operation description of these functions is as follows: l Store the configuration into N16 - stores settings concerning the storage buffer and the list of archived quantities, ' Fig. 6 Configuration window Fig. 7 Buffer functions l l l l l Read out the configuration from N16 - Reads out the list of archived quantities in the storage buffer, Clear the N16 buffer - clears memorized measurements in the buffer, Clear the N16 configuration clears the list of archived quantities in the buffer, N16 clock - enables the setting of the real time in the buffer, Check the configuration in N16 - compares the list contents in the storage buffer with the list from the program. The field Foreseen archive length includes estimated calculations of the period of time after which the archive is filled. Prepared configurations can be stored to the file by means of the Store and Store as... options from the File menu. The Open... option from the File menu serves to read out the configuration from the file. The read out configuration can be stored to the N16 storage buffer. 3.7. Archiving Two ways for archiving the measuring process are possible in the program. The first way consisting on the storage in the chosen file, current values read out through the program from the N16 analyser. For its use, a previous readout of the configuration from file (*.n16) or the configuration of the list N16 analyser from the Configuration dialog is necessary. The archiving start follows after choosing the Archiving option from the Option menu or by the fifth button on the quick choice bar. The program will ask still for the name of the file which data will be stored to and start the archiving. By the option, the marking informing about the process start will appear and the button is remained pressed. The archiving end follows after pressing the button or choosing the marked Archive... option. Data are stored to the file with the expansion of dat and can be converted by the Chart.exe program. The second way consists on the readout of assembled data in the N16 storage buffer and their storage to the file with dat expansion. To take advantage from this, one must previously configure the storage buffer in N16. For this aim, one can use the list N16 storage buffer from the Configuration dialog or read out previously stored configuration from the file (file with n16 expansion). He next step is the configuration storage to the N16 analyser. After the correct operation end, the analyser will store data acc. to the configuration. Then, the device can work without connection with the program. When the measuring process is finished, one must make connection with the device if there is no connection, and next, call the Buffer readout...option from the Option menu. The program asks about the file name which it is to store data to and calls the dialog Readout of the storage buffer. Before the readout, the conformity of configuration is checked in the program and the N16 storage buffer. In case of configuration unconformity, one can read out the configuration from the N16 buffer with the help of the Configuration readout option from the N16 storage buffer menu or by the button Read out the configuration from N16 in the Configuration dialog, and next, start the data readout from the buffer. One can also, before the buffer readout, read out or verify the configuration by means of buttons Read out the configuration from N16 and Verify the configuration in N16, from the Configuration dialog. Before the successive measurement process, one must clear the contents of the N16 storage buffer such a way that it could include data from the current process. The Clearing option from the N16 buffer menu or the button Clear the N16 buffer in the Configuration dialog, serves for this operation. Before clearing the buffer, data can be repeatedly read out. 4. DESCRIPTION OF THE CHART PROGRAM 4.1. Destination The Chart program is one of the N16Setup group program destined for the presentation of archived data in the shape of charts, tables and reports. Data are stored in files with the *dat expansion. The software works in the MS windows. 4.2. Program functions Program functions are as follows: l creation of a chart from archived data in files, l filtration of date, l addition of curves to the chart, l optional configuration of charts, e.g.: scales, colours, grid, kind of lines, title, curve description, l magnification of any chart fragment, l display of statistical information about the curve: number of points, average, global extremas and local, l creation of tables with measurements, l data conversion to the text file in a format allowing the readout through the calculation sheet, l monitoring and report printing. 4.3. Program description 4.3.1. Program start One must start the program by pressing the Chart icon in the N16Setup program group. After starting the program, the main window appears in the screen, in which there is the main Fig. 8. Chart.exe program window program menu and the quick choice bar. The menu includes all edition commands necessary to create and configure reports. The most important of them are repeated in the quick choice bar in the shape of keys. The program main window is shown on the fig.8 4.3.2 The chart creation In order to create a new chart, one must choose the New chart... command from the Chart menu (or the 5th key in the quick choice bar). After the Open dialog appearance, choose the required file with expansion *.dat and accept by the OK button. A new dialog including the list of variable devices archived in this file, appears on the screen. The dialog headline includes the file name and the node name. One must choose the variable from the list, define the filter which will be applied when reading data in and press the OK button. The window with the chart appears on the screen. A legend describing curves on the chart is placed at the bottom of the window,. The addition of successive curves to the char is realized by means of the Chart/Add Curve option. One can place maximally 8 curves on the chart. These curves can origin from the same file or another. One of the curve on the chart is an active curve, i.e. the vertical axis and the coordinate grid is described in units of this curve. The horizontal axis represents the time and is described in the hh:mm format. In points of the time axis corresponding to full days, vertical lines with descriptions at the top are drawn. The time axis is common for all curves. The change of the active curve is carried out through the click on the legend field describing the curve << and >> buttons allow to shift the chart to the right or the left. 4.3.3. The chart configuration The program enables the optional chart configuration and the optional configuration of each curve. In order to the appropriate configuration of the chart, one must open the dialog window Curve edition through a double click by the left mouse key in the active window (or choose the Curve edition... command from the Chart menu, or by the 7th key of the choice bar). There are following options in the dialog window: Grid parameters - the Show option allows to switch the coordinate grid on or off. The interval between level lines in the time axis and Y axis; the zero value on the axis field switches the drawing of the level lines in this axis on. The number of printed pages - defines the number of pages which the chart will be printed on, the time axis is extended. Common Y axis - the choice of this option means that the Y axis of all curves is common, in the contrary, Y axis of particular curves are independent. Moreover, there is a list including curve names occurring on the chart, in the dialog window. The choice of a curve from the list causes automatically the setting of dialog fields by parameters of this curve, like: line type, colour, range of Y axis, range of X axis. The change of curve parameters consists on setting new values and pressing the Apply button. In this dialog, one can modify all curves. The Cancel button does not cancel introduced changes in curve parameters. The exit from the dialog through the pressure of the Close button will cause the curve updating by introduced changes. The Cancel button will close the dialog without updating such chart parameters as: grid and its parameters, number of printed pages and the common Y axis. ! 4.3.4. Chart scale Curves on the chart can be optionally rescaled in X and Y axis. For this aim, one must create the Curve edition dialog, choosing the Curve edition... command from the Chart menu or by pressing the 7th key on the quick choice bar. Choose the required curve from the list and introduce new values in Y axis and X axis fields, and next , press the Apply button. In the X axis field, one must give: for X axis (time), the beginning and the end of the time period in rrrr/mm/dd hh:mm format, for Y axis , the minimal and maximal range value on the Y axis field. The chart will be rescaled after choosing the Close button. 4.3.5. The coordinate grid The program gives the possibility to superpose grids on the chart. One must open the Edit curves dialog window through the choice of the Edit curves command from the Chart menu or by pressing the 7th key of the choice bar. In the Grid field, one must mark the Show element, and next give the grid resolution in the X axis and Y axis. The grid in the given axis will be displayed on the chart only when the value in the field will be different from zero. 4.3.6. Readout of the point value In the right part of the choice bar there are two fields, in which the current cursor position rescaled to ranges of the active curve is displayed. This enables the readout of the value and time for optionally chosen point of the active curve on the chart. 4.3.7. Magnification of a chart segment In order to magnify a chart segment of the active curve, one must press the left mouse key on the chart field and holding down, mark the rectangle including the magnified fragment. The release of the left mouse key will cause the magnification of the chosen fragment. The restoration of initial values of X and Y axis follows through calling the Restore command from the Chart menu. 4.3.8. Information about the curve The option of the Chart/info... menu displays information about data series assigned to the curve. There is information about data series assigned to the curve. There is information about: number of samples, global extremas, mean value. Additionally, local extrema and mean values for visible time interval on the chart are determined. Information concerns the active curve. 4.3.9. Addition of curves The program enables the addition of curves to the already existing chart. Curves can originate from different files. The addition of a curve is realized by means of the 6th key of the choice bar or by the Add curve.... command from the chart menu. After opening the dialog window from the list of variables archived in this file, one must choose the variable, and next, define the filter for read in data and press the OK button. If previously any file has been read out, then the Open dialog appears, one must choose the file interesting us (*.dat expansion) and approve by the OK key. The chosen curve will be add to the chart and its description will be in the legend field. " 4.3.10. Table with measurements The successive report type is the table. It enables to present chronologically arranged variable values. The first column of the table includes the date; the second column includes the time; successive columns include variable values corresponding to times from the first and second column. The table command from the Reports menu serves to create tables. After calling this command, the dialog with the variable list appears on the screen. After the variable choice, the filter type, and accepting the choice by the OK button, values of the chosen variable are read in. Next, the table with values of this variable is created. The table can be scrolled up and down. The addition of a successive variable to the table is realized through the Add column command from the Report menu. After choosing this command, the further procedure is identical as for the table creation. Such prepared table can be seen before the printout of the Printing review command, and next, print through the Print command. The table can be also printed in the text file by means of the Store as option from the file menu. 4.3.11 Data storage from the table to the text file The function of variable value storage from the table to the text file, allows the creation of a text file with variable values in the shape: data (rrr/mm/dd); time(hh:mm:ss); value1 (x.xxxeyy); value2; ...; valuen. The function is accessible after the table creation. The storage to the file is realized through the choice of the Store as command from the File menu. 4.3.11. Printing The program enables the printing of reports on any printer. The Printer Setup... command from the File menu, serves to choice and configure the printer. It allows to choose the printer from the list of installed printers in the Windows system and define its parameters. The next Printing review command allows the monitoring of the page before printing. The window enables the simultaneous review of one or two pages, monitoring of successive pages backwards and downwards. The next Print... command enables the report printout on the chosen previously printer. Following reports can be printed: l table with measurements, l chart The Print... and Printing review commands are accessible if an optional window with report is active. The active window decides what report can be reviewed or printed. The choice of these commands is also possible through the quick choice bar, by the 3rd and 4th key. # SALES PROGRAM n DIGITAL and BARGRAPH PANEL METERS n MEASURING TRANSDUCERS n ANALOG PANEL METERS (DIN INSTRUMENTS) n ANALOG and DIGITAL CLAMP-ON METERS n INDUSTRIAL and HOUSEHOLD CONTROLLERS n CHART AND PAPERLESS RECORDERS n POWER CONTROL UNITS and INVERTERS n LARGE SIZE NUMERIC and ALPHANUMERIC DISPLAYS n AUTOMOTIVE DASHBOARD INDICATORS n ACCESSORIES FOR MEASURING INSTRUMENTS n MEASURING SYSTEMS (ENERGY, HEAT, CONTROL) n CUSTOM-MADE PRODUCTS MEASUREMENT CONTROL RECORDING WE ALSO OFFER OUR SERVICES IN THE PRODUCTION OF: n ALUMINIUM ALLOY PRESSURE CASTINGS n PRECISION ENGINEERING AND THERMOPLASTICS PARTS n PRESSURE CASTING DIES AND OTHER TOOLS QUALITY PROCEDURES According to ISO 9001 and ISO 14001 international requirements. All our instruments have CE mark . For more information, please write to or phone our Export Department September 2006 Lubuskie Zak³ady Aparatów Elektrycznych LUMEL S.A. ul. Sulechowska 1, 65-022 Zielona Góra, Poland Tel.: (48-68) 3295 100 (exchange) Fax: (48-68) 3295 101 e-mail:[email protected] http://www.lumel.com.pl Export Department: Tel.: (48-68) 3295 302 or 304 Fax: (48-68) 3254 091 e-mail: [email protected]