1
XSPOC User and Administrator Manual
XSPOC Version 2
Theta Oilfield Services, Inc.
Main Office
1901 East Lambert Rd.
Suite 108
La Habra, CA 90631
562-694-3297
Bakersfield Office
5251 Office Park Dr.
Suite 110
Bakersfield, CA 93309
661-633-2792
Table Of Contents
Table of Contents
XSPOC User's Guide ...................................................................................................................... 4
Introduction .................................................................................................................................. 4
Main Client Window ..................................................................................................................... 6
Report Window ....................................................................................................................... 15
Add New Well ......................................................................................................................... 16
Field Maps .............................................................................................................................. 17
Run RODSTAR from XSPOC ................................................................................................ 19
Run XBAL CBALANCE from XSPOC .................................................................................... 19
Group Information ...................................................................................................................... 21
Group Status Window ............................................................................................................ 21
Group Status Views Setup Window ....................................................................................... 30
Associate User Views Window ............................................................................................... 31
Group Alarm History ............................................................................................................... 33
Group Well Test History ......................................................................................................... 34
Group Meter History ................................................................................................................... 34
Well Information ......................................................................................................................... 35
Card Viewer Window .............................................................................................................. 35
Manually Collect and Process DYNO Cards ...................................................................... 42
View Multiple Cards ............................................................................................................ 44
Positioning the Pump-Off Setpoint ..................................................................................... 44
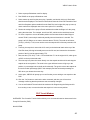
POC Trends Window .............................................................................................................. 45
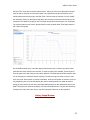
History Graph Window ........................................................................................................... 47
Host Alarms Window .......................................................................................................... 53
Graph Settings Window ...................................................................................................... 54
Export Data History Window ............................................................................................... 55
Other Well Measurements Window ........................................................................................ 57
External Data Query ............................................................................................................... 60
Register Panel Window .......................................................................................................... 60
How to Use Register Panel to make an All Call ................................................................. 63
Setpoints Window ................................................................................................................... 63
Well Configuration Window .................................................................................................... 67
Well Notes Window ................................................................................................................ 78
Well Status Window ............................................................................................................... 81
Facility Information ..................................................................................................................... 83
i
Table Of Contents
Facility Status Window ........................................................................................................... 83
Reports ................................................................................................................................... 84
Frequently Asked Questions ...................................................................................................... 84
XSPOC Administrator's Guide ....................................................................................................... 86
Introduction ................................................................................................................................ 86
Recommended Hardware and Software ................................................................................ 87
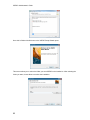
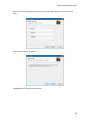
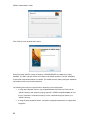
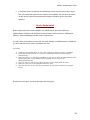
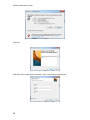
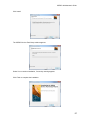
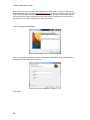
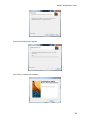
XSPOC Installation and Service Packs ..................................................................................... 88
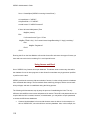
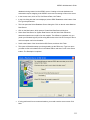
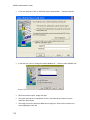
Server Install........................................................................................................................... 88
Service Packs Install .............................................................................................................. 95
Client Install .......................................................................................................................... 101
Installing xsClient on the Host Machine ............................................................................ 101
Installing xsClient on Client Machines .............................................................................. 103
Install xsDialer ...................................................................................................................... 105
XSPOC Account Information ................................................................................................... 107
XSPOC Service Manager ..................................................................................................... 107
License Manager .................................................................................................................. 108
Troubleshooting Licensing Issues .................................................................................... 109
Using Access and Excel ....................................................................................................... 110
Restoring an XSPOC System .............................................................................................. 113
Moving an XSPOC System .................................................................................................. 118
XSPOC Configuration .............................................................................................................. 121
XSPOC Configuration Window............................................................................................. 121
Add an Analog Input ......................................................................................................... 124
Add a Parameter to the Control Setpoints Panel.............................................................. 126
Add a Parameter to Group Status Views .......................................................................... 128
Backup the XSPOC Database Using Scheduler .............................................................. 129
Callouts on POC Alarms Setup ........................................................................................ 130
To Setup a Discrete Alarm Callout: ............................................................................... 130
To Setup a Hi/Lo Alarm Callout: ................................................................................... 130
To Setup a Custom Alarm Callout: ............................................................................... 131
Email Notification Setup.................................................................................................... 132
External Data Query Setup ............................................................................................... 132
SAM Production vs. Well Test Report Configuration ........................................................ 134
Setting the Number of Weeks to Store Dynamometer Cards ........................................... 134
Well Communication ............................................................................................................ 135
Add a Port ......................................................................................................................... 135
Talk Directly to TCP/IP Device ......................................................................................... 137
ii
Table Of Contents
Using Dialup Modem ........................................................................................................ 138
Using a Digi Terminal Server ............................................................................................ 138
Scheduled Events ................................................................................................................ 139
User Security ........................................................................................................................ 141
Adding the XSPOC Administrator to User Security .......................................................... 141
Granting Higher Level Access for Users .......................................................................... 141
Limit User Navigation to a Group ..................................................................................... 143
Morning Reports ................................................................................................................... 144
Group Configuration ................................................................................................................. 145
Group Builder ....................................................................................................................... 145
Facility Configuration ............................................................................................................... 147
System Configuration ............................................................................................................... 156
XSDialer ............................................................................................................................... 156
Overview ........................................................................................................................... 156
Configuration .................................................................................................................... 157
How to Setup Callouts for xsDialer ................................................................................... 160
Third Party Operations ............................................................................................................. 161
Manual Poll and Well Control of XSPOC Wells From Another Program .......................... 161
Frequently Asked Questions .................................................................................................... 162
Appendix ...................................................................................................................................... 167
Session .................................................................................................................................... 167
Data Entry ................................................................................................................................ 167
Run States ............................................................................................................................... 167
Statistical Process Control ....................................................................................................... 169
Glossary....................................................................................................................................... 171
Index ............................................................................................................................................ 173
iii
XSPOC User's Guide
XSPOC User's Guide
Introduction
XSPOC is a software system that allows you to monitor, control, and analyze your oilfield wells
and facilities. XSPOC consists of a server that collects and stores information, and a client that
allows the user to interact with the rest of the system.
The purpose of this guide is to provide you with an understanding of how XSPOC works and how
to use it to maximize your production and minimize your operating expenses.
As an XSPOC user, you most likely will be running the XSClient software from a workstation on a
network that is linked to the host computer. In this case, you will never see any of the XSPOC
software other than XSClient. In other cases, you may be running the client software on the same
computer that the server software is running on.
Whether running on the host computer or a separate workstation, its function is the same: it
provides you, the user, with a means to communicate with well controllers or other devices,
review dynamometer cards and analysis, and to enter and retrieve data.
There are some terms and functions that need defining, before beginning to use XSPOC.
Scans – This refers to the retrieval of information from the controllers. XSPOC makes two types
of scans: Status Scans and Daily Scans.
The Status Scan is performed routinely at an interval defined by the XSPOC
administrator or your Theta representative. The default interval is 10 minutes, which
means that the system scans all wells then waits 10 minutes before commencing the next
scan. The number of scans per day depends on how long it takes to perform one scan of
all of the wells. This scan simply checks the status of the well and if there are any alarms
to report. In this guide, the Status Scan may also be referred to as “polling the well”.
The Daily Scans are performed once a day and is a large data download from the
controller. During this scan, XSPOC retrieves dynamometer cards and other daily
information such as runtime, number of cycles, average pumping speed, etc. This scan
requires several communication requests and can take up to 20-25 seconds per well,
dependent on the quality of the communication’s link and the type of controller.
4
XSPOC User's Guide
Session – This refers to the time during which you have the XSClient program open and running.
The session begins when you open the program and ends when you close it. If you are sharing a
workstation with other users, it is recommended that you end a session when finished doing your
work.
Security – XSPOC has several levels of security and user access to the features of the program.
The XSPOC administrator needs to set up a security level for each user requiring more then a
read-only type access to the information in XSPOC. XSPOC Security is based on the computer‘s
User login and no longer uses passwords to access different areas of the program. If you find that
menu items or screens are not accessible by you then contact your XSPOC administrator for
more access rights.
Selected Group or Well – Refers to the group of wells or the individual well selected in the Well
Groups Tree. When a group or well is selected, XSClient is using data for that item to populate
the screens. You can tell which well or group is selected from the status bar at the bottom on the
XSClient screen.
XSClient – The software interface used to access information from the XSPOC database, control
wells, and collect and analyze dynamometer cards.
XDIAG – The diagnostic software that takes information from surface and downhole equipment,
production data, fluid data and the surface dynamometer card to calculate a downhole
dynamometer card and an analysis of the condition of the entire system. Automatic analysis of
cards by XDIAG occurs once per day (early morning after collection). You can manually analyze
any selected dynamometer card. Only the current or startup card that has been collected
overnight will be analyzed automatically.
RODSTAR and Rodstar-D – The predictive software that takes information from surface and
downhole equipment, production data, fluid data and the simulated downhole dynamometer card
and calculates the predicted surface dynamometer card and predicted condition of the entire
system.
XBAL – The software that calculates the maximum counterbalance effect from a given pumping
unit configuration and counterweights positions, or calculates the position of counterweights from
a given pumping unit configuration and maximum counterbalance effect.
5
XSPOC User's Guide
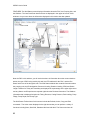
Surface Dynamometer Card – A plot of rod string loads versus carrier bar position. Rod string
loads are collected by means of a load cell (either a horseshoe load cell, mounted between the
carrier bar and polished rod clamp OR a beam mounted strain gauge, that detects stress
deflections in the walking beam). Position data on POC’s is usually collected by one of two
methods: a position (proximity) switch and modified sine wave, or an inclinometer.
Downhole Dynamometer Card – A plot of the loads on the pump versus the pump position. The
card is calculated by the analysis software (XDIAG) using the surface card, production
information, fluid data, and surface and downhole equipment.
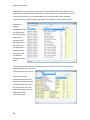
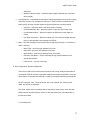
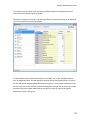
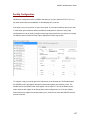
Main Client Window
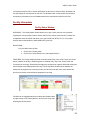
OVERVIEW: The Main Client Window is the central navigation window for the XSPOC Client.
From it, you can read and write information to or from the POC, control the POC, collect, analyze
and delete dynamometer cards, enter and edit well information, and graphically display a large
assortment of historical data.
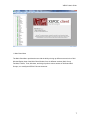
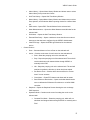
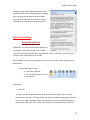
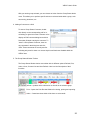
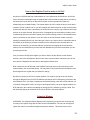
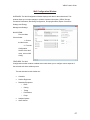
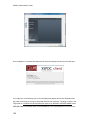
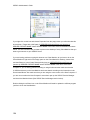
NAVIGATION: When the XSPOC Client opens, you will see the screen shown below, which is the
Main Client Window. The logo box will disappear when the program has established a connection
with the database. If the Main Client Window does not open, then an error will be displayed letting
you know that XSPOC Client was unable to establish a connection. This can happen when the
server is not running or the network is down, preventing the client from locating the server.
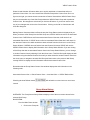
FEATURES: The Main Client Window contains:
1. The Menu Ribbon (the menu tabs across the top of the screen).
2. The Well Explorer (the tree view on the left side of the screen displaying Well Groups and
Wells).
3. The Child Window Display Area (the large portion of the Main Client Window where other
screens are opened).
6
XSPOC User's Guide
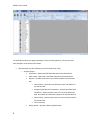
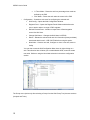
1. Main Client Menu
The Main Client Menu provides the user with the ability to bring up different screens in the Child
Window Display Area of the Main Client Window, from six different sections (Well, Group,
Facilities, Failures, Tools, Windows, and Help) to perform various actions on Wells and Well
Groups, or to modify the XSPOC Client environment.
7
XSPOC User's Guide
The Well tab has three main groups (Analysis, Control, and Configuration). The structure and
brief description of each menu item follows:
Well (activated only after selecting a well in the Well Group Tree)
o
Analysis Section –
Well Status – Opens the Well Status Window for the selected well.
Card Viewer - Opens the Card Viewer Window for the selected well.
Reports – Contains a sub-menu of pre-defined reports for the selected
well.
Alarm History - Opens the print preview of a list of all alarms for
the selected well.
Analysis Input Data (Surf, Downhole) - Analysis Input Data (Surf,
Downhole) – Opens the print preview of a list of the production
data, and surface and downhole equipment for the selected well.
Notes History - Opens a print preview of a list of all well notes for
the selected well.
8
Unico Summary
History Graph – Opens the History Graph Window
XSPOC User's Guide
Alarm History – Opens Alarm History Window and allows users to select
Alarm History from pre-set time frames.
Well Test History – Opens Well Test History Window.
Meter History – Opens Meter History Window and allows users to select
Gas, Injection, and Production Meter reporting criteria for a defined date
set.
POC trends – Opens POC Trends Window for the selected well.
Other Measurements – Opens the Other Measurements Window for the
selected well.
Well Notes – Opens the Well Test History Window.
External Data Query – Opens a window to show data from an external
data source that has been configured by the XSPOC Administrator.
View EFM Logs – Opens the EFM Logs Windows for the selected
device.
o
Control Section –
Scan – Command button to force a Scan on the selected well.
Action – Contains a sub-menu for well control on the selected well
Start - Starts the pumping unit on the selected well
Stop - Stops the pumping unit of the selected well. The well will
remain shut down until restarted either through XSPOC or
manually at the POC.
Idle - Stops the pumping unit on the selected well. The well will
start back up after the idle time (or down time) has expired.
Set Device Clock – Checks device time and sets it to current
time if it is not accurate.
Clear Alarm – Clears RTU alarms and allows well to restart.
Sam Reference Revolutions – Opens a window that allows the
user to calibrate the Reference Revolutions on a Lufkin WHM
controller.
Setpoints – Opens the Setpoints Screen allowing the user to change
POC Setpoints.
Operation Mode - Contains a sub-menu for setting the mode on the
selected well.
Constant Run Mode – Starts the pumping unit, which will not
shutdown until stopped either through XSPOC or manually at the
POC.
9
XSPOC User's Guide
% Timer Mode – Places the well in a percentage timer mode as
defined by the POC
o
POC Mode – Places the well under the control of the POC
Configuration – Contains a sub-menu for configuring the selected well.
Well Config – Opens the Well Configuration Window.
Register Panel – Opens the Register Panel Window which allows the
user to read or write to a range of POC registers.
Refresh External Data – Initiates an import from a Data Integration
source like Well View.
Change Well Name – Changes the Well Name in XSPOC.
Delete – Deletes the selected well and ALL information (history and data)
associated with this well – USE CAUTION before using this option.
New Node – Create a new well, Configure or clone a new well, meter or
facility
You can also access the Well Configuation Menu items by right-clicking on a
well. This selection also will allow you to enable/disable wells, as well as create
new wells. Similar to using the New Node selection in the above configuration
section.
The Group menu (active only after selecting a Group from the Well Group Tree) has two sections:
(Analysis and Tools).
10
XSPOC User's Guide
o
Analysis Section
Group Status – Contains status for the selected group of wells.
Reports – Contains a sub-menu of different pre-defined reports for the
selected group of wells.
Alarm History – Opens the print preview of a list of alarms for
each well over the last X amount of days, where the user
specifies the number of days.
Communication Status – Opens the print preview of a list of the
status of the last communication for each well in the selected
group of wells.
Group Status – Opens the print preview of the Group Status
Report.
Parameter Change – Opens the print preview of a list of
parameter changes for each well in the selected group for the
day.
Last Analysis Results – Opens the print preview of a report with
a brief listing of analysis results from the last available XDIAG
run for each well in the selected group.
SAM Production vs. Well Test Report – Opens the print preview
of a report comparing the Sam Inferred Production Data with the
Well Test Data for a group of wells as of a user specified date.
XSPOC/SAM Equipment Mismatch -
11
XSPOC User's Guide
Well Group Problem – Opens the print preview of a list of wells in
the selected group with pump problems.
Alarm History – Opens a window displaying the alarm history for the
selected group of wells within a specified time frame.
o
Well Test History – Displays well test history for a selected date range.
Meter History – Display of meter report for a selected date range.
Tools
Field Maps – Opens a Bing Map containing location and status data for
all wells in the selected group (location data must be present).
Group Builder – Opens the Group Builder Window allowing the user to
customize the Well Group Tree.
Facilities has two sections (Analysis and Configuration).
o
Analysis
o
Facility Status – Opens the Facility Status Screen.
Configuration
Facility Tag – Opens a configuration window that allows XSPOC
Administrators to create or modify facility tags.
Schematic Designer – Opens the Schematic Designer which allows
users to customize graphics and real-time data for facilities.
Tools has three sections (User, Admin, and Application).
o
User – Contains a sub-menu for Administration functions applicable to the
current user (these are not global settings).
Settings – Allows customization of measurement units within the client.
Log Verbosity – Allows the user to specify the level of reporting for the
client log.
Information – Records at the Info level (every transaction).
Warning – Records only warnings and errors.
Error – Records only errors in the client.
User Security Settings – Opens the User Security Window allowing users
to change their passwords and administrators to create, edit, and delete
user accounts.
12
Language – Select languages
German
English
Spanish
French
Russian
XSPOC User's Guide
Chinese
Log File - Allows the user to select the length of file to view before
opening the log file.
o
Admin –
Configuration – Opens the Configuration Window that allows XSPOC
Administrators to change XSPOC configuration values in the XSPOC
database.
Group Builder – Opens the Well Group Builder Utility that allows XSPOC
Administrators to build well group definitions using an interactive utility.
New Node – Create a new well. Configure or clone a new well, meter, or
facility.
Communications Log – Opens the Communications Log Window.
Generate Encrypted Password – Generates encrypted password for
XSPOC licensing.
User Security – Allows the XSPOC administrator to configure security
access rights for users.
Clear Transactions –
Clear Scan Transactions – Clears queued scan transactions
Clear All Transactions – Clear all queued transactions
Flow-Cal Export – Opens a window allowing the user to export meter
data to a Flow-Cal formatted file.
Change XBAL Template File – Allows the user to select a new XBAL
template file
o
Applications –
Animations – Opens the Animation Library and allows the user to run all
of Theta’s well animations.
XTOOLS – Starts XTOOLS.
XBAL – Starts XBAL for a selected well.
RODSTAR V - Starts RODSTAR V for a selected well.
RODSTAR D – Starts RODSTAR D for a selected well.
XROD V - Starts XROD V for a selected well.
The Window tab has two sections (Arrange and Layout).
o
Arrange – Allows the user to save the layout of open windows so they can be
reopened all at once during subsequent sessions.
Cascade – Windows float and are stacked on top of each other
Tile Horizontally – Tiles windows in a stack
Tile Vertically – Tiles windows side-by-side
13
XSPOC User's Guide
o
Layout
Save – Saves current window arrangement for easy re-opening
Open – Opens saved arrangement
Delete – Deletes selected arrangement
Save As – Saves current arrangement with a new name
Clear – Clears current arrangement without saving changes
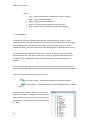
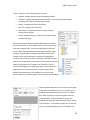
2. The Well Explorer
The field on the left side of the Main Client Window is the Well Explorer, a view of logical
groupings of wells. It is similar to the directory (or folder) tree that Windows Explorer uses and is
the navigational tool for selecting a group of wells or an individual well. This box is always
available for viewing, and may be sized by clicking-and-dragging the right-hand side of the box.
The Well Explorer tree organizes wells by group. Grouping of wells is based on the criteria
defined for that group. The criteria for each group can be set up to filter wells based on well
condition, alarms, geographical location, organizational data, or any data available in the
database.
Since well grouping is based on specific criteria, the same well can belong to multiple groups.
Wells are dynamically added and removed from these groups based on the criteria for that group.
There are two types of groups in the Well Group Tree:
1.
2.
The Parent Groups – Contains other Parent Groups and Well Groups.
The Well Groups – Contains wells that are grouped together based on specific
criteria.
To select a group of wells or facilities, you just click on
the name of the group. To display the wells or facilities
listed in the group, click the plus sign
to the left of the
group name. To select a well or facility, click on the one
you want.
14
XSPOC User's Guide
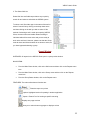
3. The Select Well List
Select Well is a text field that provides a way to quickly
search for and select a well within the XSPOC system.
To select a well, first either type in the name of the well or
select it from the list by clicking on the drop-down arrow
and then clicking on the well you wish to select. If this
method of selecting a well is used upon opening XSPOC
Client, the menu items and toolbar buttons relating to
individual wells will become active and you are ready to
work at the well level. However, please note that the Group
level tab items and ribbon buttons do not become active, as
you have bypassed selecting a group.
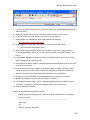
Report Window
OVERVIEW: All reports in the XSPOC Client open in a print preview window.
NAVIGATION:
From the Main Client window, click on the Well menu and then click on the Reports menu
item.
From the Main Client window, click on the Group menu and then click on the Reports
menu item.
From the Group Status window, click on the Reports menu.
FEATURES: The main toolbar button functions are:
Prints the report to a printer
Copies a highlighted section for pasting in another application
Opens a “Search” box for locating a specific text string
Displays one page at a time
Allows you to select how many pages to display at a time
15
XSPOC User's Guide
Zooms in and out on the preview
Allows you to select a zoom size
Allows you to navigate through the pages of the report
Allows you to navigate the historical preview
Allows you to save the report as a text, HTML, PDF, RTF, TIF,
TXT, or XLS file
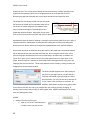
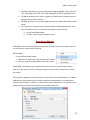
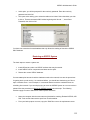
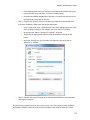
Add New Well
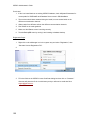
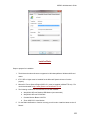
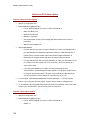
1. From the Main Client Window, click on the Well tab in the ribbon.
2. Select “New Node” in the Configuration section.
3. Enter a unique name in Well Name. This name cannot be in use on another well and it
cannot be blank. It also can not contain a forward slash “/” or a back slash “\”.
4. In the Controller section, select the controller type and communications port, and
designate the RTU address.
5. You can choose to create this well in the “Enabled” mode so it will begin scanning right
away. The selection box is located at the bottom of the screen next to the “Create”
button.
6. You can choose to clone this well from another and the original well’s configuration
information will be copied to the new well. Click on the down arrow to open a list of
existing wells and select a well to clone.
7. Click Create to create the new Well.
16
XSPOC User's Guide
You should now select the new well in the Well Explorer and open the Well Configuration window
to edit specific information concerning the well. Remember that new wells have their Enabled
property set to disabled by default, so you need to open a group that would include this new well
if the current group that is open filters out disabled wells. If an address has not been assigned,
enter something like “9999”, and then edit the address later. XSPOC will warn you if this number
is currently used by another well. Do not use “0” unless you mean to create a well that will act as
an All Call well. An All Call well will transmit a message through a radio network that will be
received and acted upon by all radios in the field.
Important – In order for XDIAG to give accurate results for the new well, all equipment data
should be properly and accurately updated as soon as possible. If this new well has a SAM POC
and you have previously entered information into the SAM then you can upload this information
from the controller into XSPOC using the Well Configuration screen.
Theta should also be contacted when a customer adds new wells to take care of any licensing
issues.
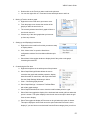
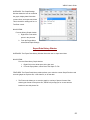
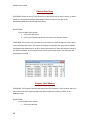
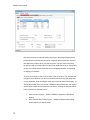
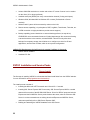
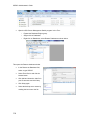
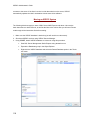
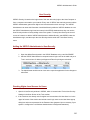
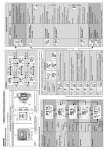
Field Maps
OVERVIEW: The Field Maps window allows the user to view the wells of the field layed out on an
oilfield map. Each well can be associated with one map and the system can have multiple maps.
NAVIGATION:
From the Main Client window:
1. Select a group in the Well Group Tree
17
XSPOC User's Guide
2. Select Field Maps from the Tools Section on the Group tab in the ribbon.
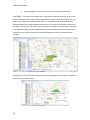
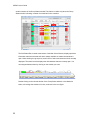
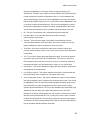
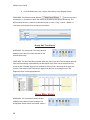
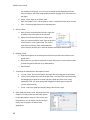
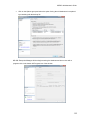
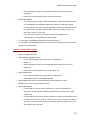
FEATURES: The latitude of this map is the Y-Axis while the longitude of this map is the X-Axis.
Wells are displayed on the map as square points with the NodeID above the well point. The only
button on the toolbar is the refresh button; there is no automatic refresh of this window. After
making changes to any wells in regards to this map or to refresh the communication status of all
the wells on the map, you can click on the refresh button to update the well information. Wells are
color coded depending on the Run Status that was retrieved during the Last Good Scan; Green
denotes Running, Yellow denotes Idle, Red denotes Shutdown, and Blue denotes any other
condition.
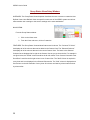
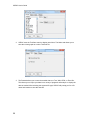
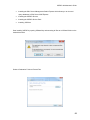
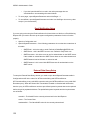
Placing the mouse cursor over a well point on the map will display more information in regards to
the well status, as shown below.
18
XSPOC User's Guide
Map data can be input in the Map Info area on the Controller Tab
in the Well Config window. To remove a well from Field Maps,
simply remove the Latitute and Longitude data from the Well
Config window.
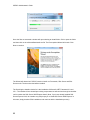
The Oilfield Map window supports zooming and scrolling of the zoomed window. To zoom in to
the map, double click on the map or use the plus and minus zoom icons on the map display
screen. Scrolling around the zoomed window is possible by right or left -clicking on the map and
while holding the mouse button down, move the mouse in the desired direction you want to scroll.
This window will not allow you to scroll past the borders of the map.
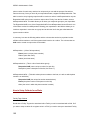
Run RODSTAR from XSPOC
The RODSTAR icon in the Tools Applications section opens RODSTAR
and imports all data necessary to make a predictive run on the existing
configuration of the well in focus.
You are now ready to make changes to the design. To learn how to optimize a well, Theta
recommends that you attend one of its RPO schools. After you have modified a design and you
want to save the file, single-click File, Save and then choose the directory where you wish to save
the file. The default location will be in the XSPOC directory; however, you may wish to store the
.RST file in a different directory.
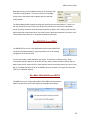
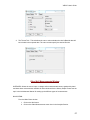
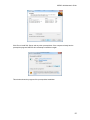
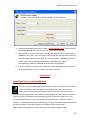
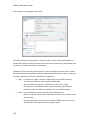
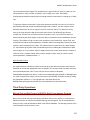
Run XBAL CBALANCE from XSPOC
The XBAL icon on the Toolbar starts XBAL. Either XBAL will open with the
data for the well in focus OR it will display the message shown below.
19
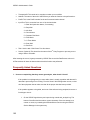
XSPOC User's Guide
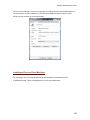
If an XBAL file exists for the well, you will see this window open up.
If you get this message, single-click the “yes” button and enter the data necessary to build the
XBAL file. Save the file to the server’s XDGDATA directory. The well name in the XBAL file
MUST match the well name used in XSPOC.
Now when XSPOC runs XDIAG on each well, it will automatically import the maximum
counterbalance effect and determine loadings on the gearbox.
Note: Even though XDIAG is using the maximum counterbalance effect to calculate gearbox
loadings, the MCM will not show up in the Well Configuration Window for the well (it displays the
default of 0). If a CBL file does not exist for a well, XDIAG assumes that the well is balanced,
20
XSPOC User's Guide
although it states in the Analysis Box that there was
no MCM available when calculating gearbox loadings.
While collecting and inputting the data into XBAL
requires a lot of manpower and time, the benefits in
extended life and reduced repairs justify the effort.
Group Information
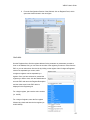
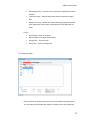
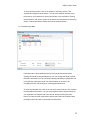
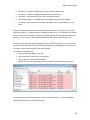
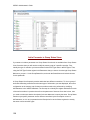
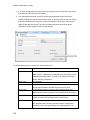
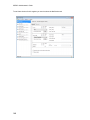
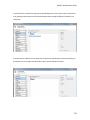
Group Status Window
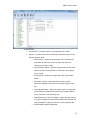
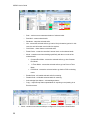
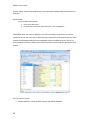
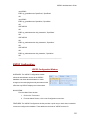
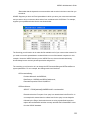
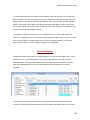
OVERVIEW: The Group Status Window displays the
current status of the wells that are in the selected
group. This window, which is laid out in a spreadsheet view, is used to get a quick and visual
overview of the current operation of the wells.
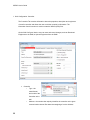
NAVIGATION: To open the Group Status window, you must first select a Well Group from the
Well Explorer.
From the Main Client window:
1. Click on the Group tab.
2. From the Analysis sub-menu, click
on Group Status.
FEATURES:
1. Overview:
The data in the Group Status window reflects data collected during the last automatic or
manual scan of the wells. The Group Status grid can be refreshed by clicking on the Refresh
button on the toolbar. Checking the auto refresh option will cause the Group Status grid to
automatically update after every minute. Checking the lock option allows the user to start
21
XSPOC User's Guide
another instance of the Group Status window.This feature is visible only when the Group
Status window is floating, not when it’s maximized in the container.
The Well Status Bar, located at the bottom of the Main Client Window, displays pertinent
information about the selected well and is always available no matter what window is
open. When working at a group level, a well count of active and inactive wells is normally
displayed. The status bar also displays the child windows that are currently open. You
can navigate between them by clicking on the window you want.
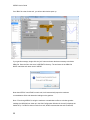
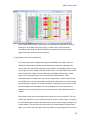
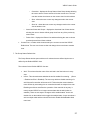
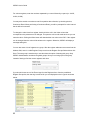
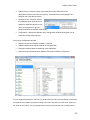
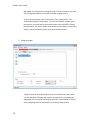
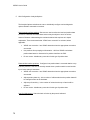
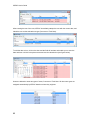
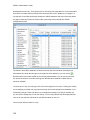
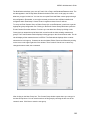
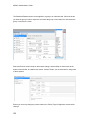
Double-clicking on the colored title bar of the Group Status window, or the Maximize
button, will enlarge the window to full size, as shown in the next figure.
22
XSPOC User's Guide
Notice that the Well Explorer is not covered. The Well Explorer stays open at all times
allowing you to navigate from group to group, or well to well, as the need arises.
Choosing another group from the Well Explorer will cause the Group Status grid to
display information pertaining to the new group.
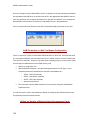
2. Group Status Views and Customization
The Group Status grid is arranged according to what XSPOC calls Views. Views are
definitions of Group Status grid layouts that define which columns are displayed, the
order in which the columns are displayed, and the width of each displayed column. There
are two types of Views: Global Views and Custom Views. The main Global View is known
as the Default View. Global Views are defined by the XSPOC Administrators. Global
Views can be customized by the user and saved with a different name. These
customized views are visible only to the user who creates them. Custom Views can also
be modified by the user and saved with a unique name. Global Views and Custom Views
can be assigned to specific well groups so that when a well group is selected by the user
then the assigned view will display in the Group Status grid. For more information on
assigning views to well groups see the topic Associate User Views Window later in this
manual.
The columns in this grid can be resized and moved to suit a user’s preference. The only
column that cannot be moved is the Well Column since that is a fixed column. Columns in
the Group Status grid, except for the Well Column, can be sorted by single-clicking on the
column headers. The sort order will reverse itself if the column header is single-clicked
again. You can also select all wells in the Group Status View by pressing Ctrl-A when the
23
XSPOC User's Guide
Group Status Window has the focus. To just have one well selected again just click on a
single well row. Any changes that are made to the Group Status Grid will need to be
saved before they become permanent. To bring the Group Status Window back to its
configuration prior to customization, simply single-click the Refresh button and the view
will revert back to its prior configuration with current information.
The ability to customize the Group Status grid gives you the option of prioritizing what
wells you want to see in the special report available in the Group Status Menu. Singleclicking the Print button in the Group Status View Window opens the print preview
window for the report that is configured by your display settings.
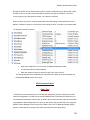
3. Performing Actions on Selected Wells
You can select a group of wells within the well group for an action. This action group can
consist of one to all of the wells listed in the Group Status window. To select contiguous
wells within a group, simply place the cursor on the name of the top well in the list of
wells to be selected and then click-and-drag across the names of the wells you want to
select for an action. The selected wells will be highlighted in the grid. Or you can select
the first well you want and then Shift-click on the last well you want to include in your
action group. To select non-contiguous wells within a group, simply hold down the CTRL
key while single-clicking each well to add to the action group.
24
XSPOC User's Guide
With your action group selected, you can choose an Action from the Group Status Action
menu. This allows you to perform specific actions on selected wells within a group, such
as scanning, shutdown, etc.
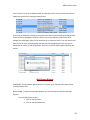
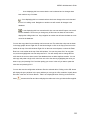
4. Adding a Comment to a Well
To enter a Group Status Comment, doubleclick directly on the corresponding cell for incell editing or right-click on the Comment cell to
display an Edit Comment dialog box and click
Save when finished entering the comment. To
“erase” a Group Status Comment, clear out
any comments in the dialog box and click
‘Save.’These comments are usually used for
indicating why a well is down or a reason why this well has been disabled within the
XSPOC host.
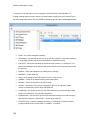
5. The Group Status Window Toolbar
The Group Status Window has its own toolbar with six different options Refresh, Print,
Action, Views, Current View and Auto Refresh. Here is a brief description of their
functions:
Refresh - updates all the information on all wells in the selected group.
Print – Opens the Print Preview Window for viewing, printing and exporting.
Action – Contains actions which will be done on select wells.
25
XSPOC User's Guide
o
Scan - retrieves current status and alarm of selected wells.
o
Start Well – starts selected wells.
o
Shutdown - stops the selected wells.
o
Idle - causes the selected wells to go into its idle (or downtime) period. In this
case, the well will restart once its idle time expires.
o
Clear Alarm - clears alarms on selected wells.
o
Reset Clocks - resets the controller’s internal clock on the selected wells.
o
Mode - contains menu items dealing specifically with the run mode of the
selected wells.
Constant Run Mode - causes the selected wells to go into Constant
Run Mode.
% Timer Mode - causes the selected wells to go into Percent Timer
Mode.
POC Mode - causes the selected wells to go back to POC monitoring
mode.
o
Enable Wells - will enable selected wells for scanning.
o
Disable Wells - will disable selected wells for scanning.
o
Acknowledge Host Alarms – acknowledges alarms
o
Copy – copies Group Status spreadsheet for exporting to and pasting in an
Excel document.
26
Views - contains menu items that help to configure the Group Status View Window.
XSPOC User's Guide
o
Customize - displays the Group Status Views Setup window allowing
the user to add or remove columns from the current view. The user
can also reorder the columns on the current view from this window.
o
Save - allows the user to save any changes made to the current
view.
o
Save As - allows the user to save any changes made to the current
view as another view.
o
Associate Views with Groups - displays the Associate User Views window
allowing the user to choose default group views from any of the previously
saved views.
o
Delete View - displays the Delete View window allowing the user to choose
previously saved User Views to delete.
Current View - contains all the views saved by the current user and the XSPOC
Default view. The user can choose a view and change the current view to another
view.
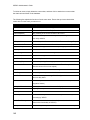
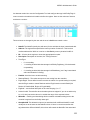
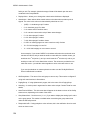
7. The Group Status Default View
The Group Status window opens with a set of columns that are defined by the user or
defined by the Default XSPOC View.
The columns for the Default XSPOC View are:
Well - This column lists the name of the well and is the fixed column in every
view.
In/Out - This column denotes whether the well is enabled for scanning.
(Green
= Enabled and Red = Disabled) The user may decide to disable scanning of a
well if the well’s controller will be turned off. This makes the communications
more efficient by not wasting time on controllers that will not respond to a scan.
Disabling a well does not affect the operation of the controller in any way. It
merely causes XSPOC to no longer communicate with the well (unless reenabled). There are two ways to change a well's enabled status: A user can
double-click on the enabled cell to toggle the enabled state. A user can select a
well or multiple wells and then choose the Action: Enable Wells/Disable Wells
menu item.
27
XSPOC User's Guide
Pump Condition - This column reports the pump condition from the last XDIAG
analysis run on the well. Examples of pump conditions would be 'Leaking
traveling valve' or 'Worn pump'.
Communication Status - This column contains the communications status of the
last attempt to communicate with the well. The status will either be 'OK,' 'CRC
Error,' 'Timeout,' or ‘SocketConnectFail.’ OK indicates that the system is
successfully communicating with the POC. A CRC Error indicates that a
response is received from the controller, but that the data packets from the
controller are being received with errors. If this happens, no data will be updated
in XSPOC. A Timeout error indicates that there is no response from the well,
potentially caused by a power failure, remote radio failure, bad controller
address, etc.A SocketConnectFail indicates that XSPOC cannot establish a
TCP/IP connection with the Terminal Server or Cell Modem.
Run Status - This column contains the running state of the well as of the last
successful scan. The status will either be Running, Idle, or Shutdown. The run
status may contain other information, depending on the type of controller being
used.
TIS (Time In State) - This column indicates how many minutes the well has been
in the current run state (running, idle, or shutdown). Please note that, depending
on the controller, this value may not always be correct. Many controllers have an
upper limit for this value, or they may have odometer-style register that rolls over
after so many minutes.
Alarms - This column indicates the highest priority RTU alarm or ‘OK’ if there are
no RTU alarms. Since a controller can have multiple alarms, the user can rightclick on this cell to view a drop down list of the alarms. The priority of the alarms
can be set through an administrative function.
Host Alarms - This column indicates the highest priority host alarm (alarms
caught by XSPOC) or ‘OK if there are no host alarms.
% RT (Today's Run Time) - This column shows the well's percent runtime for
today.
Comment - This is a column that can be used to store any comment that the user
wants to associate with the well. Double-clicking or right-clicking will cause an
Edit Comment window to display so the user can edit the comment. Any
comments entered here are automatically added to the Notes history as well.
% RTY (Yesterday's Run Time) - This column shows the well's percent runtime
for yesterday. This cell will be highlighted in red if the value falls outside the
typical operating range (using SPC or Statistical Process Control) for this well. It
28
XSPOC User's Guide
will also be highlighted in red if it goes outside a range specified by the
administrator. The well's color scheme is directly related to the Operational Type
for that well (setup in the Well Configuration screen). If a well is identified as a
24-hour operating type, then the cell will be highlighted in red only if the runtime
falls below the specified upper limit. For a cycling well, it will be highlighted in red
if it is below or above the specified limits. The cell will be highlighted in yellow if
the well has a high degree of variation in its data, indicating that the SPC limits
are too broad and that there may be a problem with the operation of the well.
Oil - This is the oil production rate, measured during the last well test.
Last Good Scan - This is the date and time of the last successful
communications with the well.
%Comm - This is the percentage of successful communications since the
communications statistics were last cleared. This event normally occurs every
night at midnight, but can be configured to occur at any time.
Tech Note – this column functions the same as the Comment column and
provides another location to store notes. These notes are also stored historically
in Well Notes.
% Fill - This column reports the pump fillage percentage. This value is reported
by the POC (some controllers do not support this). This value is of interest on
POC operations where the well is set up to not cycle. It is useful for monitoring
the pumped-off state of the well; particularly in heavy oil, non-cycling wells.
Host Alarms – This column displays the highest priority Host Alarm. Host Alarms
are configured on individual wells.
Cycl (Today’s Cycles) - This column indicates the number of times that the well
has cycled today. Some controllers do not support this function.
YCycl (Yesterday’s Cycles) - This column indicates the number of times that the
well cycled yesterday. Some controllers do not support this function. This cell will
be highlighted in red if the value falls outside the typical operating range for this
well (using SPC). It will also be highlighted in red if it goes outside a range
specified by the administrator. The color is also affected by the Operational Type
specified for the well (setup in the Well Configuration screen). If a well is
identified as a 24-hour operating type, then the cell will be red only if the runtime
falls above the specified lower limit. For a cycling well, it will be red if it is below
or above the specified limits. The cell will be yellow if the well has a high degree
of variation in its data, indicating that the SPC limits are too broad and that there
may be a problem with the operation of the well.
29
XSPOC User's Guide
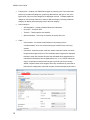
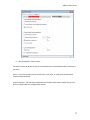
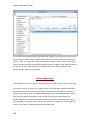
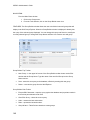
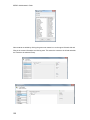
Group Status Views Setup Window
OVERVIEW: The Group Status Views dropdown list allows the user to create or customize UserDefined Views. User-Defined Views are specific to each user of the XSPOC system and will not
affect another user's settings or the server's settings on the same workstation.
NAVIGATION:
From the Group Status window:
1. Click on the Views menu.
2. From the Views sub-menu, click on Customize.
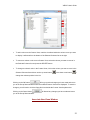
FEATURES: The Group Status Views window features two list boxes. The “Columns To Select”
list displays all of the columns that can be added to the Custom View. The “Selected Columns”
list displays all of the columns that are in the current Custom View. The Items in the Selected
Columns list are displayed left to right in the Custom View as you go down the list. For example in
our figure below, the "Enbld" column would be the far left column in our Custorm View while "Last
Good Scan" would be the far right column in our Custom View. The "Well" Column is required in
every view and is not displayed in the Selected Columns list. The "Well" column is displayed as a
fixed column on the left hand side of every view. All columns are listed by column name and not
by column alias.
30
XSPOC User's Guide
To add a column to the Custom View, mark the checkbox beside the column name you want
to display. It will transfer to the bottom of the Selected Columns list on the right
To remove a column on the current Custom View, select the column you want to remove in
the Selected Columns list and press the DELETE button.
To change a column's order in the Custom View, click on the column you want to move in the
Selected Columns list and then use the up arrow button
or the down arrow button
to
change the columns position in the list.
Clicking on the OK button
will let you preview changes you have made and return
you to the Group Status window where the modified Custom View will be displayed. To save the
changes, you will need to click the floppy disk icon beside the Current View dropdown box.
Clicking on the Cancel button
will discard any changes you have made and return
you to the Group Status window.
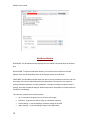
Associate User Views Window
31
XSPOC User's Guide
OVERVIEW: The Associate User Views dialog box allows the user to associate Custom Views
with a Well Group. Custom Views on this dialog box are previously saved User-Defined and
Administrator-Defined Views.
NAVIGATION:
From the Group Status window:
1. Click on the Views menu.
2. Click on the Associate User Views menu item.
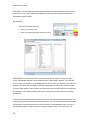
FEATURES: The Choose View combo box displays the names of previously saved Custom
Views. Administrator-Defined Custom Views have the "(Global View)" identifier. You must first
save a Custom View before it will be displayed in the Choose View list. Choosing a View from the
Choose View combo box will display all the Well Groups that use that view in a bold font and a
check mark will appear in the box next to the Well Group name. Well Groups that are associated
with another Custom View will display that Custom View name in parenthesis next to the Well
Group name.
To associate a Well Group with a Custom View, choose the Custom View from the Choose View
combo box and then check the box next the Well Group. If you choose a Well Group that already
has a Custom View association then the new association will be established when you click on
the OK button. Make as many changes as necessary before clicking on the OK button. The
32
XSPOC User's Guide
Select All and Unselect All buttons allow you to quickly associate or unassociate wells to a
particular Custom View. You can not associate a Parent Group with a Custom View. So in our
figure to the right, you cannot choose to associate a Custom View with the XDIAG Parent Group
but you can associate any of the Well Groups below the XDIAG Parent Group with a particular
Custom View. No changes are saved until you click the OK button. If you do not want to save
any of your changes then click on the Cancel button. Clicking on the OK or Cancel button will
close the dialog box.
Making Custom View associations effects the way the Group Status window is displayed to you.
When you select a Well Group from the Well Group tree, XSPOC will first check for an associated
Custom View. If XSPOC does not find an associated Custom View then it will check for an
associated Global View. If XSPOC does not find an associated Global View then it will check for
the last used Custom View which would have been selected from the Views menu on the Group
Status Window. If XSPOC does not find the last used Custom View then XSPOC will use the
XSPOC Default View to display Well information in the Group Status Window. If you are viewing
a Well Group that has an associated Custom View in the Group Status Window, you can change
to another Custom View by selecting it from the Views menu. This Well Group will display the well
information using the selected Custom View until you either select the another Custom View from
the views menu or navigate to another Well Group and then return to the previous Well Group
causing XSPOC to display the well information with the associated Custom View.
Remember that the Group Status Current View window displays the well information in the
following order:
Associated Custom View -> Global Custom View -> Last Used View -> XSPOC Default View
Checking the Auto Refresh button
will refresh the current view on a one minute
interval.
Group Alarm History
OVERVIEW: The Group Alarm History Window displays a list of the most recent alarms for the
selected Well Group.
NAVIGATION:
From the Main Client window:
1. Click on the Group tab.
33
XSPOC User's Guide
2. From the Status menu item, choose Alarm History in the Analysis Section.
FEATURES: The Refresh Interval (Minutes)
lets the user select
an interval of 1- 60 minutes in which this window is refreshed for the chosen Well Group. The
History allows the user to select a pre-defined interval of 1 Hour, 1 Day, 1 Week, 1 Month or 1
Year which is the length of time of history on the alarms.
Group Well Test History
OVERVIEW: The Group Well Test History Window
displays a list of the most recent well tests for the
selected Well Group.
FEATURES: The Well Test History window allows the user to view Well Test information that has
been entered manually or automatically via data imports. Well Tests can be entered from this
screen as well. The data range can be modified by clicking on the data range in the upper left
corener of the window. Well Tests can be approved by the user by marking the box in the
Approved column for the appropriate test.
Group Meter History
OVERVIEW: The Group Meter History Window
displays a list of the most meter readings. The
Group Meter Section has its own toolbar, where a
34
XSPOC User's Guide
use can select the columns desired, select report options and time frames and select type of
meter: Gas, Injection, or Production.
Features: The Meter History window allows users to enter, approve, and review Gas, Injection,
and Production meter volumes. Meter volumes can also be entered automatically through data
import tasks set up by Theta.
Well Information
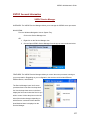
Card Viewer Window
OVERVIEW: The Card Viewer window allows you to view dynograph surface and downhole
cards, and to view the XDIAG analysis output. It can also be used to collect cards and to change
certain controller setpoints. When you change from one well to another in the Well Group Tree,
the window is automatically updated with information for the new well.
NAVIGATION:
From the Main Client window:
1. Click on the Well menu.
2. Click on the Card Viewer menu icon.
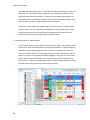
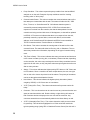
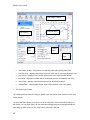
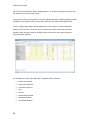
FEATURES: The Card Viewer Window has six sections, each with its own purpose.
35
XSPOC User's Guide
Card Viewer Toolbar
Card Library
Card Plot Area
Input
Output
Data
Data
Analysis
Data
Card Viewer toolbar – utility buttons for collecting cards and exporting them to file
Card Plot Area – displays selected dynamometer cards and the calculated downhole card
Card Library – displays a list of stored dynamometer cards, with time/date stamps
Input Data – displays input data used in the analysis (sources are database and POC)
Output Data – displays calculated parameters from the XDIAG analysis
Analysis Data – displays plain English report of the condition of the entire system
1. The Card Viewer Toolbar
The following buttons and menus help you gather cards and perform other functions on the Card
Viewer Screen.
The Get Card button allows you to select one of the cards from various card buffers that are on
the device. The one shown here is for the Lufkin Well manager and yours may appear different
depending on which device you are using to store cards at the well site.
36
XSPOC User's Guide
Current - data from latest stoke.
Startup - the first card when pump was
last started.
Pump Off/ ShutDown - the last card
before Pump was last turned off.
PO/ShutDown Buffer - gets the last
several strokes prior to the shutdown
condition.
Prev SD/PO Buffer – data from the last several cards drawn at the end of the
previous cycle
Standard – data from a manually initiated card collect (done by selecting the
feature through the controller’s keypad)
Startup (No MPT) – data from the very first stroke when the starts up (no
minimum pump strokes)
Sample Live Strokes - pulls card for the next 15 strokes (not available on all POC
types).
The XDIAG button allows you to run analysis on the currently selected card in the
card library.
The Email button allows you to send the card to Theta Oilfield Services, or other
receipients of your choosing, if you already have a mail server defined in XSPOC.
The Report button displays a print preview of the Well Analysis report. You have the
option of sending this report to the printer or to save it as a PDF.
The Idle Time button displays the Idle Time dialogue box which allows you to view and
set the Idle Time on the controller for the currently selected well.
37
XSPOC User's Guide
In addition to these buttons and menus on the Toolbar, if you right click on a blank area of the
Toolbar you will get these following functions that let you change the way the Toolbar is
displayed.
Menu position allows you to anchor the Toolbar to
different positions on the screen.
Text Only will only display the text portion of the Toolbar
buttons instead of the defauly display which is text with icons.
2. Card Plot Area
When first opened, the Card Plot Area displays the selected
surface card and if available the downhole card for the well
selected from the Well Groups Explorer on the left side of the
Main Client window.The cards displayed in the plot area are
indicated by a small, colored box just to the left of the Time/Date
stamp of the cards listed in the Card Library. The color of the
box next to each Time/Date Stamp for the card matches the
graph color in the Card Plot area so you can distinguish which
plot belongs to a particular card.
3. Card Plot Area Customization Menu
The display of the Card Plot can be customized by right-clicking
anywhere in the plot to open the customization menu which is
shown to the right. These settings are retained based on the last
time you used the card viewer, so you do not need to set these
every time you use the client.
A brief description of each menu item follows:
Clear All - clears the Card Plot Area.
Clear All Except Current – clears all cards except the
last one displayed.
Copy To Clipboard – copies to the computer’s
clipboard so it can be pasted to an image editing
program, word processor, or some other software.
38
XSPOC User's Guide
Print - prints currently displayed card.
Overplot Retrieved Cards – allows the next retrieved card to overplot in the card
area.
Show POC Downhole Card - displays the POC Downhole card.
View Downhole Card - displays the calculated downhole card from XDIAG
analysis.
View Predicted Card - displays the RODSTAR predicted surface card.
View Load Limits - displays the load limits set for this well.
View Set Points - displays the set points for this well.
View Legend - displays the color and names of all the visible cards.
Show Graph Settings – opens the Tee Chart Editor dialogue box allowing the
user to customize card plot area settings (has no effect on card data)
Torque Analysis – view Torque Analysis on Current Card
Card Selection - indicates which cards are automatically displayed when the card
viewer is started or a different well is selected from the Well Groups Explorer.
o
Last - is the most recent card.
o
Last and PO - is the most recent card and the most recent pump-off
card.
Card Amount – Select number of cards or all cards available.
Show Grid Lines - displays Card Plot Area grid lines.
Full Screen - enlarges the graph to a full screen for better detail. Toggle the
check mark to enlarge the plot or to restore to normal size.
4. Card Library
The Card Library is a list of cards collected for the currently selected well. In this figure,
you see a report of how many cards are in the Card Libray for each well. The colored
boxes to the left of the Time/Date stamp of each card indicate that these are the
particular cards being displayed (and represents the color of the card in the graph).
XSPOC runs a task once per day to collect and analyze cards. This time is configurable,
but is typically run in the early morning hours between 2am and 6am. If the well runs 24
hours per day, XSPOC will collect only a single “Current” card, since the Startup and
Shutdown cards for this well will often be quite old and not pertinent to how the well is
currently operating. If the well runs less than 24 hours per day, XSPOC will collect both
the Startup and Shutdown cards. Although configurable, the system will only analyze the
Startup cards since this is normally most representative of how the well normally runs.
39
XSPOC User's Guide
Date is the date and time (24 hour format) of when the card was collected.
Type
o
PO/SD represents cards stored when pump was last turned off. The card
collected is the most recent pump-off/shutdown card stored by the POC at the
time of collection. The Lufkin Well
Manager will also have something like
D-Reason where the reason can be things
like Fillage.
o
Startup represents cards stored when the
pump first started up. The card collected is the most recent start-up card stored
by the POC at the time of collection.
o
Current represent cards collected while the well was pumping at the time of
collection.
When you right-click in the Card Library area a menu appears that allows you to do the following
actions:
Remove – removes any selected cards from the Card Plot area.
Delete - permanently removes the selected cards from the Card Library.
Selecting the card and pressing the Delete button on the keyboard will also allow
you to permanently remove the card. You will be asked to confirm deletion.
Save will mark that card to not be deleted after the standard 30 - 60 days. The XSPOC
administrator sets the duration of time to keep cards before deleting them. When a card
is marked to be saved, a floppy disk icon will be visible next to the card type. To toggle
the card back to regular status, right-click on the card and click on the save option again.
Export Card to File – will allow you to export the card(s) as an XDIAG Dyn file or a Lufkin
date file. You can select Current, Selected, or All cards.
Dyno Note - allows a note to be made for that card. Selecting this option opens a dialog box
where you can create, edit, or delete notes for that card. These dyno notes are visible from the
Well Notes screen.
5. Input Data
The Input Data for the selected well and the selected card is obtained from information
stored in the database. This information is collected from user input and from the POC.
40
Runtime (Hrs)
SPM
XSPOC User's Guide
Str. Length ('')
Pmp Diam ('')
Pmp Depth (ft)
Tst Date
Tst Gas (msfd)
Tst Oil (bpd)
Tst Water (bpd)
Tst Gross (bpd)
SurCap@24 (bpd)
Pumping Unit
Cycles, Yest
Idle Time (min) can be changed by clicking the button next and entering new idle
time values. You will be prompted for the control password, if it has not been
entered already during the session.
6. Output Data
The Output Data for the selected well and the selected card displays values calculated by
XDIAG using the input data and surface card. Not all values appear on all controllers.
DH Stroke ('')
DH Cap@24 (bpd)
DH Cap@RT (bpd)
DH Cap@RT, Fillage
Pump Efficiency (%)
Fluid Load (lbs)
Buoyant Rod Weight (lbs)
Dry Rod Weight (lbs)
Pump Friction Load (lbs)
PO Fluid Load (lbs)
Inf Prd. Today (bpd)
Inf Prd. (bpd)
SAM Fillage Setpoint - %
SAM Fillage - %
7. Analysis Data
41
XSPOC User's Guide
The Analysis Data box is a description of the condition of the rod pumped system as determined
from the selected surface card. It explains what is happening at the pump at the time of the
selected card collection, provides information on equipment that is overloaded, and lists possible
sources of error within the data and corrections that may have been made.
The text in this box constitutes the second page of the analysis report, which may be opened by
clicking the Report button in the Card Viewer Toolbar.
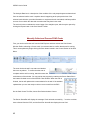
Manually Collect and Process DYNO Cards
First, you need to select the well from the Well Explorer and then activate the Card Viewer
Window. Before collecting a Current card, it is recommended to confirm that the well is running.
This is accomplished by single-clicking the Scan button located in the Control Section of the Well
Menu.
The scan checks the well’s run status and whether
there are any alarms. To confirm that the scan is
complete and the well is running, watch the status bar
at the bottom of the window. You can monitor the progress by watching the Server Status Bar in
the bottom left-hand corner of the XSPOC Client window. When the scan is
finished, the bar will update with current statistics for the well. If the statistics
updated then you are now ready to collect a current card from the POC.
On the Card Viewer Tool Bar, choose Get Card and select Current.
The Server Status Bar will display the message “Card retrieved successfully…” once the card has
been collected from the POC, and the Card Plot Area will then display the new Card.
42
XSPOC User's Guide
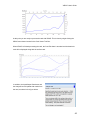
At this point you are ready to process the card with XDIAG. This is done by single-clicking the
XDIAG menu button located in the Card Viewer Tool Bar.
When XDIAG is finished processing the card, the Card Plot Area is rescaled and the downhole
card will be displayed along with the surface card.
In addition, the Input/Output Data boxes and
the Analysis box will update with results from
the card, as shown in the figure below.
43
XSPOC User's Guide
After processing the dynamometer card, you can print the analysis
report, by single-clicking the Report button.
This opens the report preview window and the report can be printed as shown in section entitled
"Printing Reports".
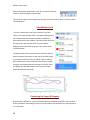
View Multiple Cards
To do this, double-click on the card of interest in the Card
Library. The newly selected surface card will be displayed and
the downhole card and predicted card will be displayed, if
these options have been enabled. This first selected card is the
Primary card for the Card Plot Area. Each card will be
displayed in the color shown in the box just to the left of the
Time/Date stamp.
A displayed card can be removed from the Card Plot Area by
double-clicking a second time on that card in the Card Library.
If you double-click the Primary (or original) card for clearing,
then all cards will be cleared from the Card Plot Area. Singleclicking a card already selected, will bring the card into focus
and display the data and analysis for the card in the Input,
Output and Analysis Data areas.
Positioning the Pump-Off Setpoint
Determining the position for a pump-off setpoint has been simplified by XSPOC. This procedure
works quite well for minimizing the amount of fluid pound the well experiences, if gas interference
is not a problem.
44
XSPOC User's Guide
1. Select a pump-off/shutdown card for display.
2. Run XDIAG on the pump-off/shutdown card.
3. Select a start-up card from the same day, if possible, and double-click on it. Both cards
should now be displayed. The Card Plot Area should have the View POC Downhole Card
and View Setpoints options enabled from the Card Plot Area’s right-click pop-up menu (a
check mark will be displayed next to the menu option if it is enabled).
4. Review the analysis of the pump-off card and determine what the fillage is for the pump,
during the shut-down. For example, we will use 54%, which can be considered severe.
5. To move a setpoint to a more favorable position and increase the shut-down fillage to
around 75-80%, some simple math and possibly some trial-and-error is needed. The
pump is at 54% fillage, so we want to increase that to 75-80%. The math is as follows:
(75-54) / (100-54) = 0.46, so we need to move the setpoint 46% of the way towards a full
pump.
6. Currently, the setpoint is around the 41% mark (on the horizontal scale at the top of the
Card Plot Area). Moving horizontally across to the full card, we intersect the downstroke
portion of the full card at approximately 77%.
7. Next, we take (77%-41%) * 0.46 = 17% and add the 17% to the original 41%, which gives
us 58% on the top horizontal scale.
8. The next step is to place the cursor directly over the setpoint and then click-and-drag the
setpoint to the new position. The scale in the upper left hand corner will give you the
position, in percentage both vertically and horizontally. The goal is to have the setpoint at
the same vertical percentage (29% in this example) and the horizontal percentage at
58% when you release the mouse key.
9. At this point, XSPOC will prompt you to confirm that you are writing a new setpoint to the
POC.
10. Click the “Yes” button to continue the write command, and then you will receive a
message confirming that the parameter was successfully changed.
11. You are not finished! The well should be monitored for fillage during the fluid pound for
the next day or two, to ensure that the new setpoint is in the correct position.
POC Trends Window
OVERVIEW: The Controller Trends window allows you to view trends based on data stored in the
Pump Off Controller (POC).
NAVIGATION:
45
XSPOC User's Guide
From the Main Client window:
1. Click on the Well menu.
2. From the Analysis Section select POC Trends.
FEATURES: The POC Trends window has a Controller Trends tab, and a Real Time Trends tab.
a Valve Check tab (SAM only), and a Plot Area.
The Controller Trends tab allows you to view the historical data stored in the controller as trend
lines in the plot area. This data is stored in the controller and not in the XSPOC database. To
trend the data in the controller, double-click the trend item in the Controller Trends list. The color
of the selected trend type corresponds to the color of the trend line. For wells that have Lufkin
SAM Controllers, you will see a Configurable Register Logs section on this tab. This allows you to
see any register logs that were configured at the controller. Clicking on the Get Available Logs
button will refresh this list of logs from the controller, which needs to be done after any register
log has been set up to store trend information.
The Real Time POC Trends tab allows you to view real time controller data as trend lines in the
plot area. XSPOC will retrieve the desired real-time data at fixed intervals and will display the
corresponding data in the graph. This data comes from the controller and is not stored in the
XSPOC database or in the controller, so once the window is closed all data is lost. To trend the
real time data in the controller, select the trend item from the drop-down-list in the Real Time
Trends panel. The trend items you select are added to the list below the drop-down-list. Checking
46
XSPOC User's Guide
the Real Time Trend Item in the list makes it active. When you click on the Start button the plot
area will start to show the real time trend data. The legend below the plot area allows you to
identify which trend line belongs to the Real Time Trend Item that is activated. You can modify
the interval by clicking on the Interval drop down and selecting a new time interval and you can
modify the Time Span by clicking on the Time Span drop down and selecting a new Time Span.
The Interval relates to how often it samples data from the controller while Time Span relates to
the X-Axis of the graph.
On the SAM controller only, a third tab appears which allows you to retrieve any Valve Check
plots that have been stored in the controller. In order for these to be available, someone has to
save the plots at the well during a valve check operation. The SAM has two different buffers that
can be retrieved, the reference and the working. First select the type of buffer to retrieve, then
click on the Get Values button to pull the information. Once the information is collected, it will not
only display the plot, but it will also display the various marking which were made at the well
during the valve check, as well as the calculated leakage based on the calculations done in the
SAM. These plots are saved in the history until someone deletes them. The plots are deleted by
clicking on the date of the valve check, and then hitting the Delete key on the keyboard.
History Graph Window
47
XSPOC User's Guide
OVERVIEW: The History Graph Window displays trended well analysis data, controller data,
facility data, well test data, well failures data and event notes for the selected well.
NAVIGATION:
From the Main Client window:
1. Click on the Well menu.
2. From the Graphs sub-menu, click on History Graph.
FEATURES: The Data History Graph window has a Graph Explorer on the right side of the
window and a Graph Plot Area. The Graph Explorer contains three areas: Date, Trends, and
Graph Properties. The Date area controls the X-Axis and determines the inclusive dates that are
displayed on the plot. The Trends area controls the Y-Axis and determines what values are
displayed on the plot. The Graph Properties allows you to define 4 different plot scale areas that
are simultaneously displayed on the plot area.
The Date area controls the range of dates within which all of the graphs will display.
Start Date is used on the leftmost most part of graph. (earliest date)
End Date is the date used on the right most part of the graph (latest date)
Days is a specified amount of days that the user types in or chooses from the drop down
list of 30, 60, 90
Click Apply to activate changes that are made in this area to the graphs on the right.
48
XSPOC User's Guide
Trends - There are seven different groups of trends:
Analysis - displays analysis values calculated by XDIAG.
Controller - displays raw data sent from controller. The trend in this group changes
according to the type of controller being trended.
Facility – displays trend lines from facilities.
Well Test - displays well test values.
Well Failures – displays well failures if they have been
entered into the system.
Events - displays notes of a particular event type that was
created for this well.
Each trend category contains trends that will display on a graph in
the Graph Plot Area. To access these trends, click on the plus sign
next to the category folder. Trend names will appear for all trend
lines for which data is available in the date range specified. Rightclicking a category folder will display all available trends for that
category, which may be selected or unselected by toggling the
check mark as shown to the right. Deselecting trends will hide them
from the list. Double-clicking a trend in the Trends explorer pane will
display or hide that trend on a graph in the Graph Plot Area. If a
trend is being displayed on a graph, then there will be a graph icon
displayed next to the trend name in the Trends explorer panel.
XSPOC Client stores each user’s settings for commonly used
trends; however, one must be logged in to use his/her default settings.
Graph Properties allows the user to add or remove graph
areas within the Graph Plot Area. You can have up to 4
graphing areas within the Graph Plot Area. The Graph
drop down list shows you how many graph areas are
currently defined. There will always be at least one
graphing area within the Graph Plot Area and you cannot
remove Graph 1. To add another graph, click on the Add
button and another graphing area will be added to the
49
XSPOC User's Guide
Graph Plot Area. The Trends grid will display the trend lines that are currently assigned to the
graph with corresponding trend color for the graph selected in the Graph drop down list.
Removing a graph with trends will also remove those trends from the Graph Plot Area.
The Graph Plot Area always contains at least one graph
but can also be divided into four separate areas so that
trends can be viewed using their own separate value
axis. Controller and Analysis Trends display as line
graphs with points by default. Moving the mouse cursor
over a point on a trend shows the Date and Value for that point.
Administrators have the option of deleting or changing a value point by Shift-Click on the point of
interest and then the Administrator is presented with a dialog box to make those changes as
shown to the left. Beware that those changes are propagated back to the XSPOC Database.
Event trends are shown as small dots along the bottom of the graph with a small tooltip window
that is displayed above every point with the Event text. Also moving the mouse cursor over a
point on the graph will display the event text (or Well Note) in another tooltip. In addition, the
“Show Text” option can be chosen from the menu that appears when one right-clicks on the
graph. When this option is selected, a small tooltip window will appear above every point and
displaying the text for that event. These tooltip windows can be moved by clicking on them and
dragging them to their desired location.
The History Graph supports views. After setting up
the plot area you might want to view this data at a
later time and instead of going through all of these
steps each time, you can just save all of this work as
a view. These views are unique to each user. An
XPSPOC administrator can also set up global views
for all users to see and use. User’s can manage their own views by creating, changing, or
deleting views but they cannot modify or delete global views. XSPOC Administrators can create,
save, and delete global views.
USAGE:
1. Adding a Trend to the Plot Area
a. Open up one of the Trend Categories
to find the trend you want to view.
50
XSPOC User's Guide
b. Double-click on the Trend you want to add to the plot area.
c.
You can also right click on a Trend and choose which plot area to add it to.
2. Moving a Trend to another graph.
a. Right-click on the trend name you want to move.
b. From the popup menu choose the number of the
graph you want the trend to be on.
c.
The currently selected trend line’s graph will have a
check mark next to it.
d. Choose any of the other graphs that you have set
up from step 2 above.
3. Setting up and Displaying Host Alarms
a. Right-click on the trend line for which you want to setup
or display alarms.
b. Click “Alarm Limits” to open the Host Alarm
configuration window. See Host Alarms Window topic
below.
c.
Show Alarm Limits toggles whether to display limits if they exist on the graph
containing the trend line.
4. Customizing the Plot Area
a. Right-click anywhere in the white space of the plot area.
b. Show Graph Settings Window allows the user to
customize the graph and trendline properties, display
data information on trend lines, and export trend data.
See the Graph Settings Window topic below.
c.
Clear – Clears the graph plot area.
d. Show Graph Settings – Accesses a TeeChart Editor
with all the graph settings.
e. Show Graph Data allows the user to view the trend line data points in a grid.
f.
Show Grid Lines toggles the display of the horizontal and vertical grid lines when this
option is chosen. This option displays a check mark next to the option when the grid
lines are set to display.
g. Show Text toggles the display of Event text on the grid when this option is chosen.
This option displays a check mark next to the option when the Event text is set to
display. If you don’t have a trend selected from the Events category then you will not
51
XSPOC User's Guide
see anything on the graph. You can move the tooltip window displaying the Event
text by clicking on the Event tooltip window and then dragging it to a new position on
the graph.
h. Views – Save, Save As, or Delete views
i.
Save The Graph To File – Saves graph to a file in a selected format that you choose.
j.
Print – Prints the graph plot area to a selected printer.
5. Saving a View.
a. After you have customized the Plot Area, right-click
anywhere in the white space of the plot area.
b. Select View and then either Save or Save As to
save your view as a XSPOC view. Save will save the
current view if it is not a global view. The current
view is the one with the check mark besides its
name. Save As will allow you to save the selected view with a different name.
6. Deleting a View
a. Right-click anywhere in the white space of the Plot Area and select View from the
popup menu.
b. Ensure the view you want to delete has a check mark next to it. Users will be unable
to delete any global views set up by administrators
c.
7.
Select Delete.
Controlling the View Modes in the Graph Plot Area.
a.
You can “zoom” and scroll the data in the Graph Plot area using the controls below.
b.
Zoom (view a smaller time frame in the plot area) – hold the CTRL key while clicking
and dragging from upper left to lower right in the graph plot area. Zoom out by
holding the CTRL key while clicking and dragging from lower right to upper left
(reverse original action).
c.
Scroll – click in the graph plot area and drag to the left or the right.
8. Save Graph Plot Area to a file. Selecting Save This
Graph To File will present you with many options
to save this graph to a disk file. This will not save
the graph as a view in XSPOC, but is used if you
want to use the graph or its data in other
applications.
52
XSPOC User's Guide
a. The Picture tab allows you to save the graph as a Bitmap, Metafile, JPEG, PNG, GIF,
TIFF, VML (HTM), SVG, PDF, Post Script, XAMl (WPF)or PFLEX (Flash)picture file.
b. The Native tab allows you to save the graph as a TeeChart file for importing to other
programs that are using TeeChart
c.
The Data tab allows you to save the graph’s data as Text, XML, HTML Table or Excel
format.
d. The Theme Tab – allows the user to specify whether ChartBase64 Data (Tee Chart
Info) is included in the file, or allow the user to specify a desired file size.
a. Include Chart Base64 Data b. File Size – When checked displays file size.
Host Alarms Window
OVERVIEW: The Host Alarms Window allows the user to set a host alarm on a specific trend for
the selected well or the selected well group.
NAVIGATION:
From the History Graph window:
1. Right-Click on the trend line that you want to be alarmed.
2. From the Trend Line Popup-Menu, select Alarm Limits.
FEATURES: The settings may be applied to either the well in focus, by clicking the “Apply”
button or to the group in focus, by clicking the “Apply to Group” button. Clicking Cancel, closes
the window.
Alarms that are displayed in the Group Status are discussed in Group Status Section. The alarms
displayed here are generated in the controller; therefore all manufacturers of controllers have
their own specific alarms. In XSPOC, we have tried to use the manufacturer’s descriptions for the
alarms, and they are often abbreviated forms of the alarms listed here.
53
XSPOC User's Guide
1. Node is the name of the well selected in the Well Explorer.
2. Address is the register number for the alarm.
3. Priority describes the level of importance of announcing the occurrence of this alarm. For
instance, if a runtime alarm and cycle host alarm both are in alarm, the one with the
lowest number will be displayed. Priority needs to set between 1 and 100. An alarm’s
priority will be ignored if this column is left blank.
4. Alarm Type determines how the limit value is derived.
a. None turns off calculation for that well's trend.
b. SPC automatically calculates host alarm values based on previous values. (See
How Does SPC Work? for further information).
c.
Discrete – Once selected allows the user to turn it on or off.
d. User Defined Limits allow static values to be inputted to determine the alarm. Lo
and High values, when exceeded, produce a warning alarm.
The alarm limits are then displayed on the Graph Plot Area as shown below (Show Alarm Limits
must be enabled).
Graph Settings Window
54
XSPOC User's Guide
OVERVIEW: The Graph Settings
Window allows the user to customize
the graph, display data information
on trend lines, and export trend data.
This is the built-in editing tool for our
TeeChart control.
NAVIGATION:
From the History Graph window:
1. Right-Click on the white
space in the plot area.
2. From the Popup-Menu,
select Show Graph Settings.
Export Data History Window
OVERVIEW: The Export Data History Window allows the user to export trend data.
NAVIGATION:
From the Data History Graph window:
1. Right-Click on the white space in the plot area.
2. From the Popup-Menu, select Save This Graph To File.
FEATURES: The Export Data History window allows you to take the current Graph Plot Area and
save the graphs as a picture file, a raw chart file, or as raw data.
1. The Picture tab allows you to save the graph in a variety of picture formats. After
selecting the format for the picture file, XSPOC will prompt you for a name and the
location to save this picture file.
55
XSPOC User's Guide
2. XSPOC uses the TeeChart control to display trend lines. The Native tab allows you to
save the current graph as a native TeeChart file.
3. The Data tab allows you to save the trended data as a Text, XML, HTML, or Excel file.
This allows you to import your data into a variety of programs and analyze or display the
data as needed. After selecting the exported file type, XSPOC will prompt you for a file
name and location to save this data file.
56
XSPOC User's Guide
4. The Theme Tab – This tab allows the user to select whether the chart’s Base64 data will
be included in the exported data. The user can also specify the desired file size.
Other Well Measurements Window
OVERVIEW: Allows the user to input or change well measurements that were gathered by hand
and have those measurements available for other windows like the History Graph. Please see the
topic in the Administrator Manual for setting up the different types of measurements.
NAVIGATION:
From the Main Client window:
1. Click on the Well menu.
2. Click on the Other Measurements menu item in the Analysis Section.
57
XSPOC User's Guide
FEATURES: Some users have a need to enter in measurements that are not gathered by the
system during a polling sequence and they do not want to enter in a full well test just to get one
value into their system. So our recommendation is to use this window to enter individual
measurements or to enter measurements that are not included on the production windows.
Selecting an
existing
measurement from
the grid will allow
the user to edit the
data for that
measurement in
the edit portion of
the screen. You
can also delete a
measurement by
selecting it in the
grid and then
clicking the Delete
button.
To add a new measurement to the currently selected well, click on the row below the column
headers and then fill in the fields
in the edit portion of the screen.
If there are numerous
measurements and the user
wants to only display one type
of measurement, then select
that type from the Filter drop
down list and the grid will only
display the chosen
measurement type.
58
XSPOC User's Guide
59
XSPOC User's Guide
External Data Query
OVERVIEW: Allows the user to view values from a data source such as Excel, Access, or Oracle
based on a query that the XSPOC Administrator defines. Please see the topic in the
Administrator Manual for Recent Well Tests Setup.
NAVIGATION:
From the Main Client window:
1. Click on the Well menu.
2. Click on the External Data Query menu item in the Analysis Section.
FEATURES: This screen is for information only and cannot be used to change any of the values
to the underlying data source. The values are displayed according to the query that the XSPOC
Administrator has defined and is useful in viewing information from other data sources outside of
the XSPOC database. As an example this is from the query that is setup in the example in the
Administrator’s manual.
Register Panel Window
OVERVIEW: The Register Panel Window displays the POC Registers. There are times when you
may wish to scan other registers besides the default registers provided by XSPOC in the
Setpoints Panel.
NAVIGATION:
From the Main Client window:
1. Click on the Well tab.
60
XSPOC User's Guide
2. From the Configuration Section of the Well tab, click on Register Panel, which
opens the window shown in the next figure.
.
FEATURES:
Use the Registers list to find the register address for the parameter or parameters you wish to
view. In the Address field, you can enter the number of the registers you want to collect from the
POC or you can select them from the list by clicking on the register. Non-Contiguous Registers
need to be separated by a comma, while
contiguous registers can be separated by a
hyphen. Once you have selected or entered the
registers you wish to view, click the Read button to
scan the POC and return the Register Description
and the Value stored in the POC which is
displayed in the Registers grid.
For a single register, just enter the entire number
(i.e. 41425).
For a range of registers, enter the first register
followed by a dash and then the last register (ex.
41425-41430).
61
XSPOC User's Guide
For various registers, enter the numbers separated by a coma followed by a space (ex. 41425,
41428, 41430).
You may also set this to continuous read for repetitive data collection, by checking the box,
Continuous Read. When performing a Continuous Read, you will be prompted for a time interval
that is defined in seconds.
To change the value listed in a register, double-click the cell in the Value column that
corresponds to the parameter to be changed. This puts the cell into edit mode and now you can
enter the value. Clicking the Write button will download the new value to the POC. If the register
can be changed then the value will be written to the register. Otherwise, XSPOC will display a
message stating this.
You can also save a list of registers as a group. After the register addresses are entered into the
Address field, enter in a valid Register Group name into the Register Groups field and then click
Save. The new group is saved and you now also have the option of deleting this group. Only
XSPOC Administrators can delete the global groups. Now you can bring up this new group
instead of having to find the correct registers each time.
If you should choose one of the Event Logs from the Registers list or from the predefined
Register Groups list, then that log is retrieved for you and displayed on the Logs tab as shown
below.
62
XSPOC User's Guide
How to Use Register Panel to make an All Call
Any device in XSPOC that has a radio address of 0 is considered an All Call device. An All Call
device will send a message through its assigned host radio and that message will be received by
and acted upon by all devices on that communication channel (provided the channel is
broadcasting over a Master Radio). This means that an All Call is a write function to each device
instead of a read or status scan. If you have multiple and different devices on that communication
channel then this can cause a problems if the All Call device’s memory map is different then other
devices on the same channel. Be sure that you investigate fully the implications of making a call
on differening devices on the same channel, as once the message is sent it is immediately acted
upon by all devices on the channel. If you don’t have an All Call well then create a new well
naming it something like All Call, select the type of device you want to write to (remember that an
All Call will not be limited to just those controllers on the channel but will communicate to all
devices on the channel), put 0 as the Address, and choose the appropriate Communication
Channel. We recommend that you leave this well disabled except for those times when you will
be issuing an All Call.
First you need to identify which register you want to write to all the devices on this channel.
Choose a well in the Well Explorer that is on the same communications channel as your All Call
well. Open the Register Panel and write to that register with the value.
Now, Choose the All Call well and in the Register Panel right click on value and choose Last
Value and then click on the Write button. You may want to verify with several wells that the value
was changed for the register that you wanted to change.
Be careful in issuing an All Call on certain registers. For instance issuing an All Call whether
through the Register Panel for the RTU Address will change all RTU Addresses in the field to the
same Address. So if you make a mistake and accidentally assign a well with a RTU Address of 0
in the Well Configuration screen, do not go to the Register Panel, pull up the register address for
RTU Address in the controller and attempt to change the RTU Address by issuing a Write. This
will effectively change all Addresses in the remote RTU’s to the same Address.
Setpoints Window
OVERVIEW: The Setpoints Window displays POC registers by groups and the values that are
currently in the register along with the value saved in the database. The user can change and
update the values in the enabled registers through this window. This allows users to save
63
XSPOC User's Guide
specific register values to the database in the event that these registers need to be restored at a
later date.
NAVIGATION:
From the Main Client window:
1. Click on the Well menu.
2. From the Control Section of the Well menu , click on Setpoints.
FEATURES: When this screen is displayed, you will see nothing in the grid until you select a
group from the left side of the screen. When a group is selected then the registers that have been
enabled will be displayed with their current database values in the Backup column. When you
select Read Device then the Device Value from the selected controller will fill in the Device Value
column.
On The Setpoint Toolbar:
64
Backup setpoints – saves the POC Values to the XSPOC Database.
XSPOC User's Guide
Update Device - writes the values in the database that are different from the
(POC)/DeviceValue to the POC for this group. These differences are highlighted in a
greenish color. (See above picture)
Synchronize All – will either send all
the database values to the device or
update the database values from the
device for all registers in all of the
groups defined by the XSPOC Administrator.
Configuration - displays the Setpoint Group Configuration window allowing the user to
create and modify setpoint groups.
In the Group Configuration Window:
Setpoint Groups can be added, modified, or deleted.
Address represents the register address for that parameter.
Description explains what the parameter value represents.
Setpoint Group respresents which Setpoint Group each address is assigned to.
You can change a parameter in the POC, by double-clicking on the cell in the Backup column that
corresponds to the register you wish to change. This action puts the cell in edit mode, where you
can enter the new value. You may change several values in this manner prior to writing them to
65
XSPOC User's Guide
the POC. Each new DB Value will be highlighted green. To write the change(s) to the POC, click
the Update Device button on the toolbar.
There are times when you may wish to scan other registers besides the default registers provided
by XSPOC in the Setpoints Panel. Please refer to the topic below about the Register Panel.
There is a Malfunctions/Alarms tab that displays when the controller is a Lufkin SAM, MPC,
Sys60 or PCP Controller. This allows user to configure these POC malfuctions and alarms
setpoints. When this tab is selected, XSPOC queries the device for the current information
concerning these setpoints.
On the Malfunction Tab (Lufkin SAM, MPC, Sys60 and PCP Controllers):
66
Consecutive Allowed
Consecutive Occurred
Cumulative Occurred
Limit
Present
Normal Mode Enabled
Host Mode Enabled
Timed Mode Enabled
XSPOC User's Guide
Well Configuration Window
OVERVIEW: The Well Configuration Window displays well data for the selected well. This
window allows you to make changes to a Well's Controller Information, XSPOC Groups,
Production Parameters, Rod String Configuration, Pumping Unit Data, Expert Corrections
Settings, and Energy
Management Settings.
NAVIGATION:
From the Main
Client window:
1. Click on
the Well menu.
2. From the
Configuration
Section of the Well
menu, click on Well
Config.
FEATURES: The Well
Configuration window contains a tabbed section that allows you to configure various aspects of
the selected well and a wellbore picture.
The tabs included on this window are:
Controller
Surface Equipment
Downhole Equipment
o
Rods
o
Casing
o
Tubing
o
Perforations
o
Pump
Analysis Options
Alarm Actions
67
XSPOC User's Guide
1. Well Configuration: Controller
The Controller Tab contains information about the properties, description and equipment
of a well's controller and allows the user to edit the controller's information. The
information from this section is used to create the XDIAG (XDG) files.
On the Well Config tool bar the user can save and cancel changes, and can Download
Equipment to the SAM, or Upload Equipment from the SAM.
Controller
o
Type - the
manufacturer
and model of the
Controller at the
well.
o
Address - the number that uniquely identifies the controller on the given
communication channel. Be aware that assigning a 0 to the Address
68
XSPOC User's Guide
creates an All Call well, which means the host rado will send a message
that will be acted upon by all wells on this communication channel.
o
Server/Port/Description - identifies the communication channel for this
controller. The drop down box will have a selection of available ports for
you to choose from. Setting these up is an administrator function.
Group
o
Route – a list of well groups that is commonly used to identify the
persons for operating the wells.
o
Dialer / Email Group – displays the contact groups of which the well is a
member
o
AdHocGroup1, AdHocGroup2, and AdHocGroup3 are used to assign
wells to user defined well groups. The groupings are commonly used by
the customer to further define groups based on organization, geography,
facilities, or any other criteria.
o
Well ID – Usually is a unique identifier that is used by other systems to
identify this controller.
Well Type - denotes the normal operation of the well. The state indicated here
will have an effect on alarming and runtime statistics.
o
Normal is the typical mode of a pump-off controller where the well cycles
between on and off states automatically.
o
24hr, Pumped-Off denotes when a well is intentionally operating 24
hours a day in a Pump-Off state. This mode is often used in heavy oil
applications.
o
24hr, Not Pumped-Off denotes when a well is intentionally operating 24
hours a day and is not pumped-off. This mode may be the case when
there is more fluid production available than the pump has capacity but
no further action is planned.
o
Variable Speed is used when a variable speed controller is used to
control the speed of the well.
Map Info
o
Latitude – latitude coordinate for this controller
o
Longitude – longitude coordinate for this controller
2. Well Configuration: Surface Equipment
69
XSPOC User's Guide
Pumping Unit - contains over 5000 different types of pumping units. These have been
broken up into about 60 categories, grouped by Manufacturer and type of unit. In the
figure below, only one of the categories are displayed at a time. To display additional
categories, use the drop down box to select a different category. Selecting a different
category will display all the pumping units for the new category.
Unit Information –
o
API Designation – Industry standard dimension information
o
Unit name – Common name
o
Theta ID – Theta’s specific Unit Identifier
o
Other Information – Used only if necessary to specify other info
Crank –
o
Crank rotation - the default Crank Rotation for all pumping units is
counterclockwise, so be sure to select the proper rotation for the unit being
entered.
o
Crank hole - select the proper crank hole, where crank hole number one is the
longest stroke length for the unit. The calculated stroke length will be displayed
beside the crank hole number. Because the calculated stroke length based on
manufacturer dimensions can be slightly different (1” to 3”), XSPOC allows the
entry of a separate measured stroke length, to provide a bit more accuracy.
XDIAG compares these stroke lengths, and if they are different by more than a
few inches, the diagnostics output will complain, and this discrepancy should be
70
XSPOC User's Guide
addressed.
o
Measured Stroke Length – measured stroke length (if different from calculated
stroke length).
Counterbalance – counterbalance settings will change depending on the type of Pumping
Unit that is selected. For Air Balanced Units the Air Tank Pressure is measured at the
bottom (psig). All other units will display the options presented in the figure below
o
Unknown – select this option if the CB moment is unknown
o
Existing MCM (M in-lbs) – Select this option to enter the CB moment in lbs
o
Counterbalance Effect – Select this option if the Effect and Crank Angle are
known
o
Use XBAL Information – Select this option only if the crank and weight data has
been run through XBAL and imported into XSPOC
Motor - The Motor Setting box will activate when a high slip motor type (i.e. EconoPac II
ODP) is selected.
o
Motor Type – the motor type installed on the well
o
Motor Size – the motor size installed on the well
o
Motor Setting – Used only ifa high-slip motor is selected
o
Electricity cost ($kwh) – used in calculating energy expense based on well
design and operation
o
Power meter – one-way or two-way
4. Well Configuration: Downhole Equipment
There are four tabs in this screen where the well's rods, casing, tubing and perforations
are entered. Each tab contains a grid which displays the equipment downhole. Each grid
has 4 buttons on the right side that aide in ordering, inserting and deleting the equipment.
On the Tubing tab, if the “Tubing anchored” box is not checked, the “Tubing anchor
depth” box will not be displayed.
The “Save” button which is located at the top right side of each screen, saves the data
which has been entered while the “Cancel” button will restore your information back to
the last saved data.
A. Rod Data Input -
71
XSPOC User's Guide
Rod string sections are entered starting at the top of the string and going down.
Drop down boxes provide the choices for rod grade and manufacturer, and Rod
Size Diameter is filled in when you select the size. The sum of the rod section
length must add up to within 50 feet of the pump depth entered in the Pump Data
section The control buttons on the left are for navigating between, and inserting
or deleting, rod sections.
To select a rod section, click on the number of the rod section. This activates the
navigation arrow buttons. You can move between sections using the arrow keys
on your keyboard, or the clicking the arrow keys on the left side of the display, or
clicking the number of the rod section. Clicking the Add a Rod button, will insert a
section at the bottom and will select this rod section. Clicking the Remove a Rod
button removes the selected section.
Steel rod service factor – assists in XSPOC’s diagnosis of Rod String
loading
Auto Calculate Rod-Tubing Friction – XDIAG will autocalculate tubing
friction based on a vertical model
72
XSPOC User's Guide
Rod-tubing friction – enter the value if it has been calculated by another
software
Total Rod Length – autocalculated value based on entered rod taper
data
Distance To Pump – difference between total string length and entered
pump depth value (if this value is larger than 50, the changes will not
save)
Pump –
Pump Depth – depth of the pump
Barrel Length – full length of pump barrel
Plunger Size – size of plunger
Pump Type – insert or tubing pump
B. Casing Input Data -
Casing sections are entered starting at the top of the wellbore and going down.
You can change the Diameter and Length of a casing section by selecting the
73
XSPOC User's Guide
appropriate cell in the grid and entering the value. The control buttons on the left
are for navigating between, and inserting or deleting casing sections.
To select a casing section, click on the number of the casing section. This
activates the navigation arrow buttons. You can move between sections using
the arrows on your keyboard or clicking the number of the rod section. Clicking
the Insert button, will insert a section at the bottom and will select this new casing
section. Clicking the Remove button removes the selected section.
C. Tubing Input Data
Tubing sections are entered starting at the top of the wellbore and going down.
You can change the Diameter and Length of a tubing section by selecting the
appropriate cell in the grid and entering the value.The control buttons on the left
are for navigating between, and inserting or removing tubing sections.
74
XSPOC User's Guide
To select a tubing section, click on the number of the tubing section. This
activates the navigation arrow buttons. You can move between sections using
the arrows on your keyboard or clicking the number of the rod section. Clicking
the Insert button, will insert a section at the bottom and will select this new tubing
section. Clicking the Remove button removes the selected section.
D. Perforation Input Data
Perforations are entered starting at the top of the perforated area and then
entering an interval for the perforated area. You can change the Depth, Interval,
Diameter, and Holes Per Ft of a perforated area by selecting the appropriate cell
in the grid and entering the value.The control buttons on the left are for
navigating between, and inserting or removing perforated areas.
To select a perforated area, click on the row of the area of interest. This activates
the navigation arrow buttons. You can move between areas using the arrows on
your keyboard or clicking the row of the area of interest. Clicking the Insert
button, will insert an area at the bottom and will select this new perforated area.
Clicking the Remove button removes the perforated area.
75
XSPOC User's Guide
5. Well Configuration: Analysis Options
The Analysis Options tab allows the user to individually configure various diagnostic
options related to automatic corrections.
Non-kinematic surface positions. Sensors are used to collect the load and position data
for POC’s. Theta has found that these sensors may be subject to error for various
reasons. Because understanding the mechanics behind this requires an in-depth
explanation, Theta recommends that “XDIAG auto correction” be selected, where
applicable.
XDIAG auto correction - lets XDIAG determine when the appropriate corrections
are needed.
Use positions from pumping unit kinematics - will force XDIAG to substitute
position data based on kinematics for position data from the POC.
Do not correct - disables any correction for this type of position data.
Phase-shifted surface positions. Configures how position data is corrected relative to top
of stroke problems. This error is normally caused when a position switch is used and the
top of stoke setting is inaccurate.
XDIAG auto correction - lets XDIAG determine when the appropriate corrections
are needed.
Adjust position phase by - is the number of milliseconds that the position data will
be changed relative to the load data.
Adjust top-of-stroke by - is the number of inches that the top of stroke will be
adjusted.
Do not correct - disables any correction for this type of position data.
Load Cell Adjustment . Alters the load cell value by the pounds indicated.
76
XSPOC User's Guide
6. Well Configuration: Alarm Actions
The Alarm Actions tab allows the user to set how alarms are communicated and the recipients of
the alarm.
Action – select how an alarm will be announced, by call, page, or email upon communication
failures and well shutdown.
Alarm Recipients – edit and select recipients from the Dialer and/or Email Contact Group. Click
Save or Cancel buttons to complete those actions.
77
XSPOC User's Guide
Well Notes Window
OVERVIEW: The Well Notes window displays User and XSPOC comments about the selected
well.
NAVIGATION: To open the Well Notes window, you must first select a Well from the Well
Explorer then click the Well Notes button in the Analysis section of the Well tab.
FEATURES: The Well Notes window allows the user to enter comments that receive a date and
time stamp, and can be trended along with other parameters. The notes are very useful for
tracking chemical treatments, hot-oiling treatments, a change in pumping unit speed, pump respacing, and other mechanical changes. Without these notes, interpretation of trended data can
be difficult or misleading.
The notes are grouped by the following events:
78
All - A note that could apply to any or all of the event types.
Comment - A general note that is simply for informative purposes.
Param Change - A note describing a parameter change in the POC.
Status Change - A note describing a change in the wells status.
XSPOC User's Guide
RTU Alarm – violations caught by the controller based on preset limits
Host Alarm – violations caught by XSPOC based on preset limits
Dyno Note – notes entered by user in the Card Viewer window
Well Config Change – A note that reflects a changes in the Well Config window.
Tech Note – user-entered notes from the Tech Note column in Group Status or in Well
Notes
Parameter changes are stored automatically by XSPOC, whenever you write a value to a POC
using the program (i.e. moving a Setpoint, changing the Idletime, etc.). The software will not allow
a user to enter a Param Change entry because it would duplicate an entry that has already been
created. You can, however, edit the existing parameter note to better reflect what you did.
The figure below shows the Well Notes window. The Events list allows you to select a note event
and this filters the notes grid view. This will become helpful as the database ages and automatic
comments, such as status changes, begin to accumulate.
The function of each column is:
Date: The date that applies to the note.
Note: Information of interest to a particular well.
Type: Category to which this notes applies.
UserID: The user who entered the note. The UserID information cannot be changed.
You can add a note by selecting the Note cell on the row with the star (*). The row highlighted
below shows the add row for the Well Notes grid.
79
XSPOC User's Guide
After entering the text of the note, XSPOC immediately stamps the note with the current date, and
labels the note as the selected note type (Comment or Tech Note).
To edit the date or time, click on the date and the field will activate and enable you to enter the
date and time or click the drop down arrow and use the calendar box (see figure below).
Users are allowed to enter two types of notes, Comment or Tech Note. All other note types are
assigned automatically by XSPOC based on where they originate.
80
XSPOC User's Guide
If the full text of a note is not already visible, hovering the mouse cursor over the Note field will
display the entire Note in a tooltip as shown below.
A note may be deleted by clicking just to the left of the date. A black triangle will display and the
entire row will be highlighted. Press the “delete” key on your keyboard, and a Delete Row
dialogue box will display. Select Yes to delete and no to cancel the action. You may delete more
than one row at a time by holding down the Shift key and highlighting the notes you want to
delete with the mouse or with the spacebar. (The user must have Admin rights to perform this
action.)
Well Status Window
OVERVIEW: The Well Status window allows you to get a quick overview of the status for the
currently selected well.
NAVIGATION: To open the Well Status window, you must first select a Well from the Well
Explorer.
From the Main Client window:
1. Click on the Well menu.
2. Click on the Well Status icon.
81
XSPOC User's Guide
FEATURES: The Well Status screen displays information about the POC, the Pumping Unit, and
the Wellbore. The Last Good Scan date and time are displayed in the upper left corner of this
window to let you know when the information displayed in this window was last updated.
Near the POC in this window, you will notice that there is information about the communications
status, the type of POC being used by this well, the RTU address for the POC, and the Run
Status at the time of the last good scan. The Well Status window also contains information about
the pumping unit: the API designation, Structural Loading, Gearbox Loading, SPM, and Stroke
Length. Runtime for Today and Yesterday are displayed as a percentage in the upper right corner
and any Alarms and Exceptions are reported right below the Runtime information. The Wellbore
information that is displayed includes the Tubing Pressure, Casing Pressure, Rod Loading, Pump
Fillage, Pump Depth, and Pump Type.
The Well Status Toolbar items for this screen include the Refresh, Action, Copy and Print
commands. The Action menu displayed to the right shows that you can perform a variety of
functions including Scan, Start Well, Shutdown Well and Idle Well. The Scan menu item will
82
XSPOC User's Guide
communicate with the POC to update information on this screen, while the Start, Shutdown and
Idle will change the running state for this well. The Refresh button on the toolbar only refreshes
this window’s information from the database while Scan refreshes the data from the POC.
Facility Information
Facility Status Window
OVERVIEW: The Facility Status window allows you to get a quick overview of any facilities,
including the communications status, and the status of any alarms at each facility. Facilities are
configurable nodes in XSPOC that allow you to pull in data from RTU’s, PLC’s, or any other
devices that use the Modbus or Allen-Bradley DF1 protocols.
NAVIGATION:
From the Main Client window:
1. Click on the Facilities menu.
2. Click on the Facility Status icon in the Analysis Section.
FEATURES: The Facility Status has fixed columns that show the name of the Facility, the Comm
status, whether the facility is Enabled (green) or disabled (red), Tag Count, Alarm Count and
Comments for the facility. Each facility has tags that correspond to registers within that facility and
their Description and Address define the tag. The Facility Status window shows whether the
facility has any tags that are currently in alarm, the value from the last scan, Units and the last
time that successful communications happened for each tag.
Facilities can be toggled between an enabled and disabled state
by right clicking on the Facility Name in the Well tree Group and
selecting the desired action.
83
XSPOC User's Guide
The Refresh button on the toolbar allows the user to refresh the data from the database. The
Auto Refresh option allows this form to be updated from the database at regular intervals. The
Reports option will provide a facility report. To manually scan the facility, make sure the facility is
chosen in the Well Explorer and then select the Scan button from the Main toolbar. To see the
results of this scan you will have to click on the refresh button. Another way to manually scan the
facility is to right-click the facility name in the Facility Status window and choose scan from the
popup menu. You can also set the comment by clicking in the comment box and typing the
comment.
Reports
OVERVIEW: The facility reports allow a presentation of facility data that is easy to print.
NAVIGATION:
From the Main Client window:
1. Click on the Facilities menu.
2. Click on Reports in the child window tool
bar and select the Facility Status Report.
FEATURES:
Status Report: Provides a printed output very similar to the Facility Status screen.
Frequently Asked Questions
1. Are errors that might be causing problems in the client logged anyplace?
Yes, there is a file in the directory where the xsClient has been installed that records any
errors that the client may generate. The file’s name is error.log. This file may be useful for
Theta to look at, and they may request that this file be e-mailed to them for review. This
log can also be access through the client by navigating to the Tools tab, clicking the Log
File dropdown menu, and selecting View.
84
XSPOC User's Guide
2. When I try to start the XSPOC client, I get an error saying “Connection to the server
could not be established. Please verify the server name and your network connection,”
what does this mean?
There are usually three possibilities:
1) The xsServer service is not running. Start the service on the XSPOC server and try to
start the client again.
2) The xsClient shortcut needs to pass on the name of the server (or its IP address) in
order for the client to know which server to connect to. If this is incorrect, the client
will not connect. Talk to your administrator about how to provide the server name.
3) There may be a network problem, or something that prevents a network connection
between the client and the server. If you can ping the server from the client’s
machine, this is probably not the problem.
3. I don’t see the manufacturer I need on the pumping unit list.
If you mouse click the plus signs to the left of the folders in the area where the pumping
units are located, you will see a much longer list to pick from.
4. I don’t see the downhole card on my card viewer, and where are the load limits and
other setpoints?
Right-mouse click on the card viewer in the area where the cards are plotted and you will
see many display options, including settings for viewing downhole cards, load limits,
predicted cards, etc. These settings are retained based on the last time you changed
them, so you do not need to set these every time you use the client.
85
XSPOC Administrator's Guide
XSPOC Administrator's Guide
Introduction
To visualize how XSPOC works, consider the program to be the combined functions of four
components, plus XSClient, which is best described as a user-friendly GUI.
The first component is the communication software. There are two “programs” for each active
communications port on the host computer, which manages the communications for each port.
They show up as processes in the task manager on the host computer.
XSCommServerAnd XSScanner
The second component is MS SQL Server. This database software stores information for
XSPOC, used by each of the other components for controlling parameters and data storage.
XSPOC is comprised of four databases with only one that is usable by the customer – XSPOC. It
is the Administrator's responsibility for creating backups of these databases. Please refer to MS
SQL Server Manual on how to create backups.
The third component is Theta’s XDIAG. This software provides the diagnostic analysis of the
dynamometer cards for the user. It reads production information, equipment data and surface
dynamometer cards from the database for processing, and then writes the diagnostic analysis
results to the database.
The fourth component is XSSchedServer. This program coordinates all of the interactions
between the first three components, again using configuration data stored in the database.
XSClient is the user interface to all four of the components. The XSPOC program can run without
XSClient, but you cannot access the data gathered by XSPOC without running XSClient. Whether
running on the host computer or a workstation, XSClient’s function is the same: it provides you,
the user, with a means to communicate with the pump-off controllers, review dynamometer cards
and analyses, and the ability to enter and retrieve data.
Most administrator tasks involve configuring XSPOC to present data in a certain format, perform
certain tasks, or change the scheduling of these tasks. These actions require interfacing with the
database to set parameters to accomplish the desired results. Because this necessitates direct
contact with the database, it is preferable to keep administrative tasks limited to a few
86
XSPOC Administrator's Guide
knowledgeable persons who are willing to accept this responsibility. It is best to have all
interaction, both user and administrator, occur from a workstation, although, this is not always
possible when performing administrative duties.
Many tasks that an XSPOC Administrator performs are difficult to explain in text, and must be
learned by “hands-on” demonstration. This manual will attempt to outline the basics and provide a
starting point for some of the more difficult tasks. Anytime you have a problem or need help,
please feel free to contact a Theta representative for help.
Recommended Hardware and Software
XSPOC Server PC Minimum requirements:
At least Pentium 1.5 GHzor better (higher speed and/or multiple cores if more than one or
two simultaneous users in networked environment)
At least 1 GB of RAM (more if more than one or two simultaneous users in networked
environment)
At least 2GB of disk space reserved for application installation
Additional disk space depending on number of wells, data resolution, and data archiving
(Very large databases can reach 50 GB in size)
87
XSPOC Administrator's Guide
At least 1024x768 resolution on monitor and at least 17" screen if server is to be used to
run the client (19" or larger preferred)
Available serial port (RS232) for every communication channel (if using serial ports)
Windows 2003, Windows 2000 or Windows XP or newer (Professional or Server
versions).
Network card if system will be accessed by others on the LAN
Remote access capability ( via pcAnywhere, RDP, LogMeIn, TeamViewer, Timbukto, etc.
or VPN connection is highly desirable to provide remote support)
Backup capability (second hard drive or network backup preferred, or tape drive).
CD/DVD-RW not recommended because of limited data storage. We recommend having
a second hard drive in the machine, at least 500 GB. This will not only allow local
backups for temporary storage, but will allow us to configure one drive for OS and
applications, and the other for data, which is an improved configuration.
xsDialer PC Requirements for Call Outs (only needed if xsDialer is licensed):
XSPOC Server Software
Available PCI Slot
XSPOC Installation and Service Packs
Server Install
The first step in installing XSPOC is to download the Base Install folder from the XSPOC website.
You can find this file at http://gotheta.com/d/xsinstall.zip.
The install process consists of:
Installing the Microsoft .NET Framework and 2.0 and 3.5.1 if needed.
Installing SQL Server Express 2005 if necessary. SQL Server Express 2005 is a scaled
down and free version of the MS SQL 2005 Server. Since for XSPOC purposes both the
Express and the full MS SQL Server product behave the same, when we reference SQL
Server in our documentation we are talking about both Express and MS SQL Server,
unless we specifically refer to SQL Server Express 2005.
88
Building and attaching the XSPOC database to the SQL Server.
XSPOC Administrator's Guide
Installing the SQL Server Management Studio Express which allows you to view and
query databases in SQL Server 2005 Express.
Installing the XSPOC Servers.
Installing the XSPOC Service Pack
Installing XSClient
Start installing XSPOC by opening XSInstall.zip and extracting all files to an XSIntall folder on the
desired hard drive.
Select a Destination Folder to Extract Files
89
XSPOC Administrator's Guide
Once the files are extracted a window will open showing an install folder. Click to open the folder
and then click on the xsServerBaseInstall.exe file. The Prerequisites Wizard will launch. Click
Next to continue.
The Wizard will determine if XSPOC needs to install .net Framewrok, SQL Server and SQL
Server tookit. The items checked will be installed.
The first thing the installer checks for is the installation of Microsoft .NET Framework 2.0 and
3.5.1. The installer will not reinstall pre-existing components but will continue through its checklist
until it reaches the SQL Server 2005 Express install. (Note, if you have already installed SQL
Server Express 2012, the installer may still prompt you to install SQL Server 2005 Express. In
this case, simply deselect SQL installations and continue with the installation process.)
90
XSPOC Administrator's Guide
Click Run to install SQL Server and any other prerequisistes. If the computer already has the
prerequisite programs XSPOC will not attempt to install them again.
This window shows the progress of the prerequisites installation.
91
XSPOC Administrator's Guide
Once this is finished the Welcome to the XSPOC Setup Wizard opens.
This screen allows you to select the folder you want XSPOC to be installed to. After selecting the
folder you want, choose Next to continue the installation.
92
XSPOC Administrator's Guide
Enter User Name and Organization and a Theta provided Serial Number, and then click next
twice.
Click Install to begin the installation.
Installing XSPOC may take several minutes.
93
XSPOC Administrator's Guide
Click Finish once the window below opens.
During the install, XSPOC creates an instance of MSSQLSERVER and attaches an empty
database. The SQL .mdf and .ldf files are installed in the default locations. The SQL installation
requires that mixed authentication be enabled. The installer sets this setting during the installation
and creates an SA account with a password.
The following items may be required as well, depending on the configuration:
If using data integration feature, copy xsupdatewelldata.dll provided by Theta into the
‘XSPOC’ directory and register by typing ‘regsvr32 c:\XSPOC\xsupdatewelldata.dll’ from
the run command or command prompt (of course, substitute the proper path to your
‘XSPOC’ directory.
If using the data integration feature, set system configuration parameters to support data
integration.
94
XSPOC Administrator's Guide
If automatic reports are desired, the xsScheduler service will need to be setup to log on
as a user (versus the system account which is set by default). The user account used to
run this service needs to have adequate privileges to be able to print to any printer
specified.
Service Packs Install
Before starting the Service Pack installation, the XSPOC Server processes (XSServer,
XSSchedServer, XSDialer and all XSPOC related Processes (XSCommServer, XSScannerL,
XSClient, XSServiceManager) will also need to be shut down.
You will need to Lock down any of the rows you made changes to in tblParameters or tblStates if
you don’t want the Service Pack to overwrite those rows.
Pre-install
1. Create an xspocinstall folder (if one is not created) on the drive xspoc is installed.
2. Download the Service Pack 11-10 into the xspocinstall folder (contact Theta for
download link).
3. Make sure there is a copy of the database on the server. Copy the latest backup to the
xspocinstall folder. The database backup location can be found in the
tblSystemParameters.
4. Copy the xspoc.ini file from the xspoc directory to the xspocinstall directory.
5. Make sure they are running SQLServer2005 or later.
6. Stop the xsserver service and the xsscheduler service before starting service pack
install.
Run Service Pack xsp11-10.msi. by opening it and clicking Run.
95
XSPOC Administrator's Guide
Click Next.
Enter User Name, Orgianization information, and a Theta provided Serial Number.
96
XSPOC Administrator's Guide
Click Install
The XSPOC Service Pack Setup window appears.
Select Yes to continue installation, if a security warning appears.
Click Finish to complete the installation.
97
XSPOC Administrator's Guide
Next run the most current service pack available from Theta (xsp2-x-x.msi), by contacting the
Bakersfield Office either by email ([email protected]) or calling our main number, 661-6332792. This service pack may take longer than usual to finish. It is also recommended that you
verify the amount of space avaiable on the drive that XSPOC is located as it can take up to 3
times the size of the XSPOC data base to install successfully.
Click next to begin the installation.
Click next to begin the installation and enter User Name, Organization, and a Theta provided
Serial Number. Click Next twice to continue.
Click Install.
98
XSPOC Administrator's Guide
Service Pack Setup window appears.
Click Finish to complete the installation.
99
XSPOC Administrator's Guide
Post Install
1. If this is an install that has an existing XSPOC Database, check tblSystemParameters for
correct paths for XDGDataDir and Database Server name in SQLHostName.
2. The services should have restarted during the install, so scan several wells on the
different communication channels
3. Gather cards from different wells on the different communication channels.
4. Run XDIAG on the cards gathered.
5. Make sure Well Status screen is working correctly.
6. Test the BackupDB event by running it and creating a database backup.
Registration Steps:
1. Right-click on the xsManager icon in the system tray and select “Registration”, then
“Generate License Registration File”.
2.
3. Fill in the fields on the XSPOC License Certificate dialog box then click on “Generate.”
Generate will place the file in a local directory and you will need to email that file to
[email protected].
100
XSPOC Administrator's Guide
4. E-mail the generated license.txt file to Theta at [email protected] will return a
file named license.tlf. Save this license.tlf file to your XSPOC directory.
5. After installing a license you will need to stop and then start the XSPOC server. See the
xsManager topic below if you are not sure on how to stop and start the XSPOC Services.
After starting the XSPOC services back up, your Process List in Task Manager should
contain at least one of these items XSScannerL, XSCommServer, XSPOC
ServiceManager, XSServer, XSSchedServer and SQL Server Manager.
6. If you are unable to license your server using the method mentioned here, call Theta at
661-633-2792 to find out how to license your server another way.
Client Install
Installing xsClient on the Host Machine
Once you are done installing the XSPOC Server, you will notice that there is an xsClient
icon on the desktop of the Host Machine and it looks like the one to the left. If you
double-click on this icon then it will start up xsClient. If this is the first time you have
done this on this computer then it will install the xsClient program onto this computer and place it
under the Program Files folder. Remember that every time the xsClient program runs, it first
checks the XSPOC Server’s copy of xsClient to see if they match. If the xsClient program is
missing or is a different version than the XSPOC Server’s copy, then xsClient will install itself onto
the calling computer, even if that computer is the XSPOC Server machine itself.
After double-clicking this icon for the first time, the xsclient Setup window launches.
101
XSPOC Administrator's Guide
Once installation is completed the splash screen below will display and then the client will open.
If you right click on the desktop icon on the Host Machines desktop and choose Properties from
the popup-menu then you will get a dialog that looks like the one below. The thing to notice is the
Target path of C:\XSPOC\xsClient\xsClients.msi /passive /qr SERVER="SERVER NAME" where
SERVER NAME is the actual name of the Host Machine. The Target path here is correct for the
102
XSPOC Administrator's Guide
icon on the Host Machine. If you are only going to run xsClient from the Host Machine then you
are done with the xsClient installation. If you have Client Machines that you want to install
xsClient on then continue on to the next section.
Installing xsClient on Client Machines
The first thing to do is to locate the xsClient shortcut under the Host Machine’s folder
C:\XSPOC\XSClient. This is the highlighted icon in the screenshot below.
103
XSPOC Administrator's Guide
If you right click on this icon and choose Properties from the popup-menu you will notice that this
shortcut has a Target with a UNC path of \\SERVER\XSClient\xsClients.msi /passive /qr
SERVER="SERVER NAME" where SERVER NAME is the name of the Host Machine as shown
below. This is the shortcut that you want to place on the desktop of every Client Machine that you
want to grant access to your XSPOC Server.
If you are having problems copying this shortcut to a Client Machine, all you have to do on the
Client Machine is right click on an empty space on the Client Machine’s desktop, choose New
and then Shortcut. In the Create Shortcut dialog box put \\SERVER\XSClient\xsClients.msi
/passive /qr SERVER="SERVER NAME" where SERVER NAME is the name of the Host
Computer. If you are having problems creating or using this shortcut then make sure that the
C:\XSClient directory on the Host Machine has been shared according to the instructions in the
Server Install Notes. Also make sure that you are using the correct name of the Host Computer. If
you are not sure about the Host Computer’s name then open up the XSPOC Service Manager
and check the Machine Name (See XSPOC Service Manager section below).
Double clicking the xsClient icon on the Client Machine will install or update the xsClient program
just like it did on the Host Machine.
104
XSPOC Administrator's Guide
Install xsDialer
Steps to prepare for installation:
1. The dialer and modem drivers are supported on Windows platforms Windows 2000 and
newer.
2. IE 5.5 SP2 or higher must be installed for the Microsoft Speech drivers to function
properly.
3. Microsoft’s Text to Speech Engine (SAPI v5.1) must be installed (xsDialerTTS.exe). File
can be downloaded at http://www.gotheta.com/d/xsDialerTTS.msi
4. The following modems are recommened for use with xsDialer:
a. Way2Call’s HiPhone Desktop USB Modem (recommended)
b. Way2Call’s HiPhone PCI Modem
c.
Creative Modem Blaster V.92 PCI
d. Zoom 3025C PCI Voice Modem
5. For the Radio Notification to function correctly you will need to install the latest version of
DirectX
105
XSPOC Administrator's Guide
6. Refer to xsDialer Configuration later in this Help Manual.
Steps to install the Hi-Phone USB Desktop Modem:
Install drivers from CD that came with the modem. Reboot when prompted.
After restart, plug in the modem via the USB connection and ‘Plug and Play’ should find
the new device. Windows will usually install 2 or 3 different devices, so be patient and
step through all of them.
Right-click on modem in system tray and select ‘Hardware Configuration’ to set up the
proper connection. Pick USB connection.
Steps to install the Zoom 3025C PCI Voice Modem:
Install drivers from the CD that came with the modem.
When prompted to restart your computer, select No.
Close all programs and then shutdown your computer.
Install the Zoom modem.
Restart your computer.
Steps to install the xsDialer application:
From command line, run ‘C:\Windows\Microsoft.NET\Framework\v1.1.4322\installutil /i
XSDialer.exe’ to install the service (or from wherever the “XSPOC” directory is located).
The following items need to be configured in the Services panel:
o
Set the service to run under a valid account (either local or network). This is
required to hear voice playback.
o
It is highly recommended that you setup the recovery options to restart this
application if it does stop for any reason.
Start the xsDialer service.
Want a better voice?
Some people really like the ‘Frank’ voice from Cepstral much better than the Microsoft
voices. You can download this from www.gotheta.com/d/cepstral_frank.exe to try it out.
Keep in mind that this voice needs to be licensed from Cepstral if you intend to use it.
The setting within the DialerVoice is ‘Cepstral Frank’. We have found that sometimes the
xsDialer service needs to be run under a local account rather than the system account for
this voice to work. Contact Theta for more information.
106
XSPOC Administrator's Guide
XSPOC Account Information
XSPOC Service Manager
OVERVIEW: The XSPOC Service Manager allows you to manage the XSPOC server processes.
NAVIGATION:
From the Windows Navigation Area or System Tray:
Click on the Service Manager icon
OR
1. Right-click on the Service Manager icon
2. Choose Open XSPOC Service Manager from the pop-up menu as shown below
FEATURES: The XSPOC Service Manager allows you control the server processes running on
your server station. Depending on your configuration, the services could include XSServer,
XSSchedServer, and XSDialer.
The Service Manager has a list of server
processes listed in the Services drop-down
list. Use the drop-down arrow on the list to
display the full list and select the Service you
wish to control. Notice the picture on the left
side of the window changes depending on
which Service is selected. Notice that the
Host Machine Name is displayed on the
Service Manager.
107
XSPOC Administrator's Guide
The three states of a Service are controlled by the following buttons:
Start - Starts the service from the Stop state. An XSPOC Server start also starts the
communication software.
Stop - Stops the service which was either in the Run state. An XSPOC Server stop also
shuts down the communication software.
You can also change the state of a service by right-clicking on the Service Manager icon in the
System Tray and selecting the appropriate actions from the pop-up menu. To change the Current
Service or to see which service is selected as the Current Service, choose the Current Service
menu item and then select which service you want to designate as the Current Service as shown
below. The service that is designated as the Current Service will have a check mark next to it and
will also be reflected in the labels next to the Start and Stop menu items. As shown below
XSPOC Server is designated as the Current Service.
After setting the Current Service, you can right click again on the Service Manager icon in the
Navigation Area and choose the Start Server or Stop Server menu item from the pop-up menu to
perform the related action on the Current Service.
License Manager
There are two types of licenses in XSPOC: Registered and Trial. If you do not have a registered
program or a program running within the trial period then the communication services will not be
running and your xsClient may be displaying a server timeout error when attempting to poll a well.
Recall that the communication services, XSScannerL and XSCommServer, appear in your
Process List in Task Manager on the Host Computer.
108
XSPOC Administrator's Guide
There are also two ways to license the XSPOC product: Generate License Certificate and
Generate License Key. The preferred method is the Generate License Certificate but if you are
having problems with this method then you need to use the Generate License Key method. Both
methods require the license.tlf file to be emailed back and placed on the Host Computer.
To access these registration methods you need to Right-click on the xsManager icon in the
system tray and select “Registration”, and then select either “Generate License Registration File”
or “Generate License Key”.
Troubleshooting Licensing Issues
If you suspect that there may be a licensing problem then you need to first open the C:\XSPOC
directory on the Host Machine.
1. Check to see if license.tlf is in this directory.
2. Check the xserror.log and see if the last entry or an entry near the bottom has the
following description for an error: The license file was not found. File:
C:\XSPOC\license.tlf.
3. Check the register.log file
a. If the registration period has expired then it will state this with a date and time
stamp when you attempted to last start the XSPOC Server.
b. If you have a trial period license then everytime XSPOC Server is started, a
datetime stamp entry is entered into register.log with how many days are left
on the trial.
c.
If there is something wrong with the license file then you will see the following
message: The license failed system check.
4. Call Theta if you suspect any licensing problems.
An alternate unsupported way to check the License is to create a license.vbs file with Notepad
and paste the following code into it:
109
XSPOC Administrator's Guide
Set s = CreateObject("XSPOC.Licensing.LicenseClient")
s.LicenseName = "XSPOC"
s.KeyStorePath = "C:\XSPOC"
s.LoadLicense "C:\XSPOC\license.tlf"
If Not s.IsLicenseValid(reason) Then
MsgBox (reason)
Else
If s.CurrentLicense.Type = 0 Then
MsgBox "TRIAL! Only " & s.CurrentLicense.UsageRemaining & " day(s) remaining."
Else
MsgBox “Registered”
End If
End If
Running this file on the Host Machine will read the license file and return what type of license you
have and how much time is remaining if it is a trial period license.
Using Access and Excel
One of XSPOC’s key features is its open database. This allows users to extract any data within
the database for use in other programs. It also allows for mass data entry by personnel qualified
to perform such a task.
XSPOC provides the customer with two methods of access, in order to help protect the database
from accidental data change. The first method allows read-only privileges, and the second readwrite privileges; and each is established during the linking process.
The following will demonstrate, step-by-step, the process of establishing the links. The only
difference is that different user name and password is needed. These ID’s and passwords are not
required after the link is created; however, as administrator, you may wish to require passwords
to access the MS Access databases.
Create a blank database in Access with whatever name is desired. In the example, we
will use “XSPOC-RO”, since this will be a read-only database. Also, in this example, the
110
XSPOC Administrator's Guide
database is being created on the XSPOC server. Creating an Access database on a
workstation requires mapping to the XSPOC server and connecting to files on the server.
In the Access menu, click on File, Get External Data, Link Tables.
In the Link dialog box that is now displayed, select ODBC Databases at the bottom of the
File Type drop-down box.
This now opens the Select Database Source dialog box. Click on the tab name Machine
Data Source.
Click on the New button, which opens a Create New Data Source dialog box.
Select User Data Source or System Data Source and click Next. Both selections
determine what the source will be for this machine. The difference is whether only you
(under your Windows login ID) will be using MS Access to the link OR if everyone who is
on this computer can link to the tables.
Scroll to the bottom of the list and select SQL Server, and then click Finish.
This opens a Wizard that steps you through setting up the DB source. Type in a name
you want to refer to this data source in the Name textbox and enter "local" in the Server
textbox. The Description is optional.
If being performed from a remote workstation, you would enter the server name. Click
Next.
111
XSPOC Administrator's Guide
In the next dialog box, click on “With SQL Server authentication…” and then enter the
read-only Login ID and enter the read-only password. Click Next.
In the next box, click on “Change the default database to…” and then select XSPOC from
the list. Click Next.
When the next box opens, simply click Next.
This opens the final box of the Wizard. Click the Test Data Source button to ensure
connection and function.
This brings you back to the Select Data Source dialog box, shown below, with the new
source highlighted. Click OK.
112
XSPOC Administrator's Guide
At this point, you will be prompted for the read-only password. Enter the read-only
password and click OK.
This opens a box asking you to select the tables to be linked. Select the tables you wish
to link to, Theta recommends ONLY tables beginning with “dbo.tbl…”, check Save
Password, then click on OK.
You have now created an Access database that only allows the reading of data in the XSPOC
SQL Database.
Restoring an XSPOC System
The basic steps to restore a system are:
1. Install OS and any other non-XSPOC software that may be needed.
2. Install XSPOC server components and latest service pack.
3. Restore the current XSPOC database.
If some catastrophe has struck and the database needs to be restored, here are the procedures
for getting back up and running. As mentioned before, you should have backed up your files to
tape or another server. In this example, it is assumed that the hard drive crashed and we are
rebuilding from scratch. If you are simply trying to move the XSPOC System to a new server then
please follow the procedures in Moving an XSPOC System below this topic. The following
directions apply to users of SQL Server 2005 Express and above.
Name the computer with the exact name as it had before crashing. Reinstall XSPOC, MS
SQL Tools and the latest service pack from Theta’s website.
From your backup tapes or server, copy the *.BAK files over to the replacement server.
113
XSPOC Administrator's Guide
Open the SQL Server Management Studio program. In the Tree:
o
Expand the Database Engine group.
o
Single-click on Databases
o
Right-click on Databases, select Restore Database as shown below.
This opens the Restore database window.
In the Restore as Database field,
select or type XSPOC
Select From Device and click the
browse button
Click Add and locate the .bak file in
your file structure and click Okay.
Click Okay again.
Select the backup set to restore by
marking the box next to the file.
114
XSPOC Administrator's Guide
Click on the Options group and select the option forcing the old database to be replaced
by overwriting with the backup file.
MS SQL Enterprise Manager will then begin restoring the database and show a box with a
progress circle in the bottom left Progress box of the window..
115
XSPOC Administrator's Guide
When finished, this message box will display.
This restore was actually quite simple. If, for some reason, you are restoring the database to a
machine with a different name, then there will be more tasks involved and you will definitely need
to contact your Theta representative for assistance.
Installing the client is normally a simple process; however, difficulties can arise when a network
has more restrictive security policies. Should the process described below not work, contact your
company IT personnel and Theta representative for assistance.
Step 1 – On the server, create a shortcut to XSClient.exe in the XSClient directory.
o
To do this, open Explorer, and locate the XSClient folder.
o
Open the folder and right-click on XSClient.exe, then click on “Copy”.
o
Now right-click on the XSClient folder in the tree and click “paste Shortcut”.
o
Confirm that there is a “Shortcut to XSClient.exe” in the XSClient folder.
Step 2 – On the workstation, double-click “My Network Neighborhood”.
o
Make sure that this window is NOT maximized and you can see a portion on the
User’s desktop.
o
Drill down through the network until you locate the XSPOC server. Go into the
XSClient folder and locate the shortcut created in Step 1.
116
XSPOC Administrator's Guide
o
Click-and-drag the shortcut icon onto the User’s Desktop and release the mouse
button (DO NOT Copy and paste - this does not always work).
o
Close the “My Network Neighborhood” Window. You should now see the icon on
the Desktop (the name will be different)
Step 3 – Right-mouse click the shortcut icon that was just placed on the Desktop and
then select Properties, which opens the window seen below.
o
In the “Target” field, enter a space and the name of the XSPOC server at the end
of the existing text string. In this example, the server name is TXTHETA
o
Be sure that the “Start in” field says “C:\XSPOC”, as shown.
o
Single-click the Apply button and then close the window by clicking the OK
button.
o
Under the “General” tab, you may want to change the name of the icon to
“XSClient” or “XSPOC”.
Step 4 – Double-click the icon and the server will download XSClient to the workstation
and begin the program.
Any time that you update the server with a service pack, it is not necessary to make updates to
workstations. XSPOC checks the version of the workstation client software each time a User
117
XSPOC Administrator's Guide
connects to the server. If the User’s version is older than what is on the server, XSPOC
automatically updates the User’s workstation with the same client software.
Moving an XSPOC System
The following directions apply to users of SQL Server 2005 Express and above. Here are the
basic instructions to reload a server, as well as the links to the various files you will need. Please
read through all the instructions first before starting.
1. Make sure the XSPOC database is backed up (we will use this as a last resort).
2. Shut down XSPOC services using XSPOC Service Manager.
3. Using SSMSE, detach XSPOC database on old server using this procedure:
Start SQL Server Management Studio Express using the sa Account
Expand the Databases group in the Object Explorer
Right-click the XSPOC database and select the Detach Database option in the Tasks
sub-menu.
118
XSPOC Administrator's Guide
4. If you are using data integration feature, be sure to back up the XSUpdateWellData.dll in the
XSPOC directory.
5. Backup the xdgdata directory on the old server (rarely needed, but nice to have).
6. Load your OS and any other software you need on the new machine.
7. Install XSPOC from XSInstall.zip (don't install latest service pack yet).
http://www.gotheta.com/d/XSInstall.zip
8. Detach database on new server using same procedure listed in step 3 above.
See Instructions under step 3 above.
9. Move XSPOC.mdf and XSPOC.ldf files from old server to new server, usually located in
c:\ProgramFiles\MSSQL directory. (You may need to drill down to the data directory in this
folder.)
10. Using SSMSE, highlight the Databases group in the Object Explorer, right-click, and select
Attach Database in the Tasks sub-menu.
11. Using SQL Server Query Analyzer, realign the SpocRead and SpocWrite Accounts using the
query that is listed below.
12. Run the latest service pack to update the database and the processes. The service pack
should recognize if you have not yet installed .NET and help you install the necessary file.
Share the xsclient directory (read only) and the xdgdata directory (read/write).
13. Change server name and paths in the tblSystemParameters table where necessary.
14. Modify client shortcuts to point to new server name if necessary.
15. If using data integration routine, copy the XSUpdateWellData.dll into the XSPOC directory
and register it ("regsvr32 c:\XSPOC\xsupdatewelldata.dll" from command line).
16. Confirm operation of software.
Realign the SpocRead and SpocWrite Accounts:
Copy and paste the following into the SQL Server Query Analyzer and run everything
between the lines:
-----------------------------------------------------------------------------------------------------USE master
GO
EXEC sp_dropuser 'SpocRead'
119
XSPOC Administrator's Guide
GO
USE master
GO
EXEC sp_dropuser 'SpocWrite'
GO
USE master
GO
EXEC sp_droplogin 'SpocRead'
GO
USE master
GO
EXEC sp_droplogin 'SpocWrite'
GO
USE XSPOC
GO
EXEC sp_dropuser 'SpocRead'
GO
USE XSPOC
GO
EXEC sp_dropuser 'SpocWrite'
GO
USE XSPOC
GO
EXEC sp_droplogin 'SpocRead'
GO
USE XSPOC
GO
EXEC sp_droplogin 'SpocWrite'
GO
EXEC sp_addlogin 'SpocRead', 'SpocRead', 'XSPOC'
GO
EXEC sp_addlogin 'SpocWrite', 'SpocWrite', 'XSPOC'
GO
EXEC sp_defaultdb 'SpocWrite', 'XSPOC'
GO
EXEC sp_defaultdb 'SpocRead', 'XSPOC'
GO
120
XSPOC Administrator's Guide
use XSPOC
EXEC sp_grantdbaccess 'SpocRead', 'SpocRead'
GO
use XSPOC
EXEC sp_grantdbaccess 'SpocWrite', 'SpocWrite'
GO
USE XSPOC
GO
EXEC sp_addrolemember 'db_datareader', 'SpocRead'
GO
USE XSPOC
GO
EXEC sp_addrolemember 'db_datareader', 'SpocWrite'
GO
USE XSPOC
GO
EXEC sp_addrolemember 'db_datawriter', 'SpocWrite'
GO
----------------------------------------------------------------------------------------
XSPOC Configuration
XSPOC Configuration Window
OVERVIEW: The XSPOC Configuration window
allows the administrator access to the XSPOC
database and allows the administrator to make
changes to the underlying data and parameters which
affect the way XSPOC displays and collects data.
NAVIGATION:
From the Main Client window:
1. Click on the Tools menu.
2. From the Admin Section, click on the Configuration menu item.
FEATURES: The XSPOC Configuration window provides a quick way to check data, reschedule
events and configure the database. These tables are the heart of XSPOC and are for
121
XSPOC Administrator's Guide
Administrator access only. Their general use for data entry and manipulation is not recommended
since there is no data checking routines associated with this screen. Whatever you change in a
cell and then commit will permanently change the XSPOC database and most of the time without
any type of checking. Please use caution when performing actions through the XSPOC
Configuration Screen.
The tables in the XSPOC database are listed on the left side of this window. Selecting any of
these tables will refresh the table grid on the right side of this window or you can use the
Refresh button on the forms toolbar for the currently selected table. You can use the Limit text
box to limit the number of records returning from the table and it defaults to 10000 and the
maximum is 99999.
To edit a value in any cell in the grid, click in the cell and type the new value. Clicking into another
row or changing to another row using the arrow keys will commit changes to the database. If you
accidentally change a value and haven’t yet committed the change by clicking on another row,
you can use the escape key to undo the change. The currently selected row will display different
icons in the row selection cell based on the different states the row is in.
These are the different states for a row:
122
XSPOC Administrator's Guide
A row displaying this icon means that the row is selected and no changes have
been made to any of its data.
A row displaying this icon means that there has been change to the row's data and
the row is in editing mode. Navigation to another row will commit all changes to the
database.
A row displaying this icon means that this is a new row and will input a new record
into the database. As soon as you change any of this new rows data, the row header
displays the editing mode icon. Any navigation to another row will save the data as a new
record in the database.
You can also copy data from an existing row into a new row. First select the entire row as shown
in the large graphic above. Right click on the black triangle or click on the Copy Row icon on the
toolbar at the top of the child window. Right click on the new row and paste, or select the Paste
Row icon on the toolbar at the top of the child window. You can also press Ctrl-C to copy that
row, and now highlight the new row and press Ctrl-V. You will usually need to change the first
cell's data in the new row since most of the database does not allow duplicate records. You can
also copy and paste a single cell's value from one cell to the other by highlighting the value you
want to copy and pressing Ctrl-C and then putting your cursor in the cell you want to paste the
value into and pressing Ctrl-V.
You can also use the configuration window to filter the selected table. Clicking on the SQL button
will display the query window. In the query window you can type in a filter condition. Usually these
filters are in the form of Column Name = ‘Value’ as is displayed below. Clicking on the Execute
button
executes this filter and then redisplays the table rows in the grid with the filter applied.
123
XSPOC Administrator's Guide
You can also use the toolbar to help you build the filter condition. Select the column you want the
query to apply to in the column dropdown and then define the criteria. The criteria can be in the
form of = ‘Value’ or > ‘Value’ but is not limited to just these types of criteria. Please consult with
Theta if you have any further questions about SQL Query filter conditions. After setting the criteria
you can click on the Execute button to execute the query and the grid will update with the
appropriate rows meeting your conditions.
Add an Analog Input
This depends on whether you have this particular input on all wells, or just on some of your wells.
If this input is on all of your wells, it is a little bit easier, but you also have to have the same item
(like flowline pressure) on every well, and it has to be scaled exactly the same on every well. If
this is the case, then go to the Tools/Admin/Configuration menu, then to tblParameters. Find the
POCType number that corresponds to your particular controller type (also located in the
tblPOCTypesTable). You then need to find the register number that corresponds to the input of
your transmitter. If you do not find it in the list, you can go to the bottom of the grid and add your
own entry. Here are the important columns and what they mean:
124
XSPOC Administrator's Guide
POCType: Contains the number that identifies the type of controller (1=Baker, 2=EDI,
3=Lufkin MPC, etc).
Description: User configurable name to define the item.
ScaleFactor: This is 1 if no scaling is to be applied. A value of 0.1 would multiply the raw
device value by 0.1.
Decimals: Number of decimal places to show in XSPOC and is 0 by default.
StatusScan: Check Status Scan for XSPOC to gather this register during its normal
status scan.
CollectionMode: This controls how data points are added to the data history. If you want
this value to be collected for the history graph every time a status scan is done on the
well, set this to 3. It can be set to a value of 1 if you want the data point to just be stored
once per day. A value of zero turns off the historical data collection.
GroupStatusView: Set this to true (1 or –1) if you want to display the analog input’s value
on the group status. This makes it available when customizing the group status view,
under the tblParameters branch.
If the input is only on one well, or on some of the wells, or if the input is differently from well to
well, or if the same input on different wells have different scaling factors, then the tblFacilityTags
table must be configured (you will see this as the Facility Tags tab in the Tools Tab, Admin
Section, Configuration Button). There is now a Facility Tags Windows that provides a nicer user
interface for creating facility tags. You can find this by navigating to the Facility tab and selecting
the Facility Tags button. A new row needs to be added to this table to define the register. This is
a little more complicated, but gives you many more options such as alarm actions, etc. Here are
the columns of interest and how to use them:
NodeID: The NodeID (the well name) for the well that the input is associated with.
Address: The register that specifies the memory location for the item. This can be a
modbus address like 30001 or it can be an AllenBradley memory location like N5:13.
Description: Description of the item, like “Tubing Pressure.”
Enabled: 0 is disabled, 1 or –1 if enabled.
DataType: This defines how the raw values need to be converted and displayed. These
are available in the tblDataTypes table, but are defined here for you:
o
1 = discrete for (0XXXX and 1XXXX modbus registers)
o
2 = integer (for 3XXXX and 4XXXX modbus)
o
3 = float (IEEE),
o
4 = float (modicon)
o
5 = baker time
125
XSPOC Administrator's Guide
o
6 = baker date
o
7 = modbus long
o
8 = float (IEEE reverse)
o
9 = time (seconds since midnight 1/1/1970)
o
10 = BCD
o
11 = Unico Long
o
12 = Pickford Long
o
13 = AB Timer
o
14 = Integer Signed
o
16 = Time (DJAX)
o
17 = Date (DJAX)
o
19 = Long (Enron)
o
20 = Float (Enron)
o
21 = Date (Enron)
o
22 = Time (Enron)
o
23 = Trend (FB)
o
24 = Long (Signed)
o
25 = Long (BCD)
TrendType:
o
0 = no trending
o
1 = trending enabled with data storage in tblFacilityTagHistory
o
2 = trending enabled with data storage in tblDataHistory (use if tag is associated
with a well instead of a facility)
RawLow/RawHi/EngLo/EngHi: These define how the value is scaled. If no special scaling
is required, then the Lo’s need to match and the Hi’s need to match (like RawLo=0,
RawHi=9999, EngLo=0, EngHi=9999)
LimitLo/LimitHi: These define when the alarm points are tripped. If you do not wish to trip
Lo or Hi, then just set the value to be outside the range of the expected values. A value
equal to the Hi Limit would be in alarm.
Decimals: Number of decimal places to show in XSPOC, and is 0 by default.
GroupNodeID: This allows this input to be associated with a different NodeID, but will
usually be set to the same as the NodeID column. If there is a need to associate this
tag’s data with a different NodeID, this column will contain the NodeID of the associated
facility or well. For example, historical storage of data will be based upon the name
contained in the GroupNodeID.
Add a Parameter to the Control Setpoints Panel
126
XSPOC Administrator's Guide
The occasion may arise when users request that additional setpoints be displayed when the
Control Parameters Setpoint panel is opened.
This panel is accessed by clicking on the main Well Menu icon and then clicking on the Setpoints
icon in the Control Section of the Well Menu.
To select additional Control Parameter Setpoints for display, click on the configuration button
from the Setpoints toolbar. This will display the Setpoint Group Configuration screen. From here
you can add groups and add register addresses to any group. A list of groups is displayed on the
left side of the screen with available parameters displayed on the right side of the screen. Simply
choose the group the register address will go into and then select or unselect the register
addresses you want in that group.
127
XSPOC Administrator's Guide
Add a Parameter to Group Status Views
If you want to include a parameter to a Group Status View that is not available from Group Status
View Customize then you will need to modify the memory map of a specific controller. First,
identify the type of controller you have and then find the POCType value in tblPOCTypes. Then,
using the POCType find the register in tblParameters that you want to view through Group Status.
Make sure you put a 1 in the GroupStatusView, and mark the StatusScan and Locked columns
for this parameter.
A Group Status View frequently contains wells that have different controllers. To view a group of
wells with differening controllers but the same type of information you want displayed, then some
configuration to the memory map for these controllers needs to be performed by modifying
tblParameters in the XSPOC database. The first step is to identify the register addresses for each
of the well controllers in question that refer to the parameter of interest. Once that is done, then
you need to make sure that the description for these addresses is exactly the same. Group Status
matches up a specific parameter across different controllers by the Description column in
tblParameters, so it is very important that the Description for each of these registers be exactly
the same across controller types.
128
XSPOC Administrator's Guide
For example let’s say that I have Pickford, SAM and Unico controllers in my field and I want to
display Casing Pressure in Group Status for all the wells in my field for each of these controllers.
First I need to identify how XSPOC relates these controllers to the memory map. When you look
in tblPOCTypes you will note the following POCTypes for our controllers: Pickford = 6, SAM = 8
and Unico = 12.
Now I need to identify the Casing Pressure register from each controller. When you look in
tblParameters you will note the following Addresses for our controllers: Pickford = 30005, SAM =
42384 and Unico = 47111. In order for XSPOC to match these different registers up in the
GroupStatus grid, the Description for each of these registers need to exactly match. So in this
example, I would change each of the Descriptions for these Addresses in tblParameters to
Casing Pressure. I also need to enable these parameters for StatusScan and enable one of these
parameters for Group Status View by putting a 1 in the GroupStatusView column. Don’t forget to
mark the Locked checkbox in the Locked column for each parameter so service packs won’t
change our modifications.
Now I need to modify a view and add the Casing Pressure column. Because we changed the
Description to match across the contollers, the values for Casing Pressure will now appear after a
well scan for all the wells that have the controller types we modified.
Backup the XSPOC Database Using Scheduler
There is a BackupDB Scheduled Event that can be configured to backup the XSPOC database
and how many backups to keep. To configure how the BackupDB Event works, change the
values for BackupDBPath and BackupDBFilesToKeep in tblSystem Parameters.
BackupDBPath needs to be a valid path that SQL Server can use to backup the database
file.
BackupDBFilesToKeep can accept any positive whole number of the amount of files to
keep. If this is not set then the default value is 3. When BackupDB Event runs, after
baking up the current database, it will then look to see how many files are in the
BackupDBPath and delete any older backup files until there is the specified amount of
files in that folder. So if you want to keep the current backup plus the last 3 then you need
to set this parameter to 4.
After setting up these system parameters, open tblSchedule and then locate the row with
BackupDB. Check the Enabled box and set up an appropriate time for this to run in the StartAt
column. Ensure the event is set to run on PortID99.
129
XSPOC Administrator's Guide
Callouts on POC Alarms Setup
To Setup a Discrete Alarm Callout:
Open the Configuration tool
Open tblAlarmConfigByPOCType
o
Find or Add the Register you want to receive notification on
o
Make sure Bit is not 0
o
Mark the Enabled box.
o
Mark the Locked box.
o
Check Description as this is the message with date and time that is sent on
notification.
o
Mark the Normal State box.
Open tblNodeMaster
o
For each well that you want to receive notification on, make sure StringID refers
to a valid StringID from tblStrings and that this refers to a valid callout group. A
Contact Group contains contact names and emails for alarm notification. A
Responder List contains names and phone numbers for Alarm Callouts.
o
For each well that you want to receive notifiation on make sure AlarmAction is set
for a callout on Hi and/or Clear (5=16 Hi, 7=64 Clear). So for Set and Clear a
value of 80 is used.
o
If you don’t want NodeID to be used in the callout message then set
VoiceNodeID to use something other than NodeID. You can also use this column
to clarify the spoken well name. The dialer voice reads this text phonetically so
you can use written numbers instead of numerals (e.g. ten vs. 10).
To use a pager, open tblSystemsParameter and set UsePager = 1. (This is a legacy
feature. If your company still uses pagers, contact Theta to assist in setting this up.)
To use xsDialer, open tblSystemsParameter and make sure UsePager is set to any value
except 1 (we recommend 0.) *See note after previous bullet point.
To Setup a Hi/Lo Alarm Callout:
Open the Configuration tool
Open tblAlarmConfigByPOCType
130
o
Find or Add the Register you want to receive notification on
o
Set Bit = 0
XSPOC Administrator's Guide
o
Check Description as this is the message with date and time that is sent on
notification.
o
HiLimit and LoLimit should be set to a value not equal to 0
Open tblNodeMaster
o
For each well that you want to receive notification on, make sure StringID refers
to a valid StringID from tblStrings and that this refers to a valid callout group.
o
For each well that you want to receive notifiation on make sure AlarmAction is set
for a callout on Hi, Lo and/or Clear (5=16 Hi, 6=32, 7=64 Clear). So for Hi, Lo,
and Clear a value of 112 is used.
o
If you don’t want NodeID to be used in the callout message then set
VoiceNodeID to use something other then NodeID.
To use a pager, open tblSystemParameter and set UsePager = 1
To use xsDialer, open tblSystemParameter and make sure UsePager is set to any value
except 1 (we recommend 0)
To Setup a Custom Alarm Callout:
Open the Configuration tool
Open tblAlarmConfigByPOCType
o
Find or add the Register you want to receive notification on
o
Set Bit = 0
o
Check Description as this is the message with date and time that is sent on
notification.
o
HiLimit and LoLimit should be set to a value equal to 0
Open tblParameters
o
Find or add the Register you want to receive notification on
o
Set StateID equal to a valid tblStates.StateID
Open tblStates and make sure the AlarmPriority for the StateID you used in
tblParameters is set to any value that is not null.
Open tblNodeMaster
o
For each well you wish to receive notification on, make sure StringID is a
reference to a valid StringID in tblStrings and that this is a reference to a valid
callout group.
o
For each well that you want to receive notifiation on make sure AlarmAction is set
for callout on Hi (5=16 Hi, 6=32 Lo, 7=64 Clear) so for Hi, Lo and Clear a value of
16 is used. You can only call out when a state has reached a specific value. Hi is
also used for Set in this case.
131
XSPOC Administrator's Guide
o
If you don’t want NodeID to be used in the callout message then set
VoiceNodeID to use something other then NodeID.
To use a pager, open tblSystemParameter and set UsePager = 1
To use xsDialer, open tblSystemParameter and make sure UsePager is set to any value
except 1 (we recommend 0)
Email Notification Setup
If you are going to be using the Email notification for Alarm Actions on Wells or to Email Morning
Reports then you need to also set up the system configuration parameters for this to function
properly.
Open the Configuration tool
Open tblSystemParameters – if the following parameters do not exist then create them in
this table:
o
SMTPEmail – this is the reply to email. Default is [email protected]
o
SMTPServer – this is the SMTP server to use. Default is smtp.1and1.com
o
SMTPUsername – this is the name to use for authentication on the SMTP server.
If this is blank or omitted then the SMTP Server does not use authentication and
SMTPPassword can be left blank or omitted as well.
o
SMTPPassword – this is used with SMTPUsername for authentication to the
SMTP server.
External Data Query Setup
To setup the External Data Query window, you need to open the tblSystemParameters table in
Configuration and fill in the values for WTConnectionString and WTRecordSource.
WTConnectionString is any valid ADO connection string and WTRecordSource is any valid ADO
Recordset query. When the Recent Well Test window is loaded or refreshed with information,
then the query in WTRecordSource can have pre-defined system keywords that can be replaced
before the grid is populated with data. The predefined system keywords and their replacements
are as follows:
xsnodeid – The NodeID for the currently selected well in the Well Explorer
xsnow – The Current Date
xsotherwellid1 – The OtherWellID value for the currently selected well.
132
XSPOC Administrator's Guide
*Remember that the keywords are case sensitive and must be in the lower case form you
see above.
USAGE: Suppose you have an Excel spreadsheet in which you store your most recent well tests
and you want to let your users see those values from a window inside of XSClient. For example,
suppose your spreadsheet looks like the one shown below:
The first thing you will need to do is make this file available to all of your users on the network. So
you need to move this spreadsheet to a shared folder on one of the network computers. In this
example I chose the XSPOC directory on the XSPOC Server, since we know that directory
should always have a read-only shared permission assigned to it.
The next thing you will need to do is to change the WTConnectionString and WTRecordSource
system parameters. For our example, the settings would look like these:
WTConnectionString:
Provider=Microsoft.Jet.OLEDB.4.0;
Data Source= \\XSPOC-test\XSPOC\welltest.xls;
Extended Properties="Excel 8.0;IMEX=1"
WTRecordSource:
SELECT * FROM [welltest$] WHERE WellID = xsotherwellid1
Remember that the From part of our query is a named sheet in the Excel file. In
our example this named sheet is ‘welltest’ and for the query it must always be
followed by the $ sign. Notice also that we are using a predefined keyword to
replace the xsotherwellid1 with the currently selected Well’s OtherWellID1 value
from the XSPOC database.
133
XSPOC Administrator's Guide
Since our example uses the OtherWellID1 column to identify the currently selected well between
the spreadsheet and XSClient, we will also need to fill in the appropriate OtherWellID1 value for
each well, which we want to display information for in the Well Test window. In our example the
OtherWellID1 value would be the values from the WellID column in the spreadsheet.
If all is successful then we should see the Well Test window display information for our well.
SAM Production vs. Well Test Report Configuration
There is a report for a group of wells called SAM Production vs. Well Test. This report will show
you a comparison between the last entered Well Test in XSPOC with the values for SAM’s Well
Test Values for yesterday. However, to get this report to display properly, you will need to make
some changes to tblParameters for the SAM memory map.
Open the Configuration tool
Open tblSystemParameters – find the following parameters for POCType = 8 and
markeach parameter’s StatusScan box and set CollectionMode to 1:
o
39748 – SWT Oil Yesterday
o
39749 – SWT Water Yesterday
o
39750 – SWT Gas Yesterday
o
Start and stop xsserver.
The information from the SAM controllers will now process during the GetDailyData
Scheduled Event.
You will also need to refer to the SAM User’s Manual in configuring the IPA Parameters under
Programming Inferred Production section.
Setting the Number of Weeks to Store Dynamometer Cards
134
XSPOC Administrator's Guide
By default, XSPOC stores dynamometer cards for 4 weeks. Dependent upon disk storage, space,
and well count, this number can be increased to whatever time period is desired. If your well
count is high and your disk space is limited, 4 or 8 weeks is sufficient.
Users can store any card for a period beyond the erase date setting, as discussed in the User’s
Manual. If hard drive space is not a problem, then storing cards for 12 weeks is not unreasonable.
To change the number of weeks:
Open the Configuration Tool, and click on tblSystemParameters table.
Locate the parameter DeleteCardData
Enter the number of weeks to store the cards in the Value column.
The change will take effect immediately and will affect the number of cards stored when the
DeleteHistoricalData event runs at night.
Well Communication
Add a Port
To add a new communications port, be sure that the serial port is properly configured, and then
open the Configuration Tool and click on the tblPortMaster table. Enter data as provided by your
communications technician, and then click in another box to ensure that the data has been written
to the database. After setting up the new port, you will need to stop and start the server using the
XSPOC Service Manager for the new port to initialize. (See “How To Manually Restart XSPOC
Servers” in this Help file on ways to shut down and restart the server processes.)
135
XSPOC Administrator's Guide
You may then add new wells to the port using the Add Well function in the Main Menu. To
reassign existing wells to the port, edit the port assignments (PortID) under the Controller Tab in
the Well Configuration Screen OR use SSMSE to update the port ID’s in the tblNodeMaster table.
PortID – the number assigned is arbitrary
ServerName – the name of the server if not on the host computer, or an Internet address
if using CDPD (contact your Theta representative for assistance on this)
CommPort – the number indicating the actual serial port number (i.e. serial port 3). For
ports communicating over the internet, this number is arbitrary and can match the PortID
for simplicity.
Enabled – Check the Enabled box to enable port for scanning.
BaudRate – modem baud rate
Parity – parity setting for the radio modem, 0=none, 1=odd, 2=even
DataBits – number of the data bit setting for the radio modem
StopBits – number of stop bits for the radio modem
TimeOut – the amount of time for the host waits for the POC to respond to a data
request, in milliseconds, normal range 2000-5000 ms
KeyUpDelay – the amount of time the radio waits after keying up before sending a data
request, in milliseconds – normal range 250-600 ms
KeyDownDelay – the amount of time the radio waits before keying down after sending a
data read-write request, in milliseconds – normal range 0-200 ms
RTSCTSControl – enables or disables the Ready-To-Send-Clear-To-Receive feature
(usually enabled except for SAM POC’s), 0=disable, -1=enabled
136
XSPOC Administrator's Guide
CTSTimeout – Clear-To-Send Timeout, the amount of time the host computer waits after
sending an RTS before timing out, in milliseconds – normal range 0-20 ms?
Retries – number of times for the radio to resend the data request, after a communication
error occurs
Description – field for description of port (appears in Well Config screen)
WaitForCTS – Check the WaitForCTS box to enable Clear-To-Send feature
PortType – default is 0, for a standard RS-232 port.
o
0 = serial port (most common configuration)
o
1 = Virtual Port (used with wells that have individual IP addresses.See Talk
Directly to TCP/IP Device topic below.)
o
4 = Dialup Modem (See Using Dialup Modem topic below.)
o
5 = Persistent IP Connection (must also populate IP address and port fields)
TurnaoundDelay – default is 0, the amount of time after receiving last data before ending
the next request for data, in milliseconds - normal range 0-100 ms
InterCharTimeout – maximum amount of time allowed between characters within a
package of requested data, in milliseconds – normal range 250-1500 ms
ipHostName – IP address to terminal server device when PortType is set to 5
ipPort – Port address on terminal server device when PortType is set to 5
SuspendDate – disable a port for scanning after a specific date
Talk Directly to TCP/IP Device
If multiple devices are communicating through a single TCP/IP address and port, then the easiest
way to set this up is in the tblPortMaster table. Set the PortType to 5, set the ipHostname to either
the name or TCP address of the device to connect to, and set the ipPort to the port that will be
used to connect to the device.
If each well location has its own IP address, then the location where the device’s address (in the
Well Configuration screen’s address location or the Node column in the tblNodemaster) needs to
be modified according the following syntax:
iXXX.XXX.XXX.XXX|Port|RTU Address
The first letter designates the type of IP connection:
i = typical ip connection
M = Modbus Ethernet with Ethernet bridge
XXX.XXX.XXX.XXX is the IP address
137
XSPOC Administrator's Guide
Port is the IP port
RTU Address is the address from the RTU for the Device
An Example of this would look like this: i192.168.1.15|2101|101
You should also change the Port Type to 1 (Virtual Port) in tblPortMaster for the port that this well
is assigned to. There are a couple of parameters that can be used to help “tune” the TCP/IP
performance. These are located in the tblSystemParameters:
TCPLoopDelay: This controls a time interval to wait while looping during the recption of
socket data. Typical values are 100-500, in milliseconds. Optimum performance may be
obtained by trying different values for this parameter.
TCPConnectTimeout: This controls how long XSPOC waits before timing out when trying
to connect to the remote device.
Using Dialup Modem
1. Open the XSPOC Configuration Tool (Tools Configuration).
2. Open tblSystemParameters and add a new parameter to the table called ModemNumber
(make sure you put the capitalization exactly as shown and no space between the words.) Set the
value of ModemNumber to the phone number of the remote modem.
3. Open tblPortMaster and make sure the CommPort is set to the Com Port that the modem is
using and set PortType to 4.
4. Stop and Restart XSPOC Server. Upon restarting, it should connect modem to modem and
stay connected until you shutdown XSPOC server processes.
Using a Digi Terminal Server
For those who would like to connect over ethernet to a radio from XSPOC, or those who would
like to have more than one host communication over a single radio channel, we recommend the
Terminal Server devices from Digi. A summary of their terminal servers can be found at
http://www.digi.com/products/serialservers/portservertsfamily/
http://www.digi.com/products/serialservers/portserverts#models
138
XSPOC Administrator's Guide
The most basic PortServer TS (model number 70002041) will work just fine if all you need is an
RS232 interface. You can read about the other units. Some have conformal coatings, some are
DIN mounted, some use other interfaces (like RS485), etc. Any one of them will work fine with
XSPOC. We usually use the drivers they provide that make these Digi's look like a local COM
port to the computer. The software driver is called RealPort and it comes with the hardware and
would be loaded onto the XSPOC computer.
If you plan on using a terminal server to serve multiple hosts, you need the IAP model (like
70001777). It supports multi-host connections with many different protocols. For this unit, you will
not be using RealPort for multiple hosts, but you will be connecting directly to TCP/IP ports.
Please contact Theta for more information regarding this configuration.
Scheduled Events
Occasionally, after a power failure or rebooting problem, you may find that XSPOC did not run a
scheduled event. To manually start an event, open the Configuration Tool, and select the
tblSchedule table. The figure shown below is what you will see with one exception: all events
have been disabled except for running XDIAG (because this screenshot is from a demo
database).
The function for each of the table’s columns is self-explanatory. Intervals are measured in
seconds, and represent the time between the end of the last event and the start of a new event.
139
XSPOC Administrator's Guide
To initiate an event, simply delete the current date, and then click in another box to ensure that
the data has been written to the database.
The following list explains the function of each event name. Ensure that you have checked the
enable box for each event you want to run:
Parameter
Description of Parameter
DoScan
Performs Status Scan, collecting alarms and status
CollectCards
Performs the portion of the Daily Scan that collects cards
SetClocks(Baker)
Daily resetting of the clocks on Baker CAC POC's
UpdatePOCData
Perform the other portion of the Daily Scan, collecting runtimes and
other daily statistics
DoSetpointScan
Retrieves setpoints from controllers for the Parameter Change Report
RestoreHistoricalData
Retrieves historical data not collected due to communication problems
PopulateExceptionsTable
Runs queries to populate wells into exceptions groups in the database
GetDailyData
Routine in XSPOC that stores data
ProcessXdiagResults
Enables XDIAG results for viewing in XSClient
UpdateWellDetails
Used for data integration from customer’s database
ClearCommStats
A once a day feature that clears communication statistics
PrintMorningReports
Enables the printing of morning reports
DeleteHistoricalData
Enables the automatic deletion of cards and DataHistoryArchive data
(after set amount of time has expired)
CalculateSPC
Enables the SPC feature for Host Alarming
RunXDiag
Runs analysis on unprocessed cards
BuildXDGFiles
Enables automatic processing of Well Configuration data to build XDG
files on a daily basis
InsertNewWells
Automatically inserts new wells from customer's database (data
integration feature)
FacilityWellControl
Allows system to control well base on facility inputs
ClipFiles
Clips log files to prevent ???
GetGroupData
Not Used
ProcessDynFiles
Retrieves “other” dynamometer files from a specified directory for
processing by XDIAG
ArchiveDataHistory
Archives historical data in another table (internal routine that has no
effect on the functionality of XSPOC)
BackupDB
140
Runs the daily backup task and removes old files from the backup set
XSPOC Administrator's Guide
User Security
XSPOC Security is based on the login name of the user when they login to the Host Computer or
from a computer connected to your network. Every user of XSPOC has read-only access until the
XSPOC Administrator grants them higher level access based on their user login. The XSPOC
Administrator can enter this information into tblUserSecurity within the XSPOC database or once
the XSPOC Administrator login has been setup in the XSPOC database then they can use the
User Security window to facility adding users to the system. To setup User Security the normal
course of events is to add the XSPOC Administrator to tblUserSecurity, start XSPOC under the
Administrator login, and then open the User Security window under the Tools>User Security
menu.
Adding the XSPOC Administrator to User Security
1. Open the tblUserSecurity table in the XSPOC Database using a tool like SSMSE.
2. Add the XSPOC Administrator’s computer/network login name to the table and put a
True in each column of desired privileges and False for privileges not desired.
3. The Administrator would need to close and re-open the application for the changes to
take effect.
Granting Higher Level Access for Users
1. Open the User Security window in XSPOC, which is located under Tools>User Security
Settings in the User Section of the Tools toolbar.
2. If the user does not already exist for higher level access then click New User icon in the
upper left corner of the window and add the user’s login name to the User Name popup
dialog box and enter a password in the Password box (password is not necessary if your
system is configured to use Windows Authentication in tblSystemParameters)
141
XSPOC Administrator's Guide
3. If you have already added the user to User Security then you just select their login name
from the User Name list by double-clicking
4. You grant different levels of access by checking the appropriate levels on the User
Security Settings form and clicking the Save button. If you place your mouse over each of
the level’s labels then this will give you a short description in the tooltip of what access
rights are granted for that level. The user you made changes to will need to restart
XSClient to see the changes to their security settings.
The following table gives an overview for each Security level.
Security Level
Rights
Admin
Configuration; User Security; Load XBAL Files; Entering new
AdHocGroup1, AdHocGroup2, AdHocGroup3, and OpArea names
through Well Config Screen, Controller Tab; Change and Delete
Notes; Setpoint Configuration
Admin Lite
Group Builder
Well Admin
Add Well; Delete Well; Change Well Name; Change Alias on
Group Status Columns; Add New Custom Pumping Units
Well Config
Enable/Disable Wells or Groups of wells; Inputing Other Well
Measurements; Make Changes in Well Config Screen; Add Notes
Well Config Lite
Change the Comment, ProdPotential, RecSPM, or OtherWellID1
values for wells in Group Status; Add Comment Notes
Well Control
Set the Base Card of a AE POC; Set the Idle Time on a POC; Set
the Integration Start, Duration, and Limit values; Change Card
Constraint Value; Change Fill Base Line; Change High or Low
142
XSPOC Administrator's Guide
Security Level
Rights
Limit; Enable/Disable Facilities; Action Commands for Group
Status; Put Well into Constant Run Mode, POC Mode, or % Timer
Mode; Use the POC Panel; Clear Alarms; Start, Stop or Idle a well;
Recalculate Normals; Set Control Parameters (Setpoints Screen);
Set POC Clock; Use Register Panel to Write to POC
Limit User Navigation to a Group
By default, XSPOC will show all groups and wells to all users on the system. However, you may
want to limit the amount of groups and wells that a particular user can see or have access to on
the system. To do this you first need to determine which group on the Well Explorer you want to
have set up for users. A common configuration is to make a group based on operator
identification. This group can either be a Parent Group or a Well Group. If you make the User
Group a Parent Group then you can place more then one Well Group under their Parent Group
folder so you can have Well Groups based on exceptions as well as a Well Group that will show
all of their wells.
Secondly, you need to enter a record for each user you wish to limit into User Security. The User
Root drop down list selection determines how much of your Well Explorer is visible to each user.
The default User Root for all users is Well Groups and this indicates that this user can see all of
the groups in the Well Explorer. To limit a specific user to a group just select that group from the
User Root drop down list and click on Save.
143
XSPOC Administrator's Guide
Morning Reports
XSPOC can be configured to print any of the pre-defined group reports or a Group Status View
for a specific group, each day, at a specified time (preferably just before field personnel arrive at
the office).
The number of pre-defined report formats is limited to Global Group Names in the Group Status
Screen. Names must appear exactly as shown in Group Status
To configure a report for automatic printing,
Open the Configuration Tool and select the tblMorningReports table.
In the ReportName column, enter the name of the report you want printed for a group of
wells. The name of the report is entered exactly as shown in the list above. If you are
using a Group Status View for a morning report then make sure that the Group Status
View is a global view and you type the name of that view exactly as it was saved.
In the GroupName column, enter the name of the group you want the report printed for.
The name of the group must be entered exactly as it is listed in the Well Tree (or
WellGroups table in the database).
The destination can be a local printer, a network printer, an HTML format file, an Excel
spreadsheet, an Acrobat file, a Rich Text file, or an email with the report attached as an
Acrobat file. Use any one of the following conventions for a printer in the Destination
column.
o
Entering “default” will tell XSPOC to print the report to the default printer as
defined in the Windows setup on the server.
144
XSPOC Administrator's Guide
o
To print to a printer located on the local network, enter in the name of the printer
as defined in the Windows setup on the server.
o
To print to other printers on the network, enter the UNC location for the printer.
For example - \\machine name\printer name\).
o
To print to an HTML format file, enter the path and the name of the file. For
example - \\web\filename.html.
o
To email a report in pdf format, just set up the SMTP system parameters and
then put in the email address in the Destination column. For example –
[email protected]. See the section on Email Notification Setup earlier in this
manual.
o
To print the report to an Excel file, include the location and file name for the
report with the xls extension. For example – C:\MyReports\MorningReport.xls.
o
To print the report to an Adobe Acrobat file, include the location and file name for
the report with the pdf extension. For example –
C:\MyReports\MorningReport.pdf.
o
To print the report to a Rich Text File, include the location and file name for the
report with the rtf extension. For example – C:\MyReports\MorningReport.rtf
To enable this feature, check the box in the Enabled column.
After entering your morning report setup, check that the parameter PrintMorningReports
is enabled and a PortID of 99 for XSPOC version 1 and 100 for XSPOC version 2 under
tblSchedule.
When the time found in the PrintMorningReports parameter is reached on the server’s
clock, XSPOC will print the report(s). To test the feature, delete the LastStartExecute
Date and commit the change by clicking off of the row. After refreshing the table, you
should see the LastStartExecuteDate change to a more current date and time.
If you need more than one PrintMorningReport time then you can setup a
PrintMorningReports2 and PrintMorningReports3 scheduled events. This will allow you to
print the Morning Reports more than once a day.
Group Configuration
Group Builder
OVERVIEW: The Build Well Groups window allows the user to define new well groups that
display in the Well Group Explorer.
145
XSPOC Administrator's Guide
NAVIGATION:
From the Main Client window:
1. Click on the Group menu.
2. From the Tools Section, click on the Group Builder menu icon.
FEATURES: The Group Builder window allows the user to build their own well groups that will
display in the Well Group Explorer. When the Group Builder window is displayed it already has
the query of the selected group displayed. You can change this query and Save it to modify the
currently selected group or change the Group Name and Save it to create a new well group.
Group Builder Top Toolbar
New Group – in the upper left corner of the Group Builder toolbar clears out the SQL
window and the Group Name. Type the name of the new Well Group into the Group
Name text box.
Save - saves this new query to the database, effectively creating this new group
Delete – removes the group from the Well Explorer
Group Builder Side Toolbar
Execute SQL Statement – tests the query against the database and populates results in
the Preview pane below the filter field
Clear SQL Query – clears the current query.
Undo – restores the last action taken.
Redo – repeats the last action taken.
Group Wizard – Table/Column wizards to create groups.
146
XSPOC Administrator's Guide
Facility Configuration
Facilities are configurable nodes in XSPOC that allow you to pull in data from RTU’s, PLC’s, or
any other devices that use the Modbus or Allen-Bradley DF1 protocols.
If the input is only on one well or on some of the wells, or if the input is different from well to well,
or if the same input on different wells have different scaling factors, then the Facility Tags
Configuration tool can be used to configure these tags. Select the device you want to set up tags
for and then choose Facilities>Facity Tags to display the Facility Tags screen.
To configure a tag you need to type in the information on the General tab. The Enabled option
lets XSPOC know if this register should be scanned when polling of this facility occurs. The
Writable option lets XSPOC know if this register can be written to. The Group Status Column
option will show this register in the Group Status View configuration tool. Limits are settable
alarm limits for this register and scaling allows you to scale the raw value that XSPOC retrieves
from the controller.
147
XSPOC Administrator's Guide
To set Alarm Actions for this register you need to select the Notification tab.
148
XSPOC Administrator's Guide
The Notification tab allows you to set up E-mail, Call or Page, and Shutdown/Restart actions. The
text that appears in the Facility Status window and what is sent out for a call, page or email is
what text you type into the box. You can also set up the Email and Dialer contact groups through
this configuration. Remember, to set up the contacts you have to have xsDialer installed and
configured and/or Email setup. Contact Theta in regards to these forms of callouts.
To set up an Email Contact Group or Dialer Group click on the Edit button in each box to get the
appropriate group configuration tool. Clicking on the Email Contact Group Edit button opens the
E-mail Contact information window. From here you can add a New Group by clicking on the
Green plus icon toward the top left hand side, as well as edit or delete existing contacts and
groups. The E-mail Contact window displays existing groups on the left and has two tabs. The All
tab will display all the contacts that are in XSPOC. The Selected tab displays all the contacts
selected to be in this group. Contacts can also be Added, Edited, Saved and Deleted by clicking
on the icons on the upper right side of the window. There is also a Cancel icon to cancel any
changes that were made, but not wanted.
After clicking on the New Group icon, The Contact Group window opens where you can type in
the New Group Name. You can select members of this group by checking the box next to the
contact’s name. Click Save to save the new group.
149
XSPOC Administrator's Guide
New contacts are added by clicking the green new contact icon on the upper left hand side and
filling in the contact information and clicking save. This saves the contact to the All tab and adds
the contact to the selected Group.
150
XSPOC Administrator's Guide
A contact can be removed from a group by deselecting the box next to their name on the All tab,
or by clicking on theccontact on the Selected tab and then clicking the Remove Contact From
Group icon.
A contact can be deleted from the group and contact list by selecting the contact and clicking on
the Delete icon on the upper left hand side of the Contact Information window.
151
XSPOC Administrator's Guide
The Shutdown/Restart section can be applied to a group or an individual well. Check the boxes
you want the group or well to respond to and select the group or well radial icon. Next select the
group or well from the menu.
Select the Execute custom script on alarm state change, and the Beep on alarm boxes at the
bottom of the window, to enable those actions. Contact Theta if you are interested in using either
of these options.
Ensure you save any changes you have made to the Facility Tags Configuration screen before
closing it.
152
XSPOC Administrator's Guide
An alternate method is to use the Configuration Tool and configure the tags in tblFacilityTags. A
new row needs to be added to this table to define the register. Here are the columns of interest
and how to use them:
These columns are changed by the user and the ones in bold must contain a value:
NodeID: The NodeID (usually the well name) for the well that the input is associated with.
Address: The register that specifies the memory location for the item. This can be a
modbus address like 30001 or it can be an AllenBradley memory location like N5:13.
Bit – 0 for the whole register or insert the appropriate bit number
Description: Description of the item, like “Tubing Pressure.”
TrendType:
o
0 = no trending
o
1 = trending enabled with data storage in tblFacilityTagHistory (3 for backwards
compatability)
o
2 = trending enabled with data storage in tblDataHistory (use if tag is associated
with a well instead of a facility)
Enabled: check the box to enable scanning.
RawLow/RawHi – The values we expect to see coming from the controller.
EngLo/EngHi: These define how the raw value is scaled. If no special scaling is required,
then the EngLo needs to match RawLow and the EngHi needs to match RawHi (like
RawLo=0, RawHi=9999, EngLo=0, EngHi=9999).
EngUnits – user defined description of the units like psig, ft, or °F.
LimitLo/LimitHi: These define when the alarm points are tripped. If you do not wish to trip
Lo or Hi, then just set the value to be outside the range of the expected values.
Writeable – checking and deselecting this box enables or disables writing back to the
controller’s register from the facility status grid.
GroupNodeID: This allows this input to be associated with a different NodeID, but will
usually be set to the same as the NodeID column. If there is a need to associate this
tag’s data with a different NodeID, this column will contain the NodeID of the associated
153
XSPOC Administrator's Guide
facility or well. For example, historical storage of data will be based upon the name
contained in the GroupNodeID.
Display Order – allows you to change the order that the facilities are displayed.
AlarmAction - Alarm actions allow certain actions to be taken when an alarm point is
tripped. The value in this column is determined by what bits are “set”:
o
1(LSB) = 1: shutdown group if hi alarm
o
2 = 2: shutdown group if lo alarm
o
3 = 4: restart wells if condition clears
o
4 = 8: execute custom action script if alarm state changes
o
5 = 16: dial out/page if hi alarm
o
6 = 32: dial out/page if lo alarm
o
7 = 64: dial out/page if condition clears
o
9 = 256: run xsbeep program on main console to notify of alarm
o
10 = 512: dial out/page on com fail
o
11 = 1024: dial out/page on com return to normal
As an example, if you wanted XSPOC to shutdown wells when the monitored value
reaches the HiLimit, and you want the wells to restart after the condition clears, you
st
rd
would set the 1 bit (value=1), and you would reset the 3 bit value=4), and so you
would put a value of 5 in the AlarmAction column. The values are provided here to
make this easier – just add the values together to arrive at the total value to use.
If you use the shutdown or restart options then make sure the FacilityWellControl
Event in tblSchedule is enabled.
WellGroupName - The name of the well group to start or stop. This must be configured if
using well control actions in AlarmAction.
PagingGroup - If using alphanumeric pagers, this is the name of the PagingGroup.
AlarmArg – is used to pass in arguments for alarm action scripts. Contact Theta for more
details.
AlarmTextLo/Hi/Clear - This is the text that will appear in the alarms column of the facility
status screen, depending on the state of the alarm.
GroupStatusView – Set this to true (-1 or 1) if you want to display the analog input’s value
on the group status. This makes it available when customizing the group status view
under the tblFacility branch.
ResponderListID - If using telephone voice call-outs, this is the notification list to be used
when an alarm occurs.
154
XSPOC Administrator's Guide
VoiceTextLo/Hi/Clear - This is the message that will be heard when the call-out system
calls the user, depending on the state of the alarm. Make sure if you have more than one
device monitoring the same register, to include the name of the device or well in this
message.
DataType: This defines how the raw values need to be converted and displayed. These
are available in the tblDataTypes table, but are defined here for you:
o
1 = discrete for (0XXXX and 1XXXX modbus registers)
o
2 = integer (for 3XXXX and 4XXXX modbus)
o
3 = float (IEEE),
o
4 = float (modicon)
o
5 = baker time
o
6 = baker date
o
7 = modbus long
o
8 = float (IEEE reverse)
o
9 = time (seconds since midnight 1/1/1970)
o
10 = BCD
o
11 = Unico Long
o
12 = Pickford Long
o
13 = AB Timer
o
14 = Integer Signed
o
16 = Time (DJAX)
o
17 = Date (DJAX)
o
19 = Long (Enron)
o
20 = Float (Enron)
o
21 = Date (Enron)
o
22 = Time (Enron)
o
23 = Trend (FB)
o
24 = Long (Signed)
o
25 = Long (BCD)
Decimals: Number of decimal places to show in XSPOC, and is 0 by default.
VoiceNodeID - By default, the NodeID for the tag is used as part of the call-out message
for a facility on communications status messages and for modbus devices on
communication status and Well Shutdown messages. If this column is populated, it will
be substituted in place of the NodeID. This may be desirable if the pronunciation of the
NodeID is not satisfactory. A more phonetic spelling can be used here.
155
XSPOC Administrator's Guide
These columns are used by XSPOC and should not be filled in by the user:
CurrentValue – last value retrieved from the controller
UpdateDate – the time and date the CurrentValue was retrieved from the controller.
AlarmState – this is set when the CurrentValue is retrieved and compared against LimitLo
and LimitHi and will contain one of the following values:
o
0 = Clear
o
1 = High
o
2 = Low
Topic – is no longer used by the system.
If you do not have a group for Facilities in the Well Group Explorer then you will need to add one.
Open the Admin Configuration utility and under the Well Groups tab add the following entry to the
SQL Text:
SQLText = SELECT tblNodeMaster.NodeID, tblWellDetails.DownReasonCode FROM
tblNodeMaster LEFT JOIN tblWellDetails ON tblNodeMaster.NodeID =
tblWellDetails.NodeID WHERE POCType=101
You will also need to set the following columns as well:
GroupName = Facilities (or any other name that will identify the Group of Facilities)
ParentGroupName = root (usually this is set to root but can be any parent group as well)
FacGroup = 1 (this must be set for a facilites group)
System Configuration
XSDialer
Overview
This outlines the architecture and configuration of the XSPOC Dialer/Notification system. The
XSPOC Dialer/Notification system is composed of three essential parts: the governing XSPOC
Dialer/Notification service (XSDialer.exe), the Phone Notification Session (DialerSession.exe),
and the Radio Notification Session (RadioSession.exe). Working together the three modules
sequentially notify responders about events that occur within the XSPOC system.
156
XSPOC Administrator's Guide
The XSPOC Dialer/Notification service runs as a NT-service and is capable of functioning without
interaction with the desktop or having to physically log-in to the workstation or server. This
queries for active events that have been enabled for notification; these events are populated in
the tblDialerLog table in the XSPOC database. In addition to querying for active events, this
service is responsible for capturing configuration parameters and applying those parameters
throughout the service. Any changes to the configuration parameters will necessitate a restart of
this service. This service uses the Phone Notification Session and the Radio Notification Session
modules to facilitate responder notifications.
The Phone Notification Session selects the telephony device, synthesized voice, and playback
device and also performs a telephone call-out, in which the notification message is played and a
prompt to acknowledge the event is issued. The Phone Notification Session is a standalone
application which receives control information from the XSPOC Dialer/Notification service. Data
is passed to the Phone Notification Session by XML file found in the (\sessions) directory.
The Radio Notification Session connects to the control port of the RigBlaster for RTS control, and
plays notification messages through the sound card, which is connected by stereo or mono output
to a radio system. The Radio Notification System uses DirectSound for playback because it
allows sound to be played when the user is not logged into the workstation or server. The Radio
Notification Session is a standalone application which receives control information from the
XSPOC Dialer/Notification service. Data is passed to the Radio Notification Session by XML file
found in the (\sessions) directory.
Configuration
Once xsDialer is installed it is important to modify the following configuration parameters:
Parameter
DialerAckCode
Location
tblSystemParameters
DialerGlobalAckCode
tblSystemParameters
DialerModem
tblSystemParameters
Info
Specifies the digit-string used to acknowledge
reception of call-outs.
Values: Numeric digit-string e.g. 1234
Default: None
Specifies the digit-string used to acknowledge
ALL call-outs.
Values: Numeric digit-string e.g. 1234
Default: None
Specifies the modem that is in use for dial-out
voice notification.
Values: DialerModem are: HiPhoneUSB,
HiPhoneRS232, Creative and Zoom.
Default: Zoom
157
XSPOC Administrator's Guide
Parameter
DialerTimeout
Location
tblSystemParameters
DialerVoice
tblSystemParameters
DialerVoiceRate
tblSystemParameters
DatabaseName
XSDialer.exe.config
DatabasePassword
DatabaseUser
DialerRadioNumber
XSDialer.exe.config
XSDialer.exe.config
XSDialer.exe.config
DialerWaitTime
XSDialer.exe.config
KeyStorePath
XSDialer.exe.config
LicenseFilePath
QueryDelay
XSDialer.exe.config
XSDialer.exe.config
ServerName
XSDialer.exe.config
CommPort
RadioSession.exe.config
TimesToRepeat
RadioSession.exe.config
WaitTimeAfterKeyUp
RadioSession.exe.config
WaitTimeBeforeKeyDown RadioSession.exe.config
DialerModem
158
DialerSession.exe.config
Info
Specifies the amount of time (in minutes)
allocated for a call-out, this time includes: time to
dial, time to play voice notification, and time to
acknowledge.
Default: 2
Specifies the synthesized system voice to use
when playing the notification message.
Values: Depend on voices available on the
machine (e.g. Microsoft Mary, Microsoft Mike,
Cepstral Frank).
Default: Microsoft Mike
Specifies the rate at which the synthesized voice
notification is played.
Values: -10 to 10.
Default: 0
Specifies the name of the XSPOC database that
contains notification records to be processed.
Default: XSPOC
Specifies the database access password.
Specifies the database access user.
Identifies a notification request as a radio call-out
versus a phone call-out.
Default: 10001
Specifies the time to wait (in seconds) before a
calling out for a given voice notification. Enables
applications such as the XSPOC Alarm monitor
to acknowledge a notification event before the
actual call-out.
Default: 0
Specifies the path the key store for license
authentication.
Specifies the path to the license file (license.tlf)
Specifies the time (in seconds) between queries
for new notification requests.
Default: 10
Specifies the server name used to establish a
connection with the database.
Specifies local communication port which has the
RigBlaster radio controller. (For KeyUp/KeyDown
control through RTSControl).
Specifies the number of times to repeat the radio
notification message
Specifies the time (in seconds) to wait after
keying up (enabling RTS).
Default: 1
Specifies the time (in seconds) to wait after
keying down (disabling RTS).
Default: 1
Specifies which modem to use when the Override
property is set to True and corresponds to the
device enumeration found in the device.log.
Default: 0
XSPOC Administrator's Guide
Parameter
DialerSound
Location
Info
DialerSession.exe.config Specifies which audio playback device to use use
when the Override property is set to True and
corresponds to the playback device enumeration
found in the device.log.
Default: 0
DialerSession.exe.config Specifies which synthesized voice to use when
the Override property is set to True and
corresponds to the voice enumeration found in
the device.log.
Default: 0
DialerSession.exe.config Forces the Phone Notification Session
(DialerSession.exe) to use the DialerSound,
DialerVoice, DialerModem overrides specified in
the DialerSession.exe.config file.
Values: True or False
Default: False
DialerVoice
Override
Anytime these configuration parameters are modified, the xsDialer service needs to be restarted.
It is important to create Responder Lists and Responders to handle the callouts that xsDialer will
perform. When a scan is performed on a well and that well has been setup to perform callouts for
communication failures, facility tag limits, or well shutdowns, then tblDialerLog will have an entry.
The xsDialer program periodically checks this table and when it sees a new entry it performs the
callout to the specified responder list. Every time a callout is made, xsDialer writes to the
tblDialerLogDetails table and each entry contains one of the Result Codes listed below:
The result codes in the tblDialerLogDetails table:
-1 = call started
0 = ackcode correct
1 = bad ackcode entered
2 = line busy
3 = timeout
4 = no dial tone
5 = remote party disconnect
This allows you to know when a callout was acknowledged or why the callout was not received or
acknowledged.
To enable xsDialer to use the callouts setup for each well you will need to add responders to the
system and relate them by groups. By grouping your responders, you allow xsDialer to call
several users on the specified condition. First, you should add responders to the system. Open
the Admin Configuration Window. From the list of tables, choose tblResponders. In this table the
159
XSPOC Administrator's Guide
phone number for each entry needs to be unique and you can add the persons first and last
name to the entry. Once you have all your responders listed, navigate to tblRespondersList. This
table is used to set up logical groups that will be used on a callout. In tblRespondersList only the
ResponderListID column has to contain a unique value. Finally, from the list of tables, choose
tblRespondersListRel. This table allows you to relate your responder groups to your responders.
The ResponderListID is one of the ResponderListID’s from tblRespondersList and Phone is one
of the Phone entries from tblReponders. Relating your responders in this fashion allows you to
include a responder in more then one group and to tailor the list of who gets called when the
system needs to callout.
In summary, here are the following tables and the columns that need to be populated so that
xsDialer will know whom to call if the system should need to do a callout. The columns that are
bold need to contain a unique value for that table.
tblResponders – (A list of all responders)
Phone (enter a unique phone number)
FName (enter first name)
LName (enter last name)
tblRespondersList – (This is a list of each callout group)
ResponderListID (enter a unique number for each list)
Description (enter a description of the list, like 'Route 1')
tblRespondersListRel – (This table relates phone numbers to the lists, so it tells us which phone
number is on which list)
ResponderListID (the unique list number entered above)
Phone (the phone number of the person on the list)
Order (the order in which this phone number is called)
How to Setup Callouts for xsDialer
Facility Tags Callouts
Recall that a Facility Tag can be associated with a Facility or can be associated with a Well. So if
you want to setup a callout for a register value in a POC you need to set up an associated Facility
160
XSPOC Administrator's Guide
Tag for that Well and the register. So regardless of the type of POC you have on a well, you can
setup xsDialer to notify you when a register’s value is high, low or clear. See Facility
Configuration and Add an Analog Input in this Help manual for instructions on setting up a Facility
Tag.
To setup the callouts for when the Current Value passes a limit high or a limit low, you need to
populate tblFacilityTags.LimitHi and tblFacilityTags.LimitLo columns. You also need to set the
tblFacility.AlarmAction bit 5 for a high limit, bit 6 for a low limit, and bit 7 for when the current
value is no longer above the high limit or below the low limit. The tblFacilityTags columns
VoiceHiText, VoiceLoText, and VoiceClearText must also be set. If you have more than one
device monitoring the same register, make sure that you include the device identification in these
columns. The callouts on high, low and clear use what is in the VoiceHiText, VoiceLoText, and
VoiceClearText with the system parameter, Preamble, added to the beginning of the text in these
columns, as the message for the callout. The callouts only occur when there is a status change
(i.e. CurrentValue goes past LimitHi, CurrentValue goes from violating the LimitHi back to within
normal range, etc.) If you want a callout to happen every time a status scan returns a violation of
LimitHi or LimitLo, instead of when there is only a change in status, then you need to set the
system parameter, CallOutPersistent = 1.
Well Shutdown Callout
On modbus devices a Shutdown callout can be set up so that whenever a status scan returns a
Shutdown of the well the appropriate users are notified. This will not include any status scan that
returns a Shutdown:User code. For the well you want to callout on Shutdown,
tblNodeMaster.StringID must refer to a valid record in tblStringPagers.StringID. In tblStringPagers
you need to specify if the callout is to be performed on the Weekday, Weekend or both by setting
the appropriate columns to 1. The PagingGroup is the same ID from the
tblResponderList.ResponderListID that you want called when the well shuts down.
Third Party Operations
Manual Poll and Well Control of XSPOC Wells From Another Program
Many of the manual well control and polling operations that you can perform on a well from the
XSClient interface can also be accomplished through other programs. This is accomplished by
writing an entry to the tblTransactions table in the XSPOC database. The following columns need
to be populated in order for this to occur:
161
XSPOC Administrator's Guide
TransactionID: This needs to be a random number up to one billion
NodeID: The name of the well in XSPOC that you want the function to be performed on.
PortID: This is the PortID number for the well’s communication channel
InputText: This is a number from one of the choices below:
1 = Start Well (and clear alarms, if necessary)
2 = Stop Well
3 = Idle Well
4 = Clear Alarms
5 = Constant Run Mode
6 = POC Mode
7 = % Timer Mode
8 = Scan Well
9 = Set Clock
Task: Use the task “Well Control” for this column.
Source: (Optional) This should be the name of the 3 Party Program or process you are
rd
using to write to this table.
After inserting the record, it gets processed by XSPOC Server and the DateProcess column in
tblTransactions will have the date and time that this function was performed.
Frequently Asked Questions
1. Users are complaining that they cannot get analysis, what should I check?
If the problem is only happening on some wells, there is usually a problem with that well’s
data that is preventing it from running. From the client’s Well Configuration screen, review
all of the equipment data to make sure that all the proper data has been provided.
If the problem appears to be global, and none of the wells are being analyzed, there are a
few things to check:
1. Go the XSPOC\logs directory and open the log named task_analysis.log. The
bottom of that file should contain a current timestamp. If the time stamp is not
current or recent, try restarting the XSSchedServer service using the XSPOC
Service Manager in the system tray.
162
XSPOC Administrator's Guide
2. If this still does not fix the problem, there may be a problem with the installation
of .NET, or some other configuration issue. Contact Theta Enterprises for more
assistance.
2.
Why don’t I see my xsScannerL and xsCommServer icons in the system tray?
There are four possibilities:
1. The xsServer service is not running. Check the XSPOC Service Manager to
make sure that the xsServer service is running.
2. If the services have been last started during a reboot, you will not always see the
icons. That usually happens when the XSPOC services start before anyone can
log into the console. To see them again, the user can stop and restart the
xsServer service. Remember, in this scenario, not seeing them does not mean
they are not running. If you look in Task Manager you will see they are running
even though the icons are not present.
3. The xsServer service may not be using the system account for its log on. There
are reasons that it may be configured this way, but the icons will never appear in
the system try when a service runs under a network account because interaction
with the desktop is not allowed.
4. If you are using Windows Vista, 7, Server 2008 or Server 2008 R2, the
processes will not be visible in the system tray. They will be visible in the Task
Manager.
3. Are errors that might be causing problems on the server logged anyplace?
Yes, there is a file in the “XSPOC\logs” directory where the xsClient has been installed
that records any errors that the client or server application may generate. The file’s name
is xserror.log. This file may be useful for Theta to look at, and they may request that this
file be e-mailed to them for review.
4. Can I use an OPC Server to provide communications services to XSPOC?
Yes you can. Among other things, OPC allows multiple hosts to share a communications
channel. The disadvantage is that some level of configuration has to be done in both
XSPOC and the OPC server when adding or configuring wells. XSPOC is an OPC client,
and it uses “device read and write” capabilities within OPC to provide this. It also relies on
163
XSPOC Administrator's Guide
the OPC server to provide dynamic tag specifications, where the item uses a generic
format to provide the data. As an example, most OPC Servers with Modbus capability
provide a way to request an item from a device using the Modbus address, like
“server.device.40001” to read address 40001. Please contact Theta for more assistance
to set this up if you have this need.
7.
Can I share a communications channel between XSPOC and another host
(WonderWare, other SCADA systems, etc)?
Yes. There are various techniques to do this:
OPC: As discussed above.
Hardware (serial): Calta Computer Systems located in Canada provides a hardware
device that allows synchronization of two or three hosts systems that use typical
master/slave protocols (Modbus, AB, etc).
Hardware (TCP/IP): Some terminal servers only support one listening socket, and
hence, one remote connection. Digi sells a special terminal server than allows
multiple simultaneous connections, but it can only be used by standard Modbus.
Software (TCP/IP): There are software solutions that allow multiple connections, and
multiplexing to a TCP/IP device (terminal server), where the terminal server only
provides one connection. In this scenario, the software is provided the coordination of
the data packets.
8. How do I troubleshoot communications problems?
This is a question that could take an entire book to answer, but here are some guidelines
and suggestions:
All of the following has to be setup correctly, with matching values between all
equipment: Baud Rate, Parity, Stop Bits, valid cabling, proper device address, sufficient
radio signal strength, power at remote device, etc.
Global/Single Device: If the problem is global for a particular channel, it points to a
problem on the master end. If it is on just one or some of the wells, it points to a problem
on the remote end.
164
XSPOC Administrator's Guide
CRC Error/Timeout: “Timeout” errors happen when the remote device does not respond.
This can be caused by a power outage at the remote end, bad addresses, or by a
complete failure of the communications equipment. “CRC Error” happens if the remote
device responds, but the return message has some errors. This is usually caused by
inadequate signal strength, or bad timing parameters on the communications equipment.
Key Up/Key Down Delays: In many modern radio systems, keying up and down is no
longer needed. But on older licensed frequency channels, it is still necessary. Like
transmitting voice over a radio or a CB, you need to press the mike button a little before
you start talking (key up delay), and hold it a little while after you end speaking (key down
delay). There are key up and key down settings on both the master side and the remote
side (set with the RTU/POC). Key Up delays are typically from 50-500 ms. Key down
delays are typically shorter, ranging from 25-150 ms. Communication timeout errors may
be caused by too short of a Key Up or Key Down delay on the host. CRC Errors can be
caused by too short of a Key Up or Key Down delay on the remote side and can also be
caused by to long of a Key Down delay on the host side. In setting the remote delays, it is
often helpful to examine the raw data packets coming from the remote device (if the
beginning of the return packed is clipped, this is caused by too short of a Key Up delay, if
the end is clipped, too short of a Key Down delay.) Usually, some trial and error exercises
need to be used to find the optimum settings. The strategy should be to set all of these
delays to be as short as possible, while still allowing communications success. One
approach might be to set these near the high end of the range and then bring them down
until failures happen, and then bump them up slightly. Each one should be tuned on its
own, one at a time.
9.
I see columns in the database that are named “Locked”. How do these work?
Because much of the XSPOC database is user configurable, we have to be very careful
that our service packs do not overwrite changes that our user’s make to the database.
Where it makes sense, many tables in the database contain this flag which lets us know
that we should not update or delete that particular row. If the “Locked” column is marked,
we do our best to avoid any future modification to that row.
10. Some of the tables I might modify contain ID’s, does Theta want me to use certain
values for these?
165
XSPOC Administrator's Guide
Theta has reserved certain ID’s for future use, and allows customers to use other ranges
that are reserved for them. Contact Theta if you are unsure which IDs are reserved in a
particular table or column.
11. How can I monitor and meter the amount of power (Kilowatts) consumed at each of
our wells?
XSPOC has the capability of calculating power consumption and can probably get within
about 5%-10% of actual power, provided that accurate input data is provided, including
counterbalance data. XSPOC calculates torque, and then calculates power requirements
based on motor torque curves. There are some frictional losses in the gearbox and belts
that are not considered, so the accuracy will not be perfect. Customers who have
compared our calculations to actual meter measurements tell us they were happy with
the accuracy for their purposes (probably within 10%).
If you need more accuracy than this than you should install an actual power meter device
that accumulates delivered KWH. Depending on the output or communications ability of
the device this information could be sent into XSPOC.
166
Appendix
Appendix
Session
Each time XSPOC Client is started up, you have begun a “session” and after closing the program,
you have ended the "session”. You are prompted for the control passwords only once per session.
Therefore, you will not be prompted for the password again during that session and any additional
changes that you make will be written to the database and/or sent to the POC.
Data Entry
When entering or editing data, it is important to remember to click the cursor on an area out of the
box or field after editing or entering a value (preferably another field), otherwise the change may
not be written to the database. This applies to all windows where data is input.
Run States
The following table is an example of the different Run States that can appear on group status.
Because each controller type can have different status descriptions and meanings, the user is
encouraged to contact the manufacturer of his particular controller. As an example, the following
run states and their descriptions apply to the MPC controller from Lufkin Automation:
Alarm
Description of Problem*
The POC is trying to start the pumping unit but does not see dynamic load
and position signals to confirm that the unit is actually
Idle: StrtFail
pumping. Conditions such as drive belts thrown off, motor overloads
tripped, or operator selection of H-O-A position would lead to this Well
State.
The POC has lost the programmed parameters and has therefore returned
Loss Prog
to default conditions. Check that the battery jumper is properly in
place. Replace battery if problem re-occurs.
The POC has detected a problem with the position input. In the event of an
Running: ATF
analog position signal input problem, the POC reverts to a secondary
control method of internal percent timer. The well is cycled off/on using
the programmed Downtime and the % Run for the previous 24 Hours.
Running: HOA
Well State only when digital inputs are wired to contacts on the H-O-A
167
Appendix
Alarm
Description of Problem*
switch and programmed for Hand and Auto use. Requires the use of two
digital inputs. Indicates that the H-O-A switch has been set to a position to
override well control by the POC.
The POC does not like the load input signal. In the event of a load signal
Running: LCF
input problem, the POC reverts to a secondary control method of internal
percent timer. The well is cycled off/on using the programmed Downtime
and the % Run for the previous 24 Hours.
The check during the Stopping Unit Well State continued to see dynamic
Running: SpFail
load or position after the maximum allowed Stopping Unit time of 3
minutes and thirty seconds. Operator should check the position of the HO-A switch.
The Low RPM Allowed Limit has been violated and the POC has
successfully stopped the pumping unit. The POC will start the pumping
unit after the programmed Downtime elapses. If the Low RPM violation
Shutdown:
was due to a transient well bore condition, the consecutive malfunction
LoRPM
counter will be cleared, and normal operation will continue. If the Low
RPM violation occurs repeatedly for the number of Consecutive Allowed
violations, the POC will arrive at Malf/Low RPM well state. The pumping
unit will stay down until a Re-Set Malfunctions is done by the user.
The Min. Load Allowed Limit in the Surface dynamometer has been
violated and the POC has successfully stopped the pumping unit. The
POC will start the pumping unit after the programmed Downtime
elapses. If the Min. Load violation was due to a transient well bore
Shutdown: ML
condition, the consecutive malfunction counter will be cleared, and normal
operation will continue. If the Min. Load violation occurs repeatedly for the
number of Consecutive Allowed violations, the POC will arrive at
Malf/Minimum Load well state. The pumping unit will stay down until a ReSet Malfunctions is done by the user.
The Malfunction Setpoint in the dynamometer card has been violated and
the POC has successfully stopped the pumping unit. The POC will start
the pumping unit after the programmed Downtime elapses. If the
Shutdown: MSP
Malf/Setpoint violation was due to a transient well bore condition, the
consecutive malfunction counter will be cleared, and normal operation will
continue. If the Malf/ Setpoint violation occurs repeatedly for the number
of Consecutive Allowed violations, the POC will arrive at Malf/Setpoint well
168
Appendix
Alarm
Description of Problem*
state. The pumping unit will stay down until a Re-Set Malfunctions is done
by the user.
The programmed logic expression has been proved True and the POC has
successfully stopped the pumping unit. The POC will start the pumping
unit after the programmed Downtime elapses. If the Logic Expression
violation was due to a transient condition, the consecutive malfunction
Shutdown: OL
counter will be cleared, and normal operation will continue. If the Logic
Expression violation occurs repeatedly for the number of Consecutive
Allowed violations, the POC will arrive at Malf/Logic well state. The
pumping unit will stay down until a Re-Set Malfunctions is done by the
user.
The Peak Load Allowed Limit in the Surface dynamometer has been
violated and the POC has successfully stopped the pumping unit. The SAM
Well Manager will start the pumping unit after the programmed Downtime
elapses. If the Peak Load violation was due to a transient well bore
Shutdown: PL
condition, the consecutive malfunction counter will be cleared, and normal
operation will continue. If the Peak Load violation occurs repeatedly for the
number of Consecutive Allowed violations, the POC will arrive at Malf/Peak
Load well state. The pumping unit will stay down until a Re-Set Malfunctions
is done by the user.
Statistical Process Control
SPC stands for Statistical Process Control and is a method of using historical data to determine
when a process is no longer operating within its normal parameters.
XSPOC uses SPC to help find when runtime, cycles and other parameters are operating in an
abnormal fashion. By using SPC, upper and lower control limits are established on the parameters
that define a normal operating range. When the given parameter falls outside of the normal range,
the system can alert the user to this abnormal condition through exception groups and alarms.
SPC uses a calculation involving standard deviation, which looks at the amount of change
between consecutive data points.
SPC is a much more efficient way to find system problems than the old method of manually
setting these limits. SPC not only performs automatic alarm limit settings, but it also sets limits for
169
Appendix
wells based on that individual well's performance. Wells that have widely varying data will
automatically have broader control limits calculated than those that have consistent data.
In XSPOC, SPC control limits are automatically calculated on several key parameters. These
control limits are displayed on the trend graphs, and violations of these control limits can be
observed through color-coding on the group status screen and through exception groups.
170
Glossary
Glossary
C
CBALANCE (Now XBAL): The software that calculates the maximum counterbalance effect from
a given pumping unit configuration and counterweights positions, or calculates the
position of counterweights from a given pumping unit configuration and maximum
counterbalance effect.
D
Downhole Dynamometer Card: A plot of the loads on the pump versus the pump position. The
card is calculated by the analysis software (XDIAG) using the surface card, production
information, fluid data, and surface and downhole equipment.
R
RODSTAR: The predictive software that takes information from surface and downhole equipment,
production data, fluid data and the simulated downhole dynamometer card and calculates
the predicted surface dynamometer card and predicted condition of the entire system.
S
Scan: Retrieval of information from the controllers
Selected Group or Well: Refers to the group of wells or the individual well selected in the Well
Groups Tree. When a group or well is selected, XSClient is using data for that item to
populate the screens. You can tell which well or group is selected from the status bar at
the bottom on the XSClient screen.
Session: This refers to the time during which you have the XSClient program open and running.
The session begins when you open the program and ends when you close it. If you are
sharing a workstation with other users, it is recommended that you end a session when
finished doing your work.
Surface Dynamometer Card: A plot of rod string loads versus carrier bar position. Rod string
loads are collected by means of a load cell (either a horseshoe load cell, mounted
between the carrier bar and polished rod clamp OR a beam mounted strain gauge, that
detects stress deflections in the walking beam). Position data on POC’s is usually
collected by one of two methods: a position (proximity) switch and modified sine wave, or
an inclinometer.
X
XBAL (Formerly CBalance): The software that calculates the maximum counterbalance effect
from a given pumping unit configuration and counterweights positions, or calculates the
position of counterweights from a given pumping unit configuration and maximum
counterbalance effect.
171
Glossary
XDIAG: The diagnostic software that takes information from surface and downhole equipment,
production data, fluid data and the surface dynamometer card to calculate a downhole
dynamometer card and an analysis of the condition of the entire system. Automatic
analysis of cards by XDIAG occurs once per day (early morning after collection).You can
manually analyze any selected dynamometer card. Only the current or startup card that
has been collected overnight will be analyzed automatically.
XSClient: The software interface used to access information from the XSPOC database, control
wells, and collect and analyze dynamometer cards.
172
Glossary
Index
A
Custom Views ......................... 21, 32, 33, 34
Add
Cycles, Yest .............................................. 40
new communications port .................... 135
D
Add .......................................................... 135
Data History Graph ................................... 48
Adjust Position Phase ................................ 76
Data Input ............................................... 167
Adjust Top-Of-Stroke ................................. 76
Data Trending ........................................... 48
Administrator ..................................21, 39, 86
Default View ............................ 21, 32, 33, 34
Administrator-Defined Custom Views . 32, 33,
DH ............................................................. 39
34
DH Cap@24.............................................. 40
Alarms ..................................................42, 78
DH Cap@RT ............................................. 40
Analysis .........................................35, 42, 44
DH Stroke ................................................. 40
Analysis Report.......................................... 42
Downhole ...................................... 35, 39, 44
Associate User Views ..............21, 32, 33, 34
Downhole Card ................................... 38, 42
ATF .......................................................... 167
Downtime ................................................ 167
Auto Correction .......................................... 76
Dry Rod Weight......................................... 40
B
Dynamometer Cards ............................... 134
Buoyant Rod Weight .................................. 40
Dynograph ................................................ 35
C
E
CAC ........................................................... 68
Energy Management ................................ 67
Card Library .............................35, 38, 39, 44
Event ......................................................... 78
Card Plot ..............................................42, 44
Excel ......................................................... 55
Card Plot Area ...............................35, 38, 44
Expert Corrections .............................. 67, 76
Card Viewer ............................................... 35
Export Data History ................................... 55
Card Viewer Window ................................. 44
F
Cards .............. 4, 35, 38, 39, 40, 42, 44, 167
Facilities ...................................................... 4
CBalance ................................................... 19
Facility Tags ............................................ 121
CBL ............................................................ 19
Fiberglass/steel ......................................... 44
Comment ................................................... 78
Field Maps .............................................. 121
Configuration Tables ............................... 126
Fillage ................................................. 40, 44
Control Parameter Setpoints ................... 126
Fluid Load ................................................. 40
Controller ................................................... 68
Fluid Pound ............................................... 44
Controller Trends .....................17, 45, 83, 84
G
CRC Error ................................................ 171
Global Custom View ..................... 32, 33, 34
Current Card .............................................. 42
Global Views ........................... 21, 32, 33, 34
173
Index
Graph Settings ........................................... 55
Malf/Low RPM......................................... 167
Graphs .....................................17, 45, 83, 84
Malf/Minimum Load................................. 167
Group Status ................... 21, 32, 33, 34, 121
Malf/Peak Load ....................................... 167
Group Status Views ................................... 30
Malf/Setpoint ........................................... 167
Groups Window ........................................... 6
Malfunction Setpoint ............................... 167
H
Microsoft Data Access Components......... 88
History ........................................................ 48
Microsoft Data Engine .............................. 88
H-O-A ....................................................... 167
Min .......................................................... 167
Hrs ............................................................. 40
ML ........................................................... 167
I
Monitor ........................................................ 4
Idle Time .................................................... 40
MPC ........................................................ 167
Idletime ...................................................... 78
MSDE ........................................................ 88
Inf Prd ........................................................ 40
MSDE Service Pack.................................. 88
Input Data .................................................. 40
MSP ........................................................ 167
Installation .................................................. 88
N
Installing
Non-Kinematics Surface Positions ........... 76
Database Components .......................... 88
Notes ................................................... 39, 78
MSDE ..................................................... 88
O
MSDE Service Pack ............................... 88
Off/on ...................................................... 167
Installing ..................................................... 88
OL ........................................................... 167
L
Output Data ......................................... 35, 40
Last Good Scan ......................................... 30
P
Last Used View ..............................32, 33, 34
Pagers ..................................................... 121
LCF .......................................................... 167
Parameter Changes ............................ 63, 78
Load Allowed Limit .................................. 167
Parent Group ............................................ 14
Load Cell Adjustment ................................ 76
Peak Load ............................................... 167
Logic Expression ..................................... 167
Peak Load Allowed Limit ........................ 167
LoRPM ..................................................... 167
Phase-Shifted Surface Positions .............. 76
Loss Prog ................................................. 167
PL ............................................................ 167
Low RPM ................................................. 167
Pmp Depth ................................................ 40
Low RPM Allowed Limit ........................... 167
Pmp Diam ................................................. 40
Lufkin Automation .................................... 167
PO ............................................................. 38
M
PO Fluid Load ........................................... 40
Main Client Window ..................................... 6
PO/SD ....................................................... 39
Main Menu ................................................... 6
POC ... 6, 39, 40, 42, 44, 60, 63, 76, 78, 135,
Malf .......................................................... 167
Malf/Logic ................................................ 167
174
167
POC Panel ................................................ 60
Index
POC Value ...........................................60, 63
Server/Port/Description ............................. 68
Predictive run ............................................. 19
Session ................................................... 167
Prime Mover .............................................. 71
Setpoint ........................... 35, 44, 63, 78, 167
Production Parameters .............................. 67
Setpoints ................................................. 126
Pump Efficiency ......................................... 40
SPC ............................................. 27, 53, 169
Pump Friction Load ................................... 40
SpFail ...................................................... 167
Pumped-Off ............................................... 68
SPM .......................................................... 40
Pumping
SQL Server ............................................... 88
Unit .....................................40, 71, 78, 167
Startup ...................................................... 39
Pump-Off .......................................38, 44, 68
Statistical Process Control ................ 27, 169
Pump-off/shutdown .................................... 39
Status Change .......................................... 78
R
Stopping Unit Well State ......................... 167
Recent Well Tests.................................. 7, 60
StrtFail ..................................................... 167
Register Panel ........................................... 60
SurCap@24 .............................................. 40
Registers ..............................60, 63, 121, 126
Surface ...................................................... 44
Reports ................................................15, 42
Surface Card ........................... 35, 38, 40, 42
Re-Set Malfunctions ................................ 167
Surface Dynamometer ............................ 167
Rod
Surface Equipment ................................... 71
Configuration .......................................... 67
System Parameters ................................ 121
Data ........................................................ 71
T
Rod ............................................................ 71
Time In State............................................. 27
Rod string ................................................ 121
Timeout ..................................................... 27
RODSTAR ...........................................19, 38
TIS ............................................................ 27
Rotation ..................................................... 71
Today’s Cycles .......................................... 27
RPO ........................................................... 19
Today's Run Time ..................................... 27
RS-232 ..................................................... 135
Trend Description...................................... 53
RST file ...................................................... 19
Trend Line Customization ......................... 48
RTU Alarm ................................................. 78
Trends ....................................................... 48
Run States ............................................... 167
True ......................................................... 167
Run Status Descriptions .......................... 167
Tst Date .................................................... 40
Runtime .......................................40, 71, 169
Tst Gas ..................................................... 40
S
Tst Gross .................................................. 40
SAM Well Manager .................................. 167
Tst Oil ........................................................ 40
Save This Graph To File ............................ 55
Tubing Anchor ........................................... 71
Select Well List .......................................... 14
U
Sensor/Version Info ................................... 68
User Defined Limits................................... 53
Serial port ................................................ 135
User-Defined ................................. 32, 33, 34
175
Index
User-Defined Views ................................... 30
XSClient .................................................. 116
V
XSCommServer ........................................ 86
Value Axis .................................................. 48
XSDialer .................................................. 107
Variable Speed .......................................... 68
XSPOC
W
Administrator ......................................... 39
Well ............................................................ 53
Client ....................................................... 6
Well Column .............................................. 21
Default View .............................. 32, 33, 34
Well Configuration ...................19, 67, 68, 76
Version Number ...................................... 7
Well Control ........................................... 7, 63
XSPOC ....................................................... 4
Well Data ..................................................... 7
XSPOC ....................................................... 7
Well Details .............................................. 121
XSPOC Configuration window ................ 121
Well Group Explorer ................................ 145
XSPOC Database ..................................... 88
Well Groups Explorer ..........................21, 38
XSPOC Install Notes................................. 88
Well Groups Tree.......... 7, 14, 32, 33, 34, 35
XSPOC Installation ................................... 88
Well Notes ................................................. 78
XSPOC Server Installation ....................... 88
Well Paging.............................................. 121
XSPOC Service Manager ................. 88, 107
Well Scanning ............................................ 60
XSScanner ................................................ 86
Well State ................................................ 167
XSSchedServer ................................ 86, 107
Well Status Bar .......................................... 21
XSServer ................................................. 107
Well Type ................................................... 68
Y
Wells Group Explorer ................................ 78
YCycl ......................................................... 27
Well's production data ............................... 71
Yesterday’s Cycles ................................... 27
X
Yesterday's Run Time............................... 27
XDIAG ........................................7, 19, 40, 42
Z
XDIAG Parent Group .....................32, 33, 34
Zoom ......................................................... 48
176