1
6<6/$%
39 System 7HVWHr
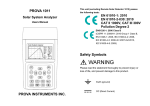
Users Manual
This unit (excluding Irradiance Meter) passes the
following tests:
EN 61010-1: 2010
EN 61010-2-030: 2010
CAT II 1000V, CAT III 300V
Pollution Degree 2
EN61326-1: 2006 Class B
(CISPR 11: 2009/A1: 2010 Group 1 Class B,
EN 61326-1: 2006, IEC 61000-4-2: 2008,
IEC 61000-4-3: 2006+A1:2007+A2:2010,
IEC 61000-4-8: 2009)
Safety Symbols
Please read the statement thoroughly to prevent injury or
loss of life, and prevent damage to this product.
Earth (ground)
DC (Direct Current)
Conforms to relevant European Union
directives.
Do not dispose of this instrument as unsorted
municipal waste.
Contact a qualified
recycler for disposal.
Caution:
1. The ventilation openings on the unit should
not be blocked.
2. Please pay attention to polarity of DC input,
follow the polarity info by the input jack.
Caution, Risk of Electric Shock.
This equipment is not for
measurements performed for CAT IV.
Please remove all the test leads
before performing maintenance,
cleaning, battery replacement, fuse
replacement, etc.
Do Not plug in the AC adapter when
the ambient temperature exceeds
45℃ / 113℉ .
Do Not charge the lithium battery
when the ambient temperature
exceeds 45℃ / 113℉ .
Table of Contents
Table of Contents
VI. Specifications ..............................................................................................49
I.
Preparation..................................................................................................... 1
A.
Electrical Specifications................................................................49
II.
Features .......................................................................................................... 2
B.
General Specifications...................................................................53
III. Panel Description ......................................................................................... 4
VII. Battery Replacement (Recharging) ........................................................56
A.
Solar system analyzer ..................................................................... 4
VIII. Fuse Replacement......................................................................................58
B.
Irradiance Meter (with Thermometer)......................................... 11
IX. Maintenance & Cleaning ...........................................................................59
IV. Operation ...................................................................................................... 12
A.
Connecting Diagram ...................................................................... 13
B.
AUTO SCAN ..................................................................................... 19
C.
REPORT ............................................................................................ 23
D.
FILE LIST........................................................................................... 25
E.
REF MODULE................................................................................... 27
F.
SOFTWARE KEYBOARD............................................................... 29
G.
ZERO Calibration ............................................................................ 30
H.
Data Logging.................................................................................... 31
I.
Clear Recorded (File) Data and Restore Defaults................... 33
J.
SETUP Parameters ......................................................................... 34
K.
THERMOMETER Setup.................................................................. 36
L.
POWER Mode................................................................................... 37
V. Application Notes ....................................................................................... 44
A. Quality Control at Production Line, Warehouse, or Site of
Installation.................................................................................................. 44
B. Identify Requirements of Solar Power System............................ 45
C. Maintenance of Solar Panels............................................................ 46
D. Verify the Best Installation Angles of Solar Panels .................... 48
I
II
I. Preparation
II. Features
This Solar system analyzer uses a rechargeable lithium battery.
■
I-V curve test for solar system
■
Max. solar system power (Pmax) search by Auto-scan:
Before using the new rechargeable lithium battery, please charge it for
10~12 hours continuously for better battery life.
1000V, 12A (12000W capability)
■
Intelligent test logic with no personnel attendance required in the field.
Solar system analyzer waits and tests the system until appropriate
The rechargeable lithium battery is pre-installed in the solar system analyzer
at the factory.
sunlight irradiance is detected.
■
Max. voltage (Vpm) at Pmax
■
Max. current (Ipm) at Pmax
Users can plug in the AC adaptor and no need to turn on the Analyzer.
■
Voltage at open circuit (Voc)
Then the rechargeable lithium battery is charged automatically.
■
Current at short circuit (Isc)
■
Efficiency (%) calculation of solar system
■
Temperature measurement of solar panels
■
Irradiance measurement of sun light
■
Series resistance (Rs) calculation of solar panels
■
I-V curve with cursor to display each data point
■
With data logging/open function, the I-V curves of solar system can be
analyzed/recorded for a period of time (e.g. 60 min.)
■
Conversion of I-V curve under OPC to data under standard test
condition (STC) based upon IEC standard
■
Provide OPerating Condition (OPC) and Standard Test Condition (STC)
test reports for verification of solar panel performance (OK, or NO OK)
■
Users can set up the parameters of solar panels
■
Users can set up the series number of solar panels. Parameters of
many solar panels can be measured in one measurement.
■
1
Built-in calendar clock
2
■
AC power adaptor
■
Rechargeable lithium battery, low battery warning
■
Optical USB cable for PC
■
With optional power clamps (SOLAR 15 DC Current Probe and SOLAR
A. PV system tester
21 AC Power Clamp), continuously measure/monitor/record the DC
A-1 FRONT PANEL
III. Panel Description
power output of solar system and the AC power output of inverter (1
phase or balanced 3 phases); calculate the efficiency of DC to AC
power conversion and the efficiency of the max. output power
11
12
9
13
10
14
1
15
2
16
3
17
4
18
5
19
6
20
7
8
3
4
STC
1.
POWER
8.
STC POWER button
AUTO SCAN button
Press this button to switch the display to STC or OPC curves;
Auto scan I-V curve test.
or press it to enter POWER mode.
auto scan of intelligent test logic.
2.
ENTER button
LCD displays measurement data and curves.
(In the FILE LIST) Press this button to open a chosen file (REC file or
10.
Mod file).
SETUP
SETUP button
Enter/Exit (parameter) SETUP menu.
FILE
EXIT
Press this button for 2 sec. to perform the
9. LCD
ENTER
3.
AUTO
SCAN
FILE EXIT button
Press this button to display File List. Press it again to exit File List.
11.
button
(1) In a curve, press it to move the cursor left.
DELETE button
4.
(2) In SETUP menu or REF MODULE function or FILE LIST, press it to
decrement value by 1 or display the file of previous page.
(In the FILE LIST) Press this button to delete the data of a chosen file.
5.
I/V/P
SELECT
12.
I/V/P SELECT button
Select I-V curves or P-V curves, or display both.
6.
ZERO
button
In “SETUP menu” or “REF MODULE function” or “File List”, press ▲
button to select the previous item or file.
ZERO button
For Zero calibration and Timer reset. Connect two testing clips with
13.
button
each other and press this button, the zero calibration of voltage and
In “SETUP menu” or “REF MODULE function” or “File List”, press ▼
current will be performed. Regular calibration of zero would maintain
button to select the next item or file.
the accuracy of the instruments. Under POWER mode, press this
button to reset the Timer and curve drawings.
14.
button
(1) In a curve, press it to move the cursor right.
7.
SOFTWARE KEYBOARD button
Press this button to display or conceal the SOFTWARE KEYBOARD
(2) In SETUP menu or REF MODULE function or FILE LIST, press it to
increment value by 1 or display the file of next page.
which be used to type in characters.
5
6
REF
15.
MODULE
REF MODULE button
A-2 REAR PANEL
Enter/Exit the editing function of solar panel parameters.
REPORT
16.
REPORT button
Press this button to display Standard Test Condition (STC) report and
OPerating Condition (OPC) report.
17.
REC
REC button
2
1
3
4
(1) Press this button to start data logging. Press it again to stop data
logging.
(2) How to clear recorded data: keep pressing REC button and turn on
the Analyzer, then all the data recorded in the Analyzer will be
5
completely deleted. And the factory defaults will be restored.
18.
GRAPH
GRID
GRAPH GRID button
Press this button to select “Display” or “Cancel” graph grid.
19.
~η
POWER
。
6
DC graph/ AC graph/ Efficiency button
Press this button to display “DC power graph” or “AC power graph” or
7
“Efficiency”.
20.
Power button
1. Communication window:
Turn on/off the power of the Analyzer.
(1) Connecting the Analyzer with PC via USB cable.
(2) Or under POWER mode, connecting the Analyzer with the
communication cable of Solar 21 AC Power Clamp.
2. AC to DC adaptor input.
7
8
3. Terminal for connecting Irradiance meter
4. Terminal for connecting Solar 15 DC Current Probe
A-3 TOP PANEL
5. Stand
6. Battery cover
1
7. Screw of battery cover
2
V+
Note:
I+
DO NOT BLOCK VENTILATION OPENINGS
When the Analyzer is under POWER mode, the PC
1000V MAX
Application Software can not communicate with the
Analyzer.
CAT
CAT
300V
1000V
12A MAX
V-
I-
3
4
1. V+ terminal
2. I+ terminal
3. V- terminal
4. I- terminal
9
10
B. Irradiance Meter (with Thermometer)
IV. Operation
Warning: To avoid risk of electric shock and damage
to the unit, do not touch any internal components with
tools of any kind through the ventilation opening.
Warning: AC adaptor is used for lithium battery
recharging only. The power source of the Solar
System Analyzer is always the (rechargeable) lithium
battery, NOT AC adaptor.
2
3
Warning: When using a lithium battery as the power
source, please do not plug in an AC adaptor. If users
plug in an AC adaptor during operation, power to the
1
analyzer will be interrupted and the data during
operation will be lost.
1. Box for Irradiance meter.
2. Connecting terminal of Irradiance meter.
3. Auxiliary Thermometer.
Note: When pressing any button, users will hear a
Note: Apply Thermal conductive gel on the metal part
of Auxiliary thermometer, then stick it on solar panel
(back side) to detect the temperature of solar panel.
sound of buzzer. When keeping pressing it for more
than 2 seconds, users will hear another sound of
buzzer. This status is normal.
And Thermal conductive gel can be removed easily.
11
12
A. Connecting Diagram
Two Wire Measurement
With the “4-wire to 2-wire connecting cable”, users only need 2 testing clips
which must touch the metal parts of the output terminals of a solar panel.
The “4-wire to 2-wire connecting cable” can convert four wire measurement
to two wire measurement. First, plug the 4-wire testing cable into
Analyzer’s 4 terminals (black to black, red to red), and connect its other side
with “4-wire to 2-wire connecting cable”. And then connect “4-wire to 2-wire
connecting cable” with 2 testing clips (black & red).
Solar (DC) System
4-wire Testing Clips Connecting Diagram
13
14
Four Wire Measurement (with 2 optional testing clips)
All 4 testing clips must touch the metal parts of the output terminals of a
solar panel.
4-wire to 2-wire Connecting Cable
Then two wire measurement will be performed by using 2 testing clips which
touch the metal parts of the output terminals of a solar panel (see below).
15
16
Connect the Solar panel (front side) with Irradiance meter
Connect Analyzer with Irradiance meter
Use Thermal conductive gel to stick Auxiliary thermometer
on the Solar panel (back side)
17
18
7. Users can Press
B. AUTO SCAN
or
button to move the cursor along the curve
to view the values (voltage/current/power) of each point. (The values will
1. Put solar panel(s) under sunlight to let the light source illuminate on
solar panel(s) uniformly.
display below the curve.)
8. Users can press STC POWER button to switch the display to STC
2. Connect Irradiance meter with Analyzer.
values/curves; press STC POWER button again to switch the display to
3. Properly connect testing clips to solar panel and Analyzer. The red clip
OPC values/curves. But if Irr shows ”-----“, STC values/curves can not
is for positive pole and the black clip for negative pole. (refer to above
be displayed.
Connecting Diagram).
4. Press
5. Press
button to turn on Analyzer.
AUTO
SCAN
(AUTO SCAN) button to perform Auto-scan. After the
scanning is finished, the OPC measurement result will display like
below.
6. Analyzer will automatically measure:
Voc: Voltage at open circuit.
Isc: Current at short circuit.
Pmax: Max. solar system power.
Vpm: Max. voltage at Pmax.
Ipm: Max. current at Pmax.
Note:
EFF: Efficiency of solar panel.
1. The display of STC values/curves is based on the calculation of
FF: Fill Factor.
solar panel parameters. In order to get correct STC values/curves,
Tc: Temperature.
first users have to nominate a Mod file in the FILE LIST as the solar
Irr: Irradiance.
panel parameters
Rs: Series resistance.
2. After turn on the power of Analyzer, if Irr shows ”-----“ then please
Based upon above parameters, Analyzer will scan again to draw two
st
curves on LCD: the 1 one is I-V curve; the 2
19
nd
one is P-V curve.
turn on the Analyzer again to let Irr shows normal values.
3. When the display shows STC values/curves: the values are STC
20
values but the curves are OPC curves.
AUTO SCAN of Intelligent Test Logic
4. For both OPC and STC, the calculation of solar panel efficiency
(EFF) is based on Irradiance = 1000 W/m2 .
5. When Irr shows ”-----“, it means the Irradiance meter can not be
detected or the measured irradiance is over the spec.
6. If the display shows “OL” in OPC or STC values/curves, it means the
This Analyzer can perform the AUTO SCAN of intelligent test logic to get a
more accurate Pmax. The Analyzer will wait till the irradiance is over 800
W/m2 , then it starts AUTO SCAN. And it will continuously AUTO SCAN 5
times, then find out the best Pmax.
values of this measurement are not accurate.
7. If there is a “*” symbol next to Rs, it means the Rs value is from the
irradiance calculation. If there is no symbol, it means the Rs value
is from the calculation of loading voltage and current.
8. When Isc is over 12A, AUTO SCAN can not be performed.
9. When there is a Low battery warning, AUTO SCAN can not be
1. Put solar panel(s) under sunlight to let the light source illuminate on
solar panel(s) uniformly.
2. Connect Irradiance meter with Analyzer.
3. Properly connect testing clips to solar panel and Analyzer. The red clip
is for positive pole and the black clip for negative pole. (refer to above
Connecting Diagram).
performed automatically.
4. Press
5. Press
button to turn on Analyzer.
AUTO
SCAN
(AUTO SCAN) button for 2 sec. to perform AUTO SCAN
of intelligent test logic. After the scanning is finished, the best OPC
measurement result will be displayed.
6. If the irradiance can not be over 800 W/m2 which makes AUTO SCAN
can not be performed, users can press
(DELETE) button to
perform AUTO SCAN 5 times based on the current irradiance. After
the scanning is finished, the best OPC measurement result will be
displayed.
21
22
C. REPORT
1. After AUTO SCAN finished and curves displayed, or after open a REC
REPORT
file under FILE LIST, press
(REPORT) button to display test
report like below: it shows NOMINAL parameters, OPC / STC report.
But if Irr shows ”-----“, the report can not be displayed.
2. In the report:
Delta Irrad represents the irradiance variation volume during AUTO
SCAN process. If this value is bigger, it may cause an abnormal I-V
curve.
Irr < 800 W/m2 means the irradiance is small than 800 W/m2 .
Pmax @ STC: if OK it represents the Pmax of STC meets the Pmax
spec. of solar panel parameters; if NO OK it means the Pmax of STC do
not meet the Pmax spec. of solar panel parameters.
3. Users can press
button to switch the display shows STC report,
or OPC report (Nms = Nms of solar panel parameters) or OPC report
(Nms=1). Press
button to switch the display in reverse order.
23
24
D. FILE LIST
FILE
1. Press
EXIT
(FILE EXIT) button to display the File List as below.
2. In the File List you can see: File names, File types, File dates/times.
3. There are three file types:
”Mod” : File of Solar panel parameters.
”REC” : File of I-V curve record.
”PWR” : File of Power record.
4. If there is a “*” symbol next to a ”Mod” file, it means this file of solar
panel parameters is the one currently used by the Analyzer.
5. Users can press
or
file will be highlighted. Press
button to select a file. The chosen
or
button to display the files of
previous page or next page.
6. Press ENTER button to open the file data. Open a ”Mod” file means
you select it as the file of solar panel parameters currently used by the
Analyzer. Press ”REC” button to display a File of I-V curve record.
The ”PWR” files can not be opened by the Analyzer, users have to read
them from the Application Software.
7. Press
(DELETE) button to delete a chosen file.
※Note: When users enter the FILE LIST, the previous
AUTO-SCAN testing results will be deleted.
25
26
Beta:
Temperature coefficient of solar panel Voc.
Gamma: Temperature coefficient of solar panel Pmax.
E. REF MODULE
K:
Temperature coefficient of solar panel Rs.
After the parameter tests of OPerating Condition (OPC), the Analyzer can
convert them to I-V curve and parameter display of Standard Test Condition
3. Users can press
button or
button to select a parameter.
(STC). And then based on the parameters of solar panel to verify the solar
button or
button to change the parameter values; or
panel is OK or NO OK. Users can open, modify, delete the parameters of
Press
solar panels. The default parameter file (DEFAULT_MOD) can not be
press these 2 buttons for 2 sec. to quickly change the setting values.
modified or deleted.
4. After editing the parameters, select Save and then press ENTER button
to replace the original parameter file; or select Save As and then press
ENTER button to save it as another new parameter file.
REF
1. Press
MODULE
(REF MODULE) to enter the function of editing solar panel
REF
5. Press
parameters.
MODULE
(REF MODULE) button to exit REF MODULE function.
2. The parameters of Solar panels are:
Module: The name of solar panel which can be edited by
SOFTWARE KEYBOARD.
Nms:
The series number of solar panels.
Pmax:
Max. solar system power.
Voc:
Voltage at open circuit.
Isc:
Current at short circuit.
Vpm:
Max. voltage at Pmax.
Ipm:
Max. current at Pmax.
Area:
Area of solar panel(s). (Based on this Area data and
Irradiance, the Analyzer can calculate the conversion
※Note: When users enter the REF MODULE function, the
efficiency of solar panels.)
previous AUTO-SCAN testing results will be deleted.
Toll+:
Positive tolerance of solar panel Pmax.
Note: If users exit REF MODULE function before SAVING the
Toll-:
Negative tolerance of solar panel Pmax.
parameter file, the changed parameters will be restored to the
Alpha:
Temperature coefficient of solar panel Isc.
original defaults.
27
28
F. SOFTWARE KEYBOARD
G. ZERO Calibration
Users can use SOFTWARE KEYBOARD to type in characters, numbers and
Calibration of voltage and current zero would improve the accuracy of the
symbols.
instrument before usage.
1. Move to the item where you want to change the characters (e.g.
First connect “4-wire to 2-wire cable” with the Analyzer, then connect 2
Module).
testing clips (black & red) with ““4-wire to 2-wire cable”. Connect these 2
ZERO
2. Press
button or
button to move the cursor to the place where
testing clips with each other and press
button. The LCD will
display “ZERO CAL…” message. When this message disappears, the
ZERO Calibration is completed.
you want to type in a character.
Regular ZERO Calibration would maintain the accuracy of the instruments.
3. Press
(SOFTWARE KEYBOARD) button then the display will be
as below.
4. In the SOFTWARE KEYBOARD display, press
or
button to select a character, then press
or
or
(SOFTWARE
KEYBOARD) button again to confirm this change.
29
30
Note:
H. Data Logging
1. If the Sampling Time is set to 0 (minutes), then only
Users can perform Data Logging to record the I-V curves of solar system or
(under POWER mode) record the DC/AC output power, Efficiency over a
period of time (e.g. every 60 minutes).
1 set of I-V curve/data or 1 set of power data is
recorded.
2. Users can use the application software provided
with the Analyzer to read the saved testing results.
(Please refer to the Software Manual)
1. Set Sampling Time (e.g. 60 min.) in SETUP menu.
2. Exit SETUP function, press REC button then AUTO SCAN will be
performed and the I-V curves of solar system will be recorded. In the
above example, data is recorded once every 60 minutes. Press REC
button again to stop Data Logging.
3. Under Efficiency display of Power mode, press REC button then (in the
above example) the data is recorded once every 60 minutes. Press REC
button again to stop Data Logging.
31
32
I.
Clear Recorded (File) Data and Restore Defaults
J. SETUP Parameters
Users can clear the recorded data saved in the Analyzer and restore the
1. Press
factory defaults.
SETUP
(SETUP) button to enter the Parameter Setting.
2. Press
The procedures are:
or
buttons to select the setting item.
1. Keep pressing REC button and turn on the Analyzer at the same time.
or
buttons to change the setting values. Or press
2. After turning on the Analyzer, users will be asked if they really want to
Press
Restore Factory Settings & MEMORY FORMAT. If users choose YES,
these two buttons for 2 sec. to promptly change setting values.
then all the data recorded in the Analyzer (memory) will be completely
deleted. And the factory default settings will be restored.
3. After setting up parameters, press
SETUP
(SETUP) button to exit SETUP
menu.
Note:
1. After performing this CLEAR function, all the
recorded data in Analyzer (memory) will be deleted
completely and can not be restored. If it is necessary
to keep the testing data, please use the Application
Software to download/save them before deleting them
from the Analyzer. (refer to the Software Manual)
2. After the factory defaults are restored, the
parameters (like Sens, Tc Offset, …) in SETUP will be
restored to the defaults set at factory. Hence, users
(1)
will have to set the parameters in SETUP again.
CURRENT DATE&TIME:the Date and Time of the Analyzer will
be set up (except the Second can not be set).
(2)
Sampling Time of Datalogging:can be set up from 0 to 99
minutes.
33
34
(3)
Sens:in order to measure the correct irradiance, here users must
set up the Sens values which were printed on the auxiliary
K. THERMOMETER Setup
thermometers (back side) attached to the Irradiance meters.
After the factory defaults are restored, the Sens values will be
restored to the ones set up at the factory. If the Irradiance meter
is recalibrated, the Sens value after calibration must be set up
here.
(4)
REF
1. Keep pressing
MODULE
(REF MODULE) button (do not release it) and
turn on the power of Analyzer.
2. After the power is on, users will be asked to select AUTO or AUX
Tc Offset:in order to measure the correct temperature, here
for ”Cell Temperature”. Choosing AUTO means the Analyzer will
users must set up the Tc Offset values which were printed on the
automatically detect the temperature of solar panel. Choosing AUX
auxiliary thermometers (back side) attached to the Irradiance
means the Analyzer will detect the temperature of solar panel through
meters. After the factory defaults are restored, the Tc Offset
the auxiliary thermometer of Irradiance meter.
values will be restored to the ones set up at the factory.
(5)
Comment:Users can use the SOFTWARE KEYBOARD to write
down their comments here. Max. 128 characters can be typed
in. When data logging (REC) I-V curves of solar system, the
comment will be recorded as well.
(6)
AUX in the SETUP menu means the auxiliary thermometer
(attached to Irradiance meter) is selected for Cell Temperature.
Note:
In order to get more accurate temperature of solar
panel, users are suggested to select AUTO. When
users select AUTO, they have to make sure the Voc
parameter of REF MODULE is correct.
V1.00 means the firmware version of the Analyzer.
35
36
The connection of Solar 21 (AC Power Clamp), Analyzer, Irradiance meter
L. POWER Mode
and Solar 15 (DC Current Probe) are as below:
Solar System with Panels and Inverter
The POWER mode is used to continuously measure/monitor/record the DC
power output of solar system and the AC power output of Inverter (1 phase
or balanced 3 phases); calculate the efficiency of DC to AC power
conversion, the efficiency of the max. output power, DC/AC output power,
and Watt/hour, etc.
Please connect all the cables according to the drawing of “Solar System
with Panels and Inverter". Solar 15 (DC Current Probe) turned to 12A
range; Solar 21 (AC Power Clamp) turned to W-mA or W-A range; the sliding
switch on the side turned to a proper frequency.
Press the 3-Phase button of Solar 21 (AC Power Clam) to switch to 1P2W
or 3P3W.
37
38
1. Press
button to turn on the Analyzer.
STC
2. Press
POWER
(STC POWER) button to enter the Efficiency display of
POWER mode as below.
Ipm:
Max. current at Pmax
Irr:
The measured Irradiance
Tc:
The measured Temperature
Alpha:
Temperature coefficient of solar panel Isc.
Beta:
Temperature coefficient of solar panel Voc.
Gamma:
Temperature coefficient of solar panel Pmax.
Irh:
Watt/ hour of Irradiance
SPmh:
Watt/ hour at Pmax
DC Input of Inverter:
P:
Power
V:
Voltage
I:
Current
EFF(Pmax):
Efficiency, (DC Power / Pmax)x100
EFF :
Average Efficiency, (Ph(DC)/SPmh)x100
On the top left of the display, “RECORD00001” means the current output
P:
Average Power
calculation of solar panels are based on: I-V curve record file
ET:
Duration (hour: min.: sec.). Users can press ZERO button
“RECORD00001” and the measured irradiance/temperature. Every sec.
the calculation and display is updated once. Hence users must perform
to reset this value.
Ph:
Watt/ hour
AUTO SCAN first, press REC button to record a “REC” file, select this “REC”
file in FILE LIST, then press ENTER button to finish the nomination.
AC Output of Inverter:
P:
Power
Parameters from left to right on the display are described on below:
V:
Voltage
Output of solar panels:
I:
Current
Voc:
Voltage at open circuit
PF:
Power Factor
Isc:
Current at short circuit
EFF(DC-AC): Efficiency, (P(AC)/P(DC))x100
Pmax:
Max. solar system power
EFF :
Average Efficiency, (Ph(AC)/Ph(DC))x100
Vpm:
Max. voltage at Pmax
P:
Average Power
39
40
PF :
Average Power Factor
Ph:
Watt/ hour
~η
3. Press
POWER
Press
POWER
~η
button to switch the display to DC power curve as below.
button again to switch the display to AC power curve as
below.
Users can press
I/V/P
SELECT
(I/V/P SELECT) button to switch the display to
Current/Voltage/Power curves. On the left bottom it shows the starting
date/time of the curve. Users can press ZERO button to Reset (i.e. redraw)
the curve. Press
or
button to move the cursor. On the top left it
shows the Time Interval of the cursor position, and the min./max. values of
the Time Interval. On the right bottom it shows Watt/ hour.
41
42
Note:
1. Under POWER mode if the display shows “Clamp
X”, it means the Analyzer can not detect Solar 15 or
Solar 21, please check the connection or replace
batteries.
2. Solar 15 ”can be turned to 12A range only”, Solar
21 ”can be turned to W-mA or W-A range only”, or
the Analyzer can not measure correctly.
V. Application Notes
A. Quality Control at Production Line, Warehouse, or Site of
Installation.
Manufacturers of solar panels can test the characteristics for quality control
purpose at the production line. Due to the portability advantage of the unit,
quality inspectors can randomly pick samples of solar panels and test them
at the warehouse to assure quality before shipment.
Installation engineers can randomly test samples of solar panels at site to
verify the quality of solar panels used at site of installation.
43
44
B. Identify Requirements of Solar Power System
C. Maintenance of Solar Panels
Normal I-V Curve
The unit can measure actual max. power (Pmax), voltage (Vpm) and current
(Ipm) at max. power. Instead of the rated max. power, system designers
Abnormal I-V Curve
need to be aware of the actual solar power from solar panels under actual
(Cells at the corner of solar panel are defected)
operating conditions. So designers can actually know how many pieces of
solar panels are required to generate specific power.
The voltage and current under actual operating conditions (in the morning, at
noon, and in the afternoon) are required for system designers to design the
optimal charging system, so most of the solar power can be absorbed and
stored in the battery.
Users can test the characteristics of solar panels at different time of each
day and store the data. Then the designers can know if the solar system
can generate appropriate power at any time.
45
46
D. Verify the Best Installation Angles of Solar Panels
Abnormal I-V Curve
(Defected cells scattered over the solar panel)
Engineers can collect data of the installation angles at different dates and
time by using the unit at site of installation. The data can be used as a
reference to design the automated angle adjustment system. Or the data
can be used to select an optimal angle for a fixed angle installation.
Maintenance engineers can store the characteristics data of solar panels in
the beginning. And compare the characteristics data in weekly, monthly or
yearly maintenances. If the characteristics of any solar panels are different
from the previous data, maintenance engineers can further identify the
problems of solar panels.
For example, if any cells of solar panels are damaged, the I-V curve would
be very different from a typical curve. If the solar panels are covers by a lot
of dust, the I-V curve or the max. power would be much lower than
previously stored data.
Once defected panels are found, maintenance
engineers can replace them with new panels.
47
48
DC Current Simulation
VI. Specifications
Range
Resolution
Accuracy
0.1 ~ 12 A
1 mA / 10 mA
± 1 % ± 9 mA
If current is greater than 12A, testing can not be performed.
A. Electrical Specifications
Maximum power limit is 12000W. If the power exceeds 12000W, then the
A1. Solar System Analyzer
(23℃±5℃, Irradiance ≥ 800 W/m , Four-wire measurement, the Max.
scanning will be stopped.
power limit is 12000W)
The min. current for Auto Scan is 100mA.
2
Irradiance Measurement
DC Voltage Measurement
Range
Resolution
Accuracy
Range
Resolution
Accuracy
1 ~ 1000 V
0.01 V / 0.1 V / 1 V
± 1 % ± (1 % of Voc ± 0.1 V)
50 ~ 2000 W/m2
1 W/m2
± 3 % ± 20 dgts
Voc: open circuit voltage of solar cell or module.
Temperature Measurement
If users use testing clips to measure voltage only, they must make V+ clip
connect with I+ clip; V- clip connect with I- clip. Thus, 4-wire measurement
Range
Resolution
Accuracy
-20 ~ 85 ℃
0.1 ℃
±1%±1℃
is converted to 2-wire measurement.
A2. DC Current Probe (Solar 15) (23℃±5℃)
DC Current Measurement
Range
Resolution
Accuracy
Range
Resolution
Accuracy
0.1 ~ 12 A
1 mA / 10mA
± 1 % ± (1 % of Isc ± 9 mA)
DC 12A
1 mA / 10 mA
±2.0%±30mA
Isc: short circuit current of solar cell or module.
Circuit resistance is compensated in the AUTO SCAN.
Isc is the current of solar panel’s power cable measured at zero circuit
resistance.
49
50
A3. AC Power Clamp (Solar 21)
3
(23℃±5℃)
AC Watt (50 or 60 Hz, PF 0.6 to 1. CT = 1, Voltage is greater than AC
4V, Current is greater than AC 1mA for mA range, and Current is greater
1
Resolution
Accuracy of Readings
0.050 – 9.999 W
0.001W
±2% ± 0.025W
10.00 – 99.99 W
0.01W
±2% ± 0.25W
100.0 – 999.9 W
0.1W
±2% ± 2.5W
1.000 – 9.999 KW
0.001 KW
±2% ± 0.025KW
10.00 – 99.99 KW
0.01 KW
±2% ± 0.25KW
100.0 – 999.9 KW
0.1 KW
±2% ± 2.5KW
1000 – 9999 KW
1 KW
±2% ± 25KW
For CT ≠1, the accuracy in percentage is the same (±2%).
1, 2
2
For example,
Range of CT Ratio: 1 to 250
H.P. (Horse Power):
1 H.P. = 746 W
VA = V r.m.s. x A r.m.s
AC Reactive Power (VAR, from 0.000 VAR to 9999 KVAR)
2
2
VAR = √(VA – W )
But the
AC Active Energy (mWH, WH, or KWH, from 0 mWH to 999,999 KWH)
WH = W * Time (in hours)
±0.025W becomes ±0.025W * CT ratio
If Auto Hz is selected, the AC voltage must be greater than 50V, and
add 2° phase angle error to the accuracy.
Power Factor
(PF, ACV > 4V, AC mA > 1mA, AC A > 0.04A, Watt > 50 digits)
3, 4
Range (30 ~ 50A)
Resolution
0.050 – 9.999 W
0.001W
±2% of VA ± 5dgts
10.00 – 99.99 W
0.01W
±2% of VA ± 5dgts
100.0 – 999.9 W
0.1W
±2% of VA ± 5dgts
1.000 – 9.999 KW
0.001 KW
±2% of VA ± 5dgts
10.00 – 99.99 KW
0.01 KW
±2% of VA± 5dgts
100.0 – 999.9 KW
0.1 KW
±2%of VA ± 5dgts
1000 – 9999 KW
1 KW
±2% of VA ± 5dgts
51
±5 digits becomes ±5 digits * CT ratio
4
AC Apparent Power (VA, from 0.000VA to 9999 KVA)
additional wattage should be multiplied by the CT ratio.
For example,
additional digits should be multiplied by the CT ratio.
If Auto Hz is selected, the AC voltage must be greater than 50V.
than AC 0.04A for A range. Spec. applies to continuous waveforms.)
Range (0 to 30A)
For CT ≠1, the accuracy in percentage is the same (±2%). But the
Accuracy
Range
Resolution
Accuracy
0.000 – 1.000
0.001
±0.04
52
Testing clips (1 black & 1 red)
B. General Specifications
B1. Solar System Analyzer
Battery Type:
Battery Life:
Memory Size:
AC Adaptor:
Dimension:
Weight:
Operation Environment:
Temperature
Coefficient:
Storage Environment:
Accessories:
B2. DC Current Probe (Solar 15)
Rechargeable Lithium Battery (3400mAh)
400 times of linear scan (1000V ~ 1V,
(Indoor Use)
0.1A ~ 12A), 8 hours for standby mode.
Conductor Size:
23mm max. (approx.)
512K Bytes
Battery Type:
two 1.5V SUM-3 AA
3980 Mod files
Range Selection:
Manual
320 REC files
Power Consumption:
10mA (approx.)
3980 PWR files
Low Battery Indication:
Red LED
AC 100 ~ 240V input
Operation Temperature:
-10°C to 50°C
DC 15V / 1~3A output
Operation Humidity:
<85% RH
257(L) x 155(W) x 57(H) mm
Storage Temperature:
-20°C 到 60°C
1525g / 53.7 oz (Batteries included)
Storage Humidity:
<75% RH
5℃ ~ 50℃, 85% RH
Altitude:
up to 2000M
0.1% of full scale / ℃
Dimension:
183mm(L) x 61.3mm(W) x 35.6mm (H)
7.2" (L) x 2.5" (W) x 1.4" (H)
(<18℃ or >28℃)
-20℃ ~ 60℃, 75% RH
Weight:
190g (battery included)
Irradiance meter, User manual,
Accessory:
Carrying bag x 1
AC adaptor, Optical USB cable,
Manual x 1
Rechargeable lithium battery,
1.5V AA battery x 2
Software CD, Software manual,
Carrying bag, Thermal conductive gel,
Testing clips (1 black & 1 red),
4-wire to 2-wire connecting cable,
4-wire testing cable
Option:
Solar 15: DC current probe
Solar 21: AC power clamp
53
54
B3. AC Power Clamp (Solar 21)
VII. Battery Replacement (Recharging)
(Indoor Use)
Conductor Size:
30mm (approx.)
If the lithium battery can not be charged, users should always purchase a
Battery Type:
two 1.5V SUM-3 AA
new lithium battery from the distributor or importer. The charging circuit
Display:
4+2+2 digits LCD
built-in is designed only for the lithium battery included.
Range Selection:
Auto
Overload Indication:
OL
The lithium battery is always sold with the plastic battery cover. Do not
Power Consumption:
10mA (approx.)
purchase a lithium battery from a source which is not approved by the
Lower Battery Indication:
Display Update Time:
manufacturer.
2 times / sec.
No. of Samples per period: 512 (V or A)
Non-approved lithium battery could cause damage to the instrument or
hazard to the users.
256 (W)
Temperature Coefficient (<18℃ or >28℃):
0.15 x (Specified Accuracy) / ℃
Operation Temperature:
-10°C to 50°C
Operation Humidity:
<85% RH
Altitude:
up to 2000M
Storage Temperature:
-20°C to 60°C
Storage Humidity:
<75% RH
Dimension:
210mm(L) x 62mm(W) x 35.6mm(H)
8.3" (L) x 2.5" (W) x 1.4" (H)
Weight:
200g (battery included)
Accessory:
Test leads, Carrying bag, Manual,
Steps of Battery Replacement:
1.5V AA battery x 2
1. Unscrew and remove the battery with cover.
Alligator clips
2. Put in a new recharging battery with cover.
Option:
3. Screw the battery cover.
55
56
Please follow the below steps to charge the lithium battery:
VIII. Fuse Replacement
1. Connect the AC Adaptor with the Analyzer.
2. The charging can be done without turning on the Analyzer.
When the voltage can not be measured (Vnow = 0V) after properly
3. The recharging takes 10 hours. After recharging, remove the AC
connecting the Analyzer and solar panel, please check the fuse. If the fuse
Adaptor.
is damaged (burned), please replace a new fuse by following the
4. Turn on the Analyzer, and the LCD displays “Battery: 100%”.
procedures:
1. Turn off the Analyzer and remove all the connecting wires and power
sources.
2. Unscrew the (2pcs.) screws of the top panel. Remove the top panel.
3. Remove the damaged (burned) fuse.
4. Put in a new fuse of the same specifications (5A / 250V).
5. Restore the top panel and screw the (2pcs.) screws of the top panel.
Fuse
57
58
IX. Maintenance & Cleaning
1. Servicing not covered in this manual should only be performed by
qualified personnel. Repairs should only be performed by qualified
personnel.
2. Periodically wipe the case and cable with a damp cloth and detergent; do
not use abrasives or solvents.
3. Please remove the batteries if users won’t use the solar analyzer and
optional clamps for a long time.
59