1
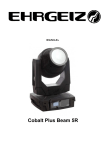
Akton Psychrometric Chart Tutorial and Examples December 1999 Akton Associates Inc. 3600 Clayton Road, Suite D Concord, California 94521 (925) 688-0333 http://www.aktonassoc.com Copyright 1999 Akton Associates Inc. APC Tutorial / Examples Table of Contents Tutorial 4 Introduction...................................................................................................... 4 Starting the program........................................................................................ 5 Psychrometric properties................................................................................. 6 Creating points ................................................................................................ 8 The report window ......................................................................................... 12 Editing points ................................................................................................. 14 Customizing the chart.................................................................................... 16 2 Example 1: Analysis of a point 18 Example 2: Moist air heating 22 Example 3: Moist air cooling 25 Example 4: Adiabatic mixing of moist air streams 29 Example 5: Adiabatic mixing of water injected into air 32 Example 6: Air conditioning a space 35 APC Tutorial / Examples Tutorial / Examples The tutorial is meant to be a series of exercises to demonstrate the essential features of the Akton Psychrometric Chart for Windows Version 4. By working through the tutorial instructions, you should have an understanding of the basic program elements and how they work together. This tutorial is meant to focus on the most basic elements of program operation. The example problems further demonstrate program usage, but also emphasize problem solving techniques. This set of examples are variations on examples presented in The ASHRAE Handbook of Fundamentals. ASHRAE is the American Society of Heating, Refrigeration and AirConditioning Engineers. Chapter 6 on psychrometrics presents examples involving the same type of problems, along with the theory, principals, and calculations involved in solving the examples manually using a psychrometric chart. The examples presented here, are for the purpose of familiarizing the user with the use of the program. They are presented assuming the user to have a basic understanding of psychrometrics. They where not intended to be a substitute for the study of psychrometrics, that most engineers and many laymen have undergone. The solutions to these examples as presented here are by no means the only way of solving these problems using this software. They may not even be the best way to solve these problems. They are just one possible way to solve these problems, and are presented in this form, to help familiarize the user with some of the features of the program. 3 APC Tutorial / Examples Tutorial Introduction This tutorial is meant to demonstrate some of the essential features of the Akton Psychrometric Chart for Windows Version 4. By working through this tutorial you should gain a basic understanding of the essential program features necessary to begin applying the program to problems involving psychrometrics. The goal of the tutorial is to get you up and going so that you can begin to explore the program’s capabilities on your own, it does not go into any of the more advanced features of the program. There is a general tendency through out this program, and often in other windows programs as well, to provide a consistent interface by associating certain mouse events with conceptual actions. All of the windows in the Akton Psychrometric Chart are interactive, and a variety of tasks can be accomplished using the mouse. It is generally useful to think of the following mouse events as described below. Left mouse clicks: select, create Right mouse clicks: edit, alter, modify Left mouse double clicks: activate, transfer, confirmed select Left mouse drag: move, size 4 APC Tutorial / Examples Starting the program The setup program will either create a new program folder on your start menu or it will add icons to a folder of your choosing. You can click on the “Psychrometric Chart” icon to start the program, or choose it from your start menu. When the program opens for the first time you should see a chart much as below. There are two windows that are always open while the program is running. The main chart window, and the “Psychrometric Properties” window. If you move or resize these windows they will retain those attributes next time you start the program. Both of these windows are usually necessary during the use of the program. The properties window serves not only to display the current values for the properties. But also as a menu of available properties while defining points on the chart. You should take a little time to arrange these windows on your screen such that both are available and easily view while using the program. 5 APC Tutorial / Examples Psychrometric properties Interaction with properties occurs in the window titled “Psychrometric Properties.” Many important features of the program are managed using the properties window. The properties window can be interacted with using the mouse in a number of ways. Click and hold on any property using the left mouse button. Note that you can drag the property around the window to any location you like. To select a new property, click on an open space using the left mouse button. This will invoke a dialog box titled “Choose Property.” The “Choose Property: dialog box presents a list of all the built in properties that can be used. The list can display the properties using either their long description or their shorter symbols by clicking on the symbols button. 6 APC Tutorial / Examples If you followed the preceding instructions, the “dew point temperature (delta)” property should now be in the properties window where you clicked in open space. All of the psychrometric properties displayed in the properties window can be edited. Click on the property you just added with the right mouse button, to edit the property. Properties are edited using the dialog box shown below titled “Psychrometric Property.” Here you can edit any of the attributes of the property you selected. You can also obtain reference information about the property. If you click on the help button it will open the “User’s Manual” help file to the page describing the dialog box. You can get detailed information about an element of the dialog box by clicking on it inside the help file. 7 APC Tutorial / Examples Creating points Interaction with the chart occurs in the chart window. Note that as you move the cross hair cursor around the chart, that the values are updated in the properties window. Click anywhere on the chart with the left mouse button, this will invoke a dialog box titled “Creating Point” dialog box. The “Creating Point” dialog box appears with the current values for the point you selected on the chart. It takes four properties to define a point using the PFL. The first is the pressure property. The second and third are specific properties. The fourth property is a mass property. Two independent specific properties are required to define a point. Properties are sent to the “Creating Point” dialog by double clicking on them in the “Psychrometric Properties” window while the Creating Point dialog is open. The two radio buttons on the left indicate which property box will receive the next specific property if selected. Take some time to play with this dialog and observe how it functions. The most important feature to become familiar with now is how it interacts with the properties window. Double click on some of the properties in the properties window and observe the results in the dialog box. There are three types of points, indicated by the radio buttons on the right. Only currently valid point types are available. The first point on a chart is always a “Entry” point. Entry points are normally points where mass is entering the system or model. For the purpose of this tutorial we will define the first point at 70% relative humidity, and 80 degrees dry bulb temperature. First transfer the “relative humidity” property to the “Creating Point” dialog box, double click on the relative humidity property in the “Psychrometric Properties” window using the left mouse button. Note that the property has been sent to the “Creating Point” dialog box and that the radio button has progressed to the next property. Edit the value of relative humidity to be 70%, and then click on the calculate button. Note that the values in the ”Psychrometric Properties” window were updated when you clicked on the calculate button. Click on the OK button and the dialog box disappears and the point appears on the chart. 8 APC Tutorial / Examples 9 APC Tutorial / Examples Note that the delta properties inside the “Psychrometric Properties” window now have values as you move the cross hair cursor over the chart. Next define a second point on the chart, by again clicking on the chart with the left mouse button. This point will be a process point. Transfer the “humidity ratio (delta)” and the “dry bulb temperature (delta)” properties to the Creating Point dialog box by double clicking on them in the Psychrometric Properties window. Edit them to be -0.005 lbm/lbm and -10 °F respectively. 10 APC Tutorial / Examples After you have clicked “OK” and the point is added, the process should now be plotted on the chart as follows. 11 APC Tutorial / Examples The report window A process report can be generated summarizing the process by choosing the “Data - Process Report” menu option from the “Data” pick on the main menu. The properties that are displayed on the report, and the order in which they appear can also be selected from the “Report” box in the “Psychrometric Property” dialog box. 12 APC Tutorial / Examples 13 APC Tutorial / Examples Editing points Once points are established on the chart there are three ways to edit them. The point can be selected using the “Edit Point” pick under the edit menu of the main chart window. A more convenient way is to right click near a point on the chart using the mouse. It is also possible to edit points by right clicking on lines in the report window. Click on the chart close to the point that has been created with the right mouse button. The “Editing Point” dialog box appears with the definition of the nearest point. The “Editing Point” dialog box is the same as the “Creating point” dialog box but with a different title. For the purposes of this tutorial, redefine the point to be 50% relative humidity, and 100 °F dry bulb temperature. When finished click on the “OK” button and note that the process has been redefined as shown on the following chart. 14 APC Tutorial / Examples 15 APC Tutorial / Examples Customizing the chart The chart can be customized in a number of ways. Most of the attributes of the chart are independent of the attributes of the properties. For example the units selected for an axis of the chart are not necessarily the same units selected for the property in the properties window. The only exception to this is barometric pressure which must remain constant through out all calculations. The appearance of the chart can be configured through the use of the “Chart Options” property sheets. Use the “Chart Options” pick under the view menu of the main chart window to invoke this dialog box. 16 APC Tutorial / Examples There are five properties that can be plotted on the chart. Each of these properties have a number of attributes that effect the appearance of the chart. The user may select fonts, colors, line widths, and more for each of the properties plotted on the chart. Three of the properties can be plotted on either a dry or moist air basis, as such specific humidity can be substituted for humidity ratio. Use the help button to obtain detailed information about each area of the dialog box and its property sheets. 17 APC Tutorial / Examples Example 1: Analysis of a point Moist air exists at 95° F dry-bulb temperature, 50% relative humidity, and 29.921 in. Hg pressure (sea level). Determine the humidity ratio, enthalpy, dew-point temperature, relative humidity and specific volume. Then find the same properties under the same conditions at 5000 Ft elevation. Key Points: This example demonstrates. 1. How to create a point on the chart 2. How to select properties to define the point 3. How to generate a process report 4. How to change the pressure for the chart Step 1 Move the cross hair cursor over the chart to a point approximately correct for 95° dry-bulb and 50 % relative humidity and click once with the left mouse button. This will invoke the Creating Point dialog box as shown in step 2. 18 APC Tutorial / Examples Step 2 For this problem the results can be read directly from the properties window while the Creating Point dialog box is open. 19 APC Tutorial / Examples Step 3 Select the Process Report pick from the data menu in the chart window to generate a report as shown below. You have now completed part one of this example. The properties with an asterix next to them indicate which properties have been used to define the point. 20 APC Tutorial / Examples Step 4 We can now solve part two of this example by simply changing the pressure for the chart. Select the Chart Options menu pick from the view menu on the chart window. The program should present the property page shown below. Notice that the process report has been updated. We have just solved part two of this example problem. 21 APC Tutorial / Examples Example 2: Moist air heating Moist air, saturated at 42 °F, enters a heating coil at a rate of 22,000 cfm. Air leaves the heating coil at 95 °F. Find the required rate of heat addition in Btu/hr. Key Points: This example demonstrates: 1. The creation of a simple process on the chart 2. How to navigate around the chart using the combination of the “Calculate” and the “Add Point” buttons. Step 1 Select and configure the properties necessary to solve the problem inside the Psychrometric Properties window. Other properties may be of interest, but only the essential ones are shown below. Step 2 Define the first point: Click on the chart with the left mouse button, transfer relative humidity. Enter the values as shown below, and then click on the “Add Point” button 22 APC Tutorial / Examples Step 3 By clicking on the “Add Point” button in the previous step, all the properties retain their values. All that is necessary to solve the problem is to replace the relative humidity property with humidity ratio property, and then edit dry bulb temperature to be 95 F. Click on the “Calculate” button and the value can be read in the Psychrometric Properties window. Click on the “OK” button and the process will be displayed on the chart. The combination of the “Calculate” button and changing properties can be a convenient tool in to quickly create processes on the chart. 23 APC Tutorial / Examples Step 4 A process report can be generated by choosing the “Process Report” pick from the “Data” menu. The contents of the process report are selected by editing the properties in the Psychrometric Properties window. This example demonstrates the use of the calculate and add point buttons. However a more dynamic model could have been created by using the dW property set to 0 for point 2. Perhaps doing so now would be a worthwhile exercise. 24 APC Tutorial / Examples Example 3: Moist air cooling Moist air at 90 °F and 50% relative humidity enters a cooling coil at 12,000 cfm and is processed to final condition at 56 °F at saturation. Find the cooling load. Key Points: This example demonstrates: 1. The relationships between the energy properties. 2. The change in mass as the rate of rejected water. Step 1 Select and configure the properties necessary to solve the problem inside the Psychrometric Properties window. Eight possible properties of interest have been selected. A discussion of the energy properties follows later in this example. 25 APC Tutorial / Examples Step 2 Define the first point: Click on the chart with the left mouse button, transfer relative humidity and volume rate to the Creating Point dialog box. Enter the values as shown below, and then click on the “OK” button Step 3 Define the second point: Click on the chart with the left mouse button. This time the relative humidity and volume rate should already be selected in the Creating Point dialog box. Enter the values as shown below, and then click on the “Calculate” button. The answer can be read now in the Psychrometric Properties window. “Q” represents the total heat added or removed. It is negative, indicating cooling. The change in total mass “dm” can be used to describe the rejected water. Click on the “OK” button to have the process drawn on the chart. 26 APC Tutorial / Examples 27 APC Tutorial / Examples Step 4 Generate a process report. Discussion: There are four energy properties used in this example. It may be worth taking some time to learn about them. “Ql” represents the latent energy, “Qs” represents the sensible energy, “Qw” represents the energy of the rejected or added water, and “Qtot” represents the total energy. “Ql” is related to two other properties, by default they are represented by “hl”, and “El”. “hl” is the specific latent enthalpy, and is calculated simply as “W” x (Heat of vaporization). The heat of vaporization is a constant that can be accessed using the PFL configuration utility. Normally this constant is set to be the heat of vaporization of water at the indicated temperature of zero enthalpy. “El” is an intermediate term, it is calculated as (mass of dry air) x “hl”. It is of little interest in most applications, it is used to generate “Ql”. “Ql” is calculated as (“El” at point 2) - (“El” at point 1). “Qs” has a similar relation to two properties, by default they are represented by “hs” and “Es”. More information is available in the PFL help file. “Qw” can be thought of as the energy required to raise the rejected or added water to the exit or entrance temperature. If this term were to be ignored the water being added or rejected, would be being added or rejected at the temperature of zero enthalpy. “Qtot” is calculated in the end as Qtot = Ql + Qs - Qw 28 APC Tutorial / Examples Example 4: Adiabatic mixing of moist air streams A 8000 cfm stream of moist outside air at 44 °F dry-bulb temperature and 36 °F thermodynamic wet-bulb temperature is adiabatically mixed with 18,000 cfm of recirculated air at 78 °F dry-bulb temperature and 50% relative humidity. Find the dry-bulb temperature and the thermodynamic wet-bulb temperature of the resulting mixture. Key Points: This example demonstrates: 1. How to create mix points and mix streams Step 1 Select and configure the properties of interest in the Psychrometric Properties window. Below the essential properties for this problem are selected. Step 2 Define the first point on the chart as shown below. The first point as in the previous examples, and as required by the program is an “Entry” point. 29 APC Tutorial / Examples Step 3 Define the second point on the chart. This time designate the new point to be an “Entry” point by clicking on the “Entry” radio button on the right hand side of the Creating Point dialog box. Step 4 Define a third point on the chart. The third point will be a “Mix” point. A mix point is a fully constrained point, defined by the preceding points. No properties need be defined. 30 APC Tutorial / Examples Step 5 After all three points have been defined, the results should be plotted on the chart as shown below. Generate a process report and observe the results. 31 APC Tutorial / Examples Example 5: Adiabatic mixing of water injected into air Moist air at 72 °F dry-bulb temperature and 50 °F thermodynamic wet-bulb temperature. is to be processed to a final dew point temperature of 55 °F by adiabatic injection of saturated steam. at 230 °F. The rate of moist air flow is 250 lbm/min. Find the dry-bulb temperature of the moist air and the rate of steam flow required. Key Points: This example demonstrates 1. Injection of saturated steam into moist air Step 1 Select and configure the properties of interest in the Psychrometric Properties window. Below the essential properties for this problem are selected. Step 2 Define the first point on the chart as required by the problem, and as shown in the Creating Point dialog box below. 32 APC Tutorial / Examples Step 3 Define the second point on the chart. By referring to a saturated steam table obtain the enthalpy value for saturated steam at 230 °F. You should obtain a value close to 1157 Btu/lbm. Note the temperature of zero enthalpy for the steam table, it should be 32 °F. If the temperature of zero enthalpy is aligned, then the “dh/dW” ratio corresponds directly to the specific enthalpy of the injected steam. Define the second point in the as shown below. Click on the “OK” button and you should observe the process on the chart as follows. 33 APC Tutorial / Examples Step 4 Generate a process report. The change in mass corresponds directly to the rate of steam injection at 1.606 lbm/min. The resulting dry-bulb temperature is 73.7 °F. 34 APC Tutorial / Examples Example 6: Air conditioning a space Moist air is with drawn from a room at 82 °F dry-bulb temperature and 65 °F thermodynamic wet-bulb temperature. The sensible rate of heat gain for the space is 28,000 Btu/hr. A rate of moisture gain of 8 lbm/hr occurs from the space occupants. This moisture is assumed as saturated water vapor at 88 °F. Moist air is introduced into the room at a dry-bulb temperature of 58 °F. Find the thermodynamic wet-bulb temperature and volume flow rate of the supply air. Key Points This example demonstrates 1. Using the calculate button to find a solution by trial and error. For the sake of demonstrating program capabilities we are going to solve this problem by trial and error. We will solve the problem backwards so to speak, defining the exit conditions before the entry conditions. In solving the problem this way we are neglecting any difference in the enthalpy of saturated water vapor between 58 °F and 88 °F (1086 vs. 1099 Btu/lbm). This is because the program assumes that water is always added as vapor at entry conditions and removed as vapor at exit conditions, for any given process on the chart. Step 1 Select and configure the properties of interest in the Psychrometric Properties window. Below the essential properties for this problem have been selected and configured with units convenient for this problem. 35 APC Tutorial / Examples Step 2 Define the exit point (remember we are working this problem backwards) on the chart as described in the problem. We do not actually know the volume or mass flow rate at this time, so enter an initial guess of 1000 cfm. Step 3 Define the entry point in accordance with the problem description. It is necessary to change the sign of the values because we are creating the points in the reverse order of the actual process. 36 APC Tutorial / Examples Step 4 Close the Creating Point dialog box and generate a process report similar to the one below. Step 5 Leave the process report on the screen in a convenient location, and click on the chart near the first point using the right mouse button. This will bring the first point up in the Editing Point dialog box. Now increase the volume rate an increment, and click on the calculate button. Notice that the process report now reflects this change. Continue to adjust the volume rate and click on the calculate button until the desired end conditions (58 °F) for point two are met. 37 APC Tutorial / Examples Below is the final process on the chart. 38