1
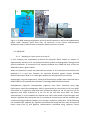
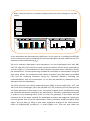
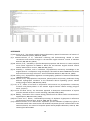
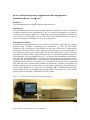
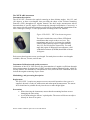
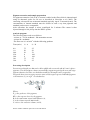
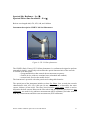
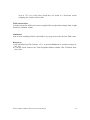
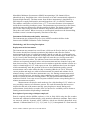
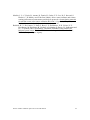
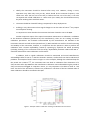
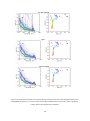
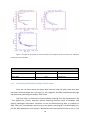
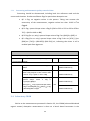
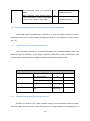
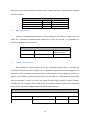
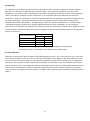
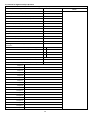
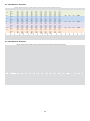
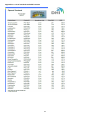
of the dark counts has shown drifts of ±1 counts over 1 month and ±2 counts over 8 years. The scaling factors change at different rates with time for each channel: Blue 8% y-1 Green 1-2% y-1 Red 3-4% y-1 An example of the scaling factor (Sf, in sr-1 m-1 counts-1) drift is shown in Figure 4. In this example, the calculated % change per year was 4, 5 and 23%y-1 for the blue, green and red channels respectively. The greater increase on the slope was observed after the second year. The date of the last checked value of dark count and Sf should be recorded in the QAD. Figure 4. Change of calibration scaling factors (Sf) as a function of time for the three channels for a Wetlabs backscatter meter ECO BB3 monitored at PML. A. INSTRUMENT / METHOD CHECK 1. Sensor output check 2. Calibration Before measurement Y/N After measurement Y/N Instrument wash down Y/N Instrument cleaned Y/N Date of factory calibration Y/N 16