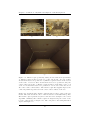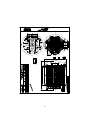
1
Space and Plasma Physics Department KTH, Kungliga Tekniska Högskolan SE-100 44 Stockholm Sweden Temperature Control of Space Simulation Chamber June 11, 2012 Author: Robert Hellqvist Supervisors: Nickolay Ivchenko Karin Woxlin Jonas Leijon Per Westin Master of Science Thesis Stockholm, Sweden 2012 XR-EE-SPP 2012:004 Abstract Equipment to be used in space needs to be thoroughly tested for the extreme environment that such an object is exposed to. Depending on where on the satellite the equipment is positioned, different thermal and pressure environments need to be tested for. For instance, equipment located on the outside of a satellite will experience greater thermal variations compared to internally positioned equipment. This thesis work regards a space simulation chamber, located at RUAG Space in Gothenburg, designed to test for the expected extremes of a space environment. The space simulation chamber, thermal vacuum chamber, is mainly used to test externally mounted antennas. The considered tests are required to be highly temperature accurate in order to ensure that the tested equipment is not subjected to temperatures outside of its specified operating range. The temperature control of the chamber is not functioning as specified. The main problem is to maintain stable temperature plateaus during cooling. Two individual control systems are used: one for heater control and one for input coolant control. The control algorithm used during cooling is heuristic and designed without mathematical knowledge of the system. This thesis work aims to improve the temperature control system designed to regulate the cold environment. In order to do so, the system components and their functionality are investigated. The system dynamics are modeled and tested. A linear quadratic controller that rest on the derived dynamics is developed and tested in order to obtain a control law that steers the system to specifications. Acknowledgements I would like to express my gratitude to Ruag Space Gothenburg that have presented me with the opportunity of this thesis work. I would especially like to express my appreciation to my supervisors at Ruag Space: Karin Woxlin, Jonas Leijon, and Per Westin for their invaluable advice and input regarding every step of the project. I have learned a great deal thanks to my supervisors continuous help, both in an analytical sense and in a practical sense. Special thanks to Ulrika Larsson at Ruag for her kindness and interest in my work. I would like to thank my supervisor at the Space and Plasma Physics department Dr. Nickolay Ivchenko, for his guidance and help throughout my thesis. Erik Olofsson (Ph.D student at the Fusion Physics department), provided me with useful insights regarding system analysis. My friends and family have been most supportive and helpful during this work and I would have had a hard time concluding my studies without your help. Contents 1 Introduction 6 2 Thermal Vacuum Chamber 2.1 Vacuum System . . . . . . . . . . . . . . 2.1.1 Backing Pump . . . . . . . . . . 2.1.2 Roots Pump . . . . . . . . . . . 2.1.3 Cryogenic Pump . . . . . . . . . 2.1.4 Zeolite Traps . . . . . . . . . . . 2.2 Thermal Control System . . . . . . . . . 2.2.1 Thermal Control Surfaces . . . . 2.2.2 Heating System . . . . . . . . . . 2.2.3 Cooling System . . . . . . . . . . 2.3 System Control . . . . . . . . . . . . . . 2.3.1 Human Machine Interface . . . . 2.3.2 Manual Control . . . . . . . . . . 2.3.3 Temperature Monitoring System . . . . . . . . . . . . . . . . . . . . . . . . . . . . . . . . . . . . . . . . . . . . . . . . . . . . . . . . . . . . . . . . . . . . . . . . . . . . . . . . . . . . . . . . . . . . . . . . . . . . . . . . . . . . . . . . . . . . . . . . . . . . . . . . . . . . . . . . . . . . . . . . . . . . . . . . . . . . . . . . . . . . . . . . . . . . . . . . . . . . . . 3 Heat Transfer 3.1 Convection . . . . . . . . . . . . . . . . . . . . . . . . 3.1.1 The Knudsen Number . . . . . . . . . . . . . . 3.2 Conduction . . . . . . . . . . . . . . . . . . . . . . . . 3.3 Radiative Heat Transfer . . . . . . . . . . . . . . . . . 3.3.1 Effective Emissivity of Infinite Parallel Plates . 3.3.2 View Factors . . . . . . . . . . . . . . . . . . . 3.3.3 Radiative Heat Emission of Interacting Finite the Net-radiation Method . . . . . . . . . . . . 3.3.4 Radiative Exchange Factors . . . . . . . . . . . 3.3.5 Monte Carlo Approach . . . . . . . . . . . . . . . . . . . . . . . . . . . . . . . . . . . . . . . . . . . . . . . . . . Surfaces, . . . . . . . . . . . . . . . . . . 4 System Modeling and Analysis 4.1 Convective Heat Transfer . . . . . . . . . . . . . . . . 4.2 Shroud losses . . . . . . . . . . . . . . . . . . . . . . . 4.2.1 Conductive Heat Rate Loss of Thermal Shroud 4.2.2 Radiative Heat Rate Loss of Thermal Shroud . 4.3 Radiative Coupling Between Shroud Faces . . . . . . . 4.4 Conductive Coupling Between Shroud Faces . . . . . . 4.5 System Dynamics . . . . . . . . . . . . . . . . . . . . . 4.6 Linearization . . . . . . . . . . . . . . . . . . . . . . . . . . . . . . . 1 . . . . . . . . . . . . . . . . . . . . . . . . . . . . . . . . . . . . . . . . 8 9 10 10 11 12 12 13 15 16 16 19 20 21 22 22 22 23 23 24 25 26 28 28 31 31 31 31 34 35 36 36 37 CONTENTS 4.7 4.8 Analytical Comparison of Linear and Nonlinear Dynamics . . . . Dynamics Including Control Signals . . . . . . . . . . . . . . . . 38 39 5 Verification of Dynamics and Input Coolant Investigations 5.1 Experimental Set-up . . . . . . . . . . . . . . . . . . . . . . . . . 5.2 Model Verification . . . . . . . . . . . . . . . . . . . . . . . . . . 5.2.1 Temperature Gradients . . . . . . . . . . . . . . . . . . . 5.2.2 Temperature Decrease Without Energy Input . . . . . . . 5.2.3 Temperature Increase Without Energy Input . . . . . . . 5.2.4 Thermal Coupling Between Test Table and Thermal Shroud 5.2.5 Conclusion . . . . . . . . . . . . . . . . . . . . . . . . . . 5.3 Estimation of Input Coolant . . . . . . . . . . . . . . . . . . . . . 5.3.1 Coolant Power When All Cryogenic Valves are Opened . 5.3.2 Conclusion . . . . . . . . . . . . . . . . . . . . . . . . . . 5.3.3 Coolant Power When Test Table Cryogenic Valve is Opened 5.3.4 Conclusion . . . . . . . . . . . . . . . . . . . . . . . . . . 5.4 Pulse Duration Modulation Investigation . . . . . . . . . . . . . . 5.4.1 Conclusion . . . . . . . . . . . . . . . . . . . . . . . . . . 41 41 44 44 45 46 47 47 47 48 51 51 53 53 54 6 Controller Design and Simulation 6.1 Linear Quadratic Control . . . . . . . 6.1.1 Reachability and Observability 6.1.2 Reference Tracking . . . . . . . 6.1.3 Kalman Filter . . . . . . . . . . 6.2 Simulation of Closed Loop . . . . . . . 6.3 Analysis of Closed Loop System . . . . 55 55 56 57 58 59 60 7 LQ 7.1 7.2 7.3 . . . . . . . . . . . . . . . . . . . . . . . . . . . . . . . . . . . . . . . . . . . . . . . . . . . . . . . . . . . . . . . . . . . . . . . . . . . . . . . . . . . . . . . . . . Controller Design Tool 63 Setting the Weight Matrices . . . . . . . . . . . . . . . . . . . . . 64 Settings and Activity Log . . . . . . . . . . . . . . . . . . . . . . 64 Simulation and Controller Generation . . . . . . . . . . . . . . . 65 8 Implementation 8.1 Analog Control in Practice . . . . . . . . . . . . . 8.1.1 Two Dimensional Example . . . . . . . . . 8.2 Control Signal through Pulse Duration Modulation 8.2.1 Coolant Estimation . . . . . . . . . . . . . 8.2.2 Pulse Duration Modulation Algorithm . . . 8.3 System Modifications . . . . . . . . . . . . . . . . . 8.4 Numbering of Control Surfaces . . . . . . . . . . . . . . . . . . . . . . . . . . . . . . . . . . . . . . . . . . . . . . . . . . . . . . . . . . . . . . . . . . . 66 66 66 67 67 68 69 69 9 Conclusion 70 Bibliography 72 Appendices 76 2 List of Figures 1.1 Chamber temperatures during a problematic cycle. . . . . . . . . 2.1 2.2 2.3 2.4 2.5 2.6 2.7 2.8 2.9 2.10 2.11 2.12 2.13 2.14 External views of the thermal vacuum chamber. . . . . . . . . Internal views of the thermal vacuum chamber. . . . . . . . . Schematic representation of the vacuum system. . . . . . . . Roughing pump . . . . . . . . . . . . . . . . . . . . . . . . . . Roots pump . . . . . . . . . . . . . . . . . . . . . . . . . . . . Zeolite trap . . . . . . . . . . . . . . . . . . . . . . . . . . . . Schematic representation of the thermal control system . . . Model of the thermal shroud with test table. . . . . . . . . . Close-up of the thermal shroud and the reflective octagon . . Schematic representation of the thermal control system . . . Front of one of the PID controllers mounted on Cabinet 2. . . Pneumatic control and communication . . . . . . . . . . . . . The systems overview screen in the human machine interface. Configuration screen of the human machine interface . . . . . . . . . . . . . . . . . . . 8 9 10 10 11 12 13 13 14 17 17 18 20 21 3.1 3.2 Volume enclosed by n arbitrary surfaces . . . . . . . . . . . . . . Calculated view factors from face i to face 1. . . . . . . . . . . . 26 29 4.1 4.2 4.3 4.4 4.5 4.6 Illustrations of shroud mounting rods . . . . . . . . . . . . . . . . Thermal circuit of conductive heat transfer. . . . . . . . . . . . . Conductive heat loss. . . . . . . . . . . . . . . . . . . . . . . . . . Assumed cross-section of TVC. . . . . . . . . . . . . . . . . . . . The radiative heat rate loss of shroud face i . . . . . . . . . . . The temperature of face 1 plotted against the time, implementing the nonlinear model and the linear approximation. . . . . . . . . Comparison between linear and nonlinear models. . . . . . . . . . 32 32 33 34 35 Thermocouple positioning during model verification experiments Thermocouple wiring harness. . . . . . . . . . . . . . . . . . . . . Test table temperature variation. . . . . . . . . . . . . . . . . . . Temperature variations of face 3. . . . . . . . . . . . . . . . . . . Comparison between measured and simulated temperatures. . . . Comparison between measured and simulated temperatures. . . . Temperature decay, from room temperature, of test mount when the shroud is held constant at 113 K . . . . . . . . . . . . . . . . 42 43 44 45 46 46 4.7 5.1 5.2 5.3 5.4 5.5 5.6 5.7 3 . . . . . . . . . . . . . . 6 38 39 47 LIST OF FIGURES 5.8 5.13 5.14 Temperature decay of all faces when maximum coolant input is applied. . . . . . . . . . . . . . . . . . . . . . . . . . . . . . . . . Comparison between measurements and approximated temperature polynomial . . . . . . . . . . . . . . . . . . . . . . . . . . . Maximal cooling power available. . . . . . . . . . . . . . . . . . . Total cooling power as function of time. . . . . . . . . . . . . . . Temperature decay of all faces when maximum coolant input is applied to the test mount. . . . . . . . . . . . . . . . . . . . . . . Cooling power in total and at face 15 . . . . . . . . . . . . . . . Pulse duration modulation experiments . . . . . . . . . . . . . . 6.1 6.2 6.3 6.4 Closed loop including LQ-regulator Simulation of closed loop . . . . . Singular values . . . . . . . . . . . Closed loop Simulink simulation. . 7.1 7.2 7.3 7.4 Developed controller design tool. . . . . . . Setting of weight matrices. . . . . . . . . . . The dialog boxes Settings and Activity Log. Developed controller design tool. . . . . . . 8.1 5.9 5.10 5.11 5.12 49 50 51 52 52 53 . . . . . . . . . . . . . . . . . . . . . . . . . . . . . . . . 59 60 61 62 . . . . . . . . . . . . . . . . . . . . . . . . . . . . . . . . 63 64 64 65 Complete closed loop system . . . . . . . . . . . . . . . . . . . . 67 4 and integrator . . . . . . . . . . . . . . . . . . . . . . . . . . . 48 . . . . . . . . . . . . . . . . Nomenclature kb λm Lc Kn dm λ T S Rth A Acontact hc p σ c q Q dQ dt ε α ρ ∆Hvap FAi →Aj RAi →Aj Cc Cl Rc Rl A B C ∆T~ (t) ∆~y (t) ∆~r(t) ∆~u(t) Γ Ω Ts Boltzmann constant Mean-free path Characteristic length Knudson number Molecular diameter Conductivity Absoulut temperature Conductional shape factor Conductive heat resistance Crossectional or surface area Contact area between two conducting materials Contact conductivity Pressure Stefan Boltzmann Constant Specific heat capacity Heat flux or power per unit area Heat Heat rate, heat current, or power Emissivity Absorptivity Reflectivity Enthalpy of vaporization View factor from element i to j Radiative exchange factor from element i to j or vice versa Matrix describing the conductive couplings between control surfaces Matrix describing the conductive losses of the system Matrix describing the radiative couplings between control surfaces Matrix describing the radiative losses of the system State matrix of linearized system Input matrix of linearized system Output matrix of linearized system State vector Output Reference Control signal Reachability matrix Observability matrix Sampling time 5 Chapter 1 Introduction Ruag Space is a Swiss owned company that supplies the European space industry with space technology. Equipment is developed, manufactured, and tested at their facilities. This thesis work regards one of the many thermal vacuum chambers located at Ruag Space Gothenburg. The testing environment in question is a large thermal vacuum chamber used mainly to test externally mounted satellite equipment, such as antennas. The cooling of the chamber occurs through the use of liquid nitrogen evaporation while heating is achieved by means of electrical heaters. The aim of the work is to improve the control system used to regulate the temperature in this testing environment. The current control algorithm is complex and designed heuristically. It does not perform to specification and needs to be improved. The main issues include maintaining stable temperature plateaus during cooling, a necessary algorithm requirement due to the strictly specified testing cycles. An example of a cycle illustrating such problems is shown in Figure 1.1. (a) (b) Figure 1.1: Chamber temperatures during a problematic cycle. The red curve quantifies the temperature of the test object mounting position. a) Temperatures of entire problematic cycle. b) Close-up of the unstable region of the cycle. 6 Chapter 1. Introduction The chamber principles of operation and functionality are investigated in order to develop an understanding of the system at hand. The result is presented as a brief manual, see Chapter 2, which is used as a stepping stone for the proceeding work. The manual includes descriptions of: the elaborate pumping system, the current thermal control system, etc. The thermal dynamics of the testing environment is modeled through the use of well established heat transfer theory, see Chapter 3. The thermal analysis software ESATAN is used to derive the radiative heat transfer couplings within the chamber. All other modes of heat transfer are investigated analytically. The model derivation is described in Chapter 4. The derived model is compared to the physical system through relevant experiments and the use of Matlab, see Chapter 5. Little is known about the amount of coolant input that is acquired through the liquid nitrogen. Therefore, the derived dynamics are used to develop an understanding of the input dependencies and complexity. The experimental results and conclusions regarding the coolant input are summarized in Chapter 5. A linear quadratic control law is selected to steer the dynamics to specification. The theory behind such a controller is presented in Chapter 6. Finally, the closed loop system is investigated to ensure satisfactory performance. Furthermore, a controller design tool is developed. The design tool, see Chapter 7, is a graphical user interface enabling the user to change control parameters and simulate the resulting closed loop system. In Chapter 8, the control algorithm to be implemented is described. A suggestion of how to generate the control signal is presented along with the system modifications that need to be executed. The conclusions of the work are stated in Chapter 9. 7 Chapter 2 Thermal Vacuum Chamber The test chamber to be described in this chapter is shown in Figure 2.1 and Figure 2.2. This particular testing environment is situated at RUAG Space in Gothenburg. The Chamber is designed to simulate space like conditions in terms of pressure and thermal environment. The set-up consists of a thermal system and a vacuum system, both administrated through an extensive control and monitoring scheme. Figure 2.1: External views of the thermal vacuum chamber. 8 Chapter 2. Thermal Vacuum Chamber (a) (b) Figure 2.2: Internal views of the thermal vacuum chamber. The volume enclosed by the chamber casing is approximately 2.25 m3 . a) Thermal shroud and test mount. The intermediate octagon placed between the shroud and the casing is positioned to interup thermal radiation between the two. b) Heater and liquid nitrogen canal below test mount. 2.1 Vacuum System The system generating the required high vacuum consists of three different pumping systems: a backing pump, two Roots pumps, and a cryogenic pump. To control and regulate the pumping devices, several valves and gauges are incorporated into the arrangement. A rough, schematic outline of the set-up is visualized in Figure 2.3. All valves are pneumatically controlled through the module Pneumatic Island 1, PI1 in the figure. The pump and cryo-compressor control is executed by the device denoted Cabinet 2. The control of these modules will be further described in the Section 2.3. The component identified as HVG is the high vacuum gauge. The high vacuum gauge measures the chamber pressure. This gauge is of type WRG-S NW25 and it can measure pressures ranging from 100 kPa to 0.1 µPa [6]. When the chamber pressure is to be increased to ambient (post testing), the vent valve, (V3 in Figure 2.3) is opened. Gaseous nitrogen then flows into the chamber. Nitrogen is used to increase the chamber pressure to avoid contamination of the system. All other labeled components and their functions are described in the following sections. 9 Chapter 2. Thermal Vacuum Chamber Figure 2.3: Schematic representation of the vacuum system, the vacuum chamber is denoted TVC. 2.1.1 Backing Pump The backing pump is a mechanical pump, represented by component B in Figure 2.3. This type of pump is used to bring down the pressure to the upper operating pressure boundary of the Roots pumps (components denoted R in Figure 2.3). Such a pump can bring the pressure level down from ambient to approximately 1 kPA [23]. In this particular configuration, a backing pump of type Evisa E100 is used, see Figure 2.4. This is an air cooled rotary vane vacuum pump with a nominal capacity of 96 cubic meters per hour. The pump motor power is specified as 2.2 kW when supplied with a 50 Hz alternating current. The supply voltage amplitude is 400 V at this frequency. The rotational speed of the rotor is specified as 1450 rpm [31]. Figure 2.4: Mil’s rotary vane industrial roughing pump [31]. 2.1.2 Roots Pump A Roots pump consists of two rotors axially mounted on two parallel axes. Two Roots pumps connected in series are incorporated into the vacuum system, labeled R in Figure 2.3. Figure 2.5b illustrates the principle of a Roots pump. The rotor rotation is synchronized through gears such that they counter rotate without touching. When the rotors rotate from position I to II , the intake volume is increased. In position III, part of the intake volume is closed off. In position IV this volume is opened to the exhaust side and intake gas is ejected. The pumping cycle is repeated twice each rotational period [24]. The rotors rotate without being in contact with each other or the housing; however, the 10 Chapter 2. Thermal Vacuum Chamber separation distances are not great (tenths of a millimeter). Due to these minuscule distances and high rotor speeds (2500 rpm−3500 rpm), a Roots pump is bound to generate great amounts of heat accompanied by a low pumping efficiency if initiated at pressures greater than approximately 1 kPa, thus justifying the need for a backing pump. A Roots pump is able to bring the chamber pressure level down to somewhere around 10 mPa [23]. The two water cooled Roots pumps used (see Figure 2.5a) are manufactured by Pedro Gil. These pumps are both powered by three phase AC motors, each with a power of 1.1 kW. The rotational speed is specified as 2850 rpm [11]. The backing pump and the Roots pumps decreases the chamber pressure through the connection opened by the valve denoted V2 in Figure 2.3. (a) (b) Figure 2.5: Roots pump. a) RVB 20-20 Roots pumps with motors. The motors are the green cylindrical extensions of the set-up [11]. b) Operational principle of a Roots pump [24]. 2.1.3 Cryogenic Pump A cryogenic pump is used to generate the required High vacuum, see label CP in Figure 2.3. The specific high vacuum pump used is of type Cryo-Torr, manufactured by VTI-cryogenics. The pump can be viewed as the cylindrical shape mounted on top of the thermal vacuum chamber in Figure 2.1. This type of pump utilizes extremely cold surfaces to condense and capture unwanted gas existing within the chamber. The pump is connected to the TVC by means of a high vacuum valve, HV in Figure 2.3, that is opened once the pump is to be initiated. The gas behavior is not dominated by particle collisions within the operating pressure range of the cryo-pump (100 mPa-1 µPa); therefore, the valve opening has to be large in order to increase the intensity of incoming particles. The surfaces designed to capture particles within the cryo-pump are cooled through a closed system of helium. The ”capturing” is achieved through the absorption of condensed liquid by a charcoal sieve material. Helium gas is compressed to liquid form by means of a connected cryogenic compressor (labeled CC in Figure 2.3). During this process, heat is expelled from the gas. The emitted energy is transferred to water within the compressor and removed 11 Chapter 2. Thermal Vacuum Chamber from the system. The liquid helium is allowed to expand near the capturing surfaces in the cryogenic pump, thus cooling them. The cycle is then restarted. The captured gas is not continuously removed from the cryogenic pump. It is the responsibility of the operator to remove the unwanted fluid every so often. The cryogenic pump needs to be reconditioned once it is impossible to cool the cooling elements below a certain temperature (approximately 20 K). When reconditioned, the cryogenic pump is heated such that the captured condensed gases are vaporized. The vapor is pumped out of the system through the connection opened by valve V1 illustrated in Figure 2.3. The temperature of the cryogenic pump can be monitored on the side of the TVC. 2.1.4 Zeolite Traps The components denoted by Z in Figure 2.3 are called Zeolite traps. Zeolite is a porous crystalline material. Fluids that normally are difficult to remove are trapped inside such a material, losing energy while bouncing around [23]. These devices prevent oil from creeping backwards through the pumping system, thus hindering contamination of the environment inside the TVC. The particular Zeolite traps used is of Molecular Sieve type, provided by Nor-Cal Products, see Figure 2.6. They are supplied with a 240 V regeneration heater, enabling a reconditioning process in the same fashion as the cryogenic pump reconditioning procedure [22]. Figure 2.6: Molecular Sieve Zeolite trap. The trap is connected in series to the Roots Pumps, seen to the left in the figure. 2.2 Thermal Control System The thermal control system consists of two separate subsystems mounted on an enclosing thermal shroud: one system to heat the object in the chamber, and one system to cool the same object. When combining the two different systems, a thermal cycle with approximate boundary temperature values of 200 ◦ C and −190 ◦ C can be achieved (the chamber rarely operates at temperatures less than −180 ◦ C and greater than 180 ◦ C in practice). 12 Chapter 2. Thermal Vacuum Chamber Figure 2.7: Schematic representation of the thermal control system 2.2.1 Thermal Control Surfaces The thermal shroud is a closed octagon placed inside the cylindrical stainless steel chamber, see Figure 2.2a. A total of fourteen connected faces embody the thermal shroud (schematically described in Figure 2.7). The shroud faces are constructed of a hard anode coated aluminum alloy (Al EN AW 5754). This specific alloy anodization is selected for welding purposes and its radiative properties. These panels are mounted in order to absorb and emit thermal radiation to and from the test object. The shroud numbering is presented in Figure 2.8. Figure 2.8: Model of the thermal shroud with test table. The numbering for later references is presented in this figure. The geometry is created in the thermal analysis software ESATAN. The back of the set-up in the figure consists of three faces with numbers 9, 10, and 11 counted from the top . Face 13 is absent so that the test table, labeled 15, can be seen. The test table is made of a decoratively anodized aluminum alloy (AL EN AW 5754). It is decoratively anodized in order to reduce oxidation and general wear of the material. The thermal shroud is connected to the chamber ceiling through a rail system in order to provide easy component access. The thermal connection between the shroud and the chamber casing consists of 12 stainless steel bolts (poor conductors of heat) together with the railing system which is welded solid to the casing. This conductive connection is shown in the top of Figure 2.9b. 13 Chapter 2. Thermal Vacuum Chamber There is a reflective octagon mounted on the outside of the considered surfaces. These connected panels interrupt heat radiation between the chamber casing and the shroud enclosure. The conductivity between the reflective octagon and the thermal shroud can be considered small since the panels are mounted using Teflon connections. The conductivity of Teflon is extremely low, see Table 2.2. The Teflon connections are the white rods connecting the reflective and shroud octagons in Figure 2.2a, Figure 2.9. (a) (b) Figure 2.9: Close-up of the thermal shroud and the reflective octagon. a) Connection between thermal shroud and reflective octagon. The Teflon connections are the white rods in the figure. b) Connection between reflective octagon and chamber casing. The radiating and absorbing areas of the thermal vacuum chamber are tabulated in Table 2.1. These values are calculated using the preliminary chamber blueprints, see Appendix 1. Control Surfaces Arad [m2 ] h [mm] 1-8 9 10 11 12 13 14 15 0.480 0.193 0.386 0.193 0.193 0.386 0.193 0.152 4.15 4.15 4.15 4.15 4.15 4.15 4.15 10.0 Table 2.1: Radiating and absorbing areas of control surfaces. Arad is the area of a radiating surface, and h is the measured thickness of such an area. 14 Chapter 2. Thermal Vacuum Chamber Materials Al EN AW 5754 Decoratively anodized ε [-] 0.8 λ [W/mK] 250 c [J/kgK] 900 Al EN AW 5754 Hard anodization 0.88 135 920 Stainless Steel 0.05-0.15 15 500 Teflon 0.85 0.25 500 Table 2.2: Material Properties. Even though the specific heat is a bulk property, the values corresponding to the aluminum alloy are set as slightly different in an attempt to account for the surface coating. Table 2.2 quantifies the estimated material parameters of the thermal vacuum chamber. The emissivity of the aluminum alloy has been estimated through literature studies and experiments performed by RUAG prior to this work. The emissivity properties of Al EN AW 5754 (hard anodization) were experimentally compared to the well known properties of an Aeroglace painted material. Aeroglace has been greatly used in space applications, and its radiative properties are therefore well established. The remaining values are approximated through the use of [21, 13, 30, 3, 16, 2, 20]. All specified parameters are functions of the temperature. However, the temperature dependence is weak within the operating temperature range. The emissivities are highly dependent on the surface roughness of the material. Consequently, the tabulated values are intended to be guidelines in the modeling process. The tabulated emissivities are the total hemispherical ones. 2.2.2 Heating System To heat the object to temperatures above ambient, numerous resistive heaters are used. All heaters utilized are of the same type manufactured by Backer BHV AB (part number 2520340102) [4], labeled H in Figure 2.7. They are all supplied with 400 V and consume an electrical power of 1000 W each [4]. A total of 33 heating elements are mounted within the TVC resulting in a total available heating power of 33 kW. The heaters are constructed of aluminum. The heaters have two states of operation, on and off. These states are controlled through a thyristor. The heaters are bolted onto each face of the thermal shroud as well as the testing table. Each side of the octagon houses three resistive heaters connected in parallel. The back and access door of the thermal shroud consists of three separate panels. One heater each is mounted on the top and bottom and two heaters on the middle panels. Furthermore, a single heater is mounted on the testing table. A graphite film is placed between each heater and panel to evenly distribute the heat across the control surface. The temperature of each individual heater is measured by means of thermocouples. The temperature of one of the heaters mounted on each face is used as input to the heating cycle control system. 15 Chapter 2. Thermal Vacuum Chamber 2.2.3 Cooling System Liquid Nitrogen, provided from an external reservoir located outside of the testing facility, is used to cool the chamber. The liquid is guided from the reservoir and split through a manifold, M in Figure 2.7, into fifteen thermally insulated pipes (one pipe for each shroud face plus one providing the test table with coolant). Each pipe is intersected by a cryogenic, pneumatically controlled, valve provided by Burkert [28], labeled CV in Figure 2.7. The valve is used to obtain needed flow of coolant through the system. Since the cryogenic valves and the thyristors solely operate in two different states (ON/OFF), the required input power has to be obtained through pulse duration modulation. Currently, the heat input is implemented in this fashion; however, the coolant input is Bang Bang. Bang Bang control signifies that the input operates in an ”all or nothing” manner. A cryogenic by-pass valve is positioned prior to the manifold. This by-pass system ensures that the nitrogen entering the manifold is in a liquid state. The by-pass valve, denoted BPV in Figure 2.7, opens once the temperature of the nitrogen is above 77 K. The gaseous nitrogen is then wasted to the environment. Once the liquid has passed through one of the control valves, it flows through a coolant canal. Each face of the thermal shroud, as well as the test plate, contain a canal used for cooling. When the liquid nitrogen encounters the warmer canal it changes from liquid to gas, absorbing the heat required for this phase change from the panel. The amount of energy transferred from the liquid to the panel per mol of liquid during the phase change is given by the enthalpy of vaporization ∆Hvap . The temperature during cooling is measured using thermocouples. The temperature of one of the heaters mounted on each face is used as input for the cooling cycle control system. It is important to note that the thermocouples used to measure the temperature during cooling, are not the same components as the ones used during the heating cycle. The heaters used as shroud face temperature reference, have two thermocouples mounted: one providing heat control input, and one providing cooling control input. These measurement devices are positioned next to one and another. The considered cooling system does not recycle the used nitrogen meaning that, once the coolant has passed through the system, it is wasted to the environment. The exhaust nitrogen gas is disposed from the system through the exhaust octagon, see EO in Figure 2.7. The exhaust from all shroud faces and the test table is connected here, resulting in one single exhaust line post the exhaust octagon. A resistive heater is mounted on the outlet pipe post the exhaust octagon. This heater ensures that the exhaust is gaseous. 2.3 System Control The elaborate system that controls, monitors, and provides a human interface, is schematically represented in Figure 2.10. 16 Chapter 2. Thermal Vacuum Chamber Figure 2.10: Schematic representation of the thermal control system The Heart of the system is contained in Cabinet 1. This module contains an Allan-Bradley Programmable Logic Controller (PLC 1 ), see Figure 2.10. Cabinet 1 is responsible for the cooling cycle control and Cabinet 3 for the heating cycle control. These two controllers are connected through a communication bus, referred to as the Device Net. This connection allows for the PLC to receive and distribute information to the modules: Pump and Cryo Compressor Control, Cabinet 3, and Pneumatic Communication Island. These modules are schematically represented in Figure 2.10 where they are denoted: Cabinet 2, Cabinet 3, and PCI respectively. • The Pump and Cryo Compressor Control unit receives commands from the PLC and distributes information to the entire chain of vacuum pumps. • Cabinet 3 houses the temperature regulators related to each shroud face. The heating cycle control is executed by this module alone. The temperature control of each control surface is acquired through individual PID controllers of type 1/16 DIN series SD, provided by Watlow (see Figure 2.11). Figure 2.11: Front of one of the PID controllers mounted on Cabinet 2. At the instance of the picture, the lower display shows the reference and the upper the measured temperature. 1 A PLC is a computer designed specifically for automated control in harsh environments [17]. 17 Chapter 2. Thermal Vacuum Chamber In the upper display the input value or any other selected parameter value is quantified, such as the implemented proportional gain. Which parameter that is to be shown in the upper display is selected in the lower. The eligible parameters are scrolled through use of the arrows seen in Figure 2.11. Furthermore, the lower display depicts the reference temperature as default. A thorough description of the functionality of this particular PID controller is formulated in the user manual [32]. The setting of the PID parameters are a Watlow company secret; however, they appear to be apprehended through a Ziegler-Nichols method. The Ziegler-Nichols approach is a heuristic method of determining the PID parameters. The proportional part of the controller is increased, the integral and derivative parts are set to zero, until the system begins to oscillate. The proportional gain that yields these oscillations and the corresponding oscillation periods are noted. With these noted values, the PID settings can be obtained in tables developed specifically for this method [10]. Such a method does not result in an optimal controller in terms of reference tracking, but it is satisfactory in this particular case. The input parameter to the control scheme is received as an analog signal, from the thermocouples. The reference temperature is obtained from Cabinet 1 via the Device Net. This reference is also received during cooling, enabling Cabinet 1 to ”help” during this part of the thermal cycle through use of the heaters. The module also distributes power to all high powered devices. • The Pneumatic Communication Island indirectly controls the cryogenic valves through a module referred to as Pneumatic Island 2, and all vacuum related valves through a module named Pneumatic Island 1. This device consists of an EX500 series GDN1 unit. The contraption communicates with Cabinet 1 through the DeviceNet 2.0 Release protocol at speeds ranging from 125 to 500 kbit/sec, depending on the number of components in the system. (a) (b) Figure 2.12: Pneumatic control and communication. a) Pneumatic Communication Island. b) Pneumatic Island 1. 18 Chapter 2. Thermal Vacuum Chamber Figure 2.12a illustrates the pneumatic communication island which is supplied with 24 V DC, through the leftmost black cable [27]. Pneumatic Islands 1 and 2 are connected through the branch connectors com A and com B respectively, the two black cables in the center of Figure 2.12a . They are manifolds, EX500-Q101, connected to a total of 22 valves that supply the cryogenic and vacuum valves with dry and pressurized air as designated by the PLC. The main air supply is provided to the manifolds and distributed from there on. Pneumatic Island 2 is at its peak capacity supplying a total of 16 valves with air, whereas Pneumatic Island 1 only is connected to six valves. The unit connected to the vacuum related valves can be viewed in Figure 2.12b. Pneumatic Island 2 is identical to that of Figure 2.12b. 2.3.1 Human Machine Interface The PLC is connected to a personal computer via an Ethernet link. The PC provides a Human Machine Interface (HMI) as well as an SQL server for logging and management of data. This personal computer also serves as the PLC programming unit. The HMI is an interface to the operator enabling him/her to re-program and adjust the PLC control parameters as well as graphically observe the system status. The HMI software is provided by Rockwell Automation. Part of the systems overview screen can be seen in Figure 2.13. 19 Chapter 2. Thermal Vacuum Chamber Figure 2.13: The systems overview screen in the human machine interface. The vacuum system status can be seen in the system mimic box. The control surface temperatures are illustrated through the three octagons. The presented temperatures are equivalent to the values serving as cooling control input. The check-boxes located next to the octagons allow the user to decide which control surfaces that are to be controlled actively during a hot thermal cycle. The operating state of the cryogenic valves as well as the liquid nitrogen status is visualized to the right in the figure. Several buttons are placed in the top left corner of Figure 2.13. These buttons enable the user to: initiate pump-down/up sequence, edit the thermal cycle to be executed, execute the specified cycle, etc. 2.3.2 Manual Control It is possible to execute manual cooling cycle control through the HMI. Manual control is enabled in the configuration dialog box, partly illustrated in Figure 2.14, by clicking the push button labeled Service mode. A dialog box appears where the Non interrupted mode should be selected. Once situated in this mode of operation, the user can control the state of each pneumatically controlled valve through the check boxes seen in the figure. Since the heat control is 20 Chapter 2. Thermal Vacuum Chamber executed by the Watlow PID controllers located in cabinet 3, the user needs to disconnect heat control prior to commencing manual control. This is easily done by disabling all the heaters through the check boxes depicted in Figure 2.13. The configuration dialog box also allows the user to supervise important operational parameters such as the exhaust temperature. Experiments regarding the input coolant power, described in chapter 5, are executed through the use of the Non interrupted mode. Figure 2.14: The configuration screen of the human machine interface. Manual temperature control of the space simulation chamber is executed from the configuration screen. 2.3.3 Temperature Monitoring System A quite interesting stand-alone system is the Extra temperature monitoring module. This module utilizes all the heater temperatures as in data to monitor the status of each heater individually (except the temperatures already being monitored by Cabinet 3). This system is disconnected from Cabinet 3 and is operated as a safety system. If a heater malfunctions, the module disconnects the heater in question to prevent thermal damage. The extra monitoring system has no way of closing the cryogenic valves. Such a link would be unnecessary since the minimum achievable temperature is limited to the boiling temperature of the liquid nitrogen, approximately −196 ◦ C at atmospheric pressure. 21 Chapter 3 Heat Transfer Heat can be transferred within and in between different media through conduction, convection, and by electromagnetic radiation. The three different modes of heat transfer are not completely independent and additive but they will be treated as such in this work [26]. This chapter covers the heat transfer theory necessary to develop a sufficient mathematical model of the thermal relationships in the space simulation chamber. 3.1 Convection Convection is the heat transfer through a non solid material. Such transfer of heat occurs through diffusion and advection, phenomena that arise through intermolecular collisions. The physical process of convection are not investigated since convection can be neglected during the modeling process. The following section describes when convective heat transfer has to be accounted for and when it does not. 3.1.1 The Knudsen Number Intermolecular collisions dominate the particle motion if the mean free path of the considered particles is smaller than a characteristic length of the system. To investigate the magnitude of such a relation, the Knudsen number is used. The Knudsen number is the ratio of the mean free path and the characteristic length, λm . (3.1) Kn = Lc Here, Lc is the characteristic length of the system. The mean free path is defined as kb T (3.2) λm = √ 2πd2m p where p is the pressure, kb the Boltzmann constant, T the temperature, and dm is the diameter of the molecule in question. The mean free path is the average distance that a molecule travels in between collisions. The flow can be considered free molecular when Kn ≥ 10, heat is not transfered by means of convection in such a flow regime. The fluid does in fact commence adopting the 22 Chapter 3. Heat Transfer behavior of individual particles for Kn ≥ 0.1, resulting in a negligible amount of convectional heat transfer [5]. 3.2 Conduction Conduction refers to the transfer of thermal energy within and between solid materials in contact. The one dimension heat transfer through conduction is governed by Fourier’s heat rate equation: dT dQ = −Aλ , dt dx (3.3) where λ is the conductivity, dT dx is the temperature gradient, and A is the crossectional area [7, 8]. If Equation 3.3 is variable separated and integrated, Z T2 Z dQ x2 1 λdT (3.4) dx = − dt x1 A(x) T1 is obtained. Here, the inverse of the integrand on the left hand side is called the conduction shape factor. This value depends on the geometry of the surface in question. The conduction shape factor S for a plane wall is provided, as an example, in: A S= . (3.5) x2 − x1 Comparing Equation 3.4 and Ohm’s law, a conductive resistance can be expressed as 1 , (3.6) Rth = λS as long as the conductivity is temperature independent. The thermal heat contact resistance expresses the heat rate resistance between two media in contact. This contact resistance is defined as Rth = 1 , hc Acontact (3.7) were hc is the contact conductivity and Acontact is the contact area. The contact conductivity is difficult to determine analytically, the contact resistance is therefore most accurately determined by measurements [7]. Once the contact resistance is quantified, one can determine the total conductivity in and between solids in contact by implementing Equation 3.3 and thermal resistances connected in series or parallel. 3.3 Radiative Heat Transfer All materials radiate heat at different wavelengths, through the emission of electromagnetic waves. Such waves do not need the presence of a medium to propagate. The ability to predict the radiated energy is of particular interest in space applications considering the low density environment of space. The radiative heat rate obeys the Stefan-Boltzmann law dQ = AεσT 4 , dt 23 (3.8) Chapter 3. Heat Transfer where A is the surface area of the radiating body, ε is a measure of how good of a radiator the body is compared to an ideal radiating body, σ is the StefanBoltzmann constant, and T is the absolute temperature [33, 8]. The emissivity, ε is a dimensionless number ranging from zero to one. Furthermore, the emissivity is not a constant but a function of temperature, radiation wavelength, the angle at which the radiation is radiated [26], and the surface roughness of the material. The formal definition of the emissivity is given by ε= dQ dt (λ, Φ, φ, T ) dQ dt bb (λ, Φ, φ, T ) (3.9) dQ where dQ dt is the radiated power of the considered surface, and dt bb is the radiated power of the surface as if it was a black body. Φ and φ describe a solid angle angle at which the power is radiated. Emissivity values averaged with respect to the wavelength are referred to as total emissivities, and values averaged with respect to all directions are referred to as hemispherical emissivities. A common assumption to make is the so called gray body. A gray body is an object which radiates an equal amount of thermal energy at all wavelengths, dε = 0. Such an assumption also result in a frequency independent absorpi.e. dλ tivity α = ε. The absorptivity quantifies the amount of radiation absorbed by a material. The incident radiation which is not absorbed is reflected or traversed. The amount of reflected radiation is determined by the reflectivity ρ which is related to the absorptivity by ρ = 1 − α. (3.10) if the body can be considered opaque. An opaque body is in-penetrable by light, i.e. the surface can absorb and reflect light but wont allow light to pass through [26]. 3.3.1 Effective Emissivity of Infinite Parallel Plates The effective emissivity is a modified emissivity that incorporates multiple reflections between the radiating surfaces. The radiating surfaces considered in this section are assumed to be infinite parallel plates. Consider two such plates labeled i and j with individual emissivities εi and εj respectively. The total electromagnetic radiation leaving surface i is obtained if an infinite sum is multiplied by Equation 3.8. This infinite sum arises due to multiple reflections and has the form εi + εi (1 − εi )(1 − εj ) + εi (1 − εi )2 (1 − εj )2 · · · (3.11) if Equation 3.10 is applied. The first term in Equation 3.11 represents the direct emission, the second term the first reflection, and so on. Equation 3.11 is a well known geometric series εi ∞ X k=0 which can be re-written as [(1 − εi )(1 − εj )]k , (3.12) εi εj εi + ε j − ε i ε j (3.13) εij = 24 Chapter 3. Heat Transfer if multiplied by εj . The physical meaning of this multiplication is that Equation 3.13 now describes the total amount of radiation absorbed by surface j that is emitted by surface i. This is the effective emissivity between the infinite parallel surfaces i and j. Reflective interaction between non-Lambertian surfaces can be considered through the use of the effective emissivity [8]. 3.3.2 View Factors The radiative energy exchange between two radiating surfaces depends on the geometry of the surfaces as well as their relative position. These dependences are accounted for by means of a view factor. The view factor describes the effective absorbing area of a surface exposed to the radiation of a specifically oriented radiating geometry [1]. This quantity is derived using Lambert’s law of cosines which states that the illuminance falling on any surface depends on the cosine of the lights angle of incidence [29], or qφ = q cos φ. (3.14) Here, q is the electromagnetic heat flux emitted by the source, φ is the angle of incidence, and qφ is the flux hitting the surface [29]. Consider an infinitesimal surface dA1 with emissivity ε1 and temperature T1 . According to Equation 3.8, this surface radiates the power dQdA1 = ε1 dA1 σT1 4 dt (3.15) Combining Equation 3.14 and Equation 3.15, the heat flux a distance r at an angle φ1 becomes ε1 σT 4 dA1 qdA1 = cos(φ1 ) (3.16) πr2 Let us now investigate the heat rate absorbed by a second infinitesimal area dA2 with absorptivity α2 situated a distance r from dA1 . If the normal to dA2 deviates an angle φ2 from a vector along r, then the absorbed power originating from dA1 is dQdA1 →dA2 ε1 σT 4 dA1 = α2 cos(φ1 )cos(φ2 )dA2 dt πr2 (3.17) To consider two non-infinitesimal areas A2 and A1 , Equation 3.17 is integrated across these areas resulting in dQA1 →A2 = α2 ε1 σT 4 A1 FA1 →A2 dt where FA1 →A2 is the view factor expressed as ZZ cos(φ1 )cos(φ2 )dA1 dA2 1 . FA1 →A2 = πA1 r2 (3.18) (3.19) A1 A2 Two fundamental properties of this view factor are: A1 FA1 →A2 = A2 FA2 →A1 , 25 (3.20) Chapter 3. Heat Transfer and n X FA1 →Ai = 1. (3.21) i=1 Here, index n denotes the nth and final absorbing area [26, 8]. The combination of Equation 3.18 and Equation 3.19 provide an expression for the heat rate (power) that is absorbed by a surface A2 located a distance r from the radiating source A1 . Equation 3.19 can be geometrically complex; however, tabulated values for standard configurations exist [8]. If the configuration is too complex, Monte Carlo ray tracing can be used in order to obtain numerical estimations of the view factors. Note that the use of Equation 3.14 invokes an important assumption. Lambert’s law of cosines holds provided that the considered surfaces are Lambertian (also known as diffuse surfaces [26]). A Lambertian surface is a surface that reflects light equally well in every direction; hence, the emissivity ε is independent of the angle at which the radiation is radiated [29]. 3.3.3 Radiative Heat Emission of Interacting Finite Surfaces, the Netradiation Method The electromagnetic waves transporting heat within a closed volume, a volume such as the one enclosed in the space simulation chamber, are absorbed and reflected multiply by each enclosing surface. Poljak developed a method for determining the net heat power absorbed by a surface in such an enclosure which does not consist of tracking each individual wave of energy. This method is described by Siegel and Howell and it applies for Lambertian surfaces [26]. The Poljak method is described in this section in a manner that is applicable to this thesis work. Figure 3.1: Volume enclosed by n arbitrary surfaces Figure 3.1 represents a volume enclosed by n surfaces of arbitrary size. These surfaces are assumed to be opaque and Lambertian. A heat balance at surface k is formulated as dQk = Ak (qo,k − qi,k ), (3.22) dt 26 Chapter 3. Heat Transfer where Ak is the surface area of element k, qo,k is the from k outgoing heat rate per area, and qi,k is the incident heat flux. The left hand side of Equation 3.22 is the net heat rate loss of surface k. Part of qo,k originates from emission and part from reflection of heat flux. Applying Equation 3.8, the outgoing heat flux can be expressed as qo,k = σεk Tk4 + (1 − εk )qi,k (3.23) where the last term in Equation 3.23 is expressed using Equation 3.10. All the incident power is expressed using the view factors from each radiating surface to surface k: n X Ak qi,k = Al qo,l FAl →Ak . (3.24) l=1 Implementing the relation described by Equation 3.20 on Equation 3.24, the relation n X qi,k = qo,l FAk →Al (3.25) l=1 is obtained. Inserting Equation 3.25 into Equation 3.22 yields n X dQk = Ak (qo,k − qo,l FAk →Al ) dt (3.26) l=1 which expresses the net radiative heat rate loss of element k. Equation 3.23 is solved for qi,k . If the obtained expression is inserted into Equation 3.22 the following expression emerges after some minor algebra, Ak ε k dQk = [σTk4 − qo,k ] dt (1 − εk ) (3.27) which expresses the net radiative heat rate loss just as Equation 3.26 does. These two equations can be modified to describe the net heat rate loss for any enclosing surface just by changing the indexes. Knowing this, Equation 3.26 and Equation 3.27 can be used to derive a system of equations that together provide an expression for the heat rate loss of each individual side as function of the surface temperatures. Solving Equation 3.27 for qo,k yields qo,k = σTk4 − dQk (1 − εk ) . dt Ak εk (3.28) Equation 3.28 can clearly be used for any of the enclosing surfaces through index changes. Now, inserting Equation 3.28 into Equation 3.26, replacing both qo,k and q0,l yield dQk dt Ak n = σTk4 dQk (1 − εk ) X dQl (1 − εl ) − − ]. FAk →Al [σTl4 − dt Ak εk dt Al εl (3.29) l=1 Equation 3.29 provides n equations relating the net heat loss rate of each surface to the temperatures, taking reflections into account. Here, the emission and reflection is assumed to be diffuse. 27 Chapter 3. Heat Transfer 3.3.4 Radiative Exchange Factors Radiative exchange factors provide the radiative connection between radiating surfaces. The radiative exchange factors describe, just as the view factors do, the effective absorbing area of a surface. However, these exchange factors incorporate multiple reflections. This property makes these factors difficult to calculate analytically, but they can be calculated numerically. Let n, non Lambertian, arbitrary surfaces expose each other to direct and reflected thermal radiation. A heat balance at the ith surface can be expressed using Equation 3.8 and the radiative exchange factors as: n X dQi =σ RAi →Al (Ti4 − Tl4 ), dt (3.30) l=1 where RAi →Al is the radiative exchange factor from surface i to l. These factors can be calculated implementing the view factors and Equation 3.29. The surface areas are included in the radiative exchange factors resulting in the property RAi →Aj = RAj →Ai (3.31) which can be compared with Equation 3.20. 3.3.5 Monte Carlo Approach Calculating the radiative couplings, taking multiple reflections into account, between surfaces is an analytical challenge. Monte Carlo ray tracing methods allow for the calculation of the view factors and radiative exchange factors numerically. Monte Carlo methods are numerical methods, resting on a statistical foundation. In essence, the total radiative energy is divided into equally energetic bundles whose paths are determined through a probabilistic Monte Carlo method. Each bundle of energy represents the radiative energy at a small range of wavelengths. Allowing for each bundle to have a unique wavelength range, permit considerations of property wavelength and directional dependencies. Artificial electromagnetic bundles of energy are launched from each considered radiating surface. The number of incoming rays are counted at each surface. The heat rate that intercepts a surface is calculated by adding all the incoming bundles each second. The amount of incoming rays at a specific surface, originating from a different surface, is compared to the total amount of heat radiation leaving the radiating area. The ratio of the two calculated quantities yields the view factor between the surfaces. A thorough description of the considered technique is not within the scope of this thesis. A detailed description is provided by Siegel and Howell [26]. The Monte Carlo approach requires excessive computations and any realistic problem has to be solved by means of computers. The necessary Monte Carlo calculations are performed through the use of the software ESATAN. 28 Chapter 3. Heat Transfer ESATAN ESATAN is a commercial software designed to solve thermal problems with the possibility of implementing ray tracing Monte Carlo methods. The program handles both steady state and transient analysis. Radiative and conductive couplings can easily be determined by ESATAN once the system geometry is defined. The geometry is defined as a thermal network. Thermal analysis can be performed on individual sub-geometries or on a total geometry consisting of several sub-geometries. Each node within a geometry is assigned with material properties and model time dependencies etc. Numerically Estimated View Factors The view factors are purely geometrical. Therefore, the user does not need to define the emissivity properties of the materials used. The view factors FdAi →dA1 for the geometry presented in Figure 2.8 are provided in Figure 3.2. Figure 3.2: Calculated view factors from face i to face 1. The numerical values are presented in the diagram to the left in the figure. These view factors are calculated numerically in ESATAN (where they are referred to as GV conductors). The remaining view factors for the considered geometry are presented in Appendix 2. Numerically Estimated Radiative Exchange Factors When calculating the radiative exchange factors in ESATAN (referred to as GR conductors), emissivity properties are considered. The emissivity dependency on: wavelength, geometry, and temperature can be accounted for if such data exist. The radiative exchange factors are calculated in ESATAN through the function VFAC. This function utilizes the numerically estimated view factors. The radiative exchange factors are provided by solving an expression equivalent 29 Chapter 3. Heat Transfer to Equation 3.29 supplying it on the form of Equation 3.30 [15, 26]. The thermal radiation in the vacuum chamber lies within the infrared range. The radiative properties are weakly temperature dependent within the infra-red spectrum and considered constant with temperature. The non-diffuse properties are considered through the division of the reflectivity into a diffuse part and a specular part ρ = ρd + ρs ; (3.32) where the user defines the specular and diffuse relflectivities, ρs and ρd , to calculate the radiative exchange factors. It is unclear as to how the specular properties are allowed to be accounted for considering the assumptions that the Net-radiation Method rests on, stated in [26] and [25]. In this particular case, however, the large emissivities of all considered surfaces, see Table 2.2, allows for the assumption of diffuse surfaces. Therefore, the specular reflectivity is set to zero. The diffuse emissivity of the testing table and the shroud faces are specified as ε = 0.8 and ε = 0.88 respectively. The calculated radiative exchange factors are presented in Appendix 2. 30 Chapter 4 System Modeling and Analysis To establish a mathematical model of the considered thermal system, the system dynamics need to be investigated. A theoretical investigation of the thermal losses that need to be accounted for is presented in this chapter. The different types of present heat transfer modes are individually analyzed and added to form the system dynamics through heat balance equations. The obtained differential equations are linearized and investigated. 4.1 Convective Heat Transfer To determine if convective heat transfer occurs, the Knudsen number is calculated through the use of Equation 3.1. Convective heat transfer becomes significant for small Knudsen numbers. The physical parameters in Equation 3.1 are chosen such that the result will be an operational minimum. A normal chamber operating pressure of p = 1 mPa is selected. The minimum temperature of T = 77 K is considered. The present medium is assumed to solely consist of N2 molecules which have an approximate diameter of dm = 200 pm [18]. The characteristic length Lc of the system is considered to be the chamber diameter Lc = 1.31 m. These values result in a Knudsen number of Kn ≈ 6 which indicates that convective heat transfer is negligible. 4.2 Shroud losses The heat transfer between the thermal shroud and the chamber casing is estimated analytically. This transfer of heat is the only source of losses within the system. 4.2.1 Conductive Heat Rate Loss of Thermal Shroud The only shroud face in direct contact with the chamber casing or the thermal shield, is the uppermost face, see Figure 2.9. The other faces of the shroud 31 Chapter 4. System Modeling and Analysis are in contact with the reflective octagon; however, this connection is provided through hollow Teflon rods and will be neglected, see Table 2.2. The conductive interface between the shroud and the casing consists of 12 hollow stainless steel rods and the railing system. The railing system is manufactured of aluminum and will not significantly add to the thermal resistance. Such reasoning can be explained through an electrical analogy. Imagine two electrical resistances connected in series, if one of the resistances is significantly larger than the other it will act as a bottleneck, and alone govern the size of the current. The rods used are shown in Figure 4.1. (a) (b) Figure 4.1: Illustrations of shroud mounting rods. a) Cross-section of stainless steel rods used to position thermal shroud. The dimensions are: L = 0.05 m, l = 0.03 m, D = 0.01 m, d = 0.005 ml. b) Picture of one of the rods providing the conductive coupling between the uppermost shroud face and the chamber casing. The rods are threaded in both ends. Six of the twelve rods carry the shroud while the other six are clamped into place. A contact resistance is assumed at each of the later six rods. The conductive interface between the casing and the uppermost face of the thermal shroud can be described with the circuit shown in Figure 4.2. Figure 4.2: Thermal circuit of conductive heat transfer. R1 is the contact resistance between the railing and the thermal shield, there are two such resistances in parallel to each other. The contact area is estimated as A1 = 0.0024 m2 through visual inspection and measurements. R2 is the thermal resistance contribution from one of the hollow rods. The rods are not entirely hollow since a section of each rod is threaded with an ac32 Chapter 4. System Modeling and Analysis companying bolt. This section of each rod give rise to the thermal resistance R3 , which is connected in series to R2 in Figure 4.2. These rod fractions are assumed to be solid stainless steel rods. A total of six such connections connected in parallel exist, only one is illustrated in Figure 4.2. The resistance R4 , connected in series with R2 and R3 , represents the contact resistance through the clamped rods. The contact area is calculated from the geometry presented in Figure 4.1. Since a total of six such thermal joints exist, there are a total of six series connections connected in parallel. Only one is shown in Figure 4.2. The circuit equivalent resistance is formed as Rth = 6 6 R1 + ]−1 , +[ 2 R 2 + R3 + R 4 R 2 + R3 (4.1) where Rth is the equivalent thermal resistance. The individual resistances are calculated using: the values presented in Table 2.2, Equation 3.7, and Equation 3.6. The contact conductivities are estimated as hc = 100 W per square meter. The equivalent thermal resistance is calculated inserting all the individual resistances into Equation 4.1. The conductive heat rate loss is calculated using Equation 3.3 and plotted against the shroud face temperature, see Figure 4.3. Figure 4.3: Conductive heat loss in thermal vacuum chamber as function of the uppermost shroud face temperature. Equation 3.3 and Equation 4.1 together describe the conductive heat rate loss of the system. The relation is expressed on matrix form as ~ dQ = Cl (T~ − T~ambient ), dt (4.2) where T~ contains the temperatures of all the control surfaces, T~ambient is the temperature of the chamber casing, and Cl is a 15 by 15 matrix. Since face 3 is the only face conductively connected to the chamber casing, this face temperature corresponds to the only non zero element in Cl . 33 Chapter 4. System Modeling and Analysis 4.2.2 Radiative Heat Rate Loss of Thermal Shroud Each face of the reflective octagon, the thermal shroud, and the entire chamber casing are assumed to be parallel plates. The areas of these plates, A in Figure 4.4 , are given in Table 2.1. The emissivities are given in Table 2.2 as: ε0 = 0.88, ε1 = 0.07, and ε2 = 0.1. Figure 4.4: Assumed cross-section of TVC. The temperatures of the surfaces are denoted: T0 , T1 , and T2 . Note that these indices are not related to the face numbering presented in Figure 2.8. The chamber casing temperature, T2 in Figure 4.4, is assumed to be 293 K. The reflective octagon is made of a highly reflective material (polished stainless steel) and the casing of stainless steel. These materials are far from perfect absorbers; therefore, the effective emissivity of parallel plates is used to analyze the radiative heat exchange between the surfaces. The net radiative heat rate loss of surface 1 and 0 is formed by implementing Equation 3.13 and Equation 3.8: dQ1 (4.3) = Aσε01 (T14 − T04 ) + Aσε12 (T14 − T24 ), dt and dQ0 = Aσε01 (T04 − T14 ). (4.4) dt i where dQ dt is the heat rate loss of surface i. The temperature T1 is solved for once the left hand side of Equation 4.3 is set equal to 0 (a steady state is considered). This result is inserted into Equation 4.4 to generate dQ0 ε01 ε12 = Aσ (T 4 − T24 ). dt ε01 + ε12 0 (4.5) which describes the net radiative heat rate loss of each shroud face as function of the face temperature. The heat rate loss is plotted as function of the temperature for each face in Figure 4.5. 34 Chapter 4. System Modeling and Analysis Figure 4.5: The radiative heat rate loss of shroud face i as function of the face temperature The figure shows that the maximum interaction between all surfaces occurs during the heating cycle. The most interacting surfaces, faces 1 through 8, lose a maximal heat rate of 35 W. This corresponds to a maximum loss of heating power of 1.2% for these surfaces. The maximum loss of heating power is greater at faces: 9, 11, 12, and 14. The input power available at each of these surfaces is 1 kW resulting in a heating power loss of 2.9%. Equation 4.4 is expressed for each shroud face. The resulting 15 equations are assembled into ~ dQ 4 = Rl (T~ 4 − T~ambient ) (4.6) dt which describes the radiative heat rate loss of all faces. Rl is a 15 by 15 matrix, test table is included as a zero row and column since it cannot radiatively loose energy to the chamber casing, depending on the radiative properties of: the shroud, the octagon, the casing, and the control surfaces. 4.3 Radiative Coupling Between Shroud Faces Each control surface absorbs and emits energy. Some of the reflected energy is reflected back and some is absorbed by other surfaces. This interaction result in a radiative coupling between all surfaces. To accurately model the system, the couplings need to be accounted for. Equation 3.29 and Equation 3.30 provide a mathematical description of this interaction between surfaces. Since there are a total of 15 radiating surfaces, a total of 15 equations are needed to express the net radiative heat rate loss of each shroud face as function of all other face temperatures. Equation 3.29 or Equation 3.30 can be solved for all the heat rate losses providing an expression ~ dQ = Rc T~ 4 dt 35 (4.7) Chapter 4. System Modeling and Analysis once the view or radiative factors have been determined through the use of ESATAN. Equation 4.7 is acquired through the use of the radiative exchange factors in this work, since the expressions describing the couplings become less complex when the radiative exchange factors are implemented. The emissivities are tabulated in Table 2.2 and the surface areas in Table 2.1. In Equation 4.7, ~ dQ dt is a column vector containing the radiative heat rate losses of all sides, and Rc is a matrix with dimension 15 by 15. T~ are the temperatures of all sides contained in a column vector. 4.4 Conductive Coupling Between Shroud Faces The shroud faces are conductively coupled in addition to the electromagnetic coupling. Furthermore, the conductive interface between the shroud and the test table is neglected. This is a valid assumption since the thermal connection is provided by long hollow stainless steel rods that are further insulated through Teflon spacers. Each face in contact with another face will have a net heat rate that is dependent on the interacting surfaces’ temperature according to Equation 3.3. The conductive heat rate coupling is formulated for each shroud face through the use of this equation. In total, 14 such equations are formulated. The conductive heat rate coupling of face 1 is provided as an example, A1,8 A1,10 A1,13 A1,2 dQ1 (T1 − T2 ) + (T1 − T8 ) + (T1 − T10 ) + (T1 − T13 )]. = λ[ dt L1,2 L1,8 L1,10 L1,13 (4.8) 1 Here, dQ is the heat rate out of face 1, A is the conductive cross-sectional 1,i dt area between the interacting surfaces 1 and i, and L1,i is the length between the centers of face 1 and i. The contact areas and the center to center lengths are calculated using the chamber blueprints, see Appendix 1. The conductivity is assumed to equal at all couplings and each face is assumed to be isothermal. The contact resistance between each face is assumed negligible. The terms existing in Equation 4.8 correspond to the surfaces that interact with face 1 as can bee seen in Figure 2.8. Equation 2.8 is set up for each surface. There will be a total of 4 terms in each equation since every face interacts with 4 other faces. The resulting system of equations is solved for the heat rates resulting in ~ dQ = Cc T~ dt (4.9) which describes the conductive couplings between all shroud faces. Cc is a 15 by 15 matrix, the non dependent test table is added to provide a matrix with equal dimension as the previously derived matrices, that depends on the conductive properties of the geometries. 4.5 System Dynamics The system dynamics are formulated through the use of Equation 4.2, Equation 4.6, Equation 4.7, and Equation 4.9. Adding all the different terms results 36 Chapter 4. System Modeling and Analysis in ~ dQ 4 = Cc T~ + Rc T~ 4 + Rl (T~ 4 − T~ambient ) + Cl (T~ − T~ambient ) (4.10) dt which describes the net heat rate loss off all faces as functions of all temperatures. The heat rate loss is connected to the rate of temperature change through the relation ~ dT~ dQ = −Cspec M (4.11) dt dt where, M is a matrix with the mass of each individual control surface on the diagonal and Cspec contains the specific heat for all surfaces. The mass matrix is calculated through the use of the material densities presented in Table 2.2 and the surface volumes. The volumes are calculated as the product of the areas and thicknesses presented in Table 2.1. Furthermore, the mass of each present heater is measured as 0.6 kg. The heater masses are added to each control surface. The specific heats for the considered materials are presented in Table 2.2. The differential equations that describe the system dynamics are now known at the hand of Equation 4.10 and Equation 4.11. The derived matrices describing these nonlinear dynamics are presented in Appendix 3. 4.6 Linearization Any function f (~x), that is infinitely differentiable and defined in a region near a point ~a, can be estimated through a Taylor series expansion around this point. If the higher order terms are neglected a linear approximation on the form f~(~x) = f (~a) + J|~x=~a (~x − ~a) (4.12) is obtained. In Equation 4.12: J is the Jacobian matrix containing all the partial derivatives of f~(~x), and ~a is the point of expansion. Such an approximation will be valid in the close vecinity of ~a. The nonlinear system dynamics are linearized implementing the relation described by Equation 4.12. The Jacobian of Equation 4.10 is calculated as 3 0 0 0 0 4T1 |a1 0 0 4T23 |a2 0 0 + Cc + Cl 0 0 · 0 0 (4.13) J = (Rl + Rc ) 0 0 0 · 0 3 0 0 0 0 4T15 |a15 4 where T14 , T24 , ·, ·, T15 are not variables but the face temperatures at the selected expansion point ~a. The shroud and chamber are at equilibrium when all face temperatures are 293 K. This point is selected as expansion point. The left hand side of Equation 4.12 is zero at this equilibrium; henceforth, Equation 4.10 is linearized to ~ dQ = J∆T~ . (4.14) dt The vector ∆T~ contains all the temperature deviations from the equilibrium. Equation 4.14 and Equation 4.11 express the linearized system dynamics. 37 Chapter 4. System Modeling and Analysis 4.7 Analytical Comparison of Linear and Nonlinear Dynamics The linear and nonlinear system dynamics are compared in order to determine the accuracy of the linearization. Both sets of differential equations are solved numerically applying Matlabs’ differential equation solver ode15s. The equations are solved for several different initial conditions and the solutions are thoroughly compared. The temperature relationships between all control surfaces have been investigated and are of similar character. Figure 4.6 shows the temperature time evolutions of face 1, considering the linear and the nonlinear dynamics. The initial condition generating Figure 4.6a is the ~ K. The initial condition generating Figure 4.6b hot boundary vector of T~ = 453 ~ K. These are the practical boundary temis the cold boundary vector of T~ = 93 peratures of the chamber, no test object is subjected to more extreme thermal conditions. The temperatures are allowed to decay until equilibrium is reached. The evolutions occur without external energy input. (a) (b) Figure 4.6: The temperature of face 1 plotted against the time, implementing both the nonlinear model and the linear approximation. a) Temperature decay, of control surface 1, from the hot boundary to equilibrium. b) Temperature increase, of control surface 1, to equilibrium from the cold boundary. Figure 4.6 illustrates the maximal differences between the two models since, the largest possible deviations from the equilibrium point are selected as initial conditions. All face temperatures have been compared and face 1 and face 5 demonstrate maximal model differences. The temperature difference, of face 1, between the linear and nonlinear models are depicted in Figure 4.7a and Figure 4.7b. Figure 4.7a is a result of the thermal cycle described by Figure 4.6a and Figure 4.7b is a result of Figure 4.6b. 38 Chapter 4. System Modeling and Analysis (a) (b) Figure 4.7: Difference between the temperatures of face 1 stemming from the linear model and nonlinear model (∆T1 ). a) ∆T1 during a temperature decay ~ K. b) ∆T1 during a without external energy input. Initial condition T~ = 473 temperature increase of face 1 without external energy input. Initial condition ~ K. T~ = 113 The modeled physical behavior is as expected. The linear and nonlinear models show similar behavior; however, the different models do not show identical characteristics. The maximum difference of 48◦ , between the two models, occurs during the cold cycle. The figures illustrate that the linearization appears to be an adequate approximation even for large deviations from the expansion point. This is quite a bold statement which could be questioned. Even so, the simplicity that such an assumption implies encourages continuing with a design procedure resting on this particular linearization. 4.8 Dynamics Including Control Signals The control signals have so far been excluded from the system dynamics. The control signals are considered to be the input thermal power at each control surface. Since the differential equations are linear in the sense of power, the control signal can simply be added to the derived linear, or nonlinear, dynamics. There are two different sources of input power: one source stemming from the temperature control through the heaters, and one set from the liquid nitrogen coolers. The heating power provided from each individual heater is well specified as 1 kW. The cooling power provided by the liquid nitrogen evaporation within the coolant canals is uncertain. The cooling power has been estimated prior to this work as 300 W. This estimate is highly uncertain and experiments, to be described in Chapter 5, are performed in order to establish the accuracy of the estimation. The control can now be added to the linearized system dynamics, described by Equation 4.14 and Equation 4.11, to form ∆ dT~ = A∆T~ + B∆~u dt 39 (4.15) Chapter 4. System Modeling and Analysis which completely describes the system dynamics. In equation 4.15 A = −(Cspec M)−1 J (4.16) −ueq − 1000ni ≤ ∆ui ≤ umax − ueq . (4.17) and In Equation 4.17, the index i denotes the control signal corresponding to surface i, and ni is the number of heaters mounted on face i. The control sign convention stems from that outgoing power is selected as positive. The maximum cooling power is denoted by umax . The input matrix is obtained as B = −(Cspec M)−1 (4.18) which scales the input to the dimension of Kelvin per time. The dynamics are expressed on state space form through Equation 4.15 together with ∆~y = C∆T~ + D∆~u (4.19) where ∆~y are the outputs. Since the temperatures are directly measured, C is a 15 by 15 identity matrix and D is 0. The matrix describing the state space model are provided in Appendix 4. 40 Chapter 5 Verification of Dynamics and Input Coolant Investigations The experiments performed in order to verify the nonlinear model are described in this chapter. The experimental results are used to establish the accuracy of the derived model. Additional experiments are performed in order to estimate the available cooling power and to investigate the feasibility of a pulse duration modulation approach of generating the desired coolant input. 5.1 Experimental Set-up The experimental set-up of the model verification experiments are reviewed in this section. Figure 5.1 shows thermocouples positioned in addition to the stationary, control input, measurement devices. All added thermocouples are mounted using a Kapton tape which is able to withstand the great temperature variations in the chamber. An aluminum adhesive film is used to cover the Kapton tape in order to annul the significantly large absorption of this particular material. The additional measurements are taken on face 3, along with the top and bottom of the test mount. A total of five additional thermocouples, located at the end of the green wires in Figure 5.1c, are mounted on face 3: one in each corner, and one in the center of the control surface. The thermocouple serving as control input is located on the center back of face 3. 41 Chapter 5. Verification of Dynamics and Input Coolant Investigations (a) (b) (c) Figure 5.1: Thermocouple positioning during model verification experiments. a) Thermocouples mounted on the top of the test mount. A total of three measurement devices are positioned. b) Thermocouples mounted on the bottom of the table. A total of three measurement devices are positioned along the center of the test mount. c) Thermocouples mounted on the inside of face 3. A total of 5 measurement devices are positioned: one in each corner and one in the center of the control surface. The thermocouple that supplies input to the control algorithm is positioned in the center of the backside of the face. Figure 5.1a depicts the three thermocouples mounted on the top side of the test mount. The back and front center of the mount serve as measurement points. The thermocouple represented by the brown cable serve as input to the control algorithm. Similarly, three thermocouples are aligned along the center of the bottom of the mount, see Figure 5.1b. The exit path of the wiring harness is depicted in Figure 5.2. 42 Chapter 5. Verification of Dynamics and Input Coolant Investigations (a) (b) (c) . Figure 5.2: Thermocouple wiring harness path during model verification experiments. a) Harness interface. b) Wiring harness is guided through the reflective octagon and the chamber casing. c) The harness exits the chamber through face 1. The wiring collection point outside of the chamber is shown in Figure 5.2a. The harness is guided through: face 1, the reflective octagon, and finally the chamber casing, see Figure 5.2b and Figure 5.2c. 43 Chapter 5. Verification of Dynamics and Input Coolant Investigations 5.2 Model Verification The simulation chamber is subjected to different basic thermal cycles. The physical processes are simulated as the numerical solutions to the nonlinear dynamics, see Equation 4.10. The simulated progression is compared to the measurements in order to ensure that the derived mathematical model describes the actual system behavior. Additionally, the temperature gradients at the control surfaces are investigated during the hot cycle, in order to verify that the assumption of isothermal control surfaces is accurate enough. Four basic cases are investigated: the chamber losses from a hot state without energy input, the chamber losses from a cold state without energy input, the heating of the chamber with energy input to all control surfaces but the testing table, and cooling of the chamber through coolant supply to all control surfaces but the test mount. 5.2.1 Temperature Gradients The added thermocouples are positioned in order to determine the maximum temperature gradients across the control surfaces. Temperature measurements are performed on the test mount and shroud face 3. The measurements are performed in order to determine if the single thermocouple mounted at the center of each control surface is enough as control input. The temperatures are measured during a hot steady state at approximately 430 K as well as during heating to this equilibrium point. Heating input is supplied to all control surfaces but the test mount. The test mount temperature is allowed to radiatively follow the shroud faces. (a) (b) Figure 5.3: Test table temperature variations during heating and at steady state. The first subscript denotes horizontal position: ”c” meaning center, ”b” back, and ”f” front. The second subscript denotes vertical position where ”t” means top and ”b” bottom. a) Temperatures across the test mount during heating. b) Temperature across the test mount at steady state. Figure 5.3 illustrate how the temperature varies across the test table during heating and at steady state. The thermocouples mounted farthest from the 44 Chapter 5. Verification of Dynamics and Input Coolant Investigations hatch,”back”, register a slightly greater value than the others; however, the variations are not great. Figure 5.4 depicts the temperature variation across shroud face 3 during heating and at steady state. The thermocouple mounted in the center of the face registers values larger than the others, especially during heating. Such a result is expected since this thermocouple is located closest to the energy input. The thermocouples mounted on the edge of the face show that the front of the surface is slightly warmer than the back. (a) (b) Figure 5.4: Face 3 temperature variations during heating and at steady state. The first subscript denotes horizontal position lateral to the thermal shroud: ”l” meaning left, ”r” right, and ”c” center. The second subscript denotes horizontal position along the shroud, where: ”f” means front, ”b” back, and ”c” center. a) Temperatures across face 3 during heating. b) Temperatures across face 3 at steady state. 5.2.2 Temperature Decrease Without Energy Input Measurements are performed in order to verify the generated model of the thermal vacuum chamber. The chamber is heated to 433 K, it is then allowed to reach steady state. The temperature is allowed to decrease without control input. The temperatures registered by each thermocouple serving as control input is logged. The registered data for face 3 and the test mount can be seen as the dashed lines in Figure 5.5a and Figure 5.5b respectively. The nonlinear model is used to simulate the considered cycle. These values are represented by the solid lines in Figures 5.5. The temperature evolution of each control surface has been investigated. The simulated values correspond well to the measured ones. 45 Chapter 5. Verification of Dynamics and Input Coolant Investigations (a) (b) Figure 5.5: Comparison between measured and simulated temperatures. The simulated values are obtained through the nonlinear model. a) Temperature decay of face 3, simulated and measured values. b) Temperature decay of test mount, simulated and measured values. 5.2.3 Temperature Increase Without Energy Input The testing facility temperature is decreased down to 113 K applying cooling input to all control surfaces but the test table. As a result, the test table reaches a minimum temperature value of 121 K. The temperature is allowed to increase to ambient without control input, once equilibrium has been reached. The control input temperatures are logged throughout the cycle. The registered values of face 3 and the test mount are depicted as the dashed lines in Figure 5.6a and Figure 5.6b respectively. The corresponding simulated values are represented by the solid lines in the figures. The nonlinear model is simulated, just as in the prior experiment. The simulated temperature evolution of each control surface correspond well to the measured ones, just as during the previous cycle. (a) (b) Figure 5.6: Comparison between measured and simulated temperatures. The simulated values are obtained through the nonlinear model. a) Temperature increase of face 3, simulated and measured values. b) Temperatures increase of test mount, simulated and measured values. 46 Chapter 5. Verification of Dynamics and Input Coolant Investigations 5.2.4 Thermal Coupling Between Test Table and Thermal Shroud The cooling process of the previously described cycle is investigated in order to further verify the radiative coupling between the test mount and the thermal shroud. The shroud quickly reaches the specified 113 K. The test mount temperature decay is logged and plotted as the dashed line in Figure 5.7. The corresponding simulated values are represented by the red curve in the figure. Figure 5.7: Temperature decay, from room temperature, of test mount when the shroud is held constant at 113 K The simulated values correspond well to the measured ones. However, they start to deviate slightly for measured temperatures below 200 K. 5.2.5 Conclusion The experiments indicate that the derived nonlinear dynamics coincide with the measured temperature evolutions. The temperature gradients are fairly large during the transient portion of a thermal cycle. The validity of the assumption of isothermal surfaces can be questioned, when input energy is applied. Even though it is an impractical solution, the gradients could be dealt with through the use of additional thermocouples. The mean value of each control surface temperature could then be used as control input. Alternatively, the addition of a Kalman filter 2 could reduce the negative impact the temperature gradients have on controller performance. However, the current control system utilizes one measurement device per control surface, and it operates to specification during hot cycle control. Weighing such knowledge with the difficulty of installing extra thermocouples as control input, there is not enough wiring space available for additional stationary thermocouples, encourages proceeding with a single measurement point as control input. 5.3 Estimation of Input Coolant Several measurements are performed in order to determine the character of the available control input during cooling. Two different types of cycles are considered: the temperature decay of all control surfaces when all cryogenic 2 The idea of a Kalman filter is briefly explained in Chapter 6. 47 Chapter 5. Verification of Dynamics and Input Coolant Investigations valves are opened, and the temperature decay of all surfaces when the cryogenic valve corresponding to the test mount is opened. The system is controlled manually, open loop control, during the input coolant experiments. The reader is directed to the section Manual Control, in Chapter 2, for a description of how open loop control of the thermal vacuum chamber is executed. 5.3.1 Coolant Power When All Cryogenic Valves are Opened ~ K. Once equiThe thermal vacuum chamber is heated to a temperature of 433 librium is reached, all the cryogenic valves are forced open. The control input temperatures, for all control surfaces, are registered during the cycle and plotted in Figure 5.8a. The red lines in the figures are the registered test mount temperatures. Two identical cycles are performed in order to verify the time invariance of the system and to strengthen the results. (a) (b) Figure 5.8: Temperature decay of all faces when maximum coolant input is applied. The red line represents the temperature of the test mount. a) First test. b) Second test. A third degree polynomial is fitted, through a least-squares approach, to each of the temperature evolutions in order to obtain the control surface temperatures as functions of the time. The temperature polynomial of face 1 is compared to the measured data in Figure 5.9. This particular comparison is illustrated as an example, all of the functions fit well to the measured data. 48 Chapter 5. Verification of Dynamics and Input Coolant Investigations Figure 5.9: Comparison between measurements and approximated temperature polynomial of control surface one The input powers can be expressed using Equation 4.10 and Equation 4.11 as: ~u = −Cspec M dT~ 4 − Cc T~ − Rc T~ 4 − Rl (T~ 4 − T~ambient ) − Cl (T~ − T~ambient ), (5.1) dt ~ where ddtT can be calculated, for this particular cycle, by differentiating the derived temperature polynomials. The input control vector is plotted against the time in Figure 5.10. The figure illuminates that the input power is neither constant nor linear throughout the cycle. Analogous calculations have been performed for the second set of data resulting in equivalent plots. 49 Chapter 5. Verification of Dynamics and Input Coolant Investigations (a) (b) (c) (d) Figure 5.10: Maximal cooling power available at all control surfaces, when all cryogenic valves are opened. Geometrically similar surfaces are gathered in each figure. The control signals are plotted against the time span where the polynomials match the measurements well. a) Estimated coolant input supplied to faces 1 through 8. b) Estimated coolant input supplied to faces 9 through 14. c) Estimated coolant input supplied to faces 10 and 13. d) Estimated coolant input supplied to test table. All of the calculated input powers are added, see Figure 5.11, to form the total cooling power as function of time for this particular cycle. The figure illustrates an input power peak of 13.5 kW after 10 minutes. The control surface temperatures range from 300 K to 350 K at this peak, see Figure 5.8. The lower total power input prior and post the peak may appear due to a premature/delayed liquid nitrogen phase change. Prior to the peak, the coolant supply system may still be hot enough to force some of the nitrogen to boil before entering the test chamber. Once the chamber is sufficiently cooled, part of the input coolant does not boil at all (this phenomena can be seen as liquid nitrogen spraying out of the exhaust). 50 Chapter 5. Verification of Dynamics and Input Coolant Investigations Figure 5.11: Total cooling power as function of time during the described cycle. The total amount of used liquid nitrogen during the cycle is measured as approximately 5% of the total available volume in the external reservoir (4 m3 ), which is 200 dm3 . There is a measurement device positioned on the liquid nitrogen reservoir enabling the estimation. The obtained value is not exact but will be used in order to investigate if the calculated input power is plausible. The energy required to vaporize V = 200 dm3 of liquid nitrogen is calculated as E = ∆Hvap ρV, (5.2) where: ∆Hvap = 198.6 kJ/kg is the enthalpy of vaporization of liquid hydrogen, and ρ = 0.807 kg/dm3 is the density of the same substance. The obtained energy is divided by the total time the cryogenic valves are opened, approximately 45 minutes, resulting in a power of 12 kW. 5.3.2 Conclusion The mean value of the total power, provided in Figure 5.11, is calculated as 11.8 kW. The mean value averaged over the entire experimental time would be slightly lower. Such a value is smaller than, the through Equation 5.2 obtained, 12 kW, which is to be expected due to the premature and delayed liquid nitrogen phase transition. The result also indicates that the coolant input in fact is a result of a phase shift, and that the energy input stemming from a gas temperature increase is negligible. The values presented in Figure 5.10 and Figure 5.11 appear plausible, thus further strengthening the derived model as well as providing insight into the magnitude of the input coolant power. 5.3.3 Coolant Power When Test Table Cryogenic Valve is Opened A measurement is performed in order to investigate the cooling power when a single valve is opened, such a measurement may bring clarity to whether the flow through a particular valve depends on if nitrogen flows through the other valves or not. Initially, the chamber is in a state of equilibrium, all faces with an approximate temperature of 433 K. The cryogenic valve that regulates the test mount 51 Chapter 5. Verification of Dynamics and Input Coolant Investigations coolant input is forced opened. The temperature decay of all shroud faces is registered and displayed in Figure 5.12a. A third degree polynomial is fitted, in a least square sense, in order to describe the temperature progression of each surface as function of the time. Figure 5.12b depicts a comparison between the measurements and the polynomial corresponding to the test mount. All polynomials fit well to the respective measurements. (a) (b) Figure 5.12: Temperature decay of all faces when maximal coolant input is applied to the test mount. a) Considered cycle. The red line is the temperature of the test mount. The blue lines are the temperatures of the thermal shroud. b) Least squares fitted polynomial of the third degree. The polynomials are differentiated and inserted into Equation 5.1 along with the measurements. The resulting coolant power supplied to the test mount is depicted in Figure 5.13a, and the total cooling power in Figure 5.13b. (a) (b) Figure 5.13: Cooling power in total and at face 15, when the cryogenic valve corresponding to the test mount is opened. a) The control u15 . b) The total P15 control input i=1 ui . The two figures should be identical if the considered cryogenic valve only pro52 Chapter 5. Verification of Dynamics and Input Coolant Investigations vides input coolant to its corresponding control surface. This dissimilarity between the figures quantifies the accuracy of the control input estimation. The main difference occurs in the beginning and the end of the cycle. These are the regions where the fitted polynomials are most inaccurate. The deviations are also likely to be a result of model errors as well as measurement inaccuracies. 5.3.4 Conclusion The maximal available cooling power at the test table increases by a factor four between the two different control cycles, see Figure 5.10d and Figure 5.13a. It is safe to conclude that the available cooling power at each surface is highly dependent on the states of the other cryogenic valves and that the previously estimated constant cooling power of 300W is insufficient. However, the cooling input power can be estimated at any given time and chamber temperature using Equation 5.1. 5.4 Pulse Duration Modulation Investigation Experiments are executed in order to investigate the feasibility of obtaining the desired control input utilizing a pulse duration modulation technique. The test table cryogenic valve is allowed to be opened for 50% and 10% of each minute ~ K. during the thermal cycle. The cycle is initiated at an equilibrium of T~ = 433 (a) (b) Figure 5.14: Pulse duration modulation experiments. The control input to the test mount is plotted when the cryogenic valve is allowed to be opened with different duty cycles, all other valves remain closed throughout the cycle. a) A 50% duty cycle is applied. b) A 10% duty cycle is applied. The coolant input for the temperature evolution generated with a 50% duty cycle is depicted in Figure 5.14a, and the resulting coolant input when a 10% duty cycle is implemented in Figure 5.14b. The figures illustrate peak decreases of 41% and 75% respectively, compared to the maximal input peak of 3.7 kW depicted in Figure 5.13a. 53 Chapter 5. Verification of Dynamics and Input Coolant Investigations 5.4.1 Conclusion A lower duty cycle results in less coolant input as expected. The duty cycle decrease does not generate an equivalent decrease in coolant input according to the performed experiments. This could be the result of systematic errors since the duty cycle length has to be controlled manually, which is fairly difficult to do accurately. The experiments indicate that the necessary coolant input could be generated by means of pulse duration modulation. 54 Chapter 6 Controller Design and Simulation This chapter covers the control theory used to design a control law for the system in question. A linear quadratic controller is selected to steer the system. Such a control law is designed directly in state space which is an advantage, the design procedure is fairly intuitive in the time domain. A linear quadratic controller is fairly easy to implement and it is a good controller choice when the control signal has specific bounds. The couplings within the system are considered without difficulty when using such a design technique. The dynamics considered during the design process is described by Equation 4.19 and Equation 4.15. The linearized dynamics are summarized as: ∆ dT~ dt ∆~y = A∆T~ + B∆~u = C∆T~ (6.1) where, ∆T~ ∆~u = T~ − T~ ∗ = ~u − ~u∗ . (6.2) (6.3) The superscript denotes a variable evaluated at the point of linearization. In order to simplify the implementation, a single controller is used and thus only one point of linearization is selected (room temperature). If the result turns out to be insufficient, one could design multiple controllers for linearization points spread out through the operating temperature range. 6.1 Linear Quadratic Control A linear quadratic regulator is a stabilizing control law that minimizes some quadratic matrix valued target function Z tf ∆T~ (τ )T Q∆T~ (τ ) + ∆~u(τ )T R∆~u(τ )dτ (6.4) J(u) = 0 while subjected to the system dynamics. If the target function is bounded over an infinite time horizon, tf can be allowed to tend to infinity. The problem is 55 Chapter 6. Controller Design and Simulation then referred to as an infinite horizon linear quadratic optimal control problem. Such a situation is convenient to consider if the system is meant to operate around the same point for long periods of time3 . In Equation 6.4, Q is an arbitrary positive semi-definite matrix, and R is an arbitrary positive definite matrix. These matrices are design parameters and should be selected in a fashion that yields satisfactory closed loop performance. The unique optimal control law to such a problem is given by ∆~u = −R−1 BT P∆T~ (6.5) where P is the positive semi definite unique solution to the algebraic Riccati equation. The algebraic Riccati equation has the form AT P + PA − PBR−1 BT P + Q = 0. (6.6) Equation 6.6 is guaranteed to have such a solution if the considered system is minimal [14, 12], the concept of minimality is discussed in Section 6.1.1 concerning reachability and observability. If the time horizon is bounded, the optimal control law is obtained by solving the Riccati equation which is a matrix valued differential equation. This is significantly more complicated and quite unnecessary in this particular case. 6.1.1 Reachability and Observability If the system described by Equation 6.9 and Equation 6.10 is both reachable and observable; then, it is referred to as minimal. A system is referred to as completely reachable if there exists an input signal that transfers the system from any initial state to any different final state. It has been show that time invariant systems are reachable if the reachability matrix Γ = [B AB A2 B · ·An−1 B] (6.7) has full rank. If it is possible to determine in which state the system is located for all know inputs and corresponding outputs; then, the system is referred to as a completely observable. It is possible to prove that the system is completely observable if the observability matrix C CA Ω= (6.8) · · CAn−1 has full rank. A system that is both reachable and observable is referred to as minimal [14]. An infinite number of matrices (called realizations): A, B, and C can generate the transfer functions describing the system, G(s). However, if the system is minimal no other set of matrices with lower dimension can generate G(s); therefore, a minimal realization does not contain any unnecessary states. 3 If the main purpose of the regulator is to maintain the states at specified values, then finite time behavior is less significant [12]. 56 Chapter 6. Controller Design and Simulation 6.1.2 Reference Tracking The Linear quadratic controller does not integrate the control error in order to eliminate static errors during steps in the reference. Integral action can be added to the controller through the addition of one state per integration to be performed. Such an addition yields the modified system dynamics as # # " " ˙ ∆T~ A 0 ∆T~ B 0 = + ∆~u + ∆~r (6.9) ˙~ ~ 0 I −C 0 ∆ψ ∆ψ ∆~y C∆T~ . = (6.10) ~˙ = ∆~r − C∆T~ is the control error vector. A zero valued static error where ∆ψ is desired for all control surfaces. Henceforth, the control errors corresponding to all original states are added to the state vector. A and B are the matrices described by the original state space realization. The reference values are denoted ∆~r = ~r − T~ ∗ . Let there be a step in the reference. The reference will then remain constant for all t greater than zero. Since integral action is added to the system dynamics, the static error at t = ∞ will be zero during a step in the reference [9]. The desired point in state space is thus described by Equation 6.9 evaluated at t = ∞. If this desired point is subtracted from Equation 6.9, the dynamics for the deviation of the target point arise as ~e˙ = Â~e + B̂~ue (6.11) where: Â = ~e = ~ue = ∆T~ (t) − ∆T~ (∞) ~ − ∆ψ(∞) ~ ∆ψ(t) A −C 0 , 0 B̂ = ∆~u(t) − ∆~u(∞) B , 0 = = = T~ (t) − T~ (∞) , ~ − ψ(∞) ~ ψ(t) ~u(t) − ~u(∞). (6.12) (6.13) Since it is desirable to minimize the deviation from the desired state it is beneficial to have the system dynamics on the form of Equation 6.11. The dynamics are determined as reachable and observable through the use of Equation 6.8 and Equation 6.7. An optimal control law, in the sense of Equation 6.4, that fulfills the dynamics presented in Equation 6.11 can now be obtained. The control law is on the form of Equation 6.5 with B replaced by B̂. P̂ is obtained by solving the algebraic Riccati equation implementing the dynamics of the deviations. The obtained control law is [19]: ~ue = [K − KI ]~e, (6.14) [K KI ] = −R−1 B̂T P̂. (6.15) where The control law can be implemented on Equation 6.9, if Equation 6.13 is solved for " # ∆T~ ∆~u = [K − KI ] (6.16) ~ ∆ψ 57 Chapter 6. Controller Design and Simulation ~ = ψ(t) ~ − ψ(0) ~ ~ since no integration has occurred at t = 0. The where, ∆ψ = ψ(t) actual analog system input, ~u , is obtained by simply adding ~u∗ to Equation 6.16 resulting in: Z t ~r(τ ) − CT~ (τ )dτ + ~u∗ , (6.17) ~u(t) = K∆T (t) − KI 0 where C = I15×15 is the output matrix. 6.1.3 Kalman Filter A linear quadratic regulator is guaranteed to have a phase margin of 60◦ along with an infinite amplitude margin, if the states can be measured exactly [10]. It is seldom possible to measure states exactly due to the presence of measurement inaccuracies and some of these robustness margins will therefore be lost. A state estimator can be implemented in order to re-gain some of the lost robustness properties. Such an estimator can be designed separately from the state feedback which is done in this section. The states are estimated through the use of a simulated model driven by the same input as the true system. The dynamics of the estimator is thus similar to that of Equation 6.1 ∆ ˆ dT~ ˆ ˆ = A∆T~ + B∆~u + L(∆~y − C∆T~ ) dt (6.18) with the addition of the estimator gain, L, multiplied with the difference between the measured and estimated states. The estimator gain is referred to as a Kalman gain if determined through the following procedure. Consider the dynamics described by Equation 6.1 with the uncorrelated white noises v1 and v2 acting on the system according to ∆ dT~ dt ∆~y = A∆T~ + B~v1 = C∆T~ + ~v2 . (6.19) The white noises have covariances E[~v1~v1T ] E[~v2~v2T ] = = R1 , R2 . (6.20) (6.21) (6.22) The estimator gain that minimizes the norm of the estimation error, ∆T~e = ˆ ∆T~ − ∆T~ , is given by L = PCT R2 −1 , (6.23) which is referred to as the Kalman Gain. R1 and R2 are diagonal matrices with the intensity of the noise on the diagonal. These diagonal elements could be seen as design parameters. The matrix P is the positive definite solution to T T AT P + PAT − PCT R−1 2 C P + BR1 B = 0 58 (6.24) Chapter 6. Controller Design and Simulation which is guaranteed to exist as unique if the system is reachable and observable [14], a property already found to be true for the considered dynamics. The proportional part of the control law, see Equation 6.17, can now be modified to ˆ act on the estimated states ∆T~ instead of ∆T~ . The main reason to implement a Kalman filter, in this particular case, is to reduce the impact of the assumption regarding isothermal surfaces. Since the accuracy of this assumption is difficult to quantify, it is hard to determine how effective the estimator is in this particular case. The Kalman filter is only briefly mentioned, a thorough mathematical description is provided in [14], in this work as it is not recommended to be applied during an initial controller implementation, since the attained model has to be simulated on-line in the PLC. The initial implementation should be as simple as possible. The Kalman filter is therefore excluded during the forthcoming sections. 6.2 Simulation of Closed Loop Figure 6.1 is a block diagram representation of the closed loop system. The plant is described by the nonlinear dynamics. The gain matrices K and KI are obtained using a linearization around room temperature. The control signal is analog and it has to be discretized before implementation on the physical system can occur. ~r P ~˙ ψ R ~ ψ P KI ~u Plant ~y K C ~x −1 Figure 6.1: Block diagram representation of closed loop system including integration of the control errors as well as a linear quadratic controller. A temperature cycle is simulated using the LQ Controller Design Tool, to be described in Chapter 7, resulting in Figure 6.2a and Figure 6.2b. This particular cycle is selected in order to demonstrate that the controller fulfills necessary specifications. The reference is decreased with 8 degrees per minute until a target temperature of −185 ◦ C is reached, which is a cycle stated as a requirement. 59 Chapter 6. Controller Design and Simulation (a) (b) Figure 6.2: Temperatures and input control of all faces when a target temperature of −185 ◦ C is specified. The negative ramp is specified as −8 degrees per minute. a) Temperatures of all faces. The temperature of the test mount is depicted as red. b) Control input to all faces. The input to the test mount is depicted as red. The evolution reveals an under-shoot of 2.5 degrees in test mount temperature (M= 1.35%), a maximum over/under-shoot of 3 K is allowed. The static errors have been completely eliminated for all surfaces, a maximal steady state error of 3 K is allowed. The settling time is calculated as approximately 30 minutes. The test mount control signal, depicted as red in Figure 6.2b, does no significantly exceed the minimal available coolant, see Figure 5.10. This particular input does not become saturated and further nonlinear uncertainties are unlikely to be added to the dominating input output relation of the test mount. 6.3 Analysis of Closed Loop System In this section some of the properties of the generated closed loop system are investigated, through the use of well founded theory. The gain relating any input to any output is guaranteed to lie between the maximum and minimum singular value of the corresponding transfer function. The singular values, σ, of a complex valued matrix, G(iω), are defined as the square root of the eigenvalues to G(iω)∗ G(iω), where the superscript indicates the complex conjugated transpose. The direction at which the gain of a singular value is obtained is determined by the corresponding eigenvector. The singular values are easily calculated using the Matlab function sigma, for any input output relation, once the time domain dynamics are written on appropriate form. The closed loop system, implementing the derived controller, is described in state space by: " ˙ ∆T~ ~˙ ∆ψ # = ∆~y = C∆T~ . A − BKC −C BKI 0 " # ∆T~ 0 ~ + I ∆~r ∆ψ (6.25) (6.26) 60 Chapter 6. Controller Design and Simulation which relates the input ∆~r to the output ∆~y . The resulting singular values can be seen in Figure 6.3a. The figure illustrates that the closed loop system bandwidth is not less than 0.004 rad/sec, since the minimal gain has dropped 3 dB at this frequency. Therefore, a reference with frequency higher than this value may not be followed well. This result does not pose any practical problems since such cycles are not implemented in practice. The gain at lower frequencies is one, which is desired. The frequencies at which the transfer function relating the control signal to the output is small is of the uttermost interest since the control signal needs to be discretized before implemented. The open loop dynamics, see Equation 6.9 and Equation 6.10 describe the input output relation. The corresponding singular values can be seen in Figure 6.3b. The figure illustrates that an input frequency increase results in an output attenuation increase, for all frequencies above approximately 0.003 rad/sec and all input directions. The control is largely attenuated for frequencies above ω = 0.1 rad/sec. If the discretized control signal is updated in a time interval less than T = 2π ω = 63 s, then the discretization should not be seen significantly in the output. (a) (b) Figure 6.3: The gain between input and output is guaranteed to lay between the maximum and minimum singular values of the transfer function in question. a) Singular values of transfer function relating reference to output. b) Singular values relating control signal to output. This hypothesis is verified in Simulink. The closed loop linear system is incorporated into Simulink and the discretization of the control signal is modeled through the addition of a Zero-Order Hold block, with a sampling time of 60 s. 61 Chapter 6. Controller Design and Simulation (a) (b) Figure 6.4: Closed loop Simulink simulation. The reference to be followed is a ramp with slope −8 degrees per minute. Note that ∆T~ and ∆~u are displayed. Cooling power is considered positive. a) Output. b) Control signal. Figure 6.4 shows the unaffected output and the discretized control signal when a negative ramp of 8 degrees per minute is set as reference. 62 Chapter 7 LQ Controller Design Tool In order to simplify controller adjustments, a controller design tool is developed. This design tool is a graphical user interface that relies on the derived dynamics. The interface enables the user to design a controller, and to simulate the temperature progression when the controller is implemented. The control parameters can easily be adjusted such that the controller fulfills all desired specifications. A screen-shot of the controller design tool is shown in Figure 7.1 Figure 7.1: Developed controller design tool. 63 Chapter 7. LQ Controller Design Tool 7.1 Setting the Weight Matrices The diagonals of the weight matrices Q and R are set in the boxes displayed in the top of Figure 7.1. The first fifteen diagonal elements in Q, these values are set through the fifteen red boxes positioned at the top in Figure 7.2, punish the deviation of ∆T~ from the desired reference. The last fifteen diagonal elements in Q are set through the fifteen red boxes positioned below the previous ones. These elements determine the magnitude of integral control error punishment. The user utilizes the fifteen blue boxes to set the diagonal elements in R. R is used to punish the amount of input control, input heat/cooling power, used by the controller. Figure 7.2: The weight matrices Q and R are set using these boxes, located at the top of the GUI. The weight matrices determine the overall closed loop behavior. For instance, the closed loop system behaves sluggishly if the control is greatly punished. However, the system will not consume much heat/coolant power. 7.2 Settings and Activity Log The characteristics of the cycle to be run can be set in the box denoted Settings, depicted in Figure 7.3a. (a) (b) . Figure 7.3: The dialog boxes Settings and Activity Log. a) The cycle to be simulated is specified in the depicted box. b) The command and error history can be seen in the Activity Log. The target temperature, in Celsius, is set in the top box. The box second to the top in Figure 7.3a allows the user to specify the mass of the test object. A larger mass will render a slower temperature response. The chamber is considered empty if the mass is set to zero. The added test object is modeled as a point mass. The user should bear in mind that the radiative properties of 64 Chapter 7. LQ Controller Design Tool the test mount are not changed within the model when a larger (a heavier test object is generally larger) test object is simulated i.e. the larger the object the greater the model errors. The temperature ramp set as reference is specified in the box second from the bottom. The box labeled Final Time simply allows the user to specify the length of the simulation. The Activity Log, depicted in Figure 7.3b, records all the actions performed by the user as well as informs of eventual faulty user inputs. 7.3 Simulation and Controller Generation Once all the necessary parameters have been set, the user can generate a controller and simulate the closed loop system by pressing the button denoted Execute Simulation seen in Figure 7.4. The simulated temperature progression is displayed in the graph located at the left bottom corner of Figure 7.1. The control signal necessary to generate this progression is plotted in the graph situated in the right bottom corner of Figure 7.1. The user can select which temperatures and control signals to plot, through the toggle bars positioned below the graphs. The variables corresponding to the test mount is depicted as red, the temperatures and control input of the other surfaces are blue. Once the closed loop system behaves to satisfaction, the controller is written to file by pressing the button Write Controller to File (see Figure 7.4). Figure 7.4: Developed controller design tool. The matrices K and KI are written to the files K.txt and KI.txt respectively. 65 Chapter 8 Implementation The procedure of implementing a linear quadratic controller in the PLC is described in this chapter. 8.1 Analog Control in Practice The amount of input power to be supplied to each individual control surface in the space simulation chamber is determined by the control law provided by Equation 6.17. The temperatures are measured frequently enough for the control output to be considered analog; however, the controller has to be implemented as discrete. In order to explain the implementation procedure, a two dimensional example is provided. 8.1.1 Two Dimensional Example Assume that the thermal vacuum chamber only has two surfaces for temperature control, face 1 and face 2. The temperatures T1 and T2 are measured each Ts = 1 second 4 . The controller specifies the amount of heat/coolant input power to be provided to control surface 1 (u1 ) of the chamber as u1 (kTs ) = k11 (T1 (kTs ) − T1∗ ) + k12 (T2 (kTs ) − T2∗ ) − − ki11 n=kT Xs n=0 (r(n) − T1 (n)) − ki12 n=kT Xs n=0 (r(n) − T2 (n)), (8.1) where: k is a positive integer, k11 and k12 are the proportional gains, and ki11 and ki12 are the integral gains. The temperatures T1∗ and T2∗ are the temperatures at the selected point of linearization. Here, the point of linearization is selected as room temperature. It is important to note that the temperatures to be inserted into Equation 8.1 are the absolute ones. This is a conventional PI controller; however, the gains are determined as optimal according to Equation 6.4. 4 Little is known about the actual system sampling time; however, measurments can be logged each second which means that Ts ≤ 1 second. 66 Chapter 8. Implementation The thermal vacuum chamber accommodates fifteen control surfaces. Equation 8.1 will therefore contain an additional thirteen terms when implemented. There will be a total of fifteen such equations, one for each control surface. The proportional gains to be included in this equation are the elements in the matrix K, and the integral gains in the matrix KI (provided through the LQ controller design tool). The subscript indicates the column row position in the matrices. The control input vector, containing the input for all faces, calculated in this fashion is denoted ~ua = [u1 u2 u3 · · u15 ]T in Figure 8.1. 8.2 Control Signal through Pulse Duration Modulation The analytical results and simulated system responses indicate that the system can handle a descritizised control signal. However, generating the required input signal that is determined by the feedback (through pulse duration modulation), can prove to be difficult due to the uncertainty in available cooling power. The input flow of coolant cannot be measured as is; therefore, the cooling power needs to be estimated in real-time. Such an estimation can be performed through the use of Equation 5.1. The information can be utilized to generate a discrete signal with a frequency high enough to be perceived as analog. A block diagram describing the complete close loop system to be developed can be seen in Figure 8.1. Coolant Estimation ~uavailable ~r P ~˙ ψ R ~ ψ KI P ~ua Discretization ~ud Plant K C ~x −1 Figure 8.1: Complete closed loop system. The estimation of the current input and the discretization of the analog signal provided by the controller, are performed by the blocks denoted Coolant Estimation and Discretization respectively. 8.2.1 Coolant Estimation The block Coolant Estimation estimates the coolant input that was provided to the system at each previous sampling time through Equation 5.1. The temperature derivatives are being estimated by the current control system, each Ts . The derivatives along with the measured temperatures are inserted to Equation 5.1 67 ~y Chapter 8. Implementation resulting in the available coolant power at every Ts . The output of the block is the coolant power available for every control surface during the current sample. 8.2.2 Pulse Duration Modulation Algorithm The block Discretization transforms the by the controller calculated analog input power to a discrete signal. The block receives the calculated power to be supplied and the estimated available cooling power as inputs each Ts . The idea is to compare the calculated analog input to the estimated available input, adding estimated fractions until the required input is obtained. A suggestion for such an algorithm is presented in this section. To ensure that the descritization is not seen in the output, a plant input power update time of no more than Tupdate = 40 s is suggested. The disctretization block performs the following calculations each Ts , if ua ≤ 0. If ua > 0, heater input is required and the preceding loop is not executed. Initially, allow all cryogenic valves to be open. The states of all cryogenic valves are noted and saved. The pulse duration modulation loop for coolant input can be commenced. The following algorithm is restarted every Tupdate ˆ. This vector is initially set to ~0. • Define a total control output vector as ~u • Define a variable k which will serve as a counter throughout the loop. • Get ~ua from the controller. • for kTs ≤ Tupdate 1. Get ~uavailable from the Coolant Estimation block. Only update the values in ~uavailable that correspond to opened cryogenic valves. 2. Calculate the total power that will be provided to each control surface, if the corresponding cryogenic valve is opened for a cycle in the loop and closed for the rest of Tupdate . ˆ. 3. Add this value to ~u ˆ to the corresponding elements of ~ua . 4. Compare all elements i of ~u if ûi ≥ uai close the corresponding valve and note the state of the valve. else keep the valve opened and note the state of the valve. 5. Increase the value of k by one. 6. Go to 1 The described algorithm provides a general outline of how to supply the system with the necessary coolant input. The procedure may need to be modified and adjusted in order to perform satisfactory. 68 Chapter 8. Implementation 8.3 System Modifications The PLC does not have access to the heater as the system is designed today, the PID controllers are solely responsible for the provision of heat input. The control law determined in this work utilizes both heat input and coolant input. The PID controllers consequently need to be taken off-line and the PLC needs to be given access to the thyristors controlling the heaters. The Watlow PID controllers will no longer be necessary and can therefore be physically removed. 8.4 Numbering of Control Surfaces The control surface numbering presented in this work differs from the convention used in the current PLC algorithm. This difference needs to be considered if the developed control algorithm is to operate as predicted. The difference is easily accounted for by changing the order of the elements in the temperature vector and the control input vector. The PLC values, denoted with superscript P , should be organized as: P P P P P P T14 T15 T10 T11 T12 T9P ]T , T~ = [T7P T8P T1P · · T6P T13 (8.2) ~uP = [u3 · · u8 u1 u2 u15 u12 u13 u14 u9 u10 u11 ]T . (8.3) and 69 Chapter 9 Conclusion The functionality and operational principles of the space simulation chamber were investigated and summarized, as a starting point for this thesis. The dynamics of the thermal vacuum chamber were modeled through the use of well established physical relationships. The different modes of heat transfer were treated separately and added to form the dynamics. The radiative couplings between the control surfaces in the vacuum chamber were estimated using the thermal analysis software ESATAN. All other modes of heat transfer were considered analytically. Numerous different model verification experiments have been performed. These experiments indicate that the model corresponds well to the physical system. A method for designing Linear Quadratic control laws has been developed and presented in terms of a graphical user interface. The interface enables the user to tune the controller to provide ideal performance for each individual testing situation. The user is also allowed to simulate the temperature evolution of the nonlinear system when the generated control law is implemented. The controller is based on a single linearization of the derived non linear model around the equilibrium state of room temperature. The controller provides an analog input power that is to be supplied to the plant. The available input power has been investigated for all different control surfaces. The amount of cooling power is dominated by a liquid nitrogen phase transition. The available input is concluded to depend on the chamber temperature as well as the states of the cryogenic valves. The maximum amount of input available to the test mount is found to be approximately 3.7 kW. Simulations suggest that a maximal test mount cooling power of 700 W is necessary in order to generate the paramount ramp of −8 ◦ per minute. The power input of the test mount has been found to vary up to a factor of four, depending on the states of the cryogenic valves. In order to deal with these complex dependencies, an additional feedback that estimates the available cooling power at any given time has been suggested. This estimation is obtained using the non linear dynamics. The temperature gradients across selected control surfaces were investigated during steady states and transient situations. The gradients during the transient 70 Chapter 9. Conclusion part of a thermal cycle can be large and may affect controller performance, since control input currently is provided through a single measurement point on each control surface. If the phenomena result in temperature tracking difficulties, a Kalman filter could be implemented in order to reduce the uncertainty in the measured states. Another possibility would be to add additional measurement points to each control surface, allowing calculated mean values to pose as states. Since the valves providing input coolant only operate in two states (opened and closed), a pulse duration modulation approach has been suggested to deliver the analog output. Executed calculations and simulations show that a pulse length of Tupdate ≤ 60 s is undetectable in the output. Furthermore, a pulse length of Tupdate ≤ 40 s has been suggested in order to account for the assumption of isothermal surfaces. The cryogenic valves have a minimal cycle length of approximately 1 s which, together with the suggested pulse length, limits the input coolant resolution. The basic layout of a pulse duration modulation algorithm has been presented. 71 Bibliography [1] Amrit Ambirajan and S.P Venktateshan, Accurate determination of diffuse view factors between planar surfaces, Tech. report, Department of Mechanical Engineering, 1992. [2] European Aluminum Association and the MATTER Project, Alu select, http://aluminium.matter.org.uk/aluselect/03_physical_browse. asp, January 2012. [3] Azom, Stainless steel - grade 304, http://www.azom.com/article.aspx? ArticleID=965l, January 2012. [4] Backer, Ingjutna rörelement, http://www.backer.se/Produkter/ ingjutna-rorelement, January 2012. [5] R. Verhoeven Eds. M. Rahman and C.A. Brebbia, The influence of knudsen number on the hydrodynamic development length within parallel plate micro channels, Tech. report, Centre for Microfluidics, 2002. [6] Boc Edwards, Instruction manual, wide range gauge, http://www. ultimatevacuum.dk/D14701880%20WRG%20manual.pdf, May 2012. [7] Randal F.Barronl, Cryogenic heat transfer, Taylor and Francis, 1999. [8] Göran Flodamn and Anders Sihlbom, Handbok i termisk konstruktion av elektronik i apparatmiljö, Institutet för verknadsteknisk forskning, 1988. [9] Torkel Glad and Lennart Ljung, Reglerteknik grundläggande teori, Studentliteratur AB, 2008. , Reglerteori, flervariabla och olinjära metoder, Studentliteratur AB, [10] 2009. [11] C. Salvador Albert i Riera, Vacuum pump rvr by pass, http://www. pedrogil.com, January 2012. [12] Ulf T. Jönsson, Optimal control, Optimization and Systems Theory, Royal Institute of Technology. SE-100 44 Stockholm, Sweden, 2010. [13] Engineering.com Library, Emissivity, http://www.engineering. com/Library/ArticlesPage/tabid/85/articleType/ArticleView/ articleId/151/Emissivity.aspx, January 2012. 72 BIBLIOGRAPHY [14] Anders Lindqvist and Janne Sand, An introduction to mathematical systems theory, Optimization and Systems Theory, Royal Institute of Technology. SE-100 44 Stockholm, Sweden, 2011. [15] ITP Engines UK Ltd., Esatan-tms thermal engineering manual, ITP Engines UK Ltd., Whetstone, Leicester, UK, 2010. [16] Matbase, Matbase, a leap forward in material data, http://www. matbase.com/material/non-ferrous-metals/wrought-aluminium/ almg3-5754a/properties, January 2012. [17] S. Brian Morris, Programmable logic controllers, Prentice Hal, Inc, Upper Saddle River, New Jersey 07458, 2000. [18] DOE office of science, Helium and nitrogen sizes, http://www.newton. dep.anl.gov/askasci/chem00/chem00243.htm, June 2012. [19] Katsuhiko Ogata, Modern control engineering, third edition, Prentice-Hall International, Inc, 1997. [20] INC. OMEGA ENGINEERING, Table of emissivity values, http:// www.ib.cnea.gov.ar/~experim2/Cosas/omega/emisivity.htm, January 2012. [21] Yutopian Online, Thermal and mechanical properties of teflon (polytetra fluoroethylene), http://www.yutopian.com/Yuan/prop/Teflon.html, January 2012. [22] Nor-Cal Products, General information and options, http://www.n-c. com, January 2012. [23] Svenska Vakuum Sällskapet, Grunderna i tillämpad vakuumteknik, Varian Associates Inc, 1988. [24] Chem Tech Service, Vacuum-chemtech service, inc, http://www. chemtechservicesinc.com/VacuumPumps/RV.html, January 2012. [25] Robert Siegel, Net radiation method for enclosure systems involving partially transparent walls, Tech. report, National Aeronautic and Space Administration, 1973. [26] Robert Siegel and John R. Howell, Thermal radiation heat transfer, 2nd edition, Hemisphere Publishing Corporation and McGraw-Hill Company, 1972. [27] SMC, Serial transmission system, http://content.smcetech.com/pdf/ EX500.pdf, January 2012. [28] Burkert Fluid Control Systems, We make ideas flow, http://www. burkert.dk, January 2012. [29] Alma E.F. Taylor, Illumination foundations, Lightning Research Center, 2000. 73 [30] The Engineering Toolbox, Thermal conductivity of some common materials and gases, http://www.engineeringtoolbox.com/ thermal-conductivity-d_429.html, January 2012. [31] Lowener Vacuumservice, Rotary vanes vacuum pumps, http://www. lowener.se, January 2012. [32] Watlow, Series sd user’s manual. pid controller and pid profiling controller, http://www.watlow.com/downloads/en/manuals/sd%20rev% 20f%205-31-06.pdf, April 2012. [33] Hugh D. Young, Roger A. Freedman, and A. Lewis Ford, University physics, with modern physics, 12th edition, Pearson Addison Wesley, 2008. 74 Appendices 75 Appendix 1 Preliminary Blueprints 76 77 78 79 Appendix 2 Numerically Estimated View and Radiative Exchange Factors 80 Radiative exchange factors calculated using ESATAN 0 0.0294112 0.0397684 0.0441979 0.0410085 0.0332932 0.0373093 0.0285738 0.0129998 0.0455851 0.0127263 0.0130434 0.0441791 0.0111149 0.0227864 0.0294112 0 0.0305100 0.0404986 0.0440696 0.0251011 0.0243453 0.0363525 0.0279055 0.0340585 0.00956564 0.0282350 0.0341894 0.00517629 0.0447836 0.0397684 0.0305100 0 0.0304024 0.0398705 0.0310212 0.0229652 0.0310393 0.0335700 0.0292370 0.00902340 0.0337847 0.0295965 0.00489070 0.0488923 0.0441979 0.0404986 0.0304024 0 0.0293459 0.0364081 0.0243626 0.0252009 0.0280829 0.0339340 0.00955483 0.0282624 0.0339153 0.00518743 0.0446537 0.0410085 0.0440696 0.0398705 0.0293459 0 0.0286401 0.0373946 0.0333286 0.0130418 0.0455122 0.0127232 0.0130663 0.0441844 0.0111259 0.0227125 0.0332932 0.0251011 0.0310212 0.0364081 0.0286401 0 0.0316470 0.0406673 0.00861343 0.0333907 0.0279290 0.00540756 0.0278654 0.0285510 0.0539741 0.0373093 0.0243453 0.0229652 0.0243626 0.0373946 0.0316470 0 0.0317193 0.00819254 0.0287872 0.0334911 0.00237283 0.0234997 0.0344129 0.0714470 0.0285738 0.0363525 0.0310393 0.0252009 0.0333286 0.0406673 0.0317193 0 0.00857227 0.0334242 0.0279527 0.00542343 0.0278984 0.0285466 0.0540973 0.0129998 0.0279055 0.0335700 0.0280829 0.0130418 0.00861343 0.00819254 0.00857227 0 0.00186191 0.000505308 0.00606708 0.00990547 0.000595624 0.00700904 0.0455851 0.0340585 0.0292370 0.0339340 0.0455122 0.0333907 0.0287872 0.0334242 0.00186191 0 0.00182915 0.0104595 0.0202908 0.00825913 0.00800050 0.0127263 0.00956564 0.00902340 0.00955483 0.0127232 0.0279290 0.0334911 0.0279527 0.000505308 0.00182915 0 0.00349326 0.00643704 0.00603923 0.00570808 0.0130434 0.0282350 0.0337847 0.0282624 0.0130663 0.00540756 0.00237283 0.00542343 0.00606708 0.0104595 0.00349326 0 0.00204839 0.000405614 0.0147172 0.0441791 0.0341894 0.0295965 0.0339153 0.0441844 0.0278654 0.0234997 0.0278984 0.00990547 0.0202908 0.00643704 0.00204839 0 0.00177514 0.0285106 0.0111149 0.00517629 0.00489070 0.00518743 0.0111259 0.0285510 0.0344129 0.0285466 0.000595624 0.00825913 0.00603923 0.000405614 0.00177514 0 0.0203389 81 View factors calculated using ESATAN 0 0.064811 0.095315 0.108042 0.100364 0.080776 0.091151 0.065091 0.076043 0.140634 0.074945 0.075618 0.136552 0.065142 0.045389 0.064811 0 0.064719 0.094961 0.108132 0.059341 0.057398 0.089227 0.175574 0.102533 0.053608 0.176033 0.101794 0.027995 0.101844 0.095315 0.064719 0 0.064416 0.094881 0.075182 0.054215 0.075411 0.213635 0.086605 0.049540 0.213297 0.086250 0.026446 0.113188 0.108042 0.094961 0.064416 0 0.064754 0.089057 0.057589 0.059637 0.175790 0.102699 0.053443 0.176031 0.101694 0.027803 0.101894 0.100364 0.108132 0.094881 0.064754 0 0.064831 0.091016 0.080626 0.076155 0.141248 0.074986 0.075946 0.137044 0.065029 0.045342 0.080776 0.059341 0.075182 0.089057 0.064831 0 0.064316 0.095223 0.047996 0.101588 0.176024 0.028404 0.083530 0.176260 0.124669 0.091151 0.057398 0.054215 0.057589 0.091016 0.064316 0 0.064906 0.045740 0.086542 0.212984 0.009474 0.069389 0.213036 0.168992 0.065091 0.089227 0.075411 0.059637 0.080626 0.095223 0.064906 0 0.047755 0.101861 0.175975 0.028503 0.083626 0.175743 0.124936 0.030545 0.070525 0.085813 0.070611 0.030590 0.019279 0.018373 0.019182 0 0 0 0.037528 0.029898 0.002361 0.013920 0.113175 0.082513 0.069695 0.082647 0.113669 0.081753 0.069644 0.081972 0 0 0 0.064186 0.061348 0.050372 0.011901 0.030104 0.021533 0.019899 0.021467 0.030120 0.070705 0.085572 0.070686 0 0 0 0.020950 0.018960 0.037710 0.010544 0.030374 0.070709 0.085677 0.070708 0.030506 0.011409 0.003805 0.011449 0.037528 0.032037 0.020950 0 0 0 0.031639 0.109891 0.081919 0.069410 0.081838 0.110286 0.067221 0.055840 0.067298 0.059899 0.061348 0.037985 0 0 0 0.060638 0.026166 0.011245 0.010623 0.011168 0.026121 0.070800 0.085572 0.070592 0.002361 0.025142 0.037710 0 0 0 0.044389 0.053900 0.120940 0.134411 0.120999 0.053843 0.148045 0.200678 0.148362 0.041153 0.017561 0.031170 0.093536 0.089478 0.131229 0 0.0227864 0.0447836 0.0488923 0.0446537 0.0227125 0.0539741 0.0714470 0.0540973 0.00700904 0.00800050 0.00570808 0.0147172 0.0285106 0.0203389 0 Appendix 3 Matrices Describing the Derived Nonlinear Dynamics 82 RC 10 −7 0.2359 −0.0167 −0.0226 −0.0251 −0.0233 −0.0189 −0.0212 −0.0162 −0.0074 −0.0258 −0.0072 −0.0074 −0.0251 −0.0063 −0.0129 −0.0167 0.2349 −0.0173 −0.0230 −0.0250 −0.0142 −0.0138 −0.0206 −0.0158 −0.0193 −0.0054 −0.0160 −0.0194 −0.0029 −0.0254 −0.0226 −0.0173 0.2351 −0.0172 −0.0226 −0.0176 −0.0130 −0.0176 −0.0190 −0.0166 −0.0051 −0.0192 −0.0168 −0.0028 −0.0277 −0.0251 −0.0230 −0.0172 0.2348 −0.0166 −0.0206 −0.0138 −0.0143 −0.0159 −0.0192 −0.0054 −0.0160 −0.0192 −0.0029 −0.0253 −0.0233 −0.0250 −0.0226 −0.0166 0.2359 −0.0162 −0.0212 −0.0189 −0.0074 −0.0258 −0.0072 −0.0074 −0.0251 −0.0063 −0.0129 −0.0189 −0.0142 −0.0176 −0.0206 −0.0162 0.2339 −0.0179 −0.0231 −0.0049 −0.0189 −0.0158 −0.0031 −0.0158 −0.0162 −0.0306 −0.0212 −0.0138 −0.0130 −0.0138 −0.0212 −0.0179 0.2336 −0.0180 −0.0046 −0.0163 −0.0190 −0.0013 −0.0133 −0.0195 −0.0405 −0.0162 −0.0206 −0.0176 −0.0143 −0.0189 −0.0231 −0.0180 0.2341 −0.0049 −0.0190 −0.0159 −0.0031 −0.0158 −0.0162 −0.0307 −0.0074 −0.0158 −0.0190 −0.0159 −0.0074 −0.0049 −0.0046 −0.0049 0.0947 −0.0011 −0.0003 −0.0034 −0.0056 −0.0003 −0.0040 −0.0258 −0.0193 −0.0166 −0.0192 −0.0258 −0.0189 −0.0163 −0.0190 −0.0011 0.1897 −0.0010 −0.0059 −0.0115 −0.0047 −0.0045 −0.0072 −0.0054 −0.0051 −0.0054 −0.0072 −0.0158 −0.0190 −0.0159 −0.0003 −0.0010 0.0947 −0.0020 −0.0037 −0.0034 −0.0032 −0.0074 −0.0160 −0.0192 −0.0160 −0.0074 −0.0031 −0.0013 −0.0031 −0.0034 −0.0059 −0.0020 0.0946 −0.0012 −0.0002 −0.0083 −0.0251 −0.0194 −0.0168 −0.0192 −0.0251 −0.0158 −0.0133 −0.0158 −0.0056 −0.0115 −0.0037 −0.0012 0.1896 −0.0010 −0.0162 −0.0063 −0.0029 −0.0028 −0.0029 −0.0063 −0.0162 −0.0195 −0.0162 −0.0003 −0.0047 −0.0034 −0.0002 −0.0010 0.0944 −0.0115 −0.0129 −0.0254 −0.0277 −0.0253 −0.0129 −0.0306 −0.0405 −0.0307 −0.0040 −0.0045 −0.0032 −0.0083 −0.0162 −0.0115 0.2538 83 RL 10 −9 diag ( 0.8383 0.8383 0.8383 0.8383 0.8383 0.8383 0.8383 0.8383 0.3370 0.6741 0.3370 0.3370 0.6741 0.3370 5.525 2.7626 5.987 0 M diag ( 5.978 5.978 5.978 5.978 5.978 5.978 5.978 5.978 2.763 5.525 2.763 2.763 ) ) CC 3.775 −1.681 0 0 0 0 0 −1.681 0 −0.207 0 0 −0.207 0 0 −1.681 3.838 −1.681 0 0 0 0 0 −0.238 0 0 −0.238 0 0 0 0 −1.681 3.922 −1.681 0 0 0 0 −0.280 0 0 −0.280 0 0 0 0 0 −1.681 3.838 −1.681 0 0 0 −0.238 0 0 −0.238 0 0 0 0 0 0 −1.681 3.775 −1.681 0 0 0 −0.207 0 0 −0.207 0 0 0 0 0 0 −1.681 3.838 −1.681 0 0 0 −0.238 0 0 −0.238 0 0 0 0 0 0 −1.681 3.922 −1.681 0 0 −0.280 0 0 −0.280 0 −1.681 0 0 0 0 0 −1.681 3.838 0 0 −0.238 0 0 −0.238 0 0 −0.238 −0.280 −0.238 0 0 0 0 2.109 −1.352 0 0 0 0 0 0 0 0 0 0 −0.238 −0.280 −0.238 0 −1.352 2.109 0 0 0 0 −0.207 0 0 0 −0.207 0 0 0 −1.352 3.119 −1.352 0 0 0 0 0 −0.238 −0.280 −0.238 0 0 0 0 0 0 0 2.109 −1.352 0 0 −0.207 0 0 0 −0.207 0 0 0 0 0 0 −1.352 3.119 −1.352 0 CL diag ( 0 0 0.1106 0 0 0 0 0 0 0 0 0 0 0 0 ) 84 Cspec diag ( 920 920 920 920 920 920 920 920 920 920 920 920 920 920 900 ) 0 0 0 0 0 −0.238 −0.280 −0.238 0 0 0 0 −1.352 2.109 0 0 0 0 0 0 0 0 0 0 0 0 0 0 0 0 Appendix 4 State Space Model 85 A 10 −3 −1.1333 0.3361 0.0413 0.0458 0.0425 0.0345 0.0387 0.3352 0.0292 0.0919 0.0286 0.0293 0.0903 0.0250 0.0241 0.3361 −1.1427 0.3372 0.0420 0.0457 0.0260 0.0253 0.0377 0.1563 0.0382 0.0215 0.1570 0.0384 0.0116 0.0474 0.0413 0.3372 −1.1785 0.3371 0.0414 0.0322 0.0238 0.0322 0.1856 0.0328 0.0203 0.1861 0.0332 0.0110 0.0518 0.0458 0.0420 0.3371 −1.1425 0.3360 0.0378 0.0253 0.0261 0.1567 0.0381 0.0214 0.1571 0.0381 0.0116 0.0473 0.0425 0.0457 0.0415 0.3360 −1.1333 0.3353 0.0388 0.0346 0.0293 0.0918 0.0286 0.0293 0.0903 0.0250 0.0241 0.0345 0.0260 0.0322 0.0378 0.3353 −1.1410 0.3384 0.0422 0.0193 0.0376 0.1564 0.0121 0.0313 0.1578 0.0572 0.0387 0.0253 0.0238 0.0253 0.0388 0.3384 −1.1557 0.3385 0.0184 0.0323 0.1854 0.0053 0.0264 0.1875 0.0757 0.3352 0.0377 0.0322 0.0261 0.0346 0.0422 0.3385 −1.1413 0.0192 0.0375 0.1564 0.0122 0.0313 0.1577 0.0573 0.0135 0.0722 0.0858 0.0724 0.0135 0.0089 0.0085 0.0089 −1.2177 0.2681 0.0011 0.0136 0.0111 0.0013 0.0074 0.0849 0.0353 0.0303 0.0352 0.0848 0.0346 0.0299 0.0347 0.5363 −1.0025 0.5362 0.0235 0.0228 0.0185 0.0085 0.0132 0.0099 0.0094 0.0099 0.0132 0.0723 0.0857 0.0723 0.0011 0.2681 −1.2178 0.0078 0.0072 0.0136 0.0060 0.0135 0.0726 0.0860 0.0726 0.0136 0.0056 0.0025 0.0056 0.0136 0.0117 0.0078 −1.2174 0.2683 0.0009 0.0156 0.0835 0.0355 0.0307 0.0352 0.0835 0.0289 0.0244 0.0289 0.0222 0.0228 0.0144 0.5367 −1.0021 0.5360 0.0302 0.0115 0.0055 0.0051 0.0054 0.0115 0.0729 0.0866 0.0729 0.0013 0.0093 0.0136 0.0009 0.2680 −1.2166 0.0215 0.0236 0.0464 0.0507 0.0463 0.0236 0.0560 0.0741 0.0561 0.0157 0.0090 0.0128 0.0330 0.0320 0.0457 −0.4740 86 B 10 −3 diag ( −0.1818 −0.1818 −0.1818 −0.1818 −0.1818 −0.1818 −0.1818 −0.1818 C I15×15 −0.3935 −0.1967 −0.3935 −0.3935 −0.1967 −0.3935 −0.1856 )