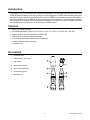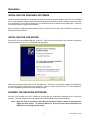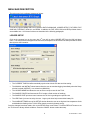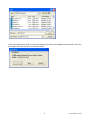
1
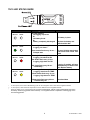
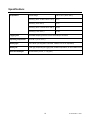
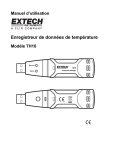
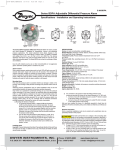
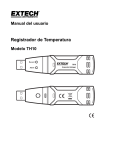
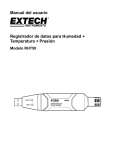
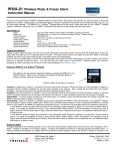
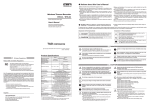
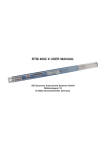
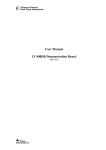
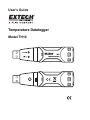
User's Guide Temperature Datalogger Model TH10 Introduction Congratulations on your purchase of the Temperature Datalogger. This datalogger measures and stores up to 32,000 temperature readings. The user can easily set up the logging rate, high/low alarm and start-mode, and download the stored data by plugging the module into a PC's USB port and running the supplied PC software. Temperature data can then be graphed, printed and exported to other applications. The data logger is supplied with a long-life lithium battery, which can typically allow logging for one year. This meter is shipped fully tested and calibrated and, with proper use, will provide years of reliable service Features Memory for 32,000 readings Selectable data sampling rate: 2s, 5s, 10s, 30s, 1m, 5m, 10m, 30m, 1hr, 2hr, 3hr, 6hr, 12hr, 24hr Status Indication via Red/Yellow LED and Green LED USB Interface for Set-up and Data Download User-Programmable Alarm Thresholds for Temperature Analysis software used to view graph Long battery life Description 1. Protective cover 2. USB connector to PC port 3. Start button 4. Temperature sensor 5. Alarm LED (red/yellow) 6. Record LED (green) 7. Mounting clip 2 TH10-EU-EN V1.1 6/09 Operation INSTALLING THE GRAPHING SOFTWARE Install the supplied Windows PC Datalogger Software by placing the supplied program disk in the PC’s CD-ROM drive. If the installation program does not automatically open and provide on-screen prompts, open and browse the CD-ROM drive, then find and double-click on the SETUP.EXE file included on the program disk. Follow the on-screen prompts to complete the installation. Before running the graphing software, please connect the TH10 to the PC and install the USB Driver software as described in the next section. INSTALLING THE USB DRIVER Plug the TH10 into an available USB port on the PC. If this is the first time that the TH10 has been connected to the particular port on the PC, the following screen will appear: Make sure the program disk is still in the PC CD-ROM drive. Select the ‘recommended’ installation and follow the on-screen prompts to complete the driver installation. If this is a repeat connection of the TH10 to the USB port, the driver installation process will be automatically skipped. RUNNING THE GRAPHING SOFTWARE With the TH10 inserted into the PC’s USB port, double-click the Temperature Datalogger icon to launch the program. The main software screen will appear with the MENU BAR icons described as below. Note: When the TH10 is connected to the USB port, the battery inside the device is discharged at a higher rate than normal. To conserve battery life, do not leave the TH10 connected to the USB port for a prolonged period of time 3 TH10-EU-EN V1.1 6/09 MENU BAR DESCRIPTION The main menu for the software appears as follows: From left to right the MENU BAR icons represent DATA DOWNLOAD, LOGGER SETUP, FILE OPEN, FILE SAVE-AS, FILE PRINT, VIEW ALL, and ZOOM. In addition, the FILE, VIEW, LINK, and HELP pull-down menus are available here. All of these functions are described in the following paragraphs. LOGGER SETUP Click on the computer icon on the menu bar (2nd from left) or select LOGGER SET from the LINK pull-down menu. The Setup window will appear as shown below; descriptions for each field in the Setup window are listed directly below the illustration: The CURRENT TIME field will automatically synchronize with the PC date and time setting. The MANUAL and INSTANT select buttons allow the user to start data logging immediately when the Setup window is exited (INSTANT), or at a later time (MANUAL). The LOGGER NAME field allows the user to select a unique name for the TH10. The SAMPLE POINTS field instructs the TH10 to take a fixed number of readings. The SAMPLE RATE pull-down menu instructs the TH10 to log readings at a specific rate. The LED Flash Cycle can be set by the user: longer cycle times help to extend the battery life. The ALARM SETTINGS area of the SETUP window allows the user to set high and low temperature limits and disable the flashing of the TH10’s LEDs, thereby conserving battery energy. Once the changes have been made, click on the SETUP button to save them. Press the DEFAULT button to set the TH10 back to factory default conditions. Press the CANCEL button to abort the setup. 4 TH10-EU-EN V1.1 6/09 Note: Any stored data will be permanently erased when the user clicks on Setup. To save the data before creating a new setup, click Cancel and then download the data. Note: The battery may run out before the TH10 has finished collecting a specified number of sample points. Always ensure that the remaining charge in the battery is sufficient to last the complete duration of your logging exercise. When in doubt, we recommend that you always install a fresh battery before logging critical data. If INSTANT was selected in the SETUP window, the TH10 begins logging at the instant the SETUP button is pressed. If MANUAL was selected, the TH10 must be manually started by pressing and holding the device’s yellow button for approx. 3 seconds, or until the two LEDs on the TH10 flash at the same time. Logging will continue at the programmed sample rate until the number of readings (sample points) specified in the Setup window is reached. The green LED flashes once per sample point and the red or yellow LED flashes when user programmed alarm limits are exceeded. For details, see LED status guide. DATA DOWNLOAD To transfer the readings stored in the TH10 to the PC: A. Connect the TH10 to the same USB port used when the TH10 was initialized. B. Open the graphing software program if it is not still running. C. Click the Download icon (1st on the left) or select Data Download from the LINK pull-down menu D. The Window shown below will appear. Press DOWNLOAD to begin transferring readings If the readings are successfully transferred, the VIEW screen and the SAVE screen (both shown below) will appear. In the SAVE screen, name the file and save it to a convenient location. The data is saved as an .rec file for use in this program only. At a later time, the user can select SAVE-AS and save the data as an Excel, Text, or Bitmap file (explained in next section). 5 TH10-EU-EN V1.1 6/09 In the screen below press VIEW to see the data graphically. If there are no readings currently stored in the TH10, the program will let the user know via a warning screen. 6 TH10-EU-EN V1.1 6/09 When VIEW is pressed, the Data Graph window appears The Data Graph window presents the transferred data in an x-y graph format with Date/Time represented on the horizontal axis and Alarm Limits represented on the vertical axis: To zoom in and out of data regions, there are several approaches: 1) Use the mouse to click and drag a box around any data area to magnify the selected area. 2) Click on the zoom magnifier icon tool on the menu bar 3) Select VIEW ALL or ZOOM OUT from the VIEW pull-down menu. In the example graph above, the Temperature is represented by the solid red line (the lines are known as ‘traces’). The low and high alarm values for temperature are represented by the dashed red trace. To customize the graph window select SHOW TRACES, BACKGROUND, GRID LINES, and MASK POINTS from the VIEW pull-down menu. These options provide the following features: SHOW TRACES: Allows the user to select which data to view as a trace (Temperature & Alarms). BACKGROUND: Select background color scheme. GRID LINES: Add or remove grid lines from x and y axes. MASK POINTS: Places dots on the traces for the actual data points, breaking up the continuous nature of a trace. 7 TH10-EU-EN V1.1 6/09 FILE OPEN, FILE SAVE-AS To save the transferred data in a format other than the proprietary .rec format, click the SAVE AS icon from the menu bar (4th from right) or select SAVE AS from the FILE pull-down menu. The data can be saved in the following formats: TEXT FILE (.txt) EXCEL FILE (.xls) BITMAP FILE (.bmp) To open an existing data file for viewing on the data graph window, click on the FILE OPEN icon on the menu bar (3rd from left), or select FILE OPEN from the FILE pull-down menu. When prompted, select a .rec file saved earlier. FILE PRINT To print a data graph window to a line or network printer, click on the printer icon or select PRINT from the FILE pull-down menu. Note that color graph windows can be accurately printed on color printers. Note : The TH10 retains data in its internal memory until the user begins a new logging session. Starting a new logging session clears all of the TH10’s stored readings; be sure to save previous data before starting a new logging session. 8 TH10-EU-EN V1.1 6/09 TH10 LED STATUS GUIDE LEDs Record Record Meaning Alarm Alarm Action No LEDs flashing -No logging in process Or -No battery found Or -Battery completely discharged Alarm Alarm To start, Hold the start button until Green and Yellow LED flash Red single flash every 10 sec. * -Logging, low alarm for RH Red double flash every 10 sec. -Logging, high alarm for RH Red single flash every 60 sec. - Low Battery † Record Replace the battery and download the data Green single flash every 10 sec. * -Logging, no alarm** Green double flash every 10 sec. * -Delayed start Record Fit battery in place Logging, if enabled, will stop automatically. No data will be lost. Replace battery Yellow single flash every 10 sec. * -Logging, low alarm for TEMP Yellow double flash every 10 sec. -Logging, high alarm for TEMP Yellow single flash every 60 sec. - TH10 memory full Download data * To save power, the TH10’s LED flashing cycle can be changed to 20s or 30s via the supplied software. ** To save power, alarm LEDs for temperature can be disabled via the supplied software. † When the battery is low, all operations will be disabled automatically. NOTE: Logging automatically stops when the battery weakens (logged data will be retained). The supplied software is required to restart logging and to download logged data. . 9 TH10-EU-EN V1.1 6/09 Specifications Temperature Overall Range -40 to 70oC (-40 to 158oF) Accuracy (-40 to -10 and +40 to +70oC) ±2oC Accuracy (-10 to +40oC) ±1oC Accuracy (-40 to +14 and 104 to 158oF) ±3.6oF Accuracy (+14 to 104oF) ±1.8oF Logging rate Selectable sampling interval: From 2 seconds up to 24 hours Operating temperature -35 to 80oC (-31 to 176oF) Battery type 3.6V Lithium (1/2 AA) (SAFT LS14250, Tadiran TL-5101 or equivalent) Battery life 1 year (typ.) depending on logging rate, ambient temperature, & use of Alarm LEDs Dimensions/Weight 101x25x23mm (4x1x.9”) / 172g (6oz) 10 TH10-EU-EN V1.1 6/09 Battery Replacement It is highly recommended that the battery be replaced every 12 months, or prior to logging critical data. The TH10 does not lose its stored readings when the battery weakens or when the battery is replaced; the data logging process will however be stopped and cannot be re-started until the battery has been replaced and the logged data has been downloaded to PC. Use only 3.6V lithium batteries. Before replacing the battery, remove the datalogger from the PC. Follow diagrammatic steps 1 through 4 below. NOTE: Leaving the RHT10 plugged into the PC USB port longer than necessary will cause some of the battery capacity to be lost. 1 4 2 3 You, as the end user, are legally bound (Battery ordinance) to return all used batteries and accumulators; disposal in the household garbage is prohibited! You can hand over your used batteries / accumulators at collection points in your community or wherever batteries / accumulators are sold! Disposal: Follow the valid legal stipulations in respect of the disposal of the device at the end of its lifecycle Copyright © 2007 Extech Instruments Corporation All rights reserved including the right of reproduction in whole or in part in any form. 11 TH10-EU-EN V1.1 6/09