Download F-750 User Manual - ICT International
Transcript
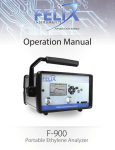
Operation Manual F-750 Produce Quality Meter Document Overview Introduction .................................................................................................................................................. 1 Features .................................................................................................................................................... 1 Specifications ............................................................................................................................................ 2 Unpacking the F-750 ..................................................................................................................................... 2 Operating Instructions .................................................................................................................................. 2 Basic Operation: ........................................................................................................................................ 2 Navigating Menus ..................................................................................................................................... 3 Select Model ......................................................................................................................................... 4 Browse Records..................................................................................................................................... 4 Setup Instrument .................................................................................................................................. 5 F-750 Data ..................................................................................................................................................... 6 How to Generate a Model ............................................................................................................................ 7 Partial Least Squares Basics .................................................................................................................... 11 B coefficient Regression .......................................................................................................................... 11 How to Collect Spectra and Reference Values............................................................................................ 12 Cleaning and Maintenance ......................................................................................................................... 13 Firmware Update Procedure .................................................................................................................. 13 Warnings ..................................................................................................................................................... 13 Supporting Science...................................................................................................................................... 14 F-750 Vocabulary Definitions ...................................................................................................................... 16 TECHNICAL SUPPORT .................................................................................................................................. 18 Customer Service .................................................................................................................................... 18 Frequently Asked Questions ....................................................................................................................... 19 FELIX INSTRUMENTS HARDWARE WARRANTY ........................................................................................... 20 F-750 PRODUCTION TEST CHECK SHEET ..................................................................................................... 21 F-750 Instruction Manual rev. 3/26/2014 Introduction The F-750 Handheld Brix & Dry Matter Meter uses Deep Near-Infrared Spectroscopy to estimate Dry Matter, Brix (Total Soluble Solids), and assess fruit maturity and skin color. It delivers the stability, repeatability, and precision that is necessary for successful chemometric-based measurements in a portable easy-to-use package. The F-750 aids agricultural suppliers in developing a fruit maturity and sweetness management process for the benefit of growers, processors, and consumers. Harvesting immature fruit has a high impact on fruit eating quality. Judging fruit maturity by shape and color alone results in varying success. The F-750 solves this issue with its simple user interface and precise measurements. It comes equipped with GPS for spatial mapping, enabling users to generate orchard-wide maps of fruit parameters, such as planning for harvest sequences and improving crop management techniques. “For quantitative analysis of complex samples, fast and inexpensive spectroscopic methods are preferable to the slow, expensive, and destructive "wet chemical" approach. Historically, one disadvantage of spectroscopic methods has been the difficulty of determining frequency regions where the constituent of interest selectively interacts with light. Now with the power of multivariate techniques such as Partial Least Squares, we can use the spectra (X) to predict the concentration of the constituent of interest (Y), with accuracy approaching that of wet chemistry.” Adapted from Sjostrom and Wold (1983) A multivariate calibration problem in analytical chemistry solved by partial least-square models in latent variables. Analytica Chimica Acta, (150) 61-70. Features Non-destructive measurement of fruit maturity and sweetness Link orchard temperature, and the effect of tree canopy management, with fruit quality GPS allows spatial mapping for monitoring fruit parameters in the field Lightweight Easy to use Stable, Repeatable, and Precise Transflective display enables easy viewing in varied light conditions 1554 NE 3rd Ave, Camas, WA 98607, USA [email protected] Phone (360) 833-8835 Fax (360) 833-1914 http://www.felixinstruments.com 1 F-750 Instruction Manual rev. 3/26/2014 Specifications F-750 Specifications Sensor Type Near Infra-Red Enhanced Spectrometer Wavelength Range 400-1050nm Spectral Sampling 3nm Spectral Resolution 8-13nm Typical RMSEP (root mean square +/- 0.5 Brix error of prediction) Battery Life 1600 samples PC Interface USB and SD card Data Modes Raw data, Absorbance, Second derivative Operating Modes Single prediction or running average Temperature Range 0-50OC Weight 2.43 kg Length x width x thickness 7.1 x 4.75 x 1.75 inches Theory of Operation: 1. 2. 3. 4. The sample is scanned A series of trait specific weighted coefficients to the spectrum are applied Coefficients are summed over the weighted spectra A predicted concentration is reported by the summation Unpacking the F-750 The F-750 will arrive with removable, rechargeable batteries, two battery chargers (one for the wall and a car charger), a white Teflon calibration disc, and a clip to attach the F-750 to a belt. There is a tripod mount located on the bottom of the F-750 Produce Quality Meter case. Operating Instructions The F-70 uses 18650 Li-ion 3.7V 3100mAh rechargeable batteries. The batteries must be removed from the F-750 to be charged. To remove the batteries, twist the battery compartment cap, located on the bottom of the case. The cap can be twisted with fingers or a screw-driver to tighten or loosen. Take care when removing batteries, as the cap is spring loaded. Both batteries should be inserted into the unit positive (+) side first (towards lens side). 1554 NE 3rd Ave, Camas, WA 98607, USA [email protected] Phone (360) 833-8835 Fax (360) 833-1914 http://www.felixinstruments.com 2 F-750 Instruction Manual rev. 3/26/2014 If the instrument locks-up or requires a hard shut-off for any other reason, hold down power button for 10 seconds. This will force the F-760 power to turn off. Then, the instrument can be restarted. To take a measurement, power on the F-750 Produce Quality Meter. The current model will be displayed. To change the model refer to the “Select Model” section on Page 3 of the manual. Hold the sample to the lens so that it makes contact with the perimeter of the bracket around the lens. Press the square/start button to record a new measurement. During the measurement the instrument will switch to the scan display and collect and process the data. As the measurement is being collected, large blocks will appear at the bottom of the display screen. Keep the sample in place as all blocks progress. The measurement is taking place during the 1st and 2nd block going across screen. The 3rd block is for processing data, the 4thblock is for saving measurements. At the 5thblock, the measurement is complete and displays the record to be reviewed. Once at the 3rd block or “processing” the sample can be removed from instrument. The data is stored to a removable SD card. To remove, press into the unit and the card will eject. To replace, insert metal side first with the label facing the back of the unit. A Glossary of Vocabulary Definitions is located at the end of this manual. Navigating Menus Use the power button to turn on the F-750. After the instrument powers on, the display will show the current model loaded on the unit and the battery life. Instructions at the bottom of the display indicate to press the square/start button to record a new measurement or press the right arrow to view the main menu. Apple DM and TSS battery life (%) Press (square/start) to record a new measurement Press right arrow to view the main menu Use the right arrow to get to the Main Menu. Once at the Main Menu, the left arrow can be used to go back or exit to the previous screen. The Main Menu consists of three options, select model, browse records, or setup instrument. 1554 NE 3rd Ave, Camas, WA 98607, USA [email protected] Phone (360) 833-8835 Fax (360) 833-1914 http://www.felixinstruments.com 3 F-750 Instruction Manual rev. 3/26/2014 Select Model There are three options available from the Select Model Menu: none, Apple DM and TSS, and Mango DM and Colour. Use the up/down arrows to highlight the desired selection. Once it is highlighted, the model is loaded. To make modifications to the model, press the right arrow when the model is highlighted to get to the sub-menu. Several parameters can be modified using the select model sub-menu, such as the integration time and scale coefficient 1 and scale coefficient 2. The Integration time menu allows the user to switch between auto integration time and manual integration time. When “disabled” appears next to auto-integration time, the integration time values can be set manually. Only when the auto-integration time is disabled are the options to adjust the integration time turning the lamp on and off will appear. Using the scale coefficient 1 and scale coefficient 2 menus, a new value to use for the scale coefficient can be entered. The scale coefficient is from the regression vector. Press the left arrow to get back to the sub-menu. If the left arrow is erasing characters on the display, keep pressing the left arrow to erase all the characters and then it will exit to the previous menu. Browse Records The data saved by the F-750 is referred to as a record. Each record has different parameters saved in it, depending on the model used when taking the measurement. For example, if using the mango model, the record will contain values for dry matter, color and chlorophyll. The apple model contains dry matter (DM) and total soluble sugars (TSS). Dry matter 1 of xx 300.5 Model: Chlorophyll: Colour: Press the right arrow to enter the File menu. The options from the file menu are view spectra, file details, rename record and delete record. From view spectra, three options are available: reflectance, absorbance and 2nd derivate absorbance. Select an option by highlighting it. The F-750 will render it and display a graph of the spectra. File details contains information about the file, such as the name and model. 1554 NE 3rd Ave, Camas, WA 98607, USA [email protected] Phone (360) 833-8835 Fax (360) 833-1914 http://www.felixinstruments.com 4 F-750 Instruction Manual rev. 3/26/2014 Rename record is used to change a file name. Press left to delete a character. Press up/down to change the character. Press right arrow but do not enter a character, then the right arrow again to save it. The delete record option can be used to inspect a record and delete it. Setup Instrument The Setup Instrument menu houses the features and parameters that are adjustable by the user. Options from the Setup Menu include: date & time, record prefix, training sets, GPS receiver, calibrate instrument, measurement accuracy, language and factory reset. Date & Time: The date & time menu adjusts the time stamp on the F-750. Record Prefix: At the record prefix menu, a new prefix can be entered or select a recently used prefix. To enter a new prefix, enter the value to use as a record prefix on the display. The select a recently used prefix option will generate a list of recently used prefixes. Use the up/down arrows to highlight the desired prefix. To be used. Training Sets: The training sets menu is where the model is developed. This menu is used when collecting spectra to use in the training set to populate the X and the scans to do the regression. The options are to create a new training set, delete a training set or modify an existing training set. Create New Training Set: At the create new training set menu, enter the name to use for this new training set. Next, enter the number of specimens that will be used to build this model. Once the number of specimens is entered, press right arrow to collect the training spectra. The instrument will indicate “Processing”. Do not press the square/start button to gather training set spectra. The square/start button only initiates a measurement. The specimen data can be viewed, and temperature (minimum, mid-range, and maximum) can be selected. At each temperature, there is a numbered list of specimens (example: 20). Select the specimen by using the up/down arrows. When Specimen 1 is highlighted, press the right arrow to collect data for the training set. The space next to Specimen one will change from (empty) to (timestamp). Repeat with each of the 20 specimens at each of the 3 temperatures. Specimens can be re-done if a mistake is made or the wrong specimen/temperature is selected. Delete Training Set: The delete training set menu is fairly simple. There is a prompt asking if you would like to permanently delete this record. Press the right arrow to confirm and delete the training set. Press the left arrow to abort. Modify Existing Training Set: The modify existing training set menu generates a list of training sets on instrument. Press the right arrow to get to “browse specimen data and delete training set” menu. 1554 NE 3rd Ave, Camas, WA 98607, USA [email protected] Phone (360) 833-8835 Fax (360) 833-1914 http://www.felixinstruments.com 5 F-750 Instruction Manual rev. 3/26/2014 GPS Receiver: The GPS receiver menu shows the state of the GPS sensor as enabled or disabled. If the GPS sensor is enabled, View Status will appear with the following parameters: latitude, longitude, satellites in view and if a satellite lock is acquired. Calibrate Instrument: If the Calibrate Instrument menu is selected, a warning will appear that calibration should only be performed by authorized users. Press right to continue. Press left to abort. Instruments should only be calibrated under direction of a Felix Instruments technician. The pixel coefficients are the spectrometer calibration values given by manufacturer (C0, C1, C2, C3). The pixel coefficients influence what wavelengths of light the spectrometer is responding too. These values are instrument specific. In the Calibrate Instrument menu, the scans to average allows the user to select the number of scans (measurements) that are average together before a value is shown on the display. The options are: 1, 2, 5, 10, 20, 40, 80, or 160. The integration time for the calibration-collect spectra can be set to the following: 50, 75, 100, 150, 250, 350, 450, or 500. The spectrometer zero offset can be set at: 0.3, .035, 0.4, 0.45, 0.5, 0.55, 0.6, or 0 .65. The lamp state option is used to turn the lamp on or lamp off. Press the down/up to turn off/on. The lamp automatic gain, which is used to fine-tune how much the logic has control of the gain, can be set to: 0.1, 0.2, 0.3, 0.4, 0.5, 0.7, 0.8, or 1.0. The shutter state works similar to the lamp state. The options are shutter closed or shutter open (press down/up to open/close shutter). The collect spectra option will use whatever values are set in calibration menu to collect spectra. After rendering, the results appear graphically on the display (y=0-100%, x=nm raw reflectance). Measurement Accuracy: The setup measurement accuracy option is used in conjunction with the white Teflon calibration standard. Place the white Teflon calibration standard over lens when the F-750 prompts to put on Teflon block. Next the display will read “storing dark measurements,” “storing reflectance measurements,” and finally show the standard deviation. Language: The language on the F-750 can be set to English or Portuguese. Factory Reset: The factory reset will erase the temporary cache files for the display screens and reset the defaults from manufacturer. F-750 Data Data collected by the F-750 can be reviewed on the instrument by using the “Browse Records” menu. The data is stored on the removable SD card. To remove, press into the unit and the card will eject. To replace, insert metal side first with the label facing the back of the unit. In order to view the files on a computer, an optional software, such as a command line tool or GUI (Graphical User Interface), is required. 1554 NE 3rd Ave, Camas, WA 98607, USA [email protected] Phone (360) 833-8835 Fax (360) 833-1914 http://www.felixinstruments.com 6 F-750 Instruction Manual rev. 3/26/2014 How to Generate a Model 1554 NE 3rd Ave, Camas, WA 98607, USA [email protected] Phone (360) 833-8835 Fax (360) 833-1914 http://www.felixinstruments.com 7 F-750 Instruction Manual rev. 3/26/2014 1. Connect the instrument to the computer and open the software. 2. Insert the SDcard to the computer. 3. Prompt user for the location of the calibration files. 4. Load Slov-Golay scans into the program. 5. Prompt user for the type of model (TSS, DM, TA, OTHER). 6. The application illustrates spectra quality (noise) and suggests the “useful region” to use when building the model. The user selects region(s) to include. 1554 NE 3rd Ave, Camas, WA 98607, USA [email protected] Phone (360) 833-8835 Fax (360) 833-1914 http://www.felixinstruments.com 8 F-750 Instruction Manual rev. 3/26/2014 7. The user manually enters known calibration values determine by reference method (i.e. TSS or DM). This is the Y population. 8. Program preforms PLS regression with Leave One out Cross Validation (k-1 cross validation). 9. Program determines if there are outliers and allows the user to label outliers. 10. If outliers exist, systematically remove each outlier and determine if the RMSE is decreased. 11. Test out how good the model is. For example, make a RMSE Bar Graph comparing the error with outlier removed (last bar on graph). 12. Continue testing how good the model is by comparing the Predicted Y and the Reference Y. For example, graph the Predicted Y on the Y-axis and the Reference Y on the x-axis. 1554 NE 3rd Ave, Camas, WA 98607, USA [email protected] Phone (360) 833-8835 Fax (360) 833-1914 http://www.felixinstruments.com 9 F-750 Instruction Manual rev. 3/26/2014 13. Graph the B coefficient or weighted regression coefficients. 14. Check the B coefficient for noise. If noise is present, identify and remove it. 15. Save the model to the file system on the F-750. 1554 NE 3rd Ave, Camas, WA 98607, USA [email protected] Phone (360) 833-8835 Fax (360) 833-1914 http://www.felixinstruments.com 10 F-750 Instruction Manual rev. 3/26/2014 Partial Least Squares Basics 1. Collect Spectra (X data or training set). 2. Determine your Reference Method and experimental error (Y data or calibration set). 3. Plot the Spectra and determine what preprocessing is required. 4. Select “useful” region. 5. Preform the Regression + Cross Validation. 6. Evaluate results. B coefficient Regression Perform the regression by calculating the series of coefficients , such as in this simplified equation. [Y]known=[B][X]known; [Y] [X]-1=[B]calibration [B] calibration[X]unknown= [Y]prediction [X] Absorption Spectra, [Y] Reference Data, [B] Regression Coefficients Property/Trait Total Soluble Sugar (TSS, Brix) Dry Matter Acid Concentration 1554 NE 3rd Ave, Camas, WA 98607, USA [email protected] Reference Method Refractometer Dehydrate and weigh Titration Phone (360) 833-8835 Fax (360) 833-1914 http://www.felixinstruments.com 11 F-750 Instruction Manual rev. 3/26/2014 How to Collect Spectra and Reference Values 1554 NE 3rd Ave, Camas, WA 98607, USA [email protected] Phone (360) 833-8835 Fax (360) 833-1914 http://www.felixinstruments.com 12 F-750 Instruction Manual rev. 3/26/2014 Cleaning and Maintenance Keep the lens of the F-750 clean and protected from dirt and scratches. If the lens is dirtied, unscrew the cover plate and gently wipe the lens in a smooth straight motion with rubbing alcohol and a clean nonabrasive cloth. Then, re-affix the cover plate. If the lens requires rinsing with water, ensure that the rubber bumper (that protects water from leaking into the USB and SDcard slot) is snuggly installed. The rubber bumper and the case of the F-50 can be wiped clean with a cloth. Firmware Update Procedure The firmware of the F-750 is updated by connecting the instrument to a computer using a USB cable and Running the Firmware Update tool. The firmware update tool is available online at http://www.felixinstruments.com/Software/F-750/FirmwareUpdateTool/. For questions concerning firmware updates, please contact [email protected]. Warnings Instrument will become warm with use, due to the lamp turning on. Do not drop F-750 batteries on hard surface, such as cement floor. Dropping the batteries in the 750 on a hard surface may cause them to crack the seal and rupture. The electrolyte in the battery will slowly leak out; the electrolyte is toxic and may cause burns. 1554 NE 3rd Ave, Camas, WA 98607, USA [email protected] Phone (360) 833-8835 Fax (360) 833-1914 http://www.felixinstruments.com 13 F-750 Instruction Manual rev. 3/26/2014 Supporting Science Cozzolino, D., Parker, M., Dambergs, R. G., Herderich, M. and Gishen, M. (2006), Chemometrics and visible-near infrared spectroscopic monitoring of red wine fermentation in a pilot scale. Biotechnol. Bioeng., 95: 1101–1107. Downey, G. 1996. Non-invasive and non-destructive percutanous analysis of farmed salmon flesh by near infra-red spectroscopy. Food Chem. 55:305–311. C. Greensill and K. Walsh, "Optimization of Instrumentation Precision and Wavelength Resolution for the Performance of NIR Calibrations of Sucrose in a Water-Cellulose Matrix," Appl. Spectrosc. 54, 426-430 (2000). Lee, M. H., Cavinato, A. G., Mayes, D. M., and Rasco, B. A. 1992. Noninvasive short-wavelength nearinfrared spectroscopic method to estimate the crude lipid content in the muscle of intact rainbow trout, J. Agric. Food Chem. 40:2178–2181. McGlone, V.A. (1998). Firmness, dry-matter and soluble-solids assessment of postharvest kiwifruit by NIR spectroscopy. Postharvest biology and technology (0925-5214), 13 (2), 131. A. Savitzky and M. Golay (1964) Smoothing and Differentiation of Data by Simplified Least Squares Procedures. Analytical Chemistry, 36(8) 1627–1639. M. Sjostrom and S. Wold (1983) A multivariate calibration problem in analytical chemistry solved by partial least-square models in latent variables. Analytica Chimica Acta, (150) 61-70. P. Subedi (2007) Prediction of mango eating quality at harvest using short-wave near infrared spectrometry. Postharvest biology and technology, 43 (3), 326. P. Subedi, K. Walsh (2011) Assessment of sugar and starch in intact banana and mango fruit by SWNIR spectroscopy. Postharvest Biology and Technology P. Subedi and K. Walsh. (2009) Technologies for assessing fruit quantity and quality: maturity, pigmentation, dry matter content, firmness. Mango Encylopaedia, 2(10): 1-39. P. Subedi, K. Walsh, and D. Hopkins (2012) Assessment of titratable acidity in fruit using short wave near infrared spectroscopy. Part A: establishing a detection limit based on model solutions. Near Infrared Spectrosc., (20) 449-457. P. Subedi , K. Walsh, and D. Hopkins (2012) Assessment of titratable acidity in fruit using short wave near infrared spectroscopy. Part B: intact fruit studies. Near Infrared Spectrosc., (20) 459-463. P. Subedi, K. Walsh, G. Owens (2007) Prediction of mango eating quality at harvest using short-wave near infrared spectrometry. Postharvest Biology and Technology, 43: 326–334. 1554 NE 3rd Ave, Camas, WA 98607, USA [email protected] Phone (360) 833-8835 Fax (360) 833-1914 http://www.felixinstruments.com 14 F-750 Instruction Manual rev. 3/26/2014 P. Subedi, K. Walsh, and P. Purdy. (2010) Determination of Optimum Maturity Stages of Mangoes Using Fruit Spectral Signatures, China Int Mango Conf 1-12. K. Walsh, J. Guthrie and J. Burney. (2000) Aust. J Application of commercially available, low-cost, miniaturized NIR spectrometers to the assessment of the sugar content of intact fruit. Plant Physiol, 27: 1175-1186. K. Walsh, R. Long and S. Middelton (2007) Use of near infra-red spectroscopy in evaluation of sourcesink manipulation to increase the soluble sugar content of stonefruit. Journal of Horticultural Science & Biotechnology, (82:2) 316–322. Wold, J. P. and Isaksoon, T. (1997), Non-Destructive Determination of Fat and Moisture in Whole Atlantic Salmon by Near-Infrared Diffuse Spectroscopy. Journal of Food Science, 62: 734–736. 1554 NE 3rd Ave, Camas, WA 98607, USA [email protected] Phone (360) 833-8835 Fax (360) 833-1914 http://www.felixinstruments.com 15 F-750 Instruction Manual rev. 3/26/2014 F-750 Vocabulary Definitions Factor/Principle Component: a vector that describes the information in the spectra (pixel count/intensity gradient). The set of factors used to build regression coefficients must describe all the selected spectra in the training set. Feature/Spectra Selection Window: where you select the region of wavelength to use for the PLS regression. K-1 Cross Validation or Leave One out Cross Validation: the iterative method used to determine how good the mathematical model generated by PLS is. This is done by measuring how well the mathematical model can predict the samples used to make its self. Mahalanobis Distance: the perpendicular distance from a sample to an axis on a scores plot (traditional visualization method). This measure can be used to detect outliers and is typically applied with spectroscopy and biological applications. It can be normalized for mathematical models with more than 2 principle components. Model Set: the term used to describe the model file used by the 750. This file can consist of multiple mathematical PLS models (i.e. Dry Matter, Total Soluble Solids, etc.) and/or traditional index band (wavelength ratios) and/or the differential absorbance of chlorophyll. This will make up a set of properties that will be predicted and displayed after a model file is loaded on the F-750. NIPALS (Non-linear Iterative Partial Least Squares): iterative computer implementation of PLS. Outlier: a member of the training set that is not consistent with the others and thus introduces a large error. For example, if building a model for predicting when to harvest apples from the orchard, the training set should consists of samples taken prior to and at the time of harvest. If a rotten or usually over-ripe apple was included in the sample, it would not be representative of the goal of the model and introduce error as it would be inconsistent with the samples. Partial Least Squares (PLS): mathematical method used by the F-750 to generate a mathematical model of regression coefficients. PLS1 only predicts a single trait with a single regression vector. PLS2 can be used to predict multiple traits with a single regression vector. The F-750 will do PLS1 multiple times to predict multiple traits. Reference Method: determines the known concentrations or value of constituent (i.e. trait, quality, or property of interest). This could be the use of a refractometer for total soluble sugar or a scale to determine dry matter content. Regression Coefficients: a series of weighted values generated by PLS. When these are applied to a scan of an unknown sample, a prediction of concentration is made. These values are the core of the mathematical model. PLS takes multiple scans and combines it with known values to generate a 1554 NE 3rd Ave, Camas, WA 98607, USA [email protected] Phone (360) 833-8835 Fax (360) 833-1914 http://www.felixinstruments.com 16 F-750 Instruction Manual rev. 3/26/2014 regression vector specific to a single property (such as dry matter). By taking the dot product of the regression vector and a scan of an unknown sample, a concentration can be determined. These are stored in a single row wise vector, there is 1 element in the vector for every pixel used the regression. Root Mean Squared Error (RMSE): the percent error of the model. For example, a dry matter, model with a RMSE of 0.0123 has an error of 1.23%DM or a 1.23% prediction error. An acceptable amount of error is determined by the type of property being predicted and the user application. Savitzky–Golay: a mathematical tool used to smooth spectra and to generate first or second derivatives. This is useful as it removes noise and the derivative removes baseline offset error. Refer to Savitzky and Golay (1964) for more information. Training set: the set of all of scans and known values that will be used for the PLS regression. X population: all of the spectra stored in a row rise matrix. Y population: the known values determined by a reference method stored in a single column vector. 1554 NE 3rd Ave, Camas, WA 98607, USA [email protected] Phone (360) 833-8835 Fax (360) 833-1914 http://www.felixinstruments.com 17 F-750 Instruction Manual rev. 3/26/2014 TECHNICAL SUPPORT If you have a question about the F-750, first look in the F-750 Instruction Manual. There is also online support available for the F-750 through our parent company at http://felixinstruments.com/support. If you cannot find the answer, you can contact a Technical Support Representative located in your country. Felix Instruments is committed to provide customers with high quality, timely technical support. Technical support representatives are to answer your technical questions by phone or by e-mail at [email protected]. Felix Instruments’ contact information: Felix Instruments 1554 NE 3rd Ave Camas, WA 98607 USA Phone: 800-767-0119 (U.S. and Canada) 360-833-8835 Fax: 360-833-1914 Internet: http://www.felixinstruments.com E-mail: [email protected] Customer Service Customer Service Representatives answer questions about specifications and pricing, and sell all of the Felix Instruments products. Customers sometimes find that they need Felix Instruments to upgrade, recalibrate or repair their system. In order for Felix Instruments to offer these services, the customer must first contact us and obtain a Return Merchandise Authorization (RMA) number. Please contact a customer service representative for specific instructions when returning a product. 1554 NE 3rd Ave, Camas, WA 98607, USA [email protected] Phone (360) 833-8835 Fax (360) 833-1914 http://www.felixinstruments.com 18 F-750 Instruction Manual rev. 3/26/2014 Frequently Asked Questions 1. What can the F-50 Produce Quality Meter measure? a. The F-750 Produce Quality Meter can be used to predict the concentration of dry matter and total soluble solids. It can categorize trait groups and is ideal for total trait quantification. The F-750 can also be applied to chlorophyll concentration, lipid content in fish, dry matter of cheese, titratable acids quantification, as well as many other characteristics. 2. How do I recharge the batteries of the F-750? a. To recharge the batteries, twist to remove the battery compartment cap (located on the bottom of the F-750). Next, remove the batteries from the F-750 to place them in the battery charger. Charged batteries should be inserted into the F-750 positive (+) side first. 3. Does the F-750 perform interactance or measurements? a. Yes, the F-750 performs interactance measurements within a wavelength region of 3101100nm. Data typically collected by measuring reflectance with other methods is achievable with the F-750 through measurements of interactance in most cases. 1554 NE 3rd Ave, Camas, WA 98607, USA [email protected] Phone (360) 833-8835 Fax (360) 833-1914 http://www.felixinstruments.com 19 F-750 Instruction Manual rev. 3/26/2014 FELIX INSTRUMENTS HARDWARE WARRANTY Important: Please Read! Seller’s Warranty and Liability: Seller warrants new equipment of its own manufacturing against defective workmanship and materials for a period of one year, of a single shift operation, from date of receipt of equipment - the results of ordinary wear and tear, neglect, misuse, accident and excessive deterioration due to corrosion from any cause is not to be considered a defect. Any defect must be called to the attention of Felix Instruments, Camas, Washington, USA, in writing, within 90 days after receipt of the unit. Seller’s liability for defective parts is limited to the repair or replacement of any part of the instrument without charge, if Felix Instruments’ examination discloses that part to have been defective in material or workmanship, and in no event shall exceed the furnishing of replacement parts F.O.B. the factory where originally manufactured. No equipment may be repaired or altered by anyone not authorized by Felix Instruments. Material and equipment covered hereby, which is not manufactured by Seller, is to be covered only by the warranty of its manufacturer. Seller shall not be liable to the Buyer for loss, damage, or injury to persons (including death), or to property or things, whatsoever, including, but without limitation, products processed by the use of the equipment; or for damages of any kind or nature (including, but without limitation, loss of anticipated profits), occasioned by or arising out of installation, operation, use, misuse, nonuse, repair, or replacement of said material and equipment, or out of the use of any method or process for which the same may be employed. The purchaser is to pack, ship, or deliver the instrument to Felix Instruments, in Camas, Washington, USA, within 30 days after Felix Instruments has received written notice of the defect at the customer’s expense. No other arrangements may be made unless otherwise approved in writing by Felix Instruments. The use of this equipment constitutes Buyer’s acceptance of the terms set forth in this warranty. There are no understandings, representations, or warranties of any kind, express, implied, statutory, or otherwise (including, but without limitation, the implied warranties of merchantability and fitness for a particular purpose), not expressly set forth herein. 1554 NE 3rd Ave, Camas, WA 98607, USA [email protected] Phone (360) 833-8835 Fax (360) 833-1914 http://www.felixinstruments.com 20 F-750 Instruction Manual rev. 3/26/2014 F-750 PRODUCTION TEST CHECK SHEET 1554 NE 3rd Ave, Camas, WA 98607, USA [email protected] Phone (360) 833-8835 Fax (360) 833-1914 http://www.felixinstruments.com 21







![[4910-13-U] DEPARTMENT OF TRANSPORTATION Federal](http://vs1.manualzilla.com/store/data/005730800_1-83b69f38eee92750e4a30066087ffbc6-150x150.png)
