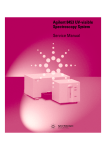
Download 8453 UV-visible system
Transcript
Agilent 8453 UV-visible Spectroscopy System Operator’s Manual s1 Copyright Agilent Technologies 2002 All rights reserved. Reproduction, adaption, or translation without prior written permission is prohibited, except as allowed under the copyright laws. Part No. G1115-90019 Edition 04/02 Printed in Germany This handbook is for A.09.xx revisions of the Agilent ChemStation software, where xx is a number from 00 through 99 and refers to minor revisions of the software that do not affect the technical accuracy of this handbook. Warranty The information contained in this document is subject to change without notice. Agilent Technologies makes no warranty of any kind with regard to this material, including, but not limited to, the implied warranties or merchantability and fitness for a particular purpose. Agilent Technologies shall not be liable for errors contained herein or for incidental or consequential damages in connection with the furnishing, performance, or use of this material. Agilent Technologies Deutschland GmbH Hewlett-Packard-Strasse 8 76337 Waldbronn Germany Agilent 8453 UV-visible Spectroscopy System Operator’s Manual In This Book To be able to use your new Agilent 8453 UV-visible spectroscopy system quickly, this book gives you step-wise procedures and examples for basic operations and tasks. This book shall not replace the detailed manuals available for installation: Installing Your UV-visible Spectroscopy System and operation of your software Understanding Your UV-visible Spectroscopy System nor your Agilent 8453 Service Manual. In Chapter 1 “Introduction to Your System” you will find an introduction to your Agilent 8453 spectrophotmeter and the concept of your Agilent ChemStation software. In Chapter 2 “Installation and Start Up” you will find a summary of system installation and start-up of a measurement session. Good measurement practices are discussed in Chapter 3 “Good Measurement Practices”. Stepwise examples for basic measurements and related tasks are given in Chapter 4 “Using your Agilent 8453 UV-visible Spectroscopy System”. 4 Contents 1 Introduction to Your System Concepts behind your Agilent 8453 UV-visible spectroscopy system and its components 7 Agilent 8453 Spectrophotometer — Overview Optical System Overview 11 Spectrophotometer Description 14 10 General Purpose Agilent ChemStation Software for UVvisible Spectroscopy — Overview 18 User Interface Elements 19 Software Structure 23 Standard Mode Tasks 25 Standard Mode Data Processing 28 2 Installation and Start Up Summary of installation and startup of your system 35 Installation Summary for Your Agilent 8453 General Purpose UVvisible System 37 Starting a Measurement Session 39 3 Good Measurement Practices General operating conditions of the spectrophotometer 41 General Considerations 43 Inserting a Cell 53 5 Contents 4 Using your Agilent 8453 UV-visible Spectroscopy System A few examples to demonstrate how typical standard applications can be performed 55 Starting Your First Measurement Session 57 Starting Your UV-visible Software 59 Measuring Caffeine Absorbance at 273 nm 60 Saving Your Parameters as a Method 63 Retrieving and Printing a Method 65 Saving and Retrieving Data 68 Print Preview of Reports 73 Finding the Caffeine Absorbance Maximum 76 Entering your Cell’s Path Length 80 Controlling your Sipper System 81 Using your Multicell Transport 83 Quantitative Analysis using a Calibration with Standards 85 How Can I Be Sure That My Agilent 8453 Works Properly? 92 How Can I Get a Deeper Understanding of UV-visible Spectroscopy? 95 When Do I Have to Measure a Blank? 97 6 1 1 Introduction to Your System Concepts behind your Agilent 8453 UV-visible spectroscopy system and its components Introduction to Your System Operation of the system is much easier if you understand the implementation models. The mind-models of data acquisition, data evaluation and data handling will help you to run the system successfully. Your spectroscopy system is based on an Agilent 8453 spectrophotometer and general purpose Agilent ChemStation software for UV-visible spectroscopy running on a PC with Microsoft NT operating system. These two components are linked together by a network connection. This type of link is very flexible: it can be used for a direct connection between the spectrophotometer and the PC as well as the integration in a enterprise network with network access from the PC to the spectrophotometer. The tasks are split between these devices such that the spectrophotometer acquires and provides absorbance data which are handled by the PC’s application software. All of the data display, evaluation and longterm storage is done under software control on the PC. This chapter has two sections: • “Agilent 8453 Spectrophotometer — Overview” on page 10, • “General Purpose Agilent ChemStation Software for UV-visible Spectroscopy — Overview” on page 18. 8 Introduction to Your System 9 Agilent 8453 Spectrophotometer — Overview This section gives an overview of the optical system and explains the spectrophotometer front and back panels. It also explains the layout and construction of the spectrophotometer including the electronic and mechanical assemblies inside the spectrophotometer. This overview contains: • “Optical System Overview” on page 11 • “Spectrophotometer Description” on page 14 10 Introduction to Your System Optical System Overview Optical System Overview Optical System The optical system of the spectrophotometer is shown in Figure 1. Its radiation source is a combination of a deuterium-discharge lamp for the ultraviolet (UV) wavelength range and a tungsten lamp for the visible and short wave near-infrared (SWNIR) wavelength range. The image of the filament of the tungsten lamp is focused on the discharge aperture of the deuterium lamp by means of a special rear-access lamp design which allows both light sources to be optically combined and share a common axis to the source lens. The source lens forms a single, collimated beam of light. The beam passes through the shutter/stray-light correction filter area then through the sample to the spectrograph lens and slit. In the spectrograph light is dispersed onto the diode array by a holographic grating. This allows simultaneous access to all wavelength information. The result is a fundamental increase in the rate at which spectra can be acquired. Figure 1 Optical System of Spectrophotometer Shutter/stray light filter Cuvette Tungsten lamp Source lens Slit Deuterium lamp Grating Source lens Photo diode array Lamps The light source for the UV wavelength range is a deuterium lamp with a shine-through aperture. As a result of plasma discharge in a low pressure deuterium gas, the lamp emits light over the 190 nm to approximately 800 nm wavelength range. The light source for the visible and SWNIR wavelength range is a low-noise tungsten lamp. This lamp emits light over the 370 nm to 1100 nm wavelength range. 11 Introduction to Your System Optical System Overview Lamps The light source for the UV wavelength range is a deuterium lamp with a shine-through aperture. As a result of plasma discharge in a low pressure deuterium gas, the lamp emits light over the 190 nm to approximately 800 nm wavelength range. The light source for the visible and SWNIR wavelength range is a low-noise tungsten lamp. This lamp emits light over the 370 nm to 1100 nm wavelength range. Source Lens The source lens receives the light from both lamps and collimates it. The collimated beam passes through the sample (if one is present) in the sample compartment. Shutter The shutter is electromechanically actuated. It opens and allows light to pass through the sample for measurements. Between sample measurements it closes to limit exposure of sample to light. If the measurement rate is very fast, you can command the shutter to remain open (Agilent ChemStation software) or it stays open automatically (handheld controller software). Stray-Light Correction Filter In a standard measurement sequence, reference or sample intensity spectra are measured without and then with the stray-light filter in the light beam. Without the filter the intensity spectrum over the whole wavelength range from 190–1100 nm is measured. The stray-light filter is a blocking filter with 50 % blocking at 420 nm. With this filter in place any light measured below 400 nm is stray light. This stray-light intensity is then subtracted from the first spectrum to give a stray-light corrected spectrum. Depending on the software, you can switch off the stray light correction (Agilent ChemStation software) in case you want to do very fast repetitive scans or it is switched off automatically (handheld controller software). Sample Compartment The spectrophotometer has an open sample compartment for easier access to sample cells. Because of the optical design a cover for the sample area is not required. The spectrophotometer is supplied with a single-cell holder already installed in the sample compartment. This can be replaced with the Peltier temperature control accessory, the thermostattable cell holder, the adjustable cell holder, the long path cell holder or the multicell transport. All of these optional cell holders mount in the sample compartment using the 12 Introduction to Your System Optical System Overview same quick, simple mounting system. An optical filter wheel is also available for use with the spectrophotometer and most of the accessories. Spectrograph The spectrograph housing material is ceramic to reduce thermal effects to a minimum. It main components of the spectrograph are the lens, the slit, the grating and the photo diode array with front-end electronics. The mean sampling interval of the diode array is 0.9 nm over the wavelength range 190 nm to 1100 nm. The nominal spectral slit width is 1 nm. Spectrograph Lens The spectrograph lens is the first of the parts which are collectively known as the spectrograph. It is mounted on the housing of the spectrograph. The spectrograph lens refocuses the collimated light beam after it has passed through the sample. Slit The slit is a narrow aperture in a plate located at the focus of the spectrograph lens. It is exactly the size of one of the photo diodes in the photo diode array. By limiting the size of the incoming light beam, the slit makes sure that each band of wavelengths is projected onto only the appropriate photoed. Grating The combination of dispersion and spectral imaging is accomplished by using a concave holographic grating. The grating disperses the light onto the diode array at an angle proportional to the wavelength. Diode Array The photoed array is the heart of the spectrograph. It is a series of 1024 individual photocopies and control circuits etched onto a semiconductor chip. With a wavelength range from 190 nm to 1100 nm the sampling interval is nominal 0.9 nm. 13 Introduction to Your System Spectrophotometer Description Spectrophotometer Description Your spectrophotometer is very easy to use. It has a line power indicator, a status indicator and some push buttons. All electrical connections are made at the rear of the spectrophotometer. Front View The front view of the spectrophotometer is shown in Figure 2. Notice that the sample compartment is open. Unlike conventional spectrophotometers the Agilent 8453 does not suffer from ambient stray light. The open sample area makes it easier to access for cuvette handling and to connect tubing to a flow cell or thermostattable cell holder. The spectrophotometer is shipped with the standard single-cell holder. Standard and accessory cell holders can be removed and replaced in seconds with few or no tools. Figure 2 Front View of Spectrophotometer Indicato Pushbuttons Line power switch with green light The line power switch is located at the lower-left part of the spectrophotometer. Pressing it in turns on the spectrophotometer. It stays pressed in and shows a green light when the spectrophotometer is turned on. 14 Introduction to Your System Spectrophotometer Description When the line power switch stands out and the green light is off, the spectrophotometer is turned off. On the front panel of the spectrophotometer is a status indicator which will display different colors depending of the actual condition of the spectrophotometer. • Green—the spectrophotometer is ready to measure. • Green, blinking—the spectrophotometer is measuring. • Yellow—the spectrophotometer is in not-ready state, for example, turning one of the lamps on or if both lamps are switched off. • Red—error condition, that is, the spectrophotometer does not pass one of the self-tests which are run when the spectrophotometer is turned on or an error occurred during operation. In this case the UV-visible operating software gives a detailed error message and possible explanations are in the online help system and in your Service Manual Chapter 3 “Diagnostics and Troubleshooting”. • Red, blinking—error condition of the spectrophotometer processor system. Because in this case there is no communication with the computer there will be no error message. The online help system and your Service Manual Chapter 3 “Diagnostics and Troubleshooting” give more information about troubleshooting. The four measure push buttons on the front panel cause the following actions to be performed and the resulting data being sent to the computer. • BLANK—the spectrophotometer takes a blank measurement. This comprises a reference measurement that is used in all subsequent sample measurements until a new blank measurement is taken. Following the reference measurement the baseline spectrum is measured and displayed on the PC. • SAMPLE—the spectrophotometer takes a sample measurement or starts a series of measurements. This depends on the parameters set in your software. • STANDARD—the spectrophotometer takes a measurement of a standard. Additional information such as concentration and so on, have to be entered in the operating software. • STOP—the spectrophotometer and/or software aborts any ongoing activity and returns to a to ready state. 15 Introduction to Your System Spectrophotometer Description Rear View All connections are made at the rear of the spectrophotometer, see Figure 3. Figure 3 Rear View of Spectrophotometer GPIB connector and switches Remote connector MIO slot for LAN interface Multicell transport connector GP-IO connector Line connector RS 232 connector Two CAN connectors • The multicell connector allows you to connect the cable which comes from the multicell transport. • The GPIO (general-purpose input/output) connector allow you to control a sipper and autosampler or other accessories depending on the software you are using. • The remote connector may be used in combination with other analytical spectrophotometers from Agilent Technologies if you want to use features such as common shut down and so on. • The RS232C connector may be used to control the spectrophotometer from a computer through RS232 connection, using appropriate software (for future use). This connector needs to be defined by the configuration switch module next to the GPIB connector. The software needs the appropriate drivers to support this communication which is intended for future use. The RS232C port is used as printer interface to connect the printer, using a serial/parallel cable, of the Agilent 8453E UV-visible spectroscopy system. 16 Introduction to Your System Spectrophotometer Description • The right CAN bus is used to connect the handheld controller of the Agilent 8453E UV-visible spectroscopy system to the spectrophotometer. • The GPIB connector is used to connect the spectrophotometer with a computer. The 8-bit configuration switch module next to the GPIB connector determines the GPIB address of your spectrophotometer. The switches are preset to a default address recognized by the operating software from Agilent. The GPIB port is not used when the handheld controller of the Agilent 8453E UV-visible spectroscopy system is connected to the spectrophotometer. However, the 8-bit configuration switch of the port must be set for GPIB communication. • The MIO board slot is reserved for a LAN interface board. • The accessory board slot is reserved for future use. • The power input socket does not have a voltage selector because the power supply has wide-ranging capability, for more information see your Service Manual Chapter 1 “Specifications”. There are no externally accessible fuses, because automatic electronic fuses are implemented in the power supply. The security lever at the power input socket prevents that the spectrophotometer cover is taken off when line power is still connected. Side of the Spectrophotometer On the right side of the spectrophotometer there is a door for exchanging the lamps. Behind this plastic door there is another sheet-metal door. Two independent safety light switches are implemented. They automatically turn off the lamps when the sheet metal door is opened. 17 General Purpose Agilent ChemStation Software for UV-visible Spectroscopy — Overview This section gives an overview of the elements of the user interface implemented with your Agilent ChemStation software and the data analysis concept behind. It explains how data are processed and what the advantages of this processing are on a practical point of view. This overview contains: • “User Interface Elements” on page 19 • “Software Structure” on page 23 • “Standard Mode Tasks” on page 25 • “Standard Mode Data Processing” on page 28 18 Introduction to Your System User Interface Elements User Interface Elements Basic elements Your general purpose Agilent ChemStation software for UV-visible spectroscopy facilitates operation of your diode-array-based UV-visible spectrophotometer in daily routine operation. The focus of this software is on ease-of-use and ease-of-learning. A graphical user interface visualizes the spectrophotometer operation and usage. This user interface consists of a number of elements as described in the following sections. Mode switch Method name Menu bar Tool bar Analysis panel Instrument panel Tabular results Spectra 19 Introduction to Your System User Interface Elements Menu The more traditional menu interface at the top of the Agilent ChemStation window allows to control all operations.When you choose an item from the menu bar a list of commands and submenus is displayed. An operation is performed by choosing a command (mouse click or ENTER key). Toolbar The tool bar below the menu bar shows buttons with symbols, icons, which allow direct access to basic operations such as printing result reports, loading methods, and saving methods and data. Side Panels The panels on the left side are the analysis panel and instrument panel. The size and position of these panels are fixed but are a function of your display’s resolution. The minimum resolution is 600 × 800 pixels. Analysis Panel The analysis panel gives you a graphical visualization of the current context in which you are working. In addition it provides access to the setup dialog of your actual task by means of the Setup button. Instrument Panel The instrument panel is below the analysis panel. It visualizes and controls your sampling devices and spectrophotometer. Part of the graphical elements 20 Introduction to Your System User Interface Elements on this panel are active items, for example, to switch lamps on or off, or run a peristaltic pump. You can recognize the active areas by a pointer change when you move the mouse across the area. A mouse click in such an active position brings up a small menu with selections, or simply performs an operation. In addition you can select a sampling system from the list of available systems. Its parameters can be adjusted by means of the Setup button. 21 Introduction to Your System User Interface Elements View The area on the right side of the side panels offers you a view on a certain aspect of your current task. A view consists of one or more separate windows. These windows provide information in mainly a graphical or a tabular representation. You may see a graph showing your measured sample spectra and a table with the calculated results. Views are usually handled automatically by the operation you performed, but you may also use the view menu’s commands to select the view you are interested in. 22 Introduction to Your System Software Structure Software Structure To reduce complexity of operation the software is divided into specific applications, called modes. In addition levels of operation are available and support for data evaluation sessions without spectrophotometer control. Agilent ChemStation Sessions Your Agilent ChemStation is part of Agilent’s ChemStation family of instrument control software. An installation of Agilent ChemStation software can control up to four different instruments such as UV, GC, LC or CE based on a single PC. Each of these instruments has its own session. If you start a session, its name is indicated in the main application’s window title bar, for example, Agilent 845x UV-visible System[1]. Each instrument session is available for data analysis only and for instrument control. An instrument control session has the appendix (Online) and can be only started as a single instance on your PC. But multiple data analysis sessions, which have the appendix (Offline), can be launched. The offline sessions allow recalculations based on stored data and are useful in the development process of an analytical method. Operation Levels The operation levels manager level and operator level apply to all modes and allow managing an application and running an application only. In the managing level of an application usually a method is developed and stored permanently to disk. The manager level of operation is password protected. This assures the integrity of predefined methods and operation sequences. 23 Introduction to Your System Software Structure In the operator level only a reduced set of functions is available. Especially functions which may affect the integrity of an analytical procedure are not available. But on the other hand, an operator may use their own settings. This gets flagged on the tool bar and is be indicated on printed reports. Agilent ChemStation Modes The Agilent ChemStation modes are application oriented. Each mode has its own mode-specific menu, panels, operations and set of views. Your general purpose software for UV-visible spectroscopy is the platform for all modes. It is split into a Standard mode, an Execute Advanced Method mode and a Verification and Diagnostics mode. According to your needs, modes are available for Advanced operation, Dissolution Testing runs, Multibath Dissolution Testing runs, Combined Reports evaluation, Kinetics measurements, Thermal Denaturation studies and Color Calculations. These modes of operation can be switched within a running Agilent ChemStation session. All current raw data will be preserved during such a switch. This allows to look at your data with the focus on different aspects. Most of the modes offer you the ability to define your analytical task by a set of parameters and, if necessary, data. A set of parameters and data can be saved to disk as a method. This allows you to repeat your analysis task under defined conditions simply by loading a method and running your samples. 24 Introduction to Your System Standard Mode Tasks Standard Mode Tasks The Agilent ChemStation modes also offer the ability to focus on a certain aspect, many parameters have to be managed to customize a mode for a certain application. To overcome this complexity your standard mode offers an additional focus on tasks. The standard mode of your general purpose software for UV-visible spectroscopy is oriented towards the most common tasks performed in a analytical laboratory that employs UV-visible spectroscopy. Four tasks are available: • Fixed Wavelength • Spectrum/Peaks • Ratio/Equation • Quantification A task is selected and activated from the analysis panel’s selection box. This task orientation lets you quickly adjust the software to give you the right view and answers based on your data. These tasks have been derived from a survey of the most common UV-visible spectroscopic tasks done on a routine basis in analytical laboratories. Historically these tasks have been developed on filter photometers or scanning spectrophotometers. With your spectrophotometer you have the advantage that by default the entire UV-visible spectrum of your samples is available. So these for tasks do offer only different views to your data acquired. A task switch within the Standard mode is much faster than an entire mode switch. An additional benefit of these tasks is that the definition of a method is done within a single dialog. 25 Introduction to Your System Standard Mode Tasks Fixed Wavelength The Fixed Wavelength task is used to look at measured sample data at up to six different wavelength. This data is available as absorbance, transmittance and first to fourth derivative. Due to the spectral acquisition additional techniques such as internal reference or three-point, drop-line background corrections can be applied. Spectrum/Peaks In the Spectrum/Peaks task you are looking at absorbance minima and maxima. The focus here is more on the wavelength scale but you get the according absorbance readings in addition. 26 Introduction to Your System Standard Mode Tasks Ratio/Equation The Ratio/Equation task is used to perform a user-definable equation based on measured data and sample information. An equation can be setup using sample data at up to six wavelengths, and weight and volume data entered with the samples measured. By means of an equation, for example, analysis results based on chemical test kits can be automatically calculated and reported. Another application is to use a ratio of data values to check for the identity or the purity of a sample. Quantification The Quantification task allows you to do single component analysis based on four different types of calibration curves and a set of standards. Due to the spectral acquisition in addition background corrections can be applied to your data. The calibration can be optimized for your concentration range of interest by changing the wavelength used for calibration. A new calibration and a new analysis is automatically performed based upon your current standard data. 27 Introduction to Your System Standard Mode Data Processing Standard Mode Data Processing General Data Processing Although knowledge of the internal design of the data flow and processing in not required to use Agilent ChemStation software, it helps to understanding how Agilent ChemStation processes your data and how this processing is controlled by your method’s parameters. The data processing can be easily described using a model of data containers and operations visualized in a flow diagram. Spectral Processing Raw Data Data Access Processed Spectra Data Evaluation Used Wavelength Results All basic data go into a raw data container. This container is empty when you start your Agilent ChemStation session and it will be filled by measuring data or loading data from a file. The raw data container held the originally acquired data as specified with your acquisition parameters and stamped with, for example, acquisition date and time as well as the acquisition operator’s name. 28 Introduction to Your System Standard Mode Data Processing Spectral Processing Your method defines how this data is analyzed. The first processing step is spectral processing. The processed raw data spectra are transferred automatically into a second container for processed spectra. This concept allows you to have a look at the results of this processing step by viewing the processed spectra container’s content. If you, for example, specified first derivative data type, the first derivative spectra of all your raw data are available in the processed spectra container after analysis. The type of spectral operation is defined by your method settings. Used Wavelength A next step in the data analysis process is the access to data for further evaluation specified in terms of wavelength and background correction operations such as an internal reference calculation or three-point, drop-line calculation. This data is stored in the used wavelength container. In the Fixed Wavelength task, for example, a tabular view on these data is available with the Sample/Results Table window. Results An additional step is the evaluation of the accessed data. 29 Introduction to Your System Standard Mode Data Processing In the Ratio/Equation task, for example, this used wavelength data is processed by an evaluation of the equation specified. This additional operation generates the calculation results. These calculated result values are filled into the results container. The results are available with the Sample/Results Table. Summary The generalized basic data processing is divided into three steps. 1 spectral processing 2 data access 3 data evaluation These steps are always performed in the above order identically for all spectra in the raw data container. The results are placed in the results container. The previous content of the processed spectra, used wavelength and results container is replaced. Processing with Standards In the forth task, in addition to your sample data, standards are used. This requires an extension to the above concept to handle standards. Two independent sets of containers, one for standards and another for samples have been implemented. All processing containers are doubled as well. As 30 Introduction to Your System Standard Mode Data Processing with the sample processing only, all evaluation steps are done in parallel on both the samples and the standards. Samples Standards Spectral Processing Raw Data Raw Data Data Access Processed Spectra Processed Spectra Data Evaluation Used Wavelength Used Wavelength Calibration Results Calibration Results The evaluation in quantification is now a calibration using standards. The coefficients are calculated based on the method’s settings and the current standards in the Agilent ChemStation memory. This means results now 31 Introduction to Your System Standard Mode Data Processing become a function of a measured set of standards and the standard concentrations specified. These coefficients are then used to calculate concentration results for the samples currently in memory. The same processing steps applied to sample and standard data lead to the most precise results. Advantages The concept of a diode-array-based spectrophotometer in combination with powerful data evaluation based on Agilent ChemStation offers many advantages over traditional spectrophotometer systems. Some of these advantages from a practical point of view are briefly descibed below. Virtually Unlimited Number Of Standards Due to this data analysis concept you can measure your standards before or after your samples and, besides the minimum required number of standards, you can use as many standards you like to use with your calibration. Easy Optimization The availability of all raw data—samples and standards—means you can easily optimize your method’s settings by choosing a different calibration wavelength and re calibrating your system. And, the elimination of outliers in your calibration is possible by simply removing this standard from you standard data set. 32 Introduction to Your System Standard Mode Data Processing Calibrated Method When you save your method the standards currently in memory are always saved with the method. After loading a method, you can directly analyze your samples. Optimization for a Particular Sample In addition you may optimize your wavelength settings for a sample outside the linear range of your actual calibration. Due to the excellent wavelength reproducibility of your spectrophotometer, you can switch to a wavelength with a lower extinction coefficient for precise analysis of such a sample. Summary The availability of spectral raw data offers you many additional opportunities to optimize your calibration and analysis for best results. This optimization can be done quickly just by setting new method parameters. You get new answers almost instantaneously. The data analysis concept applied assures consistent and reliable results. 33 Introduction to Your System Standard Mode Data Processing 34 2 2 Installation and Start Up Summary of installation and startup of your system Installation and Start Up This chapter does not replace the information available with the Installing Your UV-visible Spectroscopy System manual. It is meant as a reminder of the key steps of the installation and the system startup. The following topics are covered. • “Installation Summary for Your Agilent 8453 General Purpose UV-visible System” on page 37. • “Starting a Measurement Session” on page 39. 36 Installation and Start Up Installation Summary for Your Agilent 8453 General Purpose UV-visible System Installation Summary for Your Agilent 8453 General Purpose UV-visible System General A detailed description of your Agilent 8453 general purpose UV-visible system is given with the manual Installing Your UV-visible Spectroscopy System. The summary reminds you of the key points of installation. Spectrophotometer ❏ Make sure that your spectrophotometer has the JetDirect card installed. ❏ Check that your spectrophotometer is either connected to your PC directly using a twisted LAN cable or to your LAN using a direct connection. WAR NI N G Do not connect the LAN adapter of your PC to the CAN interface of the Agilent 8453 spectrophotometer, otherwise the LAN adapter of the PC will be seriously damaged, because the operating voltage of the CAN interface (12 V) is higher than the operating voltage of the LAN adapter (5 V). ❏ Check that your spectrophotometer is connected to a power outlet. WAR NI N G Always operate your instrument from a power outlet which has a ground connection. Always use the power cord designed for your region. ❏ Before you switch on your spectrophotometer, make sure that the CAG Bootp Server is running on your PC or your network administrator has assigned an IP-address to your spectrophotometer. For details see the chapter “LAN Communication, Installation, Connection and Configuration” in your Installing Your UV-visible Spectroscopy System manual. 37 Installation and Start Up Installation Summary for Your Agilent 8453 General Purpose UV-visible System PC ❏ Make sure that all of your PC components are connected to line power. ❏ Make sure that your general purpose software for UV-visible spectroscopy is installed. ❏ A printer must be configured on your PC. • Adjust paper size (for example, Letter, A4) • Set Orientation to Portrait ❏ The TCP/IP protocol must be installed and configured on your PC. ❏ Your spectrophotometer must be configured with its IP address. ❏ If you connected your spectrophotometer directly to your PC be sure that your CAG Bootp Server application is installed and automatically launched when you start your PC. If you connect to your spectrophotometer using a LAN make sure that your network administrator assigns the IP address to your spectrophotometer. 38 Installation and Start Up Starting a Measurement Session Starting a Measurement Session With a network connection to your spectrophotometer it is important that your spectrophotometer is recognized by the software. This requires the assignment of a unique IP address at power on time to your spectrophotometer. The assignment is either done by the CAG Bootp Server application running on your PC with a direct connection to the spectrophotometer or in a LAN by a server application on your LAN. Therefore it is important that either one of these applications is up and running before you switch your spectrophotometer on. ❏ Switch on your PC and boot your PC operating system. If a printer is connected to your system, switch the printer on. ❏ Make sure that the CAG Bootp Server is running or you are logged onto your LAN. ❏ Switch your spectrophotometer on and wait until the spectrophotometer’s indicator light turns to green. This process includes the spectrophotometer’s self test and takes about one minute. For details on the startup sequence see chapter “Installation and Start Up” in your Installing Your UV-visible Spectroscopy System manual. ❏ Launch your measurement session by pressing your operating system’s Start button and select Programs, UV-Visible ChemStations, spectrophotometer 1 online. ❏ You are ready to use your system, if the blue busy status display on the system’s bottom message line turns off. ❏ The first measurement you have to perform is a reference measurement. After this alignment your are ready to measure absorbance data and spectra. NOTE It takes about 15 minutes for the lamps to reach stable state conditions. For best results, do not perform measurements before this period of time has elapsed. 39 Installation and Start Up Starting a Measurement Session 40 3 3 Good Measurement Practices General operating conditions of the spectrophotometer Good Measurement Practices This chapter describes • making measurements • selecting material, optical specification and type of cell • handling and maintaining cells • checklist for good results • solvents selection • sample preparation • use of filters • stirring and temperature control of sample • how to insert cells into the cell holder. 42 Good Measurement Practices General Considerations General Considerations There are many factors that can affect the results of your measurements. This section provides brief discussions of some of the more important ones. Spectrophotometer Design The sample compartment of the Agilent 8453 spectrophotometer is open. Unlike conventional instruments the Agilent 8453 does not suffer from ambient stray light. The open sample area makes it easier to access it generally and to connect tubing to a flow cell or thermostattable cell holder. Making Measurements Blank (Reference) and Sample Measurement Your spectrophotometer is a single beam instrument so you must measure a blank before you measure a sample. For the high accuracy measurements, the blank and the sample measurement should closely follow each other. In general, a blank measurement should be repeated as often as is practical. Even in a thermally stable environment, a blank measurement should be taken every half hour to ensure accurate results. Chemically, the only difference between the blank and the sample should be the presence of the analyte(s). For measurements with liquid samples, the blank should be a sample cell filled with the solvent you plan to use. Sample Cell Material Quartz sample cells or sample cells with quartz face plates are required if you want to use the full 190 to 1100 nm wavelength range of your spectrophotometer. If you plan on working only in the visible and/or short-wave near-infrared range of 350 to 1100 nm, you can use good quality glass cells. Disposable plastic sample cells, for measurements in the range 400–1100 nm, are also available. The quality of these cells varies and they are generally not recommended. 43 Good Measurement Practices General Considerations Optical Specifications of Cells The accuracy of the readings of a diode-array spectrophotometer is very sensitive to spatial shifts of the analysis light beam. Cells having non parallel opposite faces, or so called wedge shaped cells, lead to a spatial shift of the light beam (see Figure 4). Therefore, the opposite cell walls illuminated by the analysis light beam have to very parallel. The parallelism is measured in terms of the angle between the two opposite cell walls. We recommend to use 10 mm path length cells with an angle which is below 0.1 degrees of an arc. Figure 4 Shift of the Spectrophotometer Light Beam due to non Parallel Cell Walls Light Beam In Light Beam in Parallel Parallel CellWalls Walls Cell Light Beam Out out Light Beam Light Beam In Light Beam in Non-parallel Non-parallel CellWalls Walls Cell Light Beam Out out Light Beam Apertured Cells In applications where sample volume is limited, apertured or microcells are used. The width of these cells is reduced to reduce the volume and the blank part of the cell must be blackened to avoid unwanted transmission and reflection through the side walls. If the side walls are not blackened the result will be poor photometric accuracy and, if different concentrations are measured, poor linearity. The disadvantage of apertured and microcells is that part of the light beam is blocked. Not all the light passes through the sample and there can be some loss in sensitivity. See Figure 5 for recommended and Figure 6 for cells you should not use with the instrument. 44 Good Measurement Practices General Considerations Figure 5 Recommended Cells Quartz cells Quartz cells with black apertures* CA UT IO N * Quartz cells with black apertures smaller than 2 mm, when used with a multicell transport, can lead to measurements of poor reproducibility. Figure 6 Cells You Should Not Use With the Instrument Quartz cells with transparent apertures, fluorescence cells, plastic cells Flow Cells We recommend a sipper system with a flow cell for obtaining the high precision measurements. Using a flow cell eliminates the necessity of moving the cell between blank measurement and sample measurement. Also, the cell can be rinsed thoroughly with the solution to be measured. 45 Good Measurement Practices General Considerations The design of the flow cell should minimize entrapment of bubbles and flow channeling to provide the most reliable results. Handling and Maintaining Cells Passivating New Cells When filling a non-passivated new cell with your sample, you will observe that air bubbles stick on the windows of your cell. To prevent the formation of sticky bubbles, rinse the cell with cleaning and passivating fluid (part number 5062-8529). The cleaning procedure you should apply is described on the label of the cleaning fluid container. Cleaning Cells The fats in fingerprints are significant absorbers in the UV region and, if left on optical surfaces, can cause erroneous results. Wipe off all fingerprints and contaminants before using a sample cell. Use only high quality lens tissues (part number 9300-0761) and never dry the inside of a cell with lens tissues. Dry the inside of the cell with pressurized, oil free air, that prevents the cell from getting contaminated with tissue particles, or rinse the cell with blank or sample solution. Floating particles in the cell will deflect the light beam and so lead to a very poor quality of the measured spectrum. Figure 7 Floating Particles in a Cell Floating particles will deflect and scatter the light beam 46 Good Measurement Practices General Considerations Figure 8 Spectrum Taken With Floating Particles in the Light Path Lens tissues for glasses or other uses often contain detergents or lubricants which can affect your measurements. If possible avoid cleaning the faces of your cell between blank and sample measurements. Handling Cells Always install a cell so that it faces the same direction to minimize problems with cell non-uniformity. For best results with microcells, leave your sample cell clamped in position throughout the measurement sequence. Solutions should be removed and replaced by pipette or use flow cells. Solvents Your choice of solvents should be based primarily on the solvent’s absorbance characteristics over the wavelengths of interest, its suitability as 47 Good Measurement Practices General Considerations a solvent for the analyte, and on experimental conditions. Table 1 lists common solvents and the lower limit of their useful wavelength range. Table 1 WAR NI N G Lower Limit of UV Transmission for Some Common Solvents Lower Limit Solvent 180–195 nm Sulfuric acid (96%) Water Acetonitrile 200–210 nm Cyclopentane n-Hexane Glycerol 2,2,4-Trimethylpentane Methanol 210–220 nm n-Butyl alcohol Isopropyl alcohol Cyclohexane Ethyl ether 245–260 nm Chloroform Ethyl acetate Methyl formate 265–275 nm Carbon tetrachloride Dimethyl sulfoxide Dimethyl formamide Acetic acid 280–290 nm Benzene Toluene m-Xylene Above 300 nm Pyridine Acetone Carbon disulfide Many of the solvents in Table 1 are hazardous. Be sure you fully understand their properties before using them. When using volatile solvents such as acetone or methylene chloride, make sure that the sample cell is stoppered. Evaporation of a solvent can change 48 Good Measurement Practices General Considerations the solute concentration or cause solution noise due to solute convection currents. Both of these will affect the accuracy of your measurements. We also recommend stirring and temperature control when you use volatile solvents. When using water as solvent we recommend using UV grade or HPLC grade water to reduce unwanted absorbance from impurities in the water. If you are using the sipper/sampler system the water should be degassed to avoid bubble formation in the flow cell, especially if the water comes from a pressurized water supply. Sample Preparation The sample cell should be rinsed three to five times with your intended solvent before you fill it with the pure solvent that will be used in the measurement. Turning the cell upside down on a small stack of absorbent tissues will help remove any residual solvent. This treatment will minimize contamination from previous experiments. Samples which contain colloidal dispersions, dust or other particulate matter should be filtered, centrifuged or allowed to settle. If not, the overall attenuation-of-transmittance spectrum due to light scattering and/or reflection will hide the spectral information from the analyte. Photosensitive Samples A few substances are very photosensitive. They degrade or undergo photochemical reactions if exposed to light. This can be easily seen by a decrease of sample absorbance over time. Use of Filters The shorter wavelength, higher-energy UV light is most likely to degrade photosensitive samples. If you have a problem, you can selectively block portions of the UV spectrum with a UV cut-off filter. An optical filter wheel assembly with three cut-off filters is available for the spectrophotometer. The cut-off wavelength of the filter you choose should be low enough that it does not eliminate important spectral information but high enough that it blocks the light that could degrade your sample. If you use a filter with your samples, you must use the same filter when you make your blank measurement. 49 Good Measurement Practices General Considerations Turning the D2-Lamp off The short wavelength radiation leading to photodegradation comes from the light of the D2-lamp. For application where readings are taken at wavelengths above 400 nm, the D2-lamp can be turned off. The light intensity supplied by the Tungsten lamp is sufficient for a good signal to noise ratio over the wavelength range 400–1100 nm.When using cells with small apertures, you should check the signal to noise ratio by making sample measurements under conditions of your application. Stirring and Temperature Control Solution homogeneity can be a problem, especially for viscous solutions. There are cases where, due to convection induced gradients, rapid absorbance changes may give irreproducible data. These changes can be observed spectroscopically by taking measurements with short integration times. To minimize convection effects keep the temperature of your sample the same as the cell holder or environmental temperature. Problems like these can also be minimized by using a thermostattable cell holder and/or a stirring module. A similar effect can occur in cases of incomplete mixing. This is especially true where the specific gravities or miscibilities of the solvent and analyte are quite different. Again, stirring is a way to prevent this kind of problem. In an unstirred cell, it is sometimes possible to observe local photodegradation of sensitive analytes. Because the actual volume of the sample in the light path is very small, stirring the sample will reduce the time any given analyte molecule is in the light path. This minimizes the photodegradation and increases homogeneity. Using a flow cell with continuous flow can yield similar results. Checklist for Best Results Cell: ❏ Cell is made of quartz or glass ❏ Apertured cells has black sides ❏ Apertured cells has an aperture greater than or equal to 3 mm ❏ Cell windows are free of fingerprints and other contamination ❏ Flow cell used instead of an apertured standard cell 50 Good Measurement Practices General Considerations Measurements: ❏ Solution in cell is free of floating particles ❏ Solution in cell and cell walls are free of bubbles ❏ Solution in cell is mixed homogeneously ❏ Blank measured on same solvent as sample ❏ Blank measurement shows a flat baseline (Figure 9 and Figure 10 show a good and a poor baseline) ❏ Cell orientation of blank and sample measurements is the same ❏ Ideally the cell is not removed between the measurement, which means the cell is filled/rinsed using a pipette or a flow cell is used ❏ Time between blank and sample measurement should be short Figure 9 Example of a Blank on Water Showing a Good Baseline 51 Good Measurement Practices General Considerations Figure 10 Example of a Blank on Water with Bubbles Causing a Poor Baseline NOTE If your blank or spectra shows artifacts similar to the one in Figure 10, see “Solvents” on page 47 to optimize the measurement procedure. 52 Good Measurement Practices Inserting a Cell Inserting a Cell Your spectrophotometer is shipped with the standard single-cell holder you first have to install in the sample compartment. This cell holder accommodates standard cells or flow cells. To insert a sample cell in the cell holder: 1 Move the locking lever to its up position. 2 Insert the sample cell, making sure you orient it correctly. The frosted (non-clear) sides of the sample cell should not be in the path of the light beam. 3 Lock the sample cell in place by pushing the locking lever back down. Small volume flow cells and particularly any cells with less than a 2 mm aperture may require use of the optional adjustable cell holder. The adjustable cell holder helps you ensure the cells are properly centered in the light path. 53 Good Measurement Practices Inserting a Cell 54 4 4 Using your Agilent 8453 UV-visible Spectroscopy System A few examples to demonstrate how typical standard applications can be performed Using your Agilent 8453 UV-visible Spectroscopy System This chapter includes the following: • “Starting Your First Measurement Session” on page 57 • “Starting Your UV-visible Software” on page 59 • “Measuring Caffeine Absorbance at 273 nm” on page 60 • “Saving Your Parameters as a Method” on page 63 • “Retrieving and Printing a Method” on page 65 • “Saving and Retrieving Data” on page 68 • “Print Preview of Reports” on page 73 • “Finding the Caffeine Absorbance Maximum” on page 76 • “Entering your Cell’s Path Length” on page 80 • “Controlling your Sipper System” on page 81 • “Using your Multicell Transport” on page 83 • “Quantitative Analysis using a Calibration with Standards” on page 85 • “How Can I Be Sure That My Agilent 8453 Works Properly?” on page 92 • “How Can I Get a Deeper Understanding of UV-visible Spectroscopy?” on page 95 • “When Do I Have to Measure a Blank?” on page 97 56 Using your Agilent 8453 UV-visible Spectroscopy System Starting Your First Measurement Session Starting Your First Measurement Session 1 Make sure that your Agilent 8453 UV-visible system has been installed correctly. For details of installation see your Installing Your UV-visible Spectroscopy System manual. 2 Switch on your PC, monitor and printer. 3 Log on to your PC operating system. Check your Bootp server is running on your system taskbar or make sure that your network administrator has integrated your Agilent 8453 spectrophotometer into your local network. 4 Switch on your Agilent 8453 spectrophotometer. A running DHPC server will now assign the configured IP address to your spectrophotometer. In the standard installation the CAG Bootp Server performs this task. 5 Start your measurement session by selecting Instrument 1 online from the menu. Your Instrument Panel shows you the current state of the spectrophotometer and the Blank button is enabled. 6 The first task you have to perform is to measure a reference. Typically the cell containing the solvent used with your samples is put in the measurement position and a blank measurement performed. To start this measurement, click the Blank button on your Instrument Panel or press the spectrophotometer’s Blank button. A blank measurement is a reference measurement combined with the measurement of a baseline spectrum. A baseline spectrum gives you additional hints on the absorbance of the cell windows and the solvent. Areas with high noise indirectly indicate high absorbance. 57 Using your Agilent 8453 UV-visible Spectroscopy System Starting Your First Measurement Session NOTE For high precision measurements, wait until the spectrophotometer and the lamps have reached thermal equilibrium. The time required is a function of the environmental conditions. Your spectrophotometer should be ready after 45 minutes. 7 The next measurement is your sample measurement. To get the most precise results, use the same cell in the same orientation to the measurement beam. Flush your cell about three times with your sample solution and start the measurement by clicking the Instrument Panel’s Sample button or by pressing the spectrophotometer’s Sample button. NOTE For details on how to mount your cell, see “Inserting a Cell” on page 53. 58 Using your Agilent 8453 UV-visible Spectroscopy System Starting Your UV-visible Software Starting Your UV-visible Software This section describes how you start an Agilent ChemStation session on your PC. If you want to perform measurements, you can start an online session, or you can start an offline session for optimizing the analytical parameters of a method, recalculating results or printing reports. A single online session can be started on your PC, but multiple offline sessions can be started in parallel. This allows you to optimize your method settings by direct comparison based on identical sets of data. 1 Switch on your PC, monitor and printer. 2 Log on to your PC’s operating system 3 Start your Agilent ChemStation session by selecting Instrument 1 online, for a measurement session, or Instrument 1 offline, for method optimization and data evaluation. 4 Enter your name to log on to your Agilent ChemStation session. If you protected your manager level by password, you must enter the correct password. The system will then come up with the last-used mode and method. 59 Using your Agilent 8453 UV-visible Spectroscopy System Measuring Caffeine Absorbance at 273 nm Measuring Caffeine Absorbance at 273 nm This section describes how you measure your caffeine sample that was shipped with your spectrophotometer. Measurement of this caffeine sample is also used for the IQ (installation qualification) of your Agilent 8453 spectrophotometer. 1 Make sure that you are in Standard mode. The mode is indicated on the toolbar of your Agilent ChemStation session. 2 Select the Fixed Wavelength task in the analysis panel’s selection box. 3 Click Setup in the analysis panel to open the parameter dialog. 60 Using your Agilent 8453 UV-visible Spectroscopy System Measuring Caffeine Absorbance at 273 nm 4 Type the wavelength of interest in the Wavelengths section of the Fixed Wavelength(s) Parameters dialog. Adjust your spectral display to a wavelength range from 190 nm to 400 nm in the Display spectrum section. Click OK to set your parameters. 5 Fill your 1-cm path-length quartz cell with distilled water. Lift the lever at the left side of your cell holder. Put the cell in the cell holder and make sure the transparent windows face towards the font and the back of the spectrophotometer. Push the lever down to secure your cell in the cell holder. 61 Using your Agilent 8453 UV-visible Spectroscopy System Measuring Caffeine Absorbance at 273 nm 6 Press the Blank button on the front of the spectrophotometer or click Blank on the Instrument Panel to start the measurement. 7 Remember the orientation of the cell in the cell holder. Lift the level to release the cell, remove it and flush it three times with about 1 ml of your caffeine sample. Then fill the cell with about 3 ml of the caffeine sample. Make sure that the cell windows are clean and reposition the cell in the same orientation as for the reference measurement. Close the cell holder’s level. 8 Press the Sample button on the front of your spectrophotometer or click Sample on the Instrument Panel to start the measurement. 9 The view shows you the spectrum of your caffeine sample with a vertical line indicating your wavelength of interest. Below the spectrum is the Sample/Result Table which shows the absorbance reading at 273 nm. 62 Using your Agilent 8453 UV-visible Spectroscopy System Saving Your Parameters as a Method Saving Your Parameters as a Method This section describes how to save your settings for a future Agilent ChemStation session. Simply by loading your method you adjust your Agilent ChemStation to repeat your measurement. A library of methods facilitates routine laboratory work. Let’s assume that your current settings are defining your method to analyze a caffeine sample. To be able to repeat such an analysis all set parameters can be stored permanently to disk. This allows you to load such a method on your system or even transfer such a method to your colleague with a Agilent ChemStation system. 1 Choose Save Method As… from the File menu or click the icon. 63 Using your Agilent 8453 UV-visible Spectroscopy System Saving Your Parameters as a Method 2 This displays the Save Method As… dialog box. Type the method name in the File name field, for example, Caffeine.m. Click OK to save your method. NOTE If you generate many methods, you can use Options & Infos… from the Method menu to add text for documentation purposes and to simplify method access. This displays the Method Options & Information dialog box. In the Method Information section you can enter a sort descriptive text which becomes part of your method. 64 Using your Agilent 8453 UV-visible Spectroscopy System Retrieving and Printing a Method Retrieving and Printing a Method This section describes how to access methods and print a method report. 1 Choose Load Method… from the File menu or click the icon in the toolbar. NOTE If your current method has been modified, a dialog box will ask you whether you want to save or ignore these changes. 65 Using your Agilent 8453 UV-visible Spectroscopy System Retrieving and Printing a Method 2 The Load Method… dialog is displayed. The selected method’s information is shown in the File Information section of the dialog box. 3 If you want to load this method, click OK. NOTE Whenever you change a parameter of the current method, you get an indication in the toolbar’s modification field. This triggers the reminder dialog mentioned above. 66 Using your Agilent 8453 UV-visible Spectroscopy System Retrieving and Printing a Method 4 To print a method, choose Print, Method from File menu. NOTE To be able to print your method report, your printer must be properly configured and online. An alternative, if your printer is currently not online, is to view the print preview on the screen. 67 Using your Agilent 8453 UV-visible Spectroscopy System Saving and Retrieving Data Saving and Retrieving Data This section explains how you can save and retrieve measured data. This data can be used for archiving, for method development at a later stage, or for exchange with other Agilent ChemStations. Your Agilent ChemStation has the ability to store and retrieve your data using a binary, checksum protected data format (extension *.sd,*.std). All current spectra -samples or standards- can be saved to disk for permanent storage. Save and load of data is possible using local and network drives. In addition a single spectrum can be selected for storage. Saving your Samples 1 Choose Save, Samples As… from the File menu or click the toolbar icon. 2 You select one of your already existing data files in the File name selection box of the Save Spectra As… dialog or you type a valid file name into the File name edit box. 68 Using your Agilent 8453 UV-visible Spectroscopy System Saving and Retrieving Data NOTE A valid file name consist of eight alphanumeric characters and the file extension .sd or .std. Usually the extension .std is used for standards only. If the file name exists already, a message box is displayed allowing you to abort or continue with the operation. 3 Click OK to start the operation. Saving a Selected Spectrum 1 Select the spectrum of interest in the graphic window. Or, in the tabular Sample/Results Table window. 69 Using your Agilent 8453 UV-visible Spectroscopy System Saving and Retrieving Data 2 Choose Save, Selected Spectra As… from the File menu. NOTE You may get the warning, Select/activate a window!, on the message line, if you did not select either the Overlaid Sample Spectra window or the Sample/Results Table window. 3 You select one of your already existing data files in the File name selector box of the Save Spectra As… dialog or you enter a valid file name into the File name edit box. 4 Press OK to start the operation. 70 Using your Agilent 8453 UV-visible Spectroscopy System Saving and Retrieving Data Retrieving Spectra 1 Choose Load, Samples… from the File menu. 2 You select the data file in File name selector box of the Load Spectra to SAMPLES dialog box. NOTE You can look at the File Information of your files by moving the selection in the file selector box. The content is always updated with the current selection. 3 Click OK to start operation. The spectra available with your data file are added to the files currently in the Agilent ChemStation sample container. 71 Using your Agilent 8453 UV-visible Spectroscopy System Saving and Retrieving Data Deleting Current Spectra 1 Choose Clear, Samples from the Edit menu or click the toolbar icon. NOTE Clear, Standards and Clear, Math. Results can be used to delete the current standards respectively the current mathematical results spectra from Agilent ChemStation memory. 72 Using your Agilent 8453 UV-visible Spectroscopy System Print Preview of Reports Print Preview of Reports Print preview allows you to look at the report in a separate Agilent ChemStation window based on the currently configured printer. All types of available reports can be checked page by page in the preview window. The number of pages generated and the layout also can be checked. In addition the currently displayed report can be printed. Print Preview of a Results Report The print previews work similarly for all available types of reports. The example below shows you how to preview your results report. 1 Choose Print Preview, Results from the File menu. 73 Using your Agilent 8453 UV-visible Spectroscopy System Print Preview of Reports NOTE Printing a results report requires you to have set all parameters properly and have data available for evaluation. If you do not have data, you may get the message No results present! on the message line. 2 The report generated will be displayed in the preview window. This window allows you to look at your report page by page. Scroll bars are available if a page does not fit into the actual preview window. 74 Using your Agilent 8453 UV-visible Spectroscopy System Print Preview of Reports In addition, you may use a different size for your preview display. Three sizes are available with the size selection box. Depending on your display resolution select the one which best fits your needs. The following functions are available with the print preview window: • The Prev and Next buttons allow you to browse through the report pages. • A selection box allows to jump to a page directly. • The Print button sends the report to the printer which is displayed in the lower left corner of the print preview window. • The Close button closes your print preview window and discards the report shown. 75 Using your Agilent 8453 UV-visible Spectroscopy System Finding the Caffeine Absorbance Maximum Finding the Caffeine Absorbance Maximum This section describes how you find the absorbance maximum for your caffeine IQ sample. 1 Make sure that you are in the Standard mode. The mode is indicated on the tool bar of your Agilent ChemStation session. 2 Select the Spectrum/Peaks task in the analysis panel’s selection box. 3 Use the Setup button of the analysis panel to open the parameter dialog. 76 Using your Agilent 8453 UV-visible Spectroscopy System Finding the Caffeine Absorbance Maximum 4 Type 2 for the number of peaks to find and uncheck the valley find option. Set your data type to absorbance and adjust your spectral display to a wavelength range from 190 nm to 400 nm in the dialog’s Display spectrum section. Click OK to set your parameters. 5 Fill your 1-cm path-length quartz cell with distilled water. Lift the lever at the left side of your cell holder. Put the cell in the cell holder and make sure the transparent windows face towards the font and the back of the spectrophotometer. Push the lever down to secure your cell in the cell holder. 77 Using your Agilent 8453 UV-visible Spectroscopy System Finding the Caffeine Absorbance Maximum 6 Press the Blank button on the front of the spectrophotometer or click Blank on the Instrument Panel to start the measurement. 7 Remember the orientation of the cell in the cell holder. Lift the level to release the cell, remove it and flush it three times with about 1 ml of your caffeine sample. Then fill the cell with about 3 ml of the caffeine sample. Make sure that the cell windows are clean and reposition the cell in the same orientation as for the reference measurement. Close the cell holder’s level. 8 Press the Sample button on the front of your spectrophotometer or click Sample on the Instrument Panel to start the measurement. 78 Using your Agilent 8453 UV-visible Spectroscopy System Finding the Caffeine Absorbance Maximum 9 The view shows you the spectrum of your caffeine sample. Two peaks were found marked and these annotated with the wavelength. Below the spectrum graph the Sample/Result Table shows the wavelength of the peaks found and the measured absorbance values. 79 Using your Agilent 8453 UV-visible Spectroscopy System Entering your Cell’s Path Length Entering your Cell’s Path Length The cells used for your measurements are specified with the sampling system parameters. In quantitative calculations these parameters are used in results calculation. Due to the freedom of choices for the cell path length, you must provide the correct value with the path length setting. Usually you get this information from the supplier of your cells. You so set the path length in manual mode cell handling as follows. 1 Click Setup on the Instrument Panel. 2 Type the path length in cm in the Setup Manual dialog box. 3 Click OK to set the specified path length. 80 Using your Agilent 8453 UV-visible Spectroscopy System Controlling your Sipper System Controlling your Sipper System A sipper system transfers your sample by means of a peristaltic pump into a flow cell for the measurement. To control your sipper system through the Agilent ChemStation software, you have to adjust your current sampling system for sipper introduction. In addition, due to the length of tubing, the dead volume of your flow cell and the flow rate of your pump, you adjust your sipper system parameters. For details see your Installing and Operating Your Sipper System manual. 1 Select the Sipper in the Instrument Panel selection box. 2 Click Setup on the Instrument Panel. Type the path length of your flow cell in cm and click OK. 81 Using your Agilent 8453 UV-visible Spectroscopy System Controlling your Sipper System 3 Click Setup again and access the Sipper Parameter dialog by clicking Parameter. The parameters required can be determined using the Flow Test task of your Verification and Diagnostics mode. 4 Click OK in the Sipper Parameter dialog and click OK in the Sipper dialog to set the parameters. NOTE Every measurement you start by clicking one of the Instrument Panel measurement buttons or by pressing the spectrophotometer buttons uses the sipper for sample introduction. Sipper introduction is also used by an automated sequence. 82 Using your Agilent 8453 UV-visible Spectroscopy System Using your Multicell Transport Using your Multicell Transport The multicell transport is a cell changer which allows you to position up to 8 cells in the measurement position automatically. You may use different cells in each measurement position. The path length can be specified individually for each of the cell positions. NOTE For details about your multicell transport see your Installing and Operating Your Multicell Transport manual. 1 Select Multicell (8-cell) in the Instrument Panel selection box. 2 Click Setup on the Instrument Panel. Type the path lengths of all cells used in cm and click OK. 83 Using your Agilent 8453 UV-visible Spectroscopy System Using your Multicell Transport 3 To move your cell for the next measurement into the measurement position, click the cell on the Instrument Panel or choose Multicell Transport Position from the Spectrophotometer menu to access Multicell transport Control dialog. In the Multicell Transport Control you press one of the position buttons to move the multicell transport. NOTE In an automated sequence the multicell transport can be used for automatic sample introduction. A maximum of 8 samples can be introduced. If you specify more than 8 measurements you get the warning: You may also control an existing 7 position multicell transport. The major differences are that you have no separate reference position and one cell position less. 84 Using your Agilent 8453 UV-visible Spectroscopy System Quantitative Analysis using a Calibration with Standards Quantitative Analysis using a Calibration with Standards Your quantitative analysis task is based on a calibration with standards. After a successful calibration the measured standards can become part of your method. Such a method can be used directly for quantitative analysis of samples. After having setup your method calibrated samples can be analyzed. Several views of both your standards and the calibration as well as on your samples and results are available. As a quick introduction a calibration using Beer’s law with a single standard and the analysis of a sample are described. Further, the only limitation on the number of samples and standards is the memory capacity of your Agilent ChemStation. For the practical experiment we use the IQ caffeine sample as standard and a 1:1 dilution with distilled water as sample. For the calibration we use absorbance data at 273 nm. Setup 1 Make sure that you are in the Standard mode. The mode is indicated on the tool bar of your Agilent ChemStation session. 2 Select the ‘Quantification’ task in the analysis panel’s selection box. 85 Using your Agilent 8453 UV-visible Spectroscopy System Quantitative Analysis using a Calibration with Standards 3 A new task panel is displayed and the Quantification Parameters dialog is opened automatically. NOTE If you are already in the Quantification task, use the Setup on the analysis panel to open the parameter dialog. 86 Using your Agilent 8453 UV-visible Spectroscopy System Quantitative Analysis using a Calibration with Standards 4 Setup your analysis wavelength at 273 nm (Use wavelength), type Caffeine for the Analyte name, set the Calibration curve type to Linear, select Concentration entry and use mg/l as Unit. Check the Prompt for standard information and the Prompt for sample information. Select Absorbance as Data type and set Display spectrum From 190 nm To 340 nm. 5 Click OK to set your parameters. NOTE Now you are ready to run your measurements. Calibration 1 Fill your 1-cm path-length quartz cell with distilled water. Lift the lever at the left side of your cell holder. Put the cell in the cell holder and make sure the transparent windows face towards the front and the back of the spectrophotometer. Push the lever down to secure your cell in the cell holder. 87 Using your Agilent 8453 UV-visible Spectroscopy System Quantitative Analysis using a Calibration with Standards 2 Press the Blank button on the front of the spectrophotometer or click Blank on the Instrument Panel to start the measurement. 3 Remember the orientation of the cell in the cell holder. Lift the level to release the cell, remove it and flush it three times with about 1 ml of your caffeine sample. Then fill the cell with about 3 ml of the caffeine sample. Make sure that the cell windows are clean and reposition the cell in the same orientation as for the reference measurement. Close the cell holder’s level. 88 Using your Agilent 8453 UV-visible Spectroscopy System Quantitative Analysis using a Calibration with Standards 4 Press the Standard button on the front of your spectrophotometer or click Standard on the Instrument Panel to start the measurement. 5 Enter your standard’s information in the Standard Information dialog box and click OK. 6 Your Agilent ChemStation software automatically calibrates and displays the calibration results. After a successful calibration the task panel’s calibration curve shows green. This indicates that your method is ready for analysis. NOTE The Task panel’s Samples and Standards buttons can be used to switch your current view to the samples or standards view. At this point you can also save your method for future use. See “Saving Your Parameters as a Method” on page 63 for more information. 89 Using your Agilent 8453 UV-visible Spectroscopy System Quantitative Analysis using a Calibration with Standards Analysis 1 Remember the orientation of the cell in the cell holder. Lift the level to release the cell, remove it and flush it three times with about 1 ml of your caffeine sample (1:1 dilution with distilled water). Then fill the cell with about 3 ml of the caffeine sample. Make sure that the cell windows are clean and reposition the cell in the same orientation as for the standard measurement. Close the cell holder’s level. 2 Press the Sample button on the front of your spectrophotometer or click Sample on the Instrument Panel to start the measurement. 90 Using your Agilent 8453 UV-visible Spectroscopy System Quantitative Analysis using a Calibration with Standards 3 Enter your sample’s information in the Sample Information dialog box and click OK. The view switches to the samples and your quantitative results will be displayed with the Sample/Result table. NOTE To save your data for future use or for documentation purposes, see “Saving and Retrieving Data” on page 68 for more information. 91 Using your Agilent 8453 UV-visible Spectroscopy System How Can I Be Sure That My Agilent 8453 Works Properly? How Can I Be Sure That My Agilent 8453 Works Properly? The quality of your measurement data is dependent on the performance of your spectrophotometer. For a full performance verification external standards are required. These procedures are described with your Operational Qualification / Performance Verification for Agilent 8453 UV-visible Spectroscopy Systems manual. A quick check without the need of standards can be performed by the Verification and Diagnostics mode’s self test. This test can be performed always after starting the spectrophotometer. Agilent 8453 Self test 1 Make sure that you are in the Verification and Diagnostics mode. The mode is indicated on the tool bar of your Agilent ChemStation session. 2 Select the Self-Test task in the analysis panel’s selection box. 92 Using your Agilent 8453 UV-visible Spectroscopy System How Can I Be Sure That My Agilent 8453 Works Properly? 3 Choose Self-Test, Start from the Task menu or click Start to start the self-test. NOTE The spectrophotometer should be in stable working conditions before you initiate the test. If these conditions are not met, you may get a warning message. 93 Using your Agilent 8453 UV-visible Spectroscopy System How Can I Be Sure That My Agilent 8453 Works Properly? 4 The self-test results are displayed with pass/fail criteria. NOTE Self-test results can be stored with the spectrophotometer. Storing the self-test results with the spectrophotometer allows you to monitor the performance over time. Graphical representations of the self-test histories can be generated. 94 Using your Agilent 8453 UV-visible Spectroscopy System How Can I Get a Deeper Understanding of UV-visible Spectroscopy? How Can I Get a Deeper Understanding of UV-visible Spectroscopy? The basic principles of UV-visible spectroscopy are available with your help system. The information contained in the Tutorial’s Basics of UV-Visible Spectroscopy covers Basic Principles through to details of Derivative Spectroscopy. In addition, solutions to selected topics in UV-visible analysis are described. There you can find help on topics such as Enhancing Sensitivity or Determining Purity. 95 Using your Agilent 8453 UV-visible Spectroscopy System How Can I Get a Deeper Understanding of UV-visible Spectroscopy? More specific examples, including data, are available in the Examples section of the Standard Mode help. These can be used to run your Agilent ChemStation software for the special purpose described. 96 Using your Agilent 8453 UV-visible Spectroscopy System When Do I Have to Measure a Blank? When Do I Have to Measure a Blank? The measurement data acquired by your spectrophotometer is instrument-independent. To achieve this independency, a reference measurement must be performed. All consecutive measurements are referring to the last measured reference. In the Agilent ChemStation software, the reference measurement is combined with a baseline measurement. The baseline displayed is information about the quality of the current reference. In absorbance mode the data should be close to 0 AU and in transmission mode the data should be close to 100%. Typically reference measurements for dissolved samples are made on the cell filled with the solvent used. Here, in addition, the absorbance properties of the cell and the solvent are influencing the reference data. In wavelength ranges where your solvent or cell is absorbing, the noise of the baseline spectrum is high. Reliable sample data cannot be expected in these areas. Therefore new reference or blank measurements are required when • you change your measurement cell or its orientation relative to the measurement position • you use a different solvent or event a different lot of the same solvent • the time between your reference measurement and the sample measurement get too long • the time conditions are depending on the aging rate of your lamps and possible changes of your environmental conditions—typically the last blank measurement should not be older than half an hour. 97 Using your Agilent 8453 UV-visible Spectroscopy System When Do I Have to Measure a Blank? 98 Index Numerics 2,2,4-trimethylpentane, 48 A absorbance, 26 high, 57 absorbance maximum, 76 accessing lamps, 17 accessory slot, 17 accurate results, 43 acetic acid, 48 acetone, 48 acetonitrile, 48 acquisition date, 28 time, 28 active area, 21 active item, 21 active position, 21 Agilent 8453 general purpose UV-visible system, 57 Agilent ChemStation analysis panel, 60, 76 family, 23 graphical window, 69 log on, 59 measurement session, 57 method, 63 mode, 24 offline session, 59 online session, 59 password, 59 preview sizes, 75 print preview, 73 printer display, 75 samples, 71 session, 23 session online, 58 workstation, 32 analysis, 90 analysis panel, 20, 92 analysis setup calibration, 87 concentration unit, 87 data type, 87 display, 87 prompt for sample information, 87 wavelength, 87 analytes, 43 analytical task, 24 analyze, 63 apertured cells or cuvettes, 44 apertures, 50 application specific, 23 B background correction, 26, 27 Beer’s law, 85 benzene, 48 blank, 43, 51 blank push button, 15 bootp server, 57 bubble formation, 49 busy, 39 C caffeine, 60 CAG Bootp Server, 37, 39 calculate, 32 calculation results, 80 calibration, 27, 31, 85, 87 coefficients, 31 curve, 27 CAN connector, 17 carbon disulfide, 48 carbon tetrachloride, 48 cell path length, 80, 81, 83 cell changer, 83 chloroform, 48 cleaning cells, 46 collimated beam, 11 colloidal dispersions, 49 command, 20 common solvents, 48 compartment for sample, 12 concentration, 32 concentration range, 27 concept, 7 connection network, 8 connector CAN, 17 GPIB, 17 GPIO, 16 multicell transport, 16 remote, 16 RS232, 16 correction for stray light, 11, 12 current context, 20 current task, 22 cut-off filter, 49 cut-off wavelength, 49 cyclohexane, 48 cyclopentane, 48 D data, 28 absorbance, 85 access, 29, 30 archieve, 68 clear, 72 clear math. results, 72 clear standards, 72 evaluation, 30 file extension, 69 file information, 71 file name, 69 file selector box, 71 format, 68 load, 68 local storage, 68 network transfer, 68 removing, 72 replace, 69 retrieve, 68, 71 save, 68 save samples as, 68 saving selected data, 69 storage, 68 degassed, 49 derivative, 26 derivative spectroscopy, 95 description of instrument, 14 determining purity, 95 deuterium lamp, 11 development of an analytical method, 23 dialog fixed wavelength(s) parameters, 61 99 Index method options & information, 64 dimethyl formamide, 48 dimethyl sulfoxide, 48 diode array, 13, 32 door to access lamps, 17 dust, 49 E enhancing sensitivity, 95 entrapment of bubbles, 46 equation, 25, 30 ethyl acetate, 48 ethyl ether, 48 examples, 96 extinction coefficient, 33 layout, 10 mechanical assemblies, 10 warm up, 58 instrument panel, 20 instrument session, 23 internal reference, 26, 29 introduction system, 7 IP address, 37, 38, 39, 57 isopropyl alcohol, 48 J Jet Direct, 37 F filter for stray-light correction, 11, 12 fixed wavelength, 25, 26, 60 flow cell, 45 flow cells, 53 flow test, 82 front view of spectrophotometer, 14 G glass cells, 43 glycerol, 48 GPIB connector, 17 GPIO connector, 16 grating, 11, 13 H handling cells, 47 highest precision measurements, 45 holographic grating, 11, 13 homogeneity, 50 HPLC grade water, 49 I identity, 27 indicator, 15 installation, 37 installation qualification, 60 instrument construction, 10 description, 14 electronic assemblies, 10 100 L lamps, 11, 12 access through door, 17 deuterium, 11 tungsten, 11 LAN, 37 lens, 11 lens tissues, 46 levels of operation, 23 light beam, 44, 46 line power, 38 input socket, 17 switch, 14 liquid samples, 43 logged, 39 M main application window, 23 making measurements, 43 manager level, 23, 59 maximum, 25 measure standard, 89 standard information, 89 measure push buttons, 15 measurement blank, 57 noise, 57 reference, 57 sample, 58, 90 sample information, 91 menu, 20 message line, 39 methanol, 48 method, 24, 28, 31, 32, 63 calibrated, 33, 85 current, 66 information, 66 last used, 59 load, 65 load method, 65 modified, 65 name, 64 options & information, 64 parameter, 28 parameters, 63 print preview, 67 printing, 65, 67 report, 65 retrieve, 65 save method as, 63 store, 63 methyl formate, 48 minimum, 25 MIO board slot, 17 mode, 23 advanced, 24 color calculations, 24 combined reports, 24 dissolution testing, 24 execute advanced method, 24 kinetics, 24 last used, 59 multibath dissolution testing, 24 standard, 24, 60, 76, 85 switch, 24 thermal denaturation, 24 verification and diagnostics, 24, 92 mouse cursor, 21 multicell transport, 83 7-cell, 84 8-cell, 83 connector, 16 m-xylene, 48 N n-butyl alcohol, 48 network administrator, 37, 38 connection, 39 local, 57 Index n-hexane, 48 nominal spectral slit width, 13 O offline, 23 online, 23 operating system, 39 operation, 20 operation levels, 23 operator level, 23 operator name, 28 optical filter, 49 optical specifications of cells, 44 optical surfaces, 46 optical system, 10, 11 optimization, 32 outliers, 32 P paper orientation, 38 size, 38 parallelism, 44 parameter dialog, 76 particulate matter, 49 passivating new cells, 46 path length setup, 80 PC, 39 peak find, 77 performance verification, 92 photochemical reactions, 49 photodegradation, 50 photodiode array, 13 photosensitive substances, 49 pipette, 47 plasma discharge, 11, 12 plastic door, 17 plastic sample cells, 43 pointer symbol, 21 poor linearity, 44 poor photometric accuracy, 44 printer, 38, 39 configured, 73 processed spectra, 29 processing, 28 spectral, 29 standards, 30 pump peristaltic, 81 purity, 27 push buttons, 15 blank, 15 sample, 15 standard, 15 stop, 15 pyridine, 48 Q quantification, 25, 85 quantitative analysis of samples, 85 ready for analysis, 89 quartz sample cells, 43 R radiation source, 11 rapid absorbance changes, 50 ratio, 25 raw data, 28 rear view of spectrophotometer, 16 recalculation, 23 recommended cells, 45 reference, 39 remote connector, 16 report results, 73 result, 32 results, 29 precise, 58 routine work, 63 RS232C connector, 16 S sample, 43, 51 compartment, 12 push button, 15 sample cell, 43, 49 sample data, 30 sample information, 27 sample/result table, 62, 69, 79 sampling device, 20 sampling interval, 13 sampling system, 80 manual, 80 sipper, 81 security lever, 17 self test, 92 histories, 94 results, 94 start, 93 working conditions, 93 sensitivity, 44 session data analysis only, 23 instrument control, 23 set of parameters, 24 settings, 63 setup dialog, 20 sheet-metal door, 17 shine-through aperture, 11, 12 shutter, 11, 12 side panel, 20 signal to noise ratio, 50 single beam instrument, 43 sipper, 81 flow test, 82 parameter, 82 sipper system, 45 sipper/sampler system, 49 slit, 11, 13 slit width, 13 slots for MIO and accessory boards, 17 software general purpose, 8, 18 solute convection, 49 solution, 51 solution noise, 49 solutions, 95 determining purity, 95 enhancing sensitivity, 95 solvent, 43, 57 solvent suitability, 47 solvents, 47 source lens, 11, 12 source of radiation, 11 spectral acquisition, 27 spectral operation, 29 spectral processing, 30 spectral raw data, 33 spectrograph, 13 101 Index lens, 11 slit, 11 spectrophotometer, 32, 37 front view, 14 rear view, 16 spectroscopy system, 8 spectrum, 25 standard, 27, 30 external, 92 standard cells, 53 standard push button, 15 standard single-cell cell holder, 53 standards, 85 current, 31 minimum required number, 32 number of, 32 status, 39 status indicator, 15 stirring, 49 stirring module, 50 stop push button, 15 stoppered sample cell, 48 stray light, 14 stray-light correction, 11, 12 sulfuric acid, 48 symbol, 20 T task fixed wavelength, 25, 26, 60 orientation, 25 quantification, 25, 27, 85 quantitative analysis, 85 ratio/equation, 25, 27, 30 spectrum/peaks, 25, 26 TCP/IP protocol, 38 temperature control, 49 test kit, 27 thermostattable cell holder, 50 three point drop line, 26, 29 toluene, 48 tool bar, 20 transmittance, 26 tungsten lamp, 11 tutorial basic principles, 95 basics of UV-visible spectroscopy, 95 derivative spectroscopy, 95 102 U understanding Agilent ChemStation processing, 28 used wavelength, 29 useful wavelength range of solvents, 48 user definable equation, 27 user interface basic elements, 19 UV grade water, 49 UV-visible spectroscopy basics, 95 V valley find, 77 view, 22, 25 calibration, 85 results, 85, 91 samples, 62, 79 standards, 85 viscous solutions, 50 volatile solvents, 48 volume, 27 W warning no results present!, 74 water, 48 wavelength, 29 wavelength reproducibility, 33 wedge shaped cells, 44 weight, 27 width of slit, 13 window, 22 graphical, 22 sample/results table, 29 tabular, 22 s1 In This Book To be able to use your new Agilent 8453 UV-visible spectroscopy system quickly, this book gives you step-wise procedures and examples for basic operations and tasks. "(&& "(&& G1115-90019


