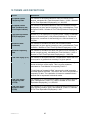
1
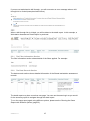
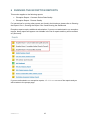
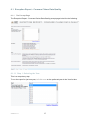
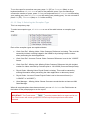
Work Health and Safety Reporting
User Manual
Version 1.0
CONTENTS
1
WHS REPORTING IN ANU INSIGHT ........................................................................................................... 1
2
ACCESSING ANU INSIGHT ........................................................................................................................ 1
2.1
2.2
2.3
3
NAVIGATING TO THE REPORT .................................................................................................................. 3
3.1
3.2
3.3
4
ACCESSING WHS REPORTING IN ANU INSIGHT ............................................................................................... 2
CROSS-BROWSER COMPATIBILITY.................................................................................................................. 2
LOGGING INTO ANU INSIGHT ....................................................................................................................... 2
THE INSIGHT HOMEPAGE ............................................................................................................................. 3
NAVIGATING TO THE WHS REPORT ............................................................................................................... 3
INITIATING THE REPORT ............................................................................................................................... 5
RUNNING THE REPORT: PART 1 ............................................................................................................... 6
4.1
THE PROMPT PAGE .................................................................................................................................... 6
4.1.1 Step 1: Selecting Year(s) .................................................................................................................... 7
4.1.2 Step 2: Selecting Area(s) ................................................................................................................... 8
4.1.3 Step 3: Finishing ................................................................................................................................ 9
4.2
THE REPORT PAGE ..................................................................................................................................... 9
4.3
DRILLING THROUGH TO A DETAIL REPORT ..................................................................................................... 10
4.3.1 The Filter Information Section......................................................................................................... 11
4.3.2 The Data Records Section ............................................................................................................... 11
5
RUNNING THE REPORT: PART 2 ............................................................................................................. 12
5.1
THE PROMPT PAGE .................................................................................................................................. 12
5.2
THE REPORT PAGE ................................................................................................................................... 13
5.3
DRILLING THROUGH TO A DETAIL REPORT ..................................................................................................... 14
5.3.1 The Filter Information Section......................................................................................................... 15
5.3.2 The Data Records Section ............................................................................................................... 15
6
RUNNING THE EXCEPTION REPORTS ...................................................................................................... 16
6.1
EXCEPTION REPORT – COMCARE CLAIMS DATA QUALITY ................................................................................. 17
6.1.1 The Prompt Page ............................................................................................................................ 17
6.1.2 The Report Page.............................................................................................................................. 19
6.2
EXCEPTION REPORT – PROCESS QUALITY ...................................................................................................... 20
6.2.1 The Prompt Page ............................................................................................................................ 20
6.2.2 The Report Page.............................................................................................................................. 22
6.3
EXCEPTION REPORT – INCOMPLETE INCIDENT RECORDS ................................................................................... 23
6.3.1 The Prompt Page ............................................................................................................................ 23
6.3.2 The Report Page.............................................................................................................................. 24
7
RUNNING THE DASHBOARD .................................................................................................................. 25
7.1
THE PROMPT PAGE .................................................................................................................................. 25
7.2
THE INCIDENTS, CLAIMS & LOST TIME INJURIES DASHBOARD ........................................................................... 26
7.3
THE INCIDENTS & ACCEPTED CLAIMS BY INJURY MECHANISM & AREA DASHBOARD.............................................. 28
7.3.1 General Operations ......................................................................................................................... 28
7.3.2 Special Drill-Through: Incidents Count by College/Service Division Chart....................................... 29
7.4
THE INCIDENTS & AREAS CROSSTAB DASHBOARD ........................................................................................... 31
7.5
APPLYING DIFFERENT CRITERIA TO THE DASHBOARD ....................................................................................... 31
Version 1.0
8
RUNNING THE SAME REPORT WITH DIFFERENT OPTIONS ..................................................................... 32
9
ADDITIONAL FUNCTIONALITIES ............................................................................................................. 33
9.1
ADDITIONAL FUNCTIONALITIES FOR DASHBOARDS .......................................................................................... 33
9.1.1 Printing the Dashboard ................................................................................................................... 33
9.1.2 Exporting Tables and Figures .......................................................................................................... 33
9.2
ADDITIONAL FUNCTIONALITIES FOR REPORTS ................................................................................................. 34
10
TERMS AND DEFINITIONS ...................................................................................................................... 35
Version 1.0
1 WHS REPORTING IN ANU INSIGHT
Work Health and Safety (WHS) Reporting in ANU Insight includes a set of dashboards and
reports based on key WHS-related measures and statistics for managing and enhancing the
University’s work environment. In particular, WHS Reporting contains:
•
•
a set of graphical dashboards, summary reports (aggregate level) and detail reports
(record level with full incident, claim and personal details) that provide users with key
WHS indicators and statistics for one or more given years and areas.
several exception reports that help approved users identify data and process issues
associated with incidents and claims reporting and management.
2 ACCESSING ANU INSIGHT
IMPORTANT: When using Internet Explorer, please ensure that Compatibility View is
turned ON. To do so:
And add anu.edu.au to the list:
Version 1.0
1
2.1 Accessing WHS Reporting in ANU Insight
To obtain access to WHS reporting in ANU Insight, you need to complete the user access
request form and email the form to [email protected]. The user access request form can
be downloaded from the access page.
Further information for accessing ANU Insight can also be found on the access page.
Access arrangements for this system are undertaken in accordance with the University's
Privacy Policy.
2.2 Cross-Browser Compatibility
Because of the cross-browser compatibility issues caused by some of the ANU Insight
system components, the WHS dashboards and reports are best viewed in the latest version
of Internet Explorer with compatibility view turned on for anu.edu.au. Other Internet
browsers, such as Chrome and Firefox, may be used but you may encounter some
formatting issues (e.g. crosstab column header formatting).
2.3 Logging into ANU Insight
The WHS Report is accessed the ANU Insight:
https://insight.anu.edu.au
Single sign-on has been enabled so most users will be automatically directed to the portal
page without the need to provide login credentials when using ANU computers.
Hint: The single sign-on may not work and an error message may appear if you have signed
into other ANU enterprise systems (e.g. HRMS) or local intranet with a different domain to
UDS (e.g. CBE\u1234567 instead of UDS\u1234567) using the same browser session.
Please sign out and close all browser windows to clear existing credentials, open a new
browser window and then visit https://insight.anu.edu.au again.
A small number of users may be prompted to enter a username and password because of
their network configurations or the browser they are using. If you are one of the few users
affected, please log in with your UDS/HORUS user ID and password in the following format:
User Name: UDS\User ID (e.g. UDS\u1234567)
Password: your UDS or HORUS password
Hint: Use a backslash between “UDS” and “u1234567” instead of a forward slash.
Instructions on how to do this can be found here How to log into ANU Insight or if you are
experiencing issues please contact the ANU Insight team on team on:
Email: [email protected]
Phone: +61 2 6125 8649
Version 1.0
2
3 NAVIGATING TO THE REPORT
3.1 The Insight Homepage
When you first access ANU Insight, you will be directed to the portal home page:
The portal is available and has been tested on Mac, PC and mobile devices and for different
versions of various web browsers. However, if you experience any issues in terms of how
the portal renders or functions, please contact us on [email protected]. For a full list of
supported web browsers, please refer to the frequently asked questions at FAQ ANU Insight.
Detailed information on how to navigate all the functionalities available to ANU Insight users
is available at http://unistats.anu.edu.au/anu-insight/.
3.2 Navigating to the WHS Report
The navigation menu shown below is how you navigate to report content.
To access the WHS Report first left click once on the Human Resources menu header on
the navigation menu:
Version 1.0
3
This would open and display the Human Resources submenu:
The WHS Report can be found on the Work Health & Safety page. Left click once on the
submenu item called Work Health & Safety:
This would take you to the Work Health & Safety page:
Version 1.0
4
3.3 Initiating the Report
A list of WHS reports can be seen on the left hand side of the screen:
If you see that the name of a report ends with “(Secured)” and that the report is not clickable,
it means that you do not have access to the report.
To initiate one of the reports, left click once on the report name.
Version 1.0
5
4 RUNNING THE REPORT: PART 1
This section applies to the following reports:
•
•
•
•
•
Incident Summary Report
Lost Time Injuries Summary Report
WHS Key Measures Report
WHS Training Summary Report
Workers Compensation Claims Summary Report
For instructions for running other reports not found in the list above, please refer to Running
the Report: Part 2, Running the Exception Reports and Running the Dashboard.
4.1 The Prompt Page
The first thing you will see after initiating the report is the prompt page of the selected report.
The prompt page will look similar to the following:
The prompt page is designed to allow you to specify the year(s) and area(s) for running the
selected WHS report.
Version 1.0
6
4.1.1
Step 1: Selecting Year(s)
This is a compulsory step.
The report can be run for one or more calendar years. To run the report for just one year, left
click once on the preferred year in the Year list box:
To run the report for more than one year, press Ctrl (PC) or Command (Mac) on your
keyboard and left click once on each of the preferred years. If you are selecting a
consecutive number of years, press Shift on your keyboard and left click once on the starting
year (ending year), then left click once on the ending year (starting year). You do not need to
press Ctrl (PC), Command (Mac) or Shift while scrolling:
Version 1.0
7
4.1.2
Step 2: Selecting Area(s)
This is a compulsory step.
The report can be run for one or more college(s)/services division(s), depending on the
access level you have been granted. To run the report for all colleges and service divisions,
left click once the ‘Select all’ link at the bottom of the College/Service Division list box:
To run the report for one college/service division, left click once the preferred college/service
division.
To run the report for multiple colleges/service divisions, press Ctrl (PC) or Command (Mac)
on your keyboard and then left click once on each of the preferred colleges/service divisions.
If you are selecting a consecutive number of colleges/service divisions, press Shift on your
keyboard and left click once on the starting college/service division (ending college/service
division), then left click once on the ending college/service division (starting college/service
division). You do not need to press Ctrl (PC), Command (Mac) or Shift while scrolling:
Version 1.0
8
4.1.3
Step 3: Finishing
When all required options have been selected, you can left click once the Finish button at
the bottom of the prompt page to run the report.
IMPORTANT: The Finish button
must be pressed before a report can be run.
The Finish button will remain greyed out until all required prompts have valid values
selected.
After clicking the Finish button, you may see a dialogue like this:
When ANU Insight has processed your report, the dialogue will disappear and the report will
be displayed.
4.2 The Report Page
The summary report will look similar to the following:
Note: Mock-up data used.
Version 1.0
9
For the example above, the table shows the number of incidents by mechanism of injury and
by year, as suggested by the table title:
Please note that a summary report may have more than one page, because of the way it is
designed and organised. To navigate through different pages of the summary report, left
click once on the navigation buttons at the bottom left corner of the browser window:
takes you to the first page of the report
allows you to scroll up to the previous page
allows you to scroll down to the next page
takes you to the last page of the report
Greyed-out ‘Top’ and ‘Page up’ buttons imply that you are already at the first page of the
report, while greyed-out ‘Bottom’ and ‘Page down’ buttons imply that you are already at the
last page of the report.
For example, in the Incident Summary Report, the first page displays the Incidents by
Mechanism table, while the second page displays the Incident by Type table, which is
followed by other tables on subsequent pages.
4.3 Drilling Through to a Detail Report
Detail reports provide full claims, incident and personal details, therefore drilling through
from summary reports to detail reports requires authorisation from the Human Resources
Division. Your ability to drill through is determined and authorised by the Work Environment
Group by considering the information you provide in your Access Request Form.
Whenever you see underlined blue words and numbers in WHS Reporting that look like a
hyperlink, it means that these words and numbers are clickable and they will take you to a
detail report that shows information at record level. This is referred to as ‘drill-through’:
Note: Mock-up data used.
Version 1.0
10
If you are not authorised to drill through, you will encounter an error message when a drillthrough link is clicked (example shown below).
When a drill-through link is clicked, you will be taken to the detail report. In this example, an
Incident Detail Report is produced:
4.3.1
The Filter Information Section
The filter information section shows details of the filters applied. For example:
4.3.2
The Data Records Section
The data records section shows detailed information of the filtered incidents:
Note: Mock-up data used.
The detail report may have more than one page. You can use the same logic as you would
for the summary report to navigate through the detail report.
To run the same report again using different options, please see the Running the Same
Report with Different Options (page 32).
Version 1.0
11
5 RUNNING THE REPORT: PART 2
This section applies to the following report(s):
•
Workstation Assessment Summary Report
For instructions for running other reports not found in the list above, please refer to Running
the Report: Part 1, Running the Exception Reports and Running the Dashboard.
5.1 The Prompt Page
At present, running the Workstation Assessment Summary Report only requires the
specification of year(s):
This is a compulsory step.
To run the report for just one year, left click once on the preferred year in the Year list box:
To run the report for more than one year, press Ctrl (PC) or Command (Mac) on your
keyboard and then left click once on each of the preferred years. If you are selecting a
consecutive number of years, press Shift on your keyboard and left click once on the starting
year (ending year), then left click once on the ending year (starting year). You do not need to
press Ctrl (PC), Command (Mac) or Shift while scrolling.
Version 1.0
12
When all required options have been selected, you can left click once the Finish button at
the bottom of the prompt page to run the report.
IMPORTANT: The Finish button
must be pressed before a report can be run.
The Finish button will remain greyed out until all required prompts have valid values
selected.
After clicking the Finish button, you may see a dialogue like this:
When ANU Insight has processed your report, the dialogue will disappear and the summary
report will be displayed.
5.2 The Report Page
The summary report will look like the following:
Note: Mock-up data used.
Version 1.0
13
For the example above, the table shows the number of workstation assessment by type of
referral, as suggested by the table title:
Please note that a summary report may have more than one page, because of the way it is
designed and organised. To navigate through different pages of the summary report, left
click once on the navigation buttons at the bottom left corner of the browser window:
takes you to the first page of the report
allows you to scroll up to the previous page
allows you to scroll down to the next page
takes you to the last page of the report
Greyed-out ‘Top’ and ‘Page up’ buttons imply that you are already at the first page of the
report, while greyed-out ‘Bottom’ and ‘Page down’ buttons imply that you are already at the
last page of the report.
For example, in the Workstation Assessment Summary Report, the first page displays the
Assessment by Referral table, while the second page displays the Assessment by Risk
table, which is followed by other tables on subsequent pages.
5.3 Drilling Through to a Detail Report
Detail reports provide full claims, incident and personal details, therefore drilling through
from summary reports to detail reports requires authorisation from the Human Resources
Division. Your ability to drill through is determined and authorised by the Work Environment
Group by considering the information you provide in your Access Request Form.
Whenever you see underlined blue words and numbers in WHS Reporting that look like a
hyperlink, it means that these words and numbers are clickable and they will take you to a
detail report that shows information at record level. This is referred to as ‘drill-through’:
Note: Mock-up data used.
Version 1.0
14
If you are not authorised to drill through, you will encounter an error message when a drillthrough link is clicked (example shown below).
When a drill-through link is clicked, you will be taken to the detail report. In this example, a
Workstation Assessment Detail Report is produced:
5.3.1
The Filter Information Section
The filter information section shows details of the filters applied. For example:
5.3.2
The Data Records Section
The data records section shows detailed information of the filtered workstation assessment
records:
Note: Mock-up data used.
The detail report may have more than one page. You can use the same logic as you would
for the summary report to navigate through the detail report.
To run the same report again using different options, please see the Running the Same
Report with Different Options (page 32).
Version 1.0
15
6 RUNNING THE EXCEPTION REPORTS
This section applies to the following reports:
•
•
Exception Report - Comcare Claims Data Quality
Exception Report - Process Quality
For instructions for running other reports not found in the list above, please refer to Running
the Report: Part 1, Running the Report: Part 2 and Running the Dashboard.
Exception reports require additional authorisation. If you are not authorised to run exception
reports, these reports will appear non-clickable in the list of reports and they will be marked
as “(Secured)”.
If you are authorised to run exception reports, left click once on one of the reports and you
will be taken to the prompt page.
Version 1.0
16
6.1 Exception Report – Comcare Claims Data Quality
6.1.1
The Prompt Page
The Exception Report - Comcare Claims Data Quality prompt page looks like the following.
6.1.1.1 Step 1: Selecting the Year
This is a compulsory step.
To run the report for just one year, left click once on the preferred year in the Year list box:
Version 1.0
17
To run the report for more than one year, press Ctrl (PC) or Command (Mac) on your
keyboard and then left click once on each of the preferred years. If you are selecting a
consecutive number of years, press Shift on your keyboard and left click once on the starting
year (ending year), then left click once on the ending year (starting year). You do not need to
press Ctrl (PC), Command (Mac) or Shift while scrolling.
6.1.1.2 Step 2: Selecting the Exception Type
This is a compulsory step.
To select an exception type, left click once on one of the radio buttons or exception type
titles.
Each of the exception types are explained below.
•
Claim Cust Ref - Missing Value: Claim Customer Reference is missing. This could be
caused by incident not being lodged in the HRMS or by missing incident number
when processing the claim application.
•
Claim Cust Ref - Incorrect Format: Claim Customer Reference is not in the '1234567'
format.
•
Claim Cust Ref - Missing Link: Missing Claim Customer Reference link with incident
number for claims received by Comcare prior to 14/11/2000 (Comcare Receipt Date).
•
Payroll Code - Missing Value: Payroll Code is missing. This could be caused by
missing information when processing the claim application or data entry issues.
•
Payroll Code - Incorrect Format: Payroll Code is not in the correct format (i.e.
'u1234567' or 'a1234567').
•
Case Manager – Missing Value: Shows Comcare records that do not have an ANU
Case Manager.
When all required options have been selected, you can left click once the Finish button at
the bottom of the prompt page to run the report.
IMPORTANT: The Finish button
must be pressed before a report can be run.
The Finish button will remain greyed out until all required prompts have valid values
selected.
Version 1.0
18
After clicking the Finish button, you may see a dialogue like this:
When ANU Insight has processed your report, the dialogue will disappear and the summary
report will be displayed.
6.1.2
The Report Page
The detail report will look like the following:
The filter information section shows details of the filters applied. For example:
The data records section shows detailed information of the filtered records:
Note: Mock-up data used.
The detail report may have more than one page. You can use the same logic as you would
for the summary report to navigate through the detail report. Moreover, due to the amount of
information that a Comcare record could have, you may need to scroll horizontally to see all
the data columns.
To run the same report again using different options, please see the Running the Same
Report with Different Options (page 32).
Version 1.0
19
6.2 Exception Report – Process Quality
6.2.1
The Prompt Page
The prompt page looks like the following.
Version 1.0
20
6.2.1.1 Step 1: Selecting the Year
This is a compulsory step.
To run the report for just one year, left click once on the preferred year in the Year list box:
To run the report for more than one year, press Ctrl (PC) or Command (Mac) on your
keyboard and then left click once on each of the preferred years. If you are selecting a
consecutive number of years, press Shift on your keyboard and left click once on the starting
year (ending year), then left click once on the ending year (starting year). You do not need to
press Ctrl (PC), Command (Mac) or Shift while scrolling.
6.2.1.2 Step 2: Selecting the Exception Type
This is a compulsory step.
To select an exception type, left click once on one of the radio buttons or exception type
titles.
Each of the exception types is described below:
•
Case Manager HRMS-Comcare Consistency: Checks whether case manager
recorded in the HRMS is the same as the case manager recorded by Comcare.
•
Open/Reopened Claim Age: Open/Reopened claims that have an age of greater than
one year (from the year a claim was opened/reopened until current year).
•
Incident Report Date Later than Comcare Receipt Date: Incident reported AFTER the
claim application has been lodged with Comcare.
•
Injury and Illness Incidents without a Person: Every injury and illness incident must
have a person associated with the incident.
Version 1.0
21
•
Incident Status not updated After Completion of Screening: Incident records have not
been updated after completion of screening by a case manager.
When all required options have been selected, you can left click once the Finish button at
the bottom of the prompt page to run the report.
IMPORTANT: The Finish button
must be pressed before a report can be run.
The Finish button will remain greyed out until all required prompts have valid values
selected.
After clicking the Finish button, you may see a dialogue like this:
When ANU Insight has processed your report, the dialogue will disappear and the detail
report will be displayed.
6.2.2
The Report Page
A detail report will look similar to the following:
The detail report may have more than one page. You can use the same logic as you would
for the summary report to navigate through the detail report. Moreover, due to the amount of
information that a Comcare record could have, you may need to scroll horizontally to see all
the data columns.
To run the same report again using different options, please see the Running the Same
Report with Different Options (page 32).
Version 1.0
22
6.3 Exception Report – Incomplete Incident Records
6.3.1
The Prompt Page
The prompt page looks like the following.
6.3.1.1 Step 1: Selecting the Year
This is a compulsory step.
To run the report for just one year, left click once on the preferred year in the Year list box:
To run the report for more than one year, press Ctrl (PC) or Command (Mac) on your
keyboard and then left click once on each of the preferred years. If you are selecting a
consecutive number of years, press Shift on your keyboard and left click once on the starting
year (ending year), then left click once on the ending year (starting year). You do not need to
press Ctrl (PC), Command (Mac) or Shift while scrolling.
Version 1.0
23
6.3.1.2 Step 2: Selecting the Exception Type
This is a compulsory step.
To select an exception type, left click once on one of the radio buttons or exception type
titles.
This exception report will list incident records containing empty fields for Incident Date,
Incident Situation, Reported By, Date Reported, Person Involved, Person Type, Dept of
Person Involved, Nature of Injury/Disease, Body Part, Mechanism of Incident, and Agency of
Injury/Disease. Missing values in any of these fields may indicate issues in data entry and
updating.
6.3.2
The Report Page
A detail report will look similar to the following:
The detail report may have more than one page. You can use the same logic as you would
for the summary report to navigate through the detail report. Moreover, due to the amount of
information that a Comcare record could have, you may need to scroll horizontally to see all
the data columns.
To run the same report again using different options, please see the Running the Same
Report with Different Options (page 32).
Version 1.0
24
7 RUNNING THE DASHBOARD
This section applies to the following reports:
•
WHS Reporting Dashboard
For instructions for running other reports not found in the list above, please refer to Running
the Report: Part 1, Running the Report: Part 2 and Running the Exception Reports.
7.1 The Prompt Page
The WHS Dashboard prompt page will look like the following:
The dashboard needs both year and area information to run. Hence, you need to specify the
year(s) and area(s) that you want to investigate on the prompt page by ticking relevant
checkboxes. Left click once the ‘Submit’ button when the required options have been
selected.
Hint: Due to system limitation, you need to click one of the dashboard tabs at the bottom of
the browser window after clicking the “Submit” button to navigate to a dashboard.
There are three graphical dashboards:
•
•
Incidents, Claims & Lost Time Injuries
Incidents & Accepted Claims by Injury Mechanism & Area
Version 1.0
25
•
Incidents & Areas Crosstab
7.2 The Incidents, Claims & Lost Time Injuries Dashboard
To navigate to this dashboard, Left click once the ‘Incidents, Claims & Lost Time Injuries’ tab
at the bottom of the browser window. The dashboard will then be displayed:
Hovering your mouse pointer over a data point will show detailed information:
If a magnifier icon appears on the bottom right corner of a chart, when you click the icon you
will be taken to a dedicated page with a larger chart and a crosstab containing summarised
information and drill-through links.
Again, drilling through from summary reports to detail reports requires authorisation from the
Human Resources Division. Your ability to drill through is determined and authorised by the
Work Environment Group by considering the information you provide in your Access
Version 1.0
26
Request Form. If you are not authorised to drill through, you will encounter an error message
when a drill-through link is clicked (example shown below).
If you are authorised to drill through and you click the magnifier icon in the ‘Incidents Count
(Cumulative)’ chart:
You will be shown a new page that looks like the following:
Version 1.0
27
You can click the drill-through hyperlinks to reach the detail report. The detail report will be
opened in a new window/tab. Please refer to previous sections on using the detail report.
7.3 The Incidents & Accepted Claims by Injury Mechanism & Area
Dashboard
7.3.1
General Operations
To navigate to this dashboard, Left click once the ‘Incidents & Accepted Claims by Injury
Mechanism & Area’ tab at the bottom of the browser window. The dashboard will then be
displayed:
Some of the charts may show only a single bar. This is because your access level has been
restricted to view information only relevant to your local area.
For any of the four charts, clicking on the vertical axis names will allow you to drill through to
the detail report. Drilling through from summary reports to detail reports requires
authorisation from the Human Resources Division. Your ability to drill through is determined
and authorised by the Work Environment Group by considering the information you provide
in your Access Request Form. If you are not authorised to drill through, you will encounter an
error message when a drill-through link is clicked (example shown below).
Version 1.0
28
For example, if you want to examine the incidents associated with body stressing in the
years selected, left click once ‘Body Stressing’ on the vertical axis and the detail incident
report will be opened in a new window/tab:
Note: Mock-up data used.
Similarly, you can left click once the name of an area in the ‘Incidents by College/Service
Division’ chart to view all incidents related to that area in the selected years, or left click once
Body Stressing in the Accepted Claims by Mechanism to view all accepted body stressing
claims for the years and areas selected.
Please refer to previous sections on using the detail report.
7.3.2
Special Drill-Through: Incidents Count by College/Service Division Chart
The Incidents Count by College/Service Division chart allows you to drill through to a special
detail report, given that you are authorised to perform drill-through actions. To drill through
from this chart, left click once on the name of one of the areas on vertical axis:
Note: Mock-up data used.
Version 1.0
29
You will then be taken to a detail report that shows details by departments, which looks like
the following:
Note: Mock-up data used.
Because this detail report has more than one page, please use the navigation buttons at the
lower left corner of you browser window to navigate through pages.
Version 1.0
30
7.4 The Incidents & Areas Crosstab Dashboard
To navigate to this dashboard, left click once the ‘Incidents & Areas Crosstab’ tab at the
bottom of the browser window. The dashboard will then be displayed like the following:
If your access level has been restricted to view information only relevant to your own area,
you will see only one column in this chart.
The chart displays the number of incidents by mechanism of injury and college/service
division. The chart is a heat map by design, meaning that the higher the number of incidents
in an area for a specific type of incident for the years selected, the darker the red will be.
This design enables the users to identify areas that may require attentions quickly.
The chart contains drill-through hyperlinks. When clicked, you will be taken to a special detail
incident report in a new windows/tab. Please refer to Section 7.3.2 for using this special
detail report.
7.5 Applying Different Criteria to the Dashboard
To apply different criteria to the dashboard, such as different years and areas, left click once
the ‘Prompts’ tab at the bottom of the browser window and you will be taken to the prompt
page to specify your new criteria.
Please click the ‘Submit’ button when finished specifying new report criteria, and then click
one of the dashboard tabs to view the updated diagrams.
Version 1.0
31
8 RUNNING THE SAME REPORT WITH DIFFERENT
OPTIONS
To run the same report but with different options, left click once the
button at the upper
right corner of your browser window when you are in a summary report:
You will be taken back to the prompt page on which you can specify a different combination
of options.
Version 1.0
32
9 ADDITIONAL FUNCTIONALITIES
9.1 Additional Functionalities for Dashboards
Once the dashboard is run, you can print any tab of the dashboard and export tables or
figures.
9.1.1
Printing the Dashboard
To print a dashboard tab, press the printer icon at the top of the browser window and follow
the instructions:
9.1.2
Exporting Tables and Figures
To export tables and figures in the dashboard to PDF or Excel files, left click once on the
table or figure that you want to export. A menu will appear on top of the table or figure:
Left click once the leftmost icon on the menu and select “Export to”:
•
•
•
To export the table or figure to a PDF file, select the “PDF” option.
To export the table of figure to an Excel file, select the “Excel 2007” option. “Excel
2002” option can also be selected for compatibility reasons.
To export the underlying data supporting the table of figure, select the “CSV” option.
Note: Tables and figures cannot be exported using the “Excel 2007 Data” option. If you do
so an error message will occur.
Version 1.0
33
9.2 Additional Functionalities for Reports
Once a report is generated, you can Save, Print, Send or Annotate (change) the Report.
•
If you wish to Save, Print or Send the report, it is best to re-run the report in PDF format.
•
If you wish to change the Report or use part of the report information, it is best to re-run
the report in Excel Format.
•
To run the report into other output formats like PDF or Excel you will need to access the
Report Output button which can be found on the Report Action Menu:
The ‘Report Output’ button will look like
Excel icon depending on the format chosen.
by default but will change to show a PDF or
The ‘Report Output’ button allows report users to change the output format of the report. If
you left click once on the down-facing arrow next to the report action button the output
format choice menu will appear.
The report can be run in HTML, PDF, XML or Excel. On most computers, there will be four
alternative Excel output formats.
•
PDF is the preferred output format for email, distribution, saving and printing. Once the
report has been generated as a PDF it is pre-formatted for printing, pagination is handled
correctly and it can be distributed without risk of numbers being easily over-written.
•
Excel is the best format if a user wants to make notes or incorporate additional data.
There are four options to choose from explained below:
Excel 2007 Data
Choose this option if you want a data-only, no-formatting report.
Excel 2007 Format
Choose this option if you want to retain the formatting of the
report.
Excel 2002
Choose this option if you have an older version of Microsoft
Excel.
View in CSV Format
Choose this option if you want a data-only, no-formatting report
in comma-separated format.
Version 1.0
34
10 TERMS AND DEFINITIONS
Terms
Definitions
Accepted Claims
Frequency Rate
The number of accepted claims for each one million hours
worked, calculated as (Total Accepted Claims / (1820 x Number
of Full-Time Equivalent Employees)) x 1,000,000.
Accepted Claims
Rate (incidence rate
for accepted claims)
The number of accepted claims for each one hundred workers
employed in a given period (usually a year), calculated as (Total
Accepted Claims / Number of Full-Time Equivalent Employees)
x 100.
Full-Time Equivalent
(FTE) Employees
Number of FTE employees in a given period, usually a calendar
year or a financial year. A full-time equivalence of 1 is the unit
assigned to a member of staff working on a full-time basis for a
full year.
Incidence Rate
(Incidents)
The number of incidents for each one hundred workers
employed in a given period (usually a year), calculated as (Total
Incidents / Number of Full-Time Equivalent Employees) x 100.
Incident Frequency
Rate
The number of incidents for each one million hours worked in a
period (usually a year), calculated as (Total Incidents / (1820 x
Number of Full-Time Equivalent Employees)) x 1,000,000.
Lost Time Injury (LTI)
The number of accepted workers’ compensation claims with lost
time equal to or greater than one day in a given period.
Lost Time in Days
The total number of workdays lost for accepted claims in a given
period at the time of the report. This is a proxy measure,
calculated as Total Weeks of Incapacity Paid x 5.
“Total Weeks of Incapacity Paid” concerns the total incapacity
recorded against the claim. This field is the sum of all periods of
incapacity to date. The calculation is based on standard hours
worked and is expressed in decimal weeks.
Lost Time Injury
Frequency Rate
(LTIFR)
The number of LTI for each one million hours worked in a given
year, calculated as (Total LTI / (1820 x Number of Full-Time
Equivalent Employees)) x 1,000,000.
Lost Time Injury
Incidence Rate
(LTIIR)
The number of LTI for each one hundred workers employed in a
given period (usually a year), calculated as (Total LTI / Number
of Full-Time Equivalent Employees) x 100.
Version 1.0
35