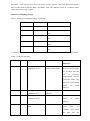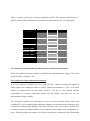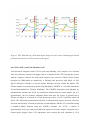
1
The Southern Ocean Seasonal Cycle Experiment (SOSCEx) Summer Cruise Report MV SA Agulhas - Voyage 004b 15 February – 11 March 2013 Participants: Dr Sandy Thomalla (Chief Scientist), Craig Atwood, Ghosain Baderoen, Sinekhaya Bilana, Emma Bone, Ashley Botha, Marcel Du Plessis, Alistair Fyfe, MichaelJohn Gibberd, Amy Harington, Natasha Horsten, Warren Joubert, Nina Lester, Delphine Lobelle, Dr Thato Mtshali, Derek Needham, Leletu Nohayi, Kirsten Packer, Fiona PrestonWhyte, Dr Eric Rehm, Raimund Rentel, Sandi Smart, Jean-Pierre Smit, Bjorn von der Heyden Principle investigators and contact details: *Dr Pedro Monteiro: [email protected], *Dr Sandy Thomalla: [email protected], *Dr Thato Mtshali: [email protected], *^ Dr Sebastiaan Swart: [email protected], ^Dr Howard Waldron: [email protected], ^Dr Mike Lucas: [email protected], ^Dr Isabelle Ansorge: [email protected], ^^Prof Roy Roychoudhury: [email protected] Affiliation: *CSIR Natural Resources and the Environment, P.O. Box 320, Stellenbosch 7599, ^Department of Oceanography, UCT, Rondebosch, 7701, ^^Department of Earth Sciences, Stellenbosch University Research Programmes: Seasonal Cycle of Carbon in the Southern Ocean SNA2011112600001, Biological response to physics using bio-optics (SNA2011120800004), Fe, light limitations in Antarctic phytoplankton (SNA2011120600005), Coccolithophore calcification rates (SNA2011120100007), Bioactive elements in Southern Ocean (SNA2011110100001), Nitrification rates in the Southern Ocean - EU FP7 Greenseas, Grant Agreement Number 265294, Stratification dynamics in the Southern Ocean mixed layer: a high resolution approach, South Atlantic Meridional Overturning Circulation SA (SAMOCSA). 1. Scientific Rationale The Southern Ocean is arguably the main source of medium-term uncertainty in terms of the effectiveness of global CO2 mitigation plans. The reason for this is that the Southern Ocean plays both an important role in the uptake of anthropogenic CO2 (50% of all ocean uptake) as well as in the very large (90 Gt/Cy) natural CO2 exchange between the oceans and the atmosphere. The Southern Ocean is the only region where deep-ocean CO2 reservoirs (38 000 Gt C) exchange directly with the smaller atmospheric reservoir (700 Gt C). Moreover, although 85% of all ocean productivity is supported by nutrients derived from the Southern Ocean, little is known about the sensitivity of these carbon and nutrient fluxes to climate change driven adjustments or – most importantly – at what scales these links couple. One of the important gaps in the reliable prediction of the response of the Southern Ocean carbon cycle to climate change is its sensitivity to seasonal, subseasonal forcings (in time) and mesoscales (in space). 1.1 The Southern Ocean Seasonal Cycle Experiment The Southern Ocean Carbon and Climate Observatory (SOCCO), a CSIR-led consortium, has conceptualised the Southern Ocean Seasonal Cycle Experiment (SOSCEx), a new type of large-scale experiment that reflects a shift from the historical focus on ship-based descriptive Southern Ocean oceanography and living resource conservation, to a system-scale dynamics study spanning much greater time and space scales. The seasonal cycle is one of the strongest modes of variability in the carbon cycle of the Southern Ocean. Additionally it reflects the coupling between climate forcing and important ecosystem responses, such as productivity. However, climate forecast models are not able to reflect this seasonal timing reliably, which casts some doubt about our understanding of the scales at which climate and biogeochemistry are linked in the Southern Ocean. Uncertainties in the understanding of the sensitivities of the biogeochemical cycles to changes in the climate forcing factors, hampers our ability to understand long-term trends in the effectiveness of the Southern Ocean as a carbon sink. There is thus a need for an experiment that focus on these scales and on the links between the physical forcing mechanisms and biogeochemical responses over the whole seasonal cycle. For SOSCEx, it is hypothesised that climate change signals will be reflected in changes to the magnitude, timing and persistence of the seasonal cycle in mixed-layer physics and biogeochemistry and, in particular, the carbon cycle. For this reason, we propose that a highresolution approach to advancing our understanding of the coupling of carbon and climate over an entire seasonal cycle will reduce the uncertainty in projections of long-term trends in the ocean’s natural carbon fluxes and the anthropogenic carbon sink. SOSCEx has four main themes which address the same intraseasonal and submesoscale questions which link the carbon cycle to climate variability: 1) mixed-layer stratification dynamics, 2) CO2 and O2 gas exchange with the atmosphere, 3) carbon export from the mixed layer and 4) bio-optics linking water column inherent optical properties to outgoingsatellite visible irradiance. SOSCEx provides a new and unprecedented opportunity to gain a better understanding of the links between climate drivers and ecosystem productivity and climate feedbacks in the Southern Ocean. This combined high-resolution approach to both observations and modelling experiments will permit us, for the first time, to address some key questions relating to the physical nature of the Southern Ocean and its carbon cycle. SOSCEx takes place around six research voyages spread over four seasons using two ships and five gliderws. SOSCEx began with the winter cruise on the new SA Agulhas II in July 2012, followed by the spring cruise to Gough Island in September 2012 where two gliders were deployed in the subantarctic zone (SAZ), the summer cruise to Antarctic and South Georgia in December 2012- February 2013 where an additional three gliders were deployed on the GoodHope line and the autumn cruise to Marion Island yet to take place on 04 April 2013 to 15 May 2013. The remaining two cruises were facilitated by the SA Agulhas 1 with the Expedition Voyage to Antarctica on 01 January 2013 - 21 January 2013 and the SOSCEx summer cruise to the Polar Frontal Zone on 15 February – 11 March 2013 (where two floats were deployed). 1.2 The GoodHope Line The GoodHope Programme is a long term investment with repeated historical occupation crossing the entire extent of the Antarctic Circumpolar Current since 2004. This has been achieved through a multinational collaboration between the UK, USA, France, Netherlands and Russia with South Africa having completed 15 of the 20 GoodHope crossings. The initial heat flux focus of XBT observations has been extended to include CO2 observations and is in both counts now the strongest demonstration of South Africa’s stewardship activity in the Southern Ocean.The aim of the GoodHope programme is to establish an intensive monitoring platform that provides detailed information on the physical structure and volume flux of waters south of South Africa, where interbasin exchanges occur. The advantages of the GoodHope programme are as follows: (1) It runs approximately along with the TOPEX/POSEIDON – JASON 1 altimeter ground-tracks and will serve for ground-truthing of altimetry-derived sea height anomaly data (2) The northern section of the GoodHope line overlaps the region being studied by the USA - ASTTEX programme, enabling observations in the Southern Ocean to be linked with data collected within the Benguela region and the west coast of Southern Africa. (3) GoodHope will support and contribute to the data collected by numerous Pressure Inverted Echo Sounder (PIES) moorings already deployed and retrieved along this line. Sustained observations such as repeat transects provide the only means to monitor the vertical structure and to investigate the variability of the fronts in this region. The GoodHope programme investigates year-to-year and longer period variability in the fluxes, such as those related to the Antarctic Circumpolar Wave. Such intense and periodic monitoring has been underway in the Drake Passage (Sprintall et al., 1997) and south of Tasmania (Budillon and Rintoul, 2CSIRBIO003) since the 1970s, whereas the repeat transect between South Africa and Antarctica, the third Southern Ocean “choke point”, was implemented during the first GoodHope cruise in 2004. Each years sampling has however always taken place very close to mid-summer with none of the previous 20 crossings having ever taken place in winter making the scientific value of the five repeat crossings carried out by SOSCEx in both winter and various stages of summer self-evident. 1.3 The Process Stations The process stations are designed to investigate the hypothesis that high variability in MLD dynamics drives high productivity in the subantarctic. This hypothesis is based on the understanding that the subantarctic is Fe limited, particularly in late summer when biological production during the spring and summer months has utilised the surface seasonal Fe reservoir that is replenished each year through deep winter mixing. The hypothesis that we are testing in this experiment is that Fe below the seasonal mixed layer is tapped into during periodic high wind events that deepen the mixed layer into the higher Fe deeper waters. This Fe source is mixed into the high light region of the surface waters and drives increased productivity in the mixed layer in the interim calm periods between the passing of the strong wind high pressure systems. The lagrangion nature of the process station was to allow us to interpret any measured change as being intrinsic to the system and not due to a different water mass passing through a fixed location. Although the ship only sampled each process station every alternate day, the benefit of autonomous gliders and floats are that they continually sample the process station at high resolution in both time and space allowing a continual record of the system. With the combination of autonomous and ship based studies we are able to characterise the system prior to our arrival, measure the physical response of the mixed layer to high wind events and the response of the biology any observed MLD variability at high resolution. 1.4 Summary of Aims The main aims of the SOSCEx summer cruise are as follows: 1/ To extend the long term time series of the GoodHope line for monitoring of the physical state of the ocean. 2/ To understand the link between surface pCO2 variability and the underlying physical and biogeochemical drivers in response to climate: Carbon – Climate system. 3/ To improve our understanding of the intra seasonal progression of mixed layer dynamics and phytoplankton community response on the GoodHope line using 5 repeat crossings between December 2012 and March 2013. 4/ To characterise the relationships between Inherent Optical Properties and biogeochemistry. 3/ To investigate the phytoplankton response to MLD variability on meso and sub meso time and space scales in the subantarctic between early spring and late summer using high resolution glider data sets. 6/ To characterise phytoplankton community structure and investigate the biogeochemical controls of primary production and export. 7/ To quantify the contribution of nitrification to new production and investigate its seasonal variability. 8/ To enable model and remote sensing verification. 2. Cruise description and general outline The summer SOSCEx cruise is divided into two parts. The first is a repeat crossing of the GoodHope line to ~50oS while the second is a process study focussed around two lagrangian stations in the Subantarctic zone. In the following cruise description a general CTD refers to the starboard CTD deployment using the hydro-winch sampled for biogeochemistry, while the geotraces CTD refers to the trace metal CTD deployed off the stern using the towing winch sampled for Fe while the C-OPS refers to a profiling radiometre. 2.1. The GoodHope Line The Goodhope line was followed on both the Southbound and Northbound legs of the cruise according to the waypoints (34.02°S; 14.64°E; 0.0E, 51.43S). The GoodHope line was terminated at ~50oS where the ship turned around and continued on the same transect Northwards. These transects were sampled underway every 4hrs in order to characterise the physical structure of the upper water column using the underway CTD (see UCTD section for more details) and the surface biogeochemistry using the underway scientific sea water supply (see section on biogeochemical sampling for more details). On the Northbound crossing of the GoodHope line, the UCTD stations were continued at four hourly intervals, in addition CTD stations were carried out South of the Polar Front (PF) in the Polar Frontal Zone at 49o15’S and 2o 3.389E where both the general and geotraces CTD’s were deployed. Further north on the GoodHope line at 46o 57.8’S and 4o 30.4’E the glider 542 (which was deployed in December 2012) was retrieved. At the glider retrieval site both a general and Geotraces CTD was deployed. CTD’s were also carried out at Process station A at 42o 39’ S 8o 41’ E and B 43o 29.85 S 07o 10.80 E on the GoodHope line (see section 2.2 below for more information on the process study stations). A final CTD was carried out on the GoodHope line in the subtropical zone at 37o 44.95’S and 11o 40.73’E. Figure1. Cyan dots showing the southward cruise track of UCTD samples. The green dots show the two southern and one northern CTDs with the two Process Stations in between. The bathymetries shown are in intervals of 3000m. 2.2 The Process Stations The process study was designed to sample two stations in the subantarctic zone between the Subtropical Front (STF) and the Subantarctic Front (SAF). The two station positions were determined by the position of the summer gliders deployed on the Goodhope line in December 2012. The plan for the process stations was to deploy float CSIRBIO002 at the more northerly process station A coinciding with glider 543 while float CSIRBIO003 would be deployed at Station B one degree further south coinciding with glider 575. The gliders would then be programmed to follow the floats in a lagrangian study with the ship based CTD stations being deployed at the float positions of each station every alternate day. Unfortunately, glider 575 sank on ??? leaving process station B unsampled by a glider for ?? days. The sampling plan was subsequently adjusted by redeploying glider 542 at station B. Glider 542 was the same glider which had been retrieved a few days earlier at 46o 57.8’S and 4o 30.4’E. The second major setback was that float CSIRBIO002 was deployed incorrectly at station A on 25/02/2013. This float was not properly activated before deployment such that the float did not enter profiling mode which left no way to communicate with the float rendering it lost at sea (see section 3.3.2 for more details on the float deployment). Consequently float CSIRBIO003 was instead deployed on the next occupation of station A 2 days later. The preference for deploying the remaining float at station A rather than its originally planned deployment at station B was due to the fact that station A had been continually sampled by a glider since December 2012 unlike station B whose original glider 575 had sunk leaving this station unsampled for ?? days prior to our arrival. With station B no longer having a float to follow in a lagrangian study our only viable alternative was to put the glider at station B into mooring mode and for the ship to return to the position of the glider every alternate day to carry out the CTD stations. Although the plan was to do a general CTD, geotraces CTD and C-OPS at each station every alternate day, the weather seldom cooperated and on many occasions deployment of some or all of the above mentioned equipment was prevented due to strong winds and high swell. Table 1. Summary of CTD stations positions Station ID CTD Number Date Latitude Longitude Station SOSCTD01 1 23/02/2013 49.266 2.056 PFZ SOSXCTD02 2 24/02/2013 46.963 4.506 Glider SOSXCTD04 4 25/02/2013 42.645 8.687 A 5 3 26/02/2013 25/02/2013 42.707 42.701 8.651 8.666 SOSXCTD06 6 27/02/2013 43.497 7.18 B SOSXCTD07 SOSXCTD08 7 8 28/02/2013 01/03/2013 43.506 42.741 7.186 8.811 B A SOSXCTD09 9 02/03/2013 43.423 7.178 B 43.456 7.139 42.676 9.189 42.669 9.291 10 SOSXCTD11 11 03/03/2013 A SOSXCTD12 12 SOSXCTD13 13 04/03/2013 43.518 7.131 B SOSXCTD14 SOSXCTD15 14 15 05/03/2013 07/03/2013 42.644 42.615 9.431 9.597 A A SOSXCTD16 16 09/03/2013 STZ Description General CTD Geotraces CTD Glider 542 retrieval General CTD Geotraces CTD General CTD Geotraces CTD PAR CTD delta 15 N deep particles CTD Failed Float deployment 002 General CTD Glider 542 deployment General CTD General CTD Float deployment 003 Fe bio-assay experiment 1 General CTD Geotraces CTD PAR CTD C-OPS Fe bio-assay experiment 2 General CTD Geotraces CTD Float calibration CTD C-OPS General CTD Geotraces CTD C-OPS Glider 542 retrieval General CTD General CTD Geotraces CTD Glider 543 retrieval Float 003 retreival General CTD Geotraces CTD C-OPS Process Station A: Process station A was initialised at the position of glider 543 at 42o 39’ S 8o 41’ E on 25 February 2013. Unfortunately the initial float CSIRBIO002 deployed at this site on the morning of 26 Feb failed such that float CSIRBIO003 had to be deployed at this site at the next occupation on 01 March. This station was sampled for 11 days in total, with the glider 543 following the float and profiling until its retrieval on 07 March. The float CSIRBIO003 profiled from 01 March until the 06 March and was retrieved on 07 March. Ship based CTD occupations of this station occurred 5 times over the 11 days on 25/26 Feb and 01, 03, 05 and 07 March (see Table for details). The Fe addition bio-assay experiment was initiated at Process station A on 01 March 2013. Process station B: Process station B was initialised at the latitudinal coordinates of the lost glider 575 on the GoodHope line at 43o 29.85 S 07o 10.80 E on 27 February. As this station no longer had a lagrangian float the process station was instead sampled in “mooring mode” with the ship following the glider each alternate day to do CTD stations. This station was sampled for 6 days in total with four CTD occupations. The Fe addition bio-assay experiment at this station was initiated on the 02 March 2013. 3. Sampling Sampling can be divided into three categories. The first is underway sampling which is carried out either continuously or discretely but does not require the ship to stop. The second is stationary which requires the ship to stop in order to deploy instruments over the side. While the third is autonomous, which once deployed can continue sampling without the ships assistance at high space and time resolution. 3.1 Underway sampling The following underway measurements were carried out on the GoodHope line either running continuously or discretely at four hour intervals (see table 2 for summary). A description of each measurement is described in more detail later in the report. 1. Underway CTDs (UCTD) were carried out at 4 hourly intervals to collect profiles of temperature and salinity with depth. 2. pCO2 measurements were carried out continuously using water supplied by the ship’s scientific water supply. Included on the pCO2 system is continuous measurements of intake temperature and salinity aswell as dissolved oxygen and fluorescence. The fluorescence, Dissolved Oxygen and conductivity sensors are calibrated by discreet sampling of chlorophyll, dissolved oxygen and salinity at four hourly intervals. 3. Underway bio-optics characterising the Inherent Optical Properties (IOP) (back scattering, bean attenuation, absorption) and multiple fluorescence measurements of surface waters was carried out continuously using water supplied by the ship’s scientific water supply. Included in the optics are continuous measurements of fluorescence at multiple wavelengths. 4. Discreet measurements of surface biochemistry are collected at four hour intervals in order to derive empirical relationships between IOP’s and the biogeochemistry. Biogeochemistry parameters include the following: chlorophyll (Chl-a), Particulate Organic Carbon (POC), Particulate Inorganic Carbon (PIC), High Performance Liquid Chromotography (HPLC), Particle size distribution from the coulter counter, Microscopy samples preserved in Lugols and Absorbance (Particlate, dissolved and depigmented) 5. FIRe (Flourescence Induction and Relaxation) measurements were carried out continuously from the underway scientific sea water supply to determine the photophsiological efficiency of the phytoplankton community. 6. Nutrients were collected every 2 hours and analysed daily. 7. Net Community Production (NCP) measurements using a mass spectrometer are measured continuously using the underway scientific sea water supply. Table 2. listing the underway measurements and sampling frequency Underway Sampling Sampling Frequency pCO2, NCP, IOP, FIRe Sampling continuously Nutrients Every 2 hours UCTD, Chl-a, HPLC, POC, PIC, Microscopy, Every 4 hours Size distribution, Absorbtion, Dissolved Oxygen, Salinity, TCO2 3.2 Stationary sampling Stationary sampling includes the general CTD which is deployed of the starboard side of the vessel using the hydro winch and generally sampled for biogeochemistry. The geotraces CTD was deployed off of the stern using the starboard side towing winch over the A frame predominantly sampled for dissolved and particulate Fe, nutrients and bio-assay experiments. The C-OPS is a profiling radiometre deployed by hand over the stern of the ship. 3.2.1 The General CTD The majority of the general CTD’s were done at 03h00 in the morning to allow the productivity stations samples to get into the on deck incubators before sun rise. Additional CTD’s were carried out during daylight (one at each process station) to get a PAR profile for calculating the light depths for the production and Bio-Assay experiments. An additional float calibration CTD was deployed as close as possible in time and space to a float profile for calibrating the floats sensors and finally a delta 15N deep particles CTD was carried out at the first occupation of station A. Although an attempt was made to always sample either station A or B every alternate day, this was not possible due to adverse weather conditions. The CTD can only be deployed in winds that are constantly less than 35knots. This wind speed provides the limit of the capability of the bow and stern thrusters to maintain the vessel on station which is necessary for a CTD cast. Unfortunately it was often blowing substantially higher than this which prevented us from deploying the CTD at every station. On these occasions we would have to abort the CTD station and steam to the next station hoping that the wind would subside by 03h00 the next morning. Table 3. Sampling outline for the general CTD Measurement Depths Nutrients All depths Dissolved Oxygen Three random depths Salinity Three random depths TCO2 All Depths δ15N isotope ratios Four surface depths, 100m / 2000m 15 Top six light depths N Primary production and nitrification Biology* 3 depths (surface, middle and thermocline)^ Optics** 3 depths (surface, middle and thermocline)^ FIRe Top 6 depths Chlorophyll Top 6 depths * Biology includes POC, PIC, HPLC, Absorbance, microscopy and coulter counter ** Optics includes absorbance, beam attenuation, backscattering and multiple fluorescence ^ During the cruise the middle depth was referred to as the fluorescence maximum. However since there was no fluorescence maxima this is misleading and instead this cruise report has adopted the term middle to refer to the sample collected in the high chlorophyll surface mixed layer midway between the surface and the thermocline. 3.2.2 The Geotraces CTD The geotraces CTD is a polyeurethane? covered stainless steel CTD with 24 12L go-flo bottles titanium screws etc. The lack of a conducting Kevlar cable on the towing winch meant that the CTD bottles had to be triggered with a custom built plastic Sea-Bird Auto Fire module. Before the cruise the towing winch drum was covered with polyeurethane as well as the rollers and block so that the cable did not touch any metal parts during a CTD deployment. 2000m of Dyneema cable was purchased and loaded onto the drum. An attempt was made to load test the Dyneema cable and winch before departure but this did not work as the cable cut into the coil on the drum and buried itself into the coil. The reason for this is that the cable needs to be wound onto the drum under tension. This was not advisable with the dyneema cable as the tension spool is stainless steal and we did not want to contaminate the clean metal free cable. Instead we load tested the winch itself (and not the cable) using the port side towing winch. The capstan side of the winch pulled to 4 Ton on a smaller diameter and on the drum we pulled to 2 , 8 Ton. Once at sea and off the shelf we extracted the dyneema cable from being buried in its coil, deployed it at sea steaming at ~2 knots and re-wound it back onto the drum under tension. At one point during the cruise the cable got caught in the “cogs?” at the back of the winch jamming the cable which severed. Fortunately the CTD was on deck and we only had to lose the last few metres of cable and the boatswain managed to remake a loop splice in the cable suitable for attaching the rope end to a schackle and then onto t he CTD. Advice from captain Roger Hewitt on stern deployment tactics are as follows: For stern CTD’s the ship should be making only 0.5 to 1.5kt through the water (but not necessarily over the ground) in order to maintain the wire angle as close to vertical as possible). For vessels with a large sail area up forward the best approach is to put the wind directly on the bow. This gives best control at slow speeds and makes for better working conditions on the stern. If you are able to sample off the side, the wind should be put on the same side on the the bow - fine on the bow for stiff winds, broader on the bow for less wind. This keeps the ship from drifting over the gear. Judgement will be needed when when the seas and wind are coming from different directions or confused. As with a plankton tow, more wind is better (to a point) because it allows for the use of more propulsion power and hence more control over the ship's head. With more wind the ship will also require more propulsion to stay at the same location and offer more control over the wire angle. Variable winds are more difficult than a steady stiff wind. For stern deployments the most important thing is to keep the wind directly on the bow and use enough power to maintain position or make slight headway. This should keep the wire out of the screw and reasonably close to a vertical angle. Another thing to remember is that whenever the screw is turning there is some thrust and therefore a tendency to push the wire away from the stern. In all but the most calm conditions you should be OK with a stern deployment. This is one of those situations where good seamanship trumps knowing how to read a GPS. You may find that the ship is making no way as determined via GPS but making > 1 kt through the water in the face of a wind blown current. If the piezo indicates that you're losing ground give it more power or you'll be in trouble. All things considered the geotraces CTD was deployed quite successfully. On its first deployment it was not heavy enough and required 4 CTD bottles to be opened to reduce buoyancy at the surface. There was at one point an issue with the controls which drove the CTD into the block but these controls were swapped out and functioned fine from then on. The most major issue was the tendency for the cable to jump off the back of the “black turning block / guide??” just in front of the winch when the CTD was at the surface and there was big swell creating tension followed by rope slack. The rope slack would translate all the way to the winch and fold the cable off of the turning block. This was prevented by a vigilent crew member that pulled on the cable giving tension whenever it was slackened by high swell. This needs to be improved with a Teflon bracket at the back of the turning block to prevent the cable from slipping off the guide. One more problem incurred that needs to be rectified in future is that the CTD requires a swivel block where it attached to the cable to prevent the cable from twisting when the CTD turns in the air on deployment and retrieval. 3.2.3 C-OPS The Bio-Spherical Instruments Compact Optical Profiling System (C-OPS), developed in collaboration with NASA, is the most sophisticated and sensitive profiling radiometer system currently on the market. The Continuous Optical Profiling System (C-OPS) is a profiling radiometre for determining apparent optical properties of the water column. The C-OPS consists of a reference sensor set up on the upper levels of the vessel away from any shadow effects. The reference sensor includes an irradiance sensor equipped for measuring 19-channels of cosine incident surface irradiance with shadow band (to determine diffuse light), a GPS and motor to drive the shadow band. The C-OPS is a microradiometer-based profiler equipped to measure 19-channels of downward cosine irradiance at depth, 19-channels of upwelling radiance, water-temperature, pressure/depth, and instrument inclination (pitch and roll). A profiling multi-spectral radiometer such as this provides core measurements pertaining to the structure of the underwater light field and light emerging from the sea. Measurements from C-OPS allow us to acquire the necessary data to develop and validate space-based ocean colour algorithms allowing routine and long term observations from space of phytoplankton physiology, dynamics and carbon sequestration. The new biogeochemical algorithms for the Southern Ocean will have a priority on natural fluorescence/fluorescence quantum yield algorithms potentially allowing path to physiology (iron limitation) and assemblage description. Four successful deployments of the C-OPS were carried out during this voyage (see Table 1.). Rough weather (strong winds and /or high seas) prevented the deployment of C-OPS on most days. Each C-OPS deployment included the following: 1) dark correct launch, 2) a dark acquisition, 3) a shadowband acquisition (three dips), 4) three profiles of the C-OPS to 6080m in quick succession. Issues with deploying C-OPS were centred around rough weather conditions and the ability of the instrument to free fall away from the ship in these conditions. It is advised that in future this instrument be deployed with a rope that is attached to the instrument which will function as a safety line and will also be attached to a winch will allow the instrument to be retrieved without significant manual labour. It is also advised that a reel be purchased for the C-OPS to prevent the cable from getting twisted. 3.3 Autonomous sampling 3.3.1 Gliders Gliders are underwater autonomous instruments that are able to profile the ocean at high space and time resolution. Each glider was equipped with a CTD, dissolved oxygen, Wetlabs puck (BB2Fl) and PAR sensors. A standard glider dive between the surface and 1000m and back to the surface again takes approximately 5 hours to complete, upon which from the surface the glider calls researchers back in the laboratory via Iridium satellites and downloads all its valuable data. Glider pilots are also able to send the glider commands in order to change a huge range of parameters, such as way points, sensor sampling rates and dive speeds. Seaglider retrievals During the SOSCEx voyage along the GoodHope line two autonomous ocean Seagliders were retrieved. These gliders were deployed as part of the Southern Ocean Seasonal Cycle Experiment (SOSCEx) that supplemented the first two gliders deployed on the Gough Island take over voyage in September 2012. Seaglider 542 was initially retrieved at ~47°S; 4.5°E on 24 February 2013 and then redeployed in the Subantartic Zone at ~43.5°S; 7°E on 27 February 2013. Both Seaglider 542 and 543 were then finally retrieved using the SA Agulhas' work-boat on the 6th and 7th of March 2013, respectively. Seaglider 575 was also due for retrieval during the SOSCEx cruise, however, due to the likely failure of Seaglider 575's buoyancy bladder, it was lost at sea on 19 February 2013. Before each glider retrieval, the ship conducted a CTD cast to 1000m in order to provide calibration data for the sensors housed on the glider (such as CTD, bio-optics and dissolved oxygen data). The path of all the gliders and their progress during the experiment can be seen using this link: http://access.oceansafrica.org. 3.3.2 Bio-optics Floats Two bio-optics floats CSIRBIO002 and CSIRBIO003 were intended to form a core role in the process stations A and B providing the ability to do a lagrangian study, while at the same time providing high resolution profiles to 300m of upper ocean physics and biogeochemistry. The floats are both PROVOR floats built by NKE which in addition to the WetLabs temperature, conductivity and depth sensors has a dissolved Oxygen Aanderaa optode, a Satlantics BB2Fl for measuring backscattering at both red and blue wavelengths as well as fluorescence and a CROVOR transmissometre for measuring beam attenuation, set up in a vertical orientation with the sensor window facing upwards and the CTD exhaust arranged to flush the window such that it could be used to measure particle flux The floats were set up to do nine profiles per three day cycle. Day 1: 300m to surface at 4am, 300m to surface at 10am, 300m to surface at 4pm Day 2: 300m to surface at 4am, 300m to surface at 10am, 300m to surface at 4pm Day 3: 850m to surface at 4am, 300m to surface at 10am, 300m to surface at 4pm Programming adjustments In order to make adjustments to the programming of the float you need to turn on the float and activate the bluetooth by removing the magnet from the on off position and placing it on the blue tooth activation spot. Then check on which COM port the Bluetooth is installed on by going to device manager. Connect your computer to the Bluetooth device and enter the security code 0000. Open Tera term software. Select serial and the correct COM port that your float is connected to. In order to be able to type and see your commands in the dialog box you need to click on Setup and then terminal and then click the Local Echo box. The following adjustments to the floats programming were carried out to better suit the required mission of the float: Profiling Parameters The floats were programmed to transmit the data from all profiles (rather than just the third). This allowed us to get three coordinate fixes for the float each day making it easier for the ship to follow the float and perform the lagrangian process study. !PM 7 1, !PM 12 1, !PM 22 1, !PM 27 1, !PM 37 1, !PM 42 1 The third profile on day three was intended to be to 1000m in order to calibrate the sensors (as per Argo protocol) however, there was not enough time for the float to achieve this depth before profiling to the surface at 4am and hence the float was re programmed to adjust the deep profile to 850m. !PM 36 850. Vector Parameters Vector parameters are used for programming advance dates for changing the cycle period. In our case we needed the float to exit it’s 9 day profiling cycle in order to go into recovery mode where it would remain at the surface transmitting it’s coordinates every hour, referred to in the manual as “iridium end of life period”. Our understanding was that the float was only able to enter an end of life period on completeion of a 3 day (and not in the middle). Hence we were under the impression that we could programme the float to profile for 6 or 9 days but not 8. This needs to be confirmed with NKE. As 9 days was too long (we needed to depart for Cape Town on day 8, we programmed the float to enter end of life period at the end of day 6 on the 6 march 2013. !PV 4 06, !PV 5 03, !PV 6 13 Sensor Standard Parameters CTD Parameters: In order to make adjustments to the sensor parameters you have to type !KC 1234 to unlock. The only changes made to the CTD sensor was not to sample during parking drift. Were the CTD sensor to record data during parking drift, it would activate the pump which would flush any particles off of the upward facing sensor window of the transmissometre whose intended purpose is to get an index of particle flux by measuring the amount of material collecting on the sensor window during drift. !PC 001 0, !PC 0010 0, !PC 00 19 0, !PC 00 28 0, !PC 00 37 0 CROVOR Parameters: The adjustments made to the transmissometer were increase the sampling period in Parking Drift from once an hour to once every 15min and to increase the sampling period in Ascent Profile from once every 10sec to once every 5 sec. !PC 5 0 1 15, !PC 5 0 4 5, !PC 5 0 10 15, !PC 5 0 13 5, !PC 5 0 19 15, !PC 5 0 22 5, !PC 5 0 28 15, !PC 5 0 31 5, !PC 5 0 37 15, !PC 5 0 40 5. ECO3 Parameters: The same changes were made to the backscattering (blue and red) and fluorescence measurements. i.e. increaseing sampling period in Parking Drift to once every 15min and sampling period in Ascent Profile to once every 5 sec. !PC 3 0 1 15, !PC 3 0 4 5, !PC 3 0 10 15, !PC 3 0 13 5, !PC 3 0 19 15, !PC 3 0 22 5, !PC 3 0 28 15, !PC 3 0 31 5, !PC 3 0 37 15, !PC 3 0 40 5. Tests The following tests described in the manual were all carried out: 2.5.6 How to check and change the time: ?TI 2.5.7 Configuration test: ?PM 2.5.8 Functional Tests 2.5.8.1 Complete AUTOTEST: !C 2.5.8.2 Display of technological parameters: ?VB, !RV, 2.5.8.3 Test of CTD sensor: ?ME 0 2.5.8.4 Test of Oxygen sensor: ?ME 1 2.5.8.5 Test of FLBB sensor: ?ME 4 2.5.8.6 Test Hydraulic Pump: !P 100 2.5.8.7 Test Hydraulic Valve: !E 100 2.5.8.8 Test GPS/Iridium Subsystem: !SE Pre-deployment After finishing the functional tests you need to arm the mission by issuing the !AR 1 command: AR ON. Bio-Argo will respond: <AR ON>. Even more importantly, you now need to exit ‘dialog mode’ by removing the magnet from the blue tooth position and holding it onto the on/off position for 10 seconds. This will reset the float and allow it to enter its programmed profiling mode. This was the step that was not carried out on deployment of the first bio-argo float. For the first incorrect float deployment, all the steps were carried out up until the armed command. At this point the magnet was removed from the Bluetooth position and it was assumed that “dialog mode was exited and that the float was now armed. The magnet was not placed on the on/off position to reset the float and allow it to exit dialog mode. As such the float was deployed still in dialog mode rather than in profiling mode, this float had no way of communicating with iridium and we had no way of knowing where it was. This float was consequently and most unfortunately lost at sea. For the second correctly deployed float. All the steps were carried out up until the armed command. The float was then switched off by placing the magnet in the on off position and left to stand until we were ready to deploy it. When we were on station, we deployed the second float according to the float Deployment Quickstart and Checklist. According to these instructions you remove the magnet from the on/off position when you are ready to deploy and allow the float to perform an autotest which runs through a series of tests that informs the user according by using electro-valve activations (ev), nydraulic pump activation, CTD sensor pump activiation and satellite transmission. Eeach step must be verified according to the checklist before deployment: 1/ 5 slow ev activations heard (5-15sec after magnet removal) 2/ water level change in CTD water circuit 3/ optical sensor activation 4/ 5 quick ev activations heard 5/ water level change in CTD circuit 6/ hear hydraulic pump If all of the above items are not checked, then place magnet in on/off position and try again. Deployment and retrieval The float was deployed off the aft A-frame using a quick release wooden toggle that was pulled out of the line holding the float as soon as its weight was reduced on the line when it hit the water. Caution need to be made to release the line quickly and to prevent the float from swinging back towards the stern of the ship in big swell. The float was retrieved using the large net in a square from. The net was hoisted from the top two corners using the forward starboard crane. This system worked well enough but definitely needs improving by designing a net that floats on the surface so that it is not hauled up out of the water with each swell that rolls the ship. 4. Individual cruise reports The following individual cruise reports appear in the sections to follow and have been written by the key participants from each group: 4.1 Underway Conductivity Temperature and Depth (UCTD) 4.2 Biogeochemistry and filtering Cruise Report 4.3 Nutrient analysis 4.4 Dissolved Oxygen 4.5 15N Primary Production, calcification and nitrification 4.5 Underway pCO2, DIC/AT and O2Ar measurements 4.6 Fluorescence Induction and Relaxation (FIRe) Fluorometer 4.7 δ15N: Natural Abundance Nitrogen Isotope Ratios 4.8 Bio-optics 4.9 Coulter Counter 4.10 Particulate, de-pigmented particulate absorbance and Gelbstoff 4.11 Scientific engineering support 4.1 Underway Conductivity Temperature and Depth (UCTD) Written by Marcel Du Plessis Key Participants: Marcel Du Plessis, Ghosain Baderoen, Derek Needham, Ashley Botha, Jean-Pierre Smit, Sinekhaya Bilana The UCTD is an underway instrument from Oceanscience that allows for sampling of temperature and salinity at depths of up to 400m without requiring the vessel to stop. These profiles allow us to characterize upper ocean properties and identify the position and characteristics of frontal features. The UCTD data will better understand results and characterize events identified through the biogeochemistry results. Deployments were done every 4 hours up until the deployments of the CTD. Deployments were then done at 10am, 2pm, 6pm and 10pm GMT, between each process station. Several deployments were cancelled due to severe weather conditions. At no point did the probe make contact with the side of the vessels hull and can therefore be assumed that the conductivity cell did not undergo malfunction. On the 24th of February, the probe being used, PA 0065’s battery ran flat. PA 0065 along with probe PA 0052, are generation 1 probes and their batteries require 7.4V chargers. The 7.4V UCTD probe charger was not on board. Probe PA 0003’s battery requires a 3.7V charger, which was available. The probe used for sampling with then switched from PA 0065 to PA 0003. On the 2 nd March 2013, probe PA 0003 was lost. The probe was correctly attached to the tailspool, negating onboard human error as a result. Due to persistent erosion from the pin connecting the probe to the tailspool on the tailspool and the pin itself wearing down, the probe slipped out of the tailspool during sampling. An APS3005S regulated DC power supply was acquired from the ships technicians and connected to the probes PA 0065 and PA 0052 at at 8.2V and 0.5A to charge their batteries. On the 7 th March, Probe PA 0052’s battery malfunctioned and the probe used for sampling had to be changed to PA 0065. Water entered the keypad of the rewinder and had to be opened and cleaned. The rewinder was replaced as a precaution. 4.1.1 UCTD data processing The data that is collected (raw data) needs to be converted from binary to engineering units and then processed to improve the quality of the data. Different errors can affect the data, namely accidental (example, the momentary closure of the sensor) and inherent (example, related to the inherent time delay of the temperature and conductivity sensor responses that can affect the measure of salinity). In order to process the data SEASOFTt-Win32: SBE Data Processing is used. The software is composed of different modules, each with a different function. In order to automatize the process a DOS batch file: Postpro.bat is used. Sbebatch C:\Documents and settings\csir\Desktop\Yoyage_004\dataProcessing\Postpro.txt %1 The line launches at ‘.txt’ file where the instructions needed to launch the different modules of the software are written. An example of the ‘.txt’ file is: Asciiin /pC:\Docume~1\csir\Desktop\Yoyage_004\dataProcessing\ASCII_In.psa /iC:\Docume~1\csir\Desktop\Yoyage_004\%1.asc /oC:\Docume~1\csir\Desktop\Yoyage_004\processedData /f%1.cnv alignctd /pC:\Docume~1\csir\Desktop\Yoyage_004\dataProcessing\AlignCTD2.psa /iC:\Docume~1\csir\Desktop\Yoyage_004\processedData\%1.cnv /oC:\Docume~1\csir\Desktop\Yoyage_004\processedData /f%1.cnv Section /pC:\Docume~1\csir\Desktop\Yoyage_004\dataProcessing\Section.psa /iC:\Docume~1\csir\Desktop\Yoyage_004\processedData\%1.cnv /oC:\Docume~1\csir\Desktop\Yoyage_004\processedData /f%1.cnv filter /pC:\Docume~1\csir\Desktop\Yoyage_004\dataProcessing\Filter.psa /iC:\Docume~1\csir\Desktop\Yoyage_004\processedData\%1.cnv /oC:\Docume~1\csir\Desktop\Yoyage_004\processedData /f%1.cnv Derive /pC:\Docume~1\csir\Desktop\Yoyage_004\dataProcessing\Derive.psa /iC:\Docume~1\csir\Desktop\Yoyage_004\processedData\%1.cnv /oC:\Docume~1\csir\Desktop\Yoyage_004\processedData /f%1.cnv Seaplot /pC:\Docume~1\csir\Desktop\Yoyage_004\dataProcessing\Seaplot.psa /iC:\Docume~1\csir\Desktop\Yoyage_004\processedData\%1.cnv /oC:\Docume~1\csir\Desktop\Yoyage_004\processedData /f%1.jpg Each line responds to a different module that is applied. The first part of each line gives the instruction of which module to use and where it is stored. The second part is for the input file and the third part tells one where to store the output file. In order to start the processing, one must run the batch file, giving the position where it is stored and the file name of the cast that is required to be processed. For example: OPEN: C:\Documents and Settings\csir\Desktop\Yoyage_004\dataProcessing\ Postpro.bat VOY_004_49 The modules used during this campaign are in sequence: Ascii in Align ctd Section Filter Derive Ascii in: adds a header to a .asc file that contains rows of ASCII data. The data can be separated by spaces, commas or tabs (or combination of spaces, commas and tabs). The output file, which contains both the header and the data, is a “.cnv” file. Align ctd: aligns parameter data in time, relative to pressure. This ensures that calculations of salinity, dissolved oxygen concentrations, and other parameters are made using measurements from the same parcel of water. Three principle causes of misalignment are: Physical alignment of the sensors in depth Inherent time delay (time response) of the sensor responses Water transit time delay in the pumped plumbing line – the time it takes a parcel of water to go through the plumbing to each sensor The best alignment was to give 0.095s of advance of the temperature relative to pressure. Section: extracts row of data from the input “.cnv” file. Section has been used to remove the first 5 m of data from the downcast output file. Filter: Filter runs a low-pass filter on one or more columns of data. A low-pass filter smoothes high-frequency data. To produce zero phase (no time shift), the filter is first run forward through the data and then run backward through the data. This removes any delays caused by the filter. Derive: uses pressure, temperature and conductivity from the input ”.cnv” file to compute the following oceanographic parameters: Depth (salt water,m), Salinity, Density (sigma-theta kg.m-3), Potential Temperature (ITS-90, °C), Density (density, kg.m-3), Dynamic meters (10 J.kg-1), Geopotential Anomaly (J.kg-3). 4.1.2 Results Figure 1. Cyan dots showing the southward cruise track of UCTD samples. The green dots show the two most southern and the northern most CTDs with the two Process Stations in between. The bathymetries shown are in intervals of 3000m. Figure 2. UCTD results of the southward leg of the Good Hope Line. The black crosses represent station positions. The white spaces indicate where the probe didn’t go 400m and the top of each white space represents the full depth of each respective station. Figure 3. Process Stations A and B, the colours and contours represent temperature and the black crosses indicate station positions. During Process Station B, the cold event throughout the water column would need to be investigated as a temperature drop of ~5°C through several days is a highly unexpected event. Probe PA 0065 was used Figure 4. Temperature values obtained from the UCTD during the Process Stations were taken every 4 hours in between Stations. Figure 5. Comparisons for temperature and salinity were done between UCTD (blue line) and CTD (black line) at the northern most CTD station (37.67 °S, 11.70 °E). Probe PA 0065 was sent down with the starboard CTD for calibration purposes. UCTD calibration paired well with the CTD for temperature. Salinity was constantly offset by a positive ~0.1 psu for the UCTD and significant noise was experienced between depths ~50m to ~150m. The offset can be the occurrence of a cracked conductivity cell which may have occurred on board as the probe never came into contact with the side of the vessel during retrieval. The probe was attached vertically upside down for when on the downcast so that water can flush directly through the conductivity and temperature cells and minimize the retention of water in the probe near the cells. With respect to the CTD, The UCTD was placed in line with the CTDs thermistor and conductivity cell to negate differences in the measurements caused by a difference in depth between the UCTD and CTD sensors. Figure 6. Shows the differences between the CTD and the UCTD measurements. The peak in difference between CTD and UCTD occurs between depths ~60 – 110m for temperature and 70-110m for salinity. 4.1.3 Problems/Recommendations The temperature resolution was not significant enough for accurate prediction of mesoscale features. For future cruises, sampling every two hours would rectify this issue. Deployment of an Expendable Bathythermograph (XBT) every hour not done by the UCTD over the fronts would substantially increase the resolution. Often the case was that due to severe weather conditions, deployment of the UCTD was cancelled. Deployment of an XBT when the weather is too harsh is acceptable. A battery malfunction found in probe PA 0052 necessitated the use for re-sampling using probe PA 0065. PA 0065 did not respond to the usual method of sampling and due to confusion of the error, a station was missed. The problem was solved by erasing the memory via the command “initlogging” into the UCTDTerm command window. Make sure all probe’s are fully charged when not in use. The only charger originally available was a 3.7V. When probe PA 0003 was lost, a charger with a higher voltage had to be acquired probe’s PA 0052 and PA 0065 had to be charged. Several stations were missed. Identify before the cruise where a spare charger is in case of need. When the memory is full, often when the probe holds ~50 casts, it does not record any data. This problem was solved by using the command “initlogging” in UCTDTerm. 4.2 Biogeochemistry and filtering Cruise Report Written by Amy Harington Key Participants: Amy Harington, Alistair Fyfe, Delphine Lobelle, Fiona Preston-Whyte 4.2.1 Filtering Methods Discreet underway samples were collected every 2 hours (06:00, 08:00, 10:00, 12:00, 14:00, 16:00, 18:00, 20:00, 22:00, 24:00, 02:00, 04:00) from an underway hose connected to an uncontaminated engine room supply. A full station was run alternating with a ‘half’ station every 2 hours. Sampling frequency was adjusted depending on CTD deployment. CTDs were deployed between ~03:00am ~05:00am depending on weather. On days where a CTD was deployed the 04:00am and possibly the 06:00am underway stations were not sampled depending on how long the CTD took to process. Sample containers, measuring cylinders, the 10l carboy and every other vessel used to hold sampled seawater were rinsed with water from that station’s GPS location three times. Filtering turrets were rinsed with GF/F filtered seawater between stations. Samples were allowed to run for a maximum of two hours, at which point any leftover, unfiltered sample was drained from the filtering rig using a rubber tube into a 1000ml measuring cylinder. The leftover volume was measured and the amount of sample which was filtered was calculated and recorded on the filtering volume log sheet. Underway filtering: Discrete underway samples were taken for chlorophyll-a, high performance liquid chromatography (HPLC), absorbance, particulate organic carbon (POC), particulate inorganic carbon (PIC), and biogenic silica (BSi), additional samples were taken for microscopy, salinity, dissolved oxygen, coulter counter and gelbstoff. Alternate stations sampled only for Chlorophyll-a and for nutrients. CTD Filtering Strategy: Chlorophyll-a samples were collected from the top 6 depths of the CTD (which were not always within the euphotic zone), chlorophyll-a samples were then filtered as per usual (see table 2). Dissolved oxygen samples were collected from 3 random depths or at a point of interest (e.g. the oxygen max). Salinity samples were collected from the same depths as dissolved oxygen. Nutrients were sampled from all depths. Thereafter, 3 10L carboys were filled with water from the surface, f-max and thermocline depths. This was then used to filter for HPLC, absorbance, POC, PIC and Bsi as well as a Coulter Counter sample and a microscopy sample. Summary of Sampling Strategy Table 1: Summary of sampling strategy for filtering Underway CTD Chlorophyll Every 2 hours Top 6 depths HPLC Every 4 hours Surface, Thermocline, Chl-a max POC Every 4 hours Surface, Thermocline, Chl-a max PIC Every 4 hours Surface, Thermocline, Chl-a max Bsi Every 4 hours Surface, Thermocline, Chl-a max *~ 250ml seawater filtered through a 47mm, 0.45µm filter to collect nutrients for every ‘half’ station Table 2: Filtering summary Volume Filter Type Treatment of filtrate Treatment After Filtration Chlorophyll 400ml 25mm glass fibre filters Collect (Whatman GF/F) filtrate for Into a vial with 8ml coulter counter blank acetone, into the fridge for 24 hours until the 18th of February, station SOSX UND 21. Thereafter, filters were placed in a cryovial and stored in liquid nitrogen. Absorbance 2000ml 25mm glass fibre filters Collect (Whatman GF/F) HPLC 2000ml filtrate for Placed in petri dish gelbstoff 25mm glass fibre filters Placed in cryovial and (Whatman GF/F) stored in liquid nitrogen. POC 2000ml 25mm filter Ashed GF/F Placed in petri dish and oven dried for ~24hours, after which the petri dish was wrapped in foil and placed in a ziplock bag with silica granules PIC 500ml 1µm, 25mm diameter Rinse with a weak polycarbonate filter alkaline solution, oven dried at 70ºC for ~24 hours, stored flat and dry in petri dishes Bsi 1000ml 0.8µm, 47mm diameter Collect filtrate for 2x Placed in petri dish and polycarbonate filter 100ml nutrient vials. oven dried at 60ºC for 7 hours, stored flat and dry in petri dishes Chlorophyll-a Chlorophyll samples were collected by filtering 400 ml of seawater from the uncontaminated underway lab supply and from selected depths from the CTD casts (see table 1) through 25 mm glass fibre filters (Whatman GF/F). Which was initially stored in 8ml of acetone in the freezer for 24 hours, before it would be read on a ‘Turner design trilogy laboratory flourometer’. However, on the 18th of February it was discovered that the sampling tube had been left in Cape Town, and thereafter, chlorophyll filters were then folded in half and placed in a cryovalve and stored in liquid nitrogen until they could be read on return to Cape Town. HPLC For High Performance Liquid Chromatography (HPLC) analyses, 2000 ml seawater samples from the uncontaminated underway lab supply and from selected depths from the CTD casts (see table 1) were filtered through 25 mm Whatman GF/F filters which were then folded in half and placed in a cryovalve and stored in liquid nitrogen until they could be read on return to Cape Town. Absorbance Absorbance samples were collected by filtering 2000ml of seawater from the uncontaminated underway lab supply and from selected depths from the CTD casts (see table 1) through 25 mm Whatman GF/F. See section ???? for further information on Absorbance analysis. POC Particulate organic carbon (POC) measurements were made by filtering 2000 ml of seawater from the uncontaminated underway lab supply and from selected depths from the CTD casts (see table 1) onto pre-combusted (~400 oC, 12-24 hours) 25 mm GF/F filters. Filters were placed in petri dishes and then dried at ~70ºC for ~24 hours. The petri dishes were wrapped in tin foil and placed into a ziplock bag with silica granules to keep the samples dry. PIC Particulate inorganic carbon (PIC) samples were collected by filtering 500ml of seawater from the uncontaminated underway lab supply and from selected depths from the CTD casts (see table 1) onto 1µm polycarbonate filters. The filters were rinsed using a weak alkaline solution (RECIPE) to prevent the formation of salt crystals. Filters were placed in petri dishes and then dried at ~70ºC for ~24 hours. The petri dishes were wrapped in foil and placed into a ziplock bag with silica granules to keep the samples dry. BSi Biogenic silicate (BSi) samples were collected by filtering 1000ml of seawater from the uncontaminated underway lab supply and from selected depths from the CTD casts (see table 1) through 45mm, 1µm polycarbonate filters. Filters were placed in petri dishes and then dried at ~70ºC for ~24 hours. The petri dishes were wrapped in foil and placed into a ziplock bag with silica granules to keep the samples dry. Microscopy 200 ml microscopy (light microscope counts and biomass estimates) samples were collected for phytoplankton community analysis from the uncontaminated underway lab supply and from selected depths from the CTD casts (see table 1). The samples were preserved in 250 ml glass amber bottles with 4ml of 2% alkaline Lugols (200 g potassium iodide + 100 g iodine + 100 g sodium acetate in 2000 ml distilled water). Alkaline Lugols was chosen as a preservative for its ability to preserve coccolithophores as well as diatoms, dinoflagellates and ciliates. Microscopy bottles with a black dot on the lid signifies that when initially collected, only 2ml of lugols were added, when this inaccuracy was discovered another 2ml was added to the bottles. Salinity Salinity samples were collected from the uncontaminated underway lab supply and from selected depths from CTD casts (see table 1). Samples were stored in 250 ml glass amber bottles, with the tops covered with parafilm, the lid screwed on and another layer of parafilm around the lid, for later analysis on a porta cell at UCT. Nutrients Duplicate underway nutrient samples were collected from the filtrate of BSi (1um polycarbonate) every 4 hours and from the filtrate filtered through a 47mm, 0.45µm polycarbonate on the two hourly nutrient stations in between the four hourly biology stations (when BSi samples were not being filtered). One nutrient sample was placed in a -20 freezer as back up while the second sample was placed in the fridge until daily batch analysis on the auto analyser. The reason for collecting filtered underway nutrient samples was to remove any biology that may potentially change the nutrient signal within the nutrient vial during the delay in the fridge between daily batch runs. Duplicate nutrient samples were also collected from all depths from the CTD casts (see table 1), two 50ml vials were filled, one of which was placed in the freezer for storage the other was run almost immediately and hence the lack of any need to pre filter the samples before analysis. See section 4.3for further details on nutrient analysis. 4.3 Nutrient analysis Written by Craig Atwood Nitrate (NO3 +NO2) and silicate (SiO4) were determined using the Lachat QuikChem 8500 series 2 Flow Injection Analyser. Method 31-107-04-1-E was used for the determination of the nitrate while Method 31-114-27-1-D was used for the silicate. Phosphate (PO4) and Nitrite (NO2) were determined manually according to the method described in Grasshoff et al (1983) and Parsons et al. (1984). 200 underway samples were analysed. These were collected approximately every 2 hours during the cruise. All these samples were filtered through polycarbonate filters, stored in the fridge and analysed within 48hours. The starboard CTD was deployed 16 times, of which approximately 10 depths per drop were analysed for nutrients. These were unfiltered but were analysed within 6 hours of collection. Similarly with the nutrient analyses undertaken on the Geotraces CTD, which was deployed off the stern. Further analyses was done on Bioassay incubations and on samples collected for 55% Nitrification. Also included in the spreadsheet are the results for the underway samples collected on the Summer Cruise which conveyed the thecoldestjourney.com expedition to the Antarctic. These were filtered at collection and frozen for approximately 1 month. The FIA results were very good. Special care was taken with the cadmium column and it was regenerated once a week. Similarly the Sulfanilimide reagent was replaced before required. The SiO4 channel was reliable as always. The manual PO4 determinations were on the whole fairly reliable but the NO2 results, using the shorter wavelength (540 nm), strangely, were very erratic and should be treated with care. This could have been the result of consistently high seas and/or an erratic power supply. Recommendations: The analysis of the nutrients during this cruise went very smoothly and had very few hitches. However some things can be taken away from the 3 weeks. It is essential that the laboratory has proper and functioning air-conditioning in order to maintain a regular temperature to preserve the quality of the reagents. Fridge storage was sufficient, but a dedicated fridge would be preferable. The FIA showed no ill-effects under the continual barrage of high seas, although air spikes were present as the reagents ran low and the tubing was exposed to the atmosphere. The regular and plentiful supply of de-ionized water is essential. Decent wash up and storage facilities for the glassware is important. With reference to the previous report from the SANAE 50 cruise, the swells experienced on the SOSECX cruise show that the FIA can operate in almost any conditions without having to be on a Gimbel table. However, the manual methods using the spectrophotometer, were far more vulnerable to the conditions and it was often difficult to confirm a reading. The question still needs to be asked whether the nutrients need to be analysed in-situ. The Geotraces group was the only section which needed immediate results. They were only using them as a comparison with the results from the starboard CTD, in order to ascertain whether there was any iron contamination in their samples. In future expeditions this can be done by using a basic nitrate detector. Obviously it would be preferable to analyse the samples immediately but too many factors come in to play which increase the risk of a mishap on board: reagents running out irreparable mechanical or electronic failure Proper filtering, freezing and storage of the samples would allow for confidence in results obtained in a controlled and secure laboratory on land. Again it is important that the operator is experienced in the use of the machine. A top class operator may make things look easy, but when the wheels come off it is important that he/she has the experience to deal with it. 4.4 Dissolved Oxygen Written by Emma Bone Dissolved oxygen samples were collected from the uncontaminated underway lab supply for all underway legs of the voyage. Samples were also collected from selected depths (the same depths as the salinity samples) from the CTD casts. Seawater samples were collected in dissolved oxygen bottles and fixed immediately after sampling with a spike of MgCl2 and NaOH/IOH. After the precipitate settled and the bottles reached room temperature they were spiked with H 2SO4 (Sulphuric acid) and then titrated using a Metrohm 848 Titrino Plus unit. In addition to providing stand-alone biological data, the DO samples were analysed in order to calibrate both the Optode oxygen sensor on the pCO2 system and the CTD Seabird oxygen sensor on the CTD. In brief: Samples were collected for all underway and CTD stations; water was allowed to overflow 3X the volume of the bottle The lid was placed on the sample (this naturally resulted in the expulsion of 2ml of seawater which made room for the subsequent reagents) 1ml MgCl2 was added, followed by 1ml NaOH/IOH; both reagents were added as quickly as possible Samples were left to settle and reach room temperature in the dark 1ml H2SO4 was added to the samples to dissolve the precipitant before being read The Metrohm was standardised every 1-2 days (using the Std Factor Method setting) The exact volume of the sample bottle was entered into the Metrohm before the sample was run using the DO Method setting on the machine. All results are in ml/l. Unfortunately the printer ran out of ink during the cruise so all results were recorded manually When collecting the CTD samples a slight problem regarding the measurement of water temperature arose. Initially we had planned to use an electronic thermometer, which unfortunately broke at the beginning of the cruise. Temperature was taken from the pCO2 system when sampling underway, however when it came to the CTD an old mercury thermometer was the only option. It seemed inaccurate and a waste of valuable water so it was soon abandoned. However for the last two CTDs it was found that the thermometer could rest in the salinity bottle (which was being collected simultaneously from the same Niskin) while the DO water was allowed to overflow the volume of the bottle 3X. From UND113-UND163 there was a change in the colour and consistency of both the underway and CTD samples. It was decided that the darker samples were a result of iron being precipitated before the addition of the acid. The MnCl2 and NaOH/IOH solutions were replaced with solutions used on a previous cruise (the Expedition Cruise, 7th January- 12th February 2013) and this appeared to mitigate the problem. During this time there was also failure to standardise the Metrohm. All the applicable reagents were tested and swapped with the Expedition Cruise reagents and it was found that the standard iodate solution was at fault. The standardisation, however, remained temperamental for the duration of the cruise, possibly due to deterioration of the 10X sodium thiosulphate stock solution. It should be further noted that the 1ml Gilson pipette broke during the cruise, and all the crucial spiking of samples was performed with a 5ml pipette; this may have additionally decreased the accuracy. Image 1. L-R: CTD sample, underway sample, underway sample using reagents from the previous Expedition Cruise. Figure 1. Section plot of CTD DO measurements generated by Marcel du Plessis 4.5 15N Primary Production, Calcification and Nitrification Written by Michael-John Gibberd Key Participants: Michael-John Gibberd, Nina Lester 4.5.1 Project Rationale The oceans are a major sink of CO₂, and the largest proportion is locked up in the sediments of the ocean floor. These sediments are composed of biogenic material that has accumulated by the sinking of dead organic material under gravitational force. This process is referred to as “carbon export” and is regulated by the “biological carbon pump”. CO₂ is assimilated by the phytoplankton into their plant tissues via photosynthesis. The phytoplankton then sink and sequestrate the carbon dioxide into the sediment. Therefore the conversion of inorganic carbon (in the form of CO₂) into biomass is fundamental for our understanding of the ocean as a potential sink for increasing levels of atmospheric carbon dioxide, the major contributing factor to global warming. The Southern Ocean is of particular interest as it has a high (yet very variable) primary production rate of between 40 and 260 grams of carbon fixed per square meter per year. Thus the Southern Ocean is one of the largest oceanic sinks for atmospheric CO₂. There are two types of primary production that must be considered: “new” production and “regenerated” production. New production is primary production based on nitrate, as this form of nitrogen is new to the euphotic zone i.e. it has been upwelled into the surface waters. Regenerated production is primary production based on non-nitrate nitrogen sources i.e. forms of nitrogen excreted or re-cycled within the euphotic layer (ammonia and urea). All 3 species of nitrogen (NO₃, NH₄ and urea) are important for primary production. The f-ratio is a proxy that is commonly used as a measure of the efficiency of biological pump. It is the fraction of primary production fueled by nitrate (NO3) over total primary production. It is based on the assumption that the source of nitrate is found outside the euphotic zone while ammonium (and urea) are regenerated within the euphotic zone. As a result, the primary production can be divided as “new production” and “regenerated production”, based on nitrate and ammonium (and other regenerated nutrients) respectively. However, recent evidence has shown that nitrification, the biological oxidation of ammonium to nitrate, can be quite significant within the euphotic zone. As a result, production from nitrate cannot be simply classified as new production. This undermines the usefulness of the f-ratio as a proxy for carbon export. However, despite the persistent debate about the biological pump in the Southern Ocean, there have been very few measurements of euphotic nitrification in the Southern Ocean. This cruise represents an opportunity to enhance the understanding of the nitrogen cycle and its links to the carbon cycle. For this reason, a complete set of nitrogen uptake and regeneration measurements is needed. Nitrate and ammonium uptake are measures of primary productivity. On the other hand, the regeneration measurements allows for corrections to the isotopic dilution of the 15-N tracers and better constraints to carbon export models. 4.5.2 Aims 1. To make measurements of nitrogen uptake and regeneration. 2. To test a new methodology for measuring calcification using 13 C by performing two incubations and acid fuming one of the filters to remove PIC. 3. To quantify the proportion of coccolithophore contribution to primary production through calcification experiments. 4. To assess Redfield C:N fixation rates. 4.5.3 Primary Production Profiles Water from various depths was sampled using the stainless steel CTD from four light depths. Photosynthetic active radiation (PAR) was measured on a cast the afternoon prior to water collection, and was used to calculate the depths which represent 55%, 32%, 8%, and 3% surface irradiance. Water was sampled at these depths, and placed in 2.0 L polycarbonate Nalgene bottles. New production, nitrate and ammonium uptake A 2L water sample from each of the four light depths was spiked with 15N (1 µmol K15NO3 / 100 µl) to analyse the uptake of nitrate. Spikes were adjusted to achieve 15 enrichments of ~10%. A 4L water sample from each depth was spiked with 15 N-NO3 ambient 15 N (0.05 µmol NH4Cl / 100 µl) at ~10% ambient nutrient concentration to measure ammonium uptake. The inoculated samples from each light depth were incubated in tubes covered in neutral density filters that simulated the various light depths. Samples were placed into the incubator prior to sunrise to minimize light damage to the cells. Incubators were cooled with a constant flow of surface seawater to further simulate in situ conditions. The samples were incubated for 12 hours, following which the samples were filtered through pre-combusted 25mm Whatmann GF/F filters and dried in an oven at 40 °C for 24 hours. Ammonium regeneration Isotopic dilution NH4 regeneration experiments were conducted to correct for cycling in the 15 14 NH4 re- NH4 incubation bottles. Immediately after spiking the 4L NH4, exactly 2L was recovered and promptly filtered through a 25mm Whatman GF/F filter to collect 900 ml filtrate for transfer into 1.0L polycarbonate Nalgene bottles. Exactly 400 μl NH4Cl solution (10 μmol / ml) was added to each of these bottles as a “carrier” prior to freezing the samples at. At the end of the 12 hr incubation period, a further 900 ml filtrate was recovered from the NH4 uptake filtration to measure 15 N isotopic dilution (Rt). Carrier (400 μl) was added and the Rt sample was frozen as before. The aqueous NH4 is to be recovered onto GF/F filters by diffusion and the isotopic composition (and dilution) measured by mass spectrometry back ashore. Calcification Calcification experiments were performed at 2 of the four light depths. 4L was collected at each depth. These samples were then spiked with ~210 μmol C l‐1 13C‐stock (2 ml) to provide a DIC concentration of ~5%; assuming an ambient DIC concentration of ~2.1 mmol C l‐1. Samples were then separated into two 2L Nalgene bottles and incubated for 12 hours in incubators at light levels corresponding to the collection depth. The samples were then filtered onto 25mm diameter pre‐ashed GF/F and dried in an oven at 40 °C for 24 hours. At each depth one of the filters will be acid fumed to remove PIC and one will not be fumed. The difference in 13C fixation between the two sets of surface bottles ought to represent calcification. Nitrification Nitrification experiments were performed at the 55% light depth at 6 of the 10 PP profile stations (marked with * in Table 1). An additional 2L was collected for the NO3 analysis and 4L was collected for NO2 analysis. The 4L NO2 sample was inoculated with 0.4ml of 0.5 mM spike of 15N-NO2 to achieve an enrichment of 0.05µmol l-1. The NH4 sample was inoculated with 0.4ml of 0.5 mM spike of 15N-NH4 to achieve an enrichment of 0.05µmol l-1. The NO3 sample was inoculated with 0.4ml of 10 mM spike of 15 N-NO3 to achieve an enrichment of -1 1.0 µmol l . These samples were then split into two. 2L was incubated and the remaining 2L was filtered immediately. 100ml of the NO3 sample, 500ml of the NO2 sample and 1L of the NH4 sample were collected and frozen. 50ml vials of the filtrate form the NO2 and the NO3 sample were collected and sent for nutrient analysis on the FIA. After a ~12 hour incubation period the experiments were terminated by filtering the incubated bottles onto pre-combusted 25mm Whatmann GF/F filters. The NO3 and NH4 filters were kept for the uptake experiments. Again 100ml of the NO3 sample, 500ml of the NO2 sample and 1L of the NH4 sample were collected and frozen. 50ml vials of the filtrate form the NO2 sample and the NO3 sample were collected and sent for nutrient analysis on the FIA. Frozen samples will be analysed ashore and the nutrient measurements performed onboard are to check for any deterioration in the samples with freezing and storage. As no NH4 concentrations were not determined onboard, various volumes (0.1, 0.2, 0.3 and 0.4 ml) of the NH4Cl solution (10 μmol / ml) were added to S0 samples intermittently during the cruise to assess any deterioration in the samples with freezing and storage. Table 1. Station positions for primary production profiles. The stations marked with a * indicate stations where nitrification experiments were performed at the 55% light depth. Station Date Latitude Longitude SOSX CTD01* 23-02-2013 49.2661 °S 2.0565 °E SOSX CTD02 24-02-2013 46.9627 °S 4.5060 °E SOSX CTD04* 26-02-2013 42.6450 °S 8.6867 °E SOSX CTD07* 28-02-2013 43.5064 °S 7.1858 °E SOSX CTD08 01-03-2013 42.7412 °S 8.8111 °E SOSX CTD09 02-03-2013 43.4233 °S 7.1785 °E SOSX CTD11* 03-03-2013 42.7758 °S 9.1892 °E SOSX CTD13* 04-03-2013 43.5178 °S 7.1315 °E SOSX CTD14 05-03-2013 42.6436 °S 9.4306 °E SOSX CTD15* 07-03-2013 42.6153 °S 9.5967 °E 4.5.4 Underway surface primary production and calcification experiments Water was collected from the underway scientific non-contaminated sea supply. This water enters the ship at a depth of ~5m. New production, nitrate and ammonium uptake A 2L water sample was spiked with 15 N (1 µmol K15NO3 / 100 µl) to analyse the uptake of nitrate. Spikes were adjusted to achieve 15N-NO3 ambient enrichments of ~10%. A 4L water sample was spiked with 15 N (0.05 µmol 15 NH4Cl / 100 µl) at ~10% ambient nutrient concentration to measure ammonium uptake and the sample was split into two 2L polycarbonate Nalgene bottles. The inoculated samples were incubated in tubes covered in neutral density filters that simulated 55 % of the ambient light conditions. Samples were placed into the incubators prior to sunrise to minimize light damage to the cells. Incubators were cooled with a constant flow of surface seawater to further simulate in situ conditions. The samples were incubated for 12 hours, following which the samples were filtered through pre-combusted 25mm Whatmann GF/F filters and dried in an oven at 40 °C for 24 hours. Ammonium regeneration Isotopic dilution NH4 regeneration experiments were conducted to correct for 15 14 NH4 re- + cycling in the NH4 incubation bottles. Immediately after spiking the 4L NH4 , exactly 2L was recovered and promptly filtered through a 25mm Whatman GF/F filter to collect 900 ml filtrate for transfer into 1.0L polycarbonate Nalgene bottles. Exactly 400 μl NH 4Cl solution (10 μmol / ml) was added to each of these bottles as a “carrier” prior to freezing the samples at. At the end of the 12 hr incubation period, a further 900 ml filtrate was recovered from the NH4 uptake filtration to measure 15 N isotopic dilution (Rt). Carrier (400 μl) was added and the Rt sample was frozen as before. The aqueous NH4 is to be recovered onto GF/F filters by diffusion and the isotopic composition (and dilution) measured by mass spectrometry back ashore. Calcification Calcification experiments were also performed on underway samples. 4L were collected. These samples were then spiked with ~210 μmol C ml‐1 13C‐stock (2.0 ml) to provide a DIC concentration of ~5%; assuming an ambient DIC concentration of ~2.1 mmol C l ‐1. Samples were then separated into two 2.0L Nalgene bottles and incubated for 12 hours in incubators at light levels corresponding to the collection depth. The samples were then filtered onto 25mm diameter pre‐ashed GF/F filters and dried in an oven at 40 °C for 24 hours. At each depth one of the filters will be acid fumed to remove PIC and one will not be fumed. The difference in 13 C fixation between the two sets of surface bottles ought to represent calcification. Table 2. Station positions for underway primary production experiments performed. Station Date Lat Long UND19 18-02-2013 38.0840 °S 11.5764 °E UND30 19-02-2013 40.9153 °S 9.3108 °E UND42 20-02-2013 43.3327 °S 7.3494 °E UND54 21-02-2013 46.1643 °S 4.9075 °E UND66 22-02-2013 49.2422 °S 2.0951 °E UND88 25-02-2013 43.8862 °S 6.8678 °E UND96 27-03-2013 42.6333 °S 7.2174 °E 4.5.5 Problems and Issues The underway, non-toxic scientific surface supply appears to be severely contaminated with rust. It is unclear whether this rust provides the phytoplankton with bio-available Fe or not but caution should be taken when interpreting the underway uptake experiments. The calcification experiments were initially under-spiked with only 0.5 ml being added to the 4L sample instead of 2.0 ml representing an enrichment of only ~1.25%. This coupled with the low volumes recovered due to the rust clogging up the filters may hamper detection of an adequate signal during mass spec analysis. Some of the Nalgene bottles were discoloured, which may affect irradiance levels. 4.5.6 Recommendations On future cruises it is recommended that additional 5L mixing jugs be brought along for sampling the CTD. There should be a mixing jug for each 4L sample collected so as to allow for longer mixing time once samples have been spiked. It is also recommend that new Nalgene bottles are purchased due to the discolouration in some of them. 4.6 Underway pCO2, DIC/AT and O2Ar measurements Written by Warren Joubert Key Participants: Warren Joubert, Leletu Nohayi 4.6.1 Underway pCO2 (General Oceanics pCO2 system) The partial pressure of CO2 (pCO2) gradient at the air-sea interface reflect the gas transfer across the sea surface. pCO2 in the ocean and atmosphere were measured continuously, southbound along the Bonus Goodhope transect, and at the process study between Stations A (~42.5oS) and Station B (43.5oS) during SOSCEX1. The instrument used is a General Oceanics equilibrator-based system with a Licor LI-7000 infra-red gas analyser, described by Pierrot,D.,et al. (2009). At equilibrium, the concentration of CO2 within the headspace of the equilibrator is directly related to the CO2 concentration in the water according to Henry’s Law. Three reference gases were used: 0.08, 321.97 and 402.8 which were provided and cross-calibrated to international standards by the GAW station at Cape Point. The instrument cycle included returning to these gases followed by atmospheric measurements once every six hours. All times and dates are UTM (GMT). Associated instruments logged on the same system include a GPS and atmospheric pressure in a deck housing roughly 5m above the Licor and equilibrator, the hull temperature at the seawater intake near the keel in the engine room (approximately 5 m below water surface), a Turner 10-AU fluorometer, a Fluke digital thermometer for equilibrator temperature, a differential barometer for equilibrator pressure relative to the atmosphere and an Idronaut 7sensor module with temperature and salinity. An auxiliary Aanderaa optode which is normally used with the system was damaged before the cruise and sent for repair was not available for this cruise. A few minor problems were experienced are briefly explained. Usually a 4 point calibration gas calibration cycle is followed, however, due to a leak in one of the connections for the STD2, the standard gas was empty within one day. STD2 was therefore excluded from the run cycle. Water flow rate fluctuated frequently due to the supply manifold diverting flow to several instruments, which require different flow volumes during different times. Flow rates through the equilibrator sometimes dropped to a minimum of ~2L/min and maximum of ~4.5L/min. This is outside of the optimum flow rate of between 3 – 3.4L/min. This was overcome by frequent monitoring of the flow rate by the operator, and adjusting the water distribution through the manifold. The pCO2 values were corrected for the temperature difference between in situ seawater and water in the equilibrator, using the algorithm proposed by Copin-Montégut (1988; 1989). After two weeks of the cruise, the pCO2 system was shut down for a few hours to clean the coarse filter which showed some biological (or iron) fowling in the filter. The filter and Idronaut 7sensor module was drained and rinsed with freshwater, and wiped clean with laboratory paper. Recommendations: All scientist using the latitude and longitude from the pCO2 system are aware of the flow rate issues, and check (and do the required adjustments) it every time the PC is checked. Figure 1. SST, SSS and raw pCO2 data output along the cruise track. Climatological frontal positions from Orsi et al 1995 overlain on the figure. 4.6.2 TCO2 (DIC) and Total Alkalinity (AT) Total dissolved inorganic carbon (TCO2) and total alkalinity (AT) samples were collected from the underway seawater lab supply, and at 10 depths for all CTD’s during the process stations. Samples collected for ship based analysis were stored in 500mL Schott bottles (identical to CRM bottles as supplied by A Dickson) and preserved with 400μL of 50% HgCl2 (Mercuric Chloride) to prevent further biological activity within the bottles. The 500mL samples were analysed on board using Mirianda’s VINDTA 3C (Versatile Instrument for the Determination of Titration Alkalinity). The VINDTA determines total alkalinity by potentiometric titration and TCO2 by coulometric titration from the same sample. For AT, approximately 100 ml (volumes calibrated before and after the cruise) is pipetted into a Titrino cell where it is titrated in 0.15ml increments with 0.1 N HCl (fortified with 0.6N NaCl). The differential potentiometric titration is followed using a glass electrode, reference electrode and auxiliary electrode beyond the second endpoint, and the AT is calculated using a modified GRAN function using the VINDTA software. For TCO2, a volume of approximately 20 ml (pre and post calibrated) pipette receives the sample is pipetted into a sintered glass stripper where 8.5% phosphoric acid converts the total carbonate to CO2. Moisture water is removed using a peltier controlled condenser maintained between 2 and 3oC. The CO2 is carried using N2 carrier gas into the coulometer cell (UIC model 5014 with 5011emulation) where it reacts with monoethanolamine to form an acid that causes fading of the blue indicator. A current flows to generate base that removes the acid, causing a return to the original blue colour. When the indicator colour is restored, the current required to restore the original blue colour is equivalent to the amount of CO2 according to Faraday’s Law. Our sampling strategy was focussed on the Lagrangian component of the campaign. We collected from 500mL from 10 depths at each of the hydrocasts. Samples were analysed at sea on the day of collection. Underway samples from the surface seawater supply were collected at 0.5 to 1 degree latitudinal intervals along the southbound leg between Cape Town and the Polar Front. A total number of 23 samples were collected from underway sampling stations and 110 samples from 13 CTD’s. Samples for DIC and AT were analysed in batches of 10 – 15 samples. Instrument calibration was performed by running duplicate Certified Reference Materials (CRM, Dickson, UCSD) before and after each batch. CRM batch 122 (AT = 2233.32 ±0.90µmol/kg; DIC = 2042±0.70µmol/kg) during analysis. Raw data for CRM’s AT and DIC values are shown in figure xx below. For AT, HCl concentration will be standardised using the daily average determined from the CRM values, while DIC concentrations, will be corrected using a linear offset between certified and determine CRM values of CRM analysed each day. Figure 2: Raw data certified reference materials (CRM’s) for AT and DIC during Soscex1. Means (black lines) were 2231.93 (±3.64) and 2026.73 (±9.2) µmol/kg for AT and DIC respectively. The high std dev for DIC is due to uncertainty associated with running duplicate DIC analysis from the same bottle (in other words atmospheric influence of opened bottles on DIC). Problems: The main problems with the analysis of DIC are related to the use of the General Chemistry container (highlighted separately). The power to the container was unstable, dipping by roughly 10V at a regular continuous frequency. This caused irregular charging of the UPS, resulting in it running down completely sometimes. The problem was remedied by changing the UPS power chord to the spare container. 4.6.3 Equilibrator Inlet Mass Spectrometry (EIMS) High resolution measurement of the spatial variability of net community production (NCP) using the O2/Ar ratio and gross primary production from triple oxygen isotopic analysis of oxygen was conducted underway and on discrete bottle samples respectively. Anomalies of O2/Ar relative to the long term atmospheric mean are driven by net autotrophic or heterotrophic activity. A positive ΔO2/Ar value accordingly indicates net autotrophic conditions and reflects the combined oxygen balance of the entire phytoplanktonic community. The oxygen triple isotope ratios are used to derive estimates of gross primary production. NCP (O2Ar ratios) were measured continuously, while a total of 76 discrete bottles were collected for GPP, and cross calibrations of O2Ar measurements. For O2Ar ratios, a continuous flow system that draws from the ship’s scientific seawater supply was linked to a micro capillary equilibrator that separates the gas and water phases (Cassar et al, 2009). The gas phase was analyzed on board using a Pheiffer quadropole mass spectrometer. A turbo pumping system attached to the micro capillary creates a vacuum which draws gas from the headspace of the equilibrator. The system included usually an Aanderraa oxygen optode and a number of thermocouples used to continuously monitor the temperature at each stage of the sampling cycle (and instrument), however this was not present during this voyage, and the DAQ system that controls monitors the thermocouples malfunctioned. The sampling period was < 10 seconds, and data was averaged for 2 minutes. The switching valve frequency was set to 2 hours water sampling, interspersed with 30 minute atmospheric sampling. This frequency was chosen to monitor the switching valve more regularly, since the switching valve program (python script) was hanging frequently during the first few days of the voyage. The underway system was calibrated using samples collected through the same lab seawater supply in evacuated flasks for later analysis in dual inlet mass spectrometer. The discrete lab samples were compared to in situ samples of surface water taken at all the CTD stations (surface niskin only) as well as the underway lab seawater supply. No data is available yet, since the post processing and calibration is not yet performed. Visual inspection of the data shows reasonable results although the o2ar ratios were mainly near equilibrium or undersaturated during the voyage. Considerable post-processing is required to flag data, mostly associated with valve changeovers or faulty (clogged) capillaries. The measured O2/Ar of the atmosphere was reasonably stable during the voyage, in a narrow range around 27.6, using laboratory air (See figure XX for an example of raw O2/Ar data output. The temperature logging system seemed to interfere with the switching valve causing it to hang (ie not change when at the 4hourly interval). The DAQ was therefore removed and the temperature was checked at regular intervals to see if it corresponds with the temperature of the intake water and the pCO2 water temperature. Similarly the flowmeter was disconnected and checked at regular intervals with a measuring cylinder, to ensured that it near 100 ml/min. Figure 3: Raw O2/Ar ratios for one day of sampling (8/03/2013) during the cruise. The atmospheric air O2/Ar ratio remained constant around 27.6. Water O2/Ar ratios were near saturation in the early morning, and showed undersatured ratios from ~08:00am on this day. 4.7 Fluorescence Induction and Relaxation (FIRe) Fluorometer Written by Fiona Preston-Whyte Key Participants: Fiona Preston Whyte, Sandy Thomalla, Eric Rehm Fast Repetition Rate flourometry (FRRf) allows one to investigate the photosynthetic efficiency of phytoplankton in terms of Photosystem I and Photosystem II’s electron transport system, thus it allows measurement of changes of the basic photosynthetic functioning responses. The FRRf protocol allows for the simultaneous assessment of the parameters in phase two (light reactions) of photosynthesis: PSII (the functional absorption cross section) and Fv/Fm (photochemical efficiency) (Suggett et al., 2009). This method uses active chl-a fluorescence measurements to evaluate the efficiency by which absorbed light is utilized by photosynthesis (Suggett et al., 2009), and so provides a measure of how efficient phytoplankton are at using light. Since the maximum photosynthetic efficiency of phytoplankton decreases under stressful growth conditions (Kolber et al., 1988), this concept has led to the use of FRRf to assess the large-scale photosynthetic condition of entire photosynthetic communities (Suggett et al., 2006; Behrenfeld et al., 1996; Moore et al., 2005, 2006). A bench top Satlantic FIRe (Flourescence Induction and Relaxation) system was used to measure a comprehensive suite of flourescence paramenters (e.g. Fv/Fm, σPSII) in both discrete and continues mode. The system is well described in the manual, and in several publications (e.g. Kolber et al., 1998). FRRf measurements are strongly dependent on prior light exposure, hence discrete samples are stored in a dark drawer for 20 minutes before being run, while continues samples were not exposed to light before the water flowed into the machine. 4.7.1 Discrete sampling The FIRe system was set up in discreet mode to analyse samples from the top six depth from all CTD's to get water column profiles of flourescence parameters. Samples were run from deepest to shallowest (except for the first two CTD’s-see data) to ensure even darkness exposure. The following settings were used for discrete sampling: Gain: to suit sample (typically 2000), sample delay 500 Number of samples: 16, in triplicate (fresh ample for each triplicate) STF 100, STRP 60, STRI 60, MTF 600, MTRP 60, MTRI 100. A blank was obtained for every station. Water from the chlorophyll max sample was filtered through a 25mm Whatman Glass Fibre Filter (GFF) and run for the gain settings used at that station. Post cruise processing All discrete samples where joint to their respective blanks and processed through a Matlab script created by Dr Brian Hopkinson (Princeton University). All samples where checked to a 10% error using a Matlab script designed my Dr Mark Moore (National Oceanography Centre, Southampton). Example of preliminary data CTD 14. Fv/Fm 0.15 0.2 0.25 0.3 0.35 0.4 0.45 0 20 40 Series2 60 80 100 4.7.2 Continues sampling In continuous mode the standard (default) settings were used. Gain: (600-2400), sample delay 1500 STF 80, STRP 40, STRI 60, MTF 20, MTRP 40, MTRI 100. A blank was obtained almost every day. Water from the uncontaminated water supply was filtered through a 25mm Whatman Glass Fibre Filter (GFF) and run for both continues and discrete settings. Post cruise processing The same processing as for the discrete sampling needs to still occur. 4.8 δ15N: Natural Abundance Nitrogen Isotope Ratios Written by Sandi Smart Key participants: Sandi Smart, Kirsten Packer 4.8.1 Introduction The natural ratios of stable nitrogen isotopes (15N/14N) act as tracers of physical, chemical and biological processes in the marine environment. Uncovering the natural distributions of 15 N/14N of various nitrogen pools could provide valuable information about the processes underlying these patterns in the Atlantic Sector of the Southern Ocean, where very little data of this kind currently exists. 4.8.2 Aim On the late-summer SOSCEx voyage (February-March 2013), the aim was to collect colocated dissolved nitrate (NO3-) and particulate nitrogen (PN) samples along the Good Hope Line and surrounds for isotope analysis; complementing a similar sample set collected the previous winter (July 2012). The nitrate isotope data (δ15N and δ18O of NO3-) will be used to investigate underlying processes such as ocean circulation and nitrification. Taken together, the isotope ratios of ambient nitrate and recently formed particulates is expected to yield more robust estimates of the isotope effect of nitrate assimilation for this region; with the ultimate goal of reconstructing past nutrient utilization in the different zones of the Southern Ocean. 4.8.3 Methods Surface underway and depth profile samples were collected along the Good Hope Line between Cape Town and ~50°S, as well as at selected stations on the 10-day process study track in the Sub-Antarctic Zone. Underway Sampling Two parallel filtering setups were constructed from a split in the underway water supply hose. Using four inline filter holders, both polycarbonate filter and GF/F particle collections could be made in duplicate at each underway station according to the following protocol: - Label 60mL sample bottles, lids, cryovials etc. and prepare log sheet ahead of time - Wearing vinyl gloves, flush the filtration systems through with “recent” underway water - Rinse & fill a beaker with MilliQ - Place a MilliQ-rinsed 47mm, 0.4μm polycarbonate (PC) filter into each in-line filter holder of the first parallel filtering setup using ethanol wiped forceps and put inflow-tubes back in receiving 5L carboys - Place a precombusted 47mm, GF/F into each in-line filter holder of the second parallel filtering setup using ethanol wiped forceps and put inflow-tubes back in receiving 25L carboys - Open taps - Remove bubbles from inline filter holders using air valves - Record start time, latitude, longitude etc. - As soon as possible, rinse the “PC” 60mL sample bottle (& lid) 3 times with a few mL’s of filtrate flowing through the polycarbonate filter before filling; and then rinse “GF/F” 60mL sample bottle (& lid) 3 times with a few mL’s of filtrate flowing through the GF/F before filling (leave some head-space for freezing!) - Take sample bottles to -20°C freezer - Allow to flow until PC filters clogging (~1-2hrs) or until GF/Fs reach ~25L and/or PCs reach ~10L (replacing receiving carboys before they overflow!) - Close taps - Record end time, latitude, longitude etc. - Record total volume filtered through each filter from graduations on carboys - If water remaining in filter holder does not flow through on its own, attach to vacuum flask / pump (without allowing them be completely sucked dry) Store Polycarbonate Filters - Wearing new gloves, roll up filter papers using forceps (not too tightly – fold in half, then half again, lengthwise), and place each one in a cryovial (wiping forceps between different filters) - add ~4mL of 0.2µm-filtered low-nitrate sea water to each cryovial using squirt bottle - then add 70μL of formalin fixative (37% solution) using pipette in fume hood, wearing nitrile gloves - seal and shake/roll fairly vigorously to re-suspend particles - Place each cryovial in a labelled ziplock bag - Put in fridge (~4˚C) for 1-4 hours; then transfer to liquid nitrogen dewer Store GF/Fs - fold GF/F in half using forceps and wrap in a square of (precombusted) tinfoil (spraying forceps with ethanol between different filters) - place in a labelled ziplock bag - then put these directly into dewer (don’t need to cool first) - Empty carboys (once volume recorded) Hydrocast / CTD Sampling From every biological CTD station sampled: A single 60mL nitrate sample collected from every depth (moving from surface to deep) Duplicate particle samples collected from 3 near-surface depths [10m, middle/halfway point, deep chlorophyll maximum (or base of high-chlorophyll zone if DCM/F-max isn’t clear) ~60m] Duplicate particle samples collected from the deepest depth [preferably 2000m; otherwise 1000m] Furthermore, at one of the biological CTD stations (SOSXCTD03): 2 entire 12L niskins collected (for filtering) from each of 4 depths: 250m, 500m, 1000m, 2000m. *NOTE: We want duplicate PN samples from each depth, so filters changed half-way (e.g. 10L through 1st filter, 10L through 2nd filter) Also collected a surface PN sample at the same site (i.e. filter underway or surface niskin) so we have a surface end-member The procedure for a typical CTD collection is as follows: - Label 60mL bottles, lids, cryovials etc. ahead of time - Stick a piece of lab-tape over each 60mL bottle lid, each of the 6 x 2L square bottle lids and on each 25L carboy lid - Find which niskins correspond to which depths and write on log-sheet [esp. 10m, midway, Fmax & 2000m/1000m] - Write niskin# on the lid of each of the 60mL sample bottles and collection carboy - Record latitude, longitude, date etc. of CTD station - Describe Fmax Collect all 60mL nitrate bottles: - Wearing vinyl gloves, rinse 60ml bottle and lid with seawater from the first niskin/depth, shake and empty 3 times (not touching inside of lid /bottle top or letting bottle touch CTD tap) - Fill bottle (not to top) directly from that niskin (i.e. not filtered) - Repeat for every depth/niskin - Transfer to -20⁰C freezer immediately - From each of the 3 shallow target niskins, rinse 2x square 2L carboys & lids with sample water 3 times (i.e. 4L from each of the 3 target depths), decant and transfer to filtration stand - Rinse both 25L carboys & lids (3 times) with sample water from 1 of the 3 deep target niskins, then decant a full niskin into the one carboy and another full niskin into the other carboy - transfer to lab (seal with parafilm and cover with black bag if unable to filter straight away) Shallow Particle Filtering: - ensure filtration rig glassware has been rinsed properly with 0.2µm-filtered, low-nitrate seawater / Milli-Q - Line up 6 bottles in front of corresponding filtration tower (A1, A2, B1, B2, C1, C2) - note on logsheet which is which - Record start volume in each square bottle - Rinse and fill a beaker with MilliQ - Place new GF/F onto each of the 6 frits and then a new 0.4μm polycarbonate filter on top of each GFF (after dipping filter in MilliQ, using ethanol wiped forceps) - Pour some sample water from each into its corresponding filtration tower - Switch ON pump - Check for leaks & adjust clamps if necessary - keep filtering and refilling (shaking bottle before pouring) until clogs and/or 2L used up and/or after 3-4hrs (without letting pump suck filters dry) - towards the end, add only small amounts at a time - Close tap on each filter tower as they finish & store filter papers -Switch OFF pump - Record end volume in each square 2L bottle Remove & Store Filter Papers - Roll up polycarbonate filter paper using forceps, and place in cryovial (wiping forceps between different filters) - add ~4mL low-nitrate sea water to cryovial using squirt bottle - then add 70μL of formalin fixative (37% solution) using pipette + a new pipette tip (& discard) in fume hood wearing nitrile gloves - seal and shake/roll to re-suspend particles - Place each one in a ziplock bag (labelled inside[PENCIL] & out) - Put in fridge (~4˚C) for 1-4 hours; then transfer to dewer - Remove (& discard) used GF/Fs from frits - Empty the 6 square bottles & large vacuum flask - rinse filtration glassware with low-nitrate seawater / Milli-Q Deep Particle Filtering: - Shake/swirl carboys to resuspend settled particles - Reattach carboys to pump & in-line filter holders - Open carboy taps (and turn pump on if needed) to flush through briefly with sample water; then close / turn off - Record start volume of water in each carboy (rough estimate from graduations) - Rinse & fill a beaker with MilliQ - Place new 0.4μm polycarbonate filter into each of the 2 in-line filtration housings (after dipping PC filter in MilliQ; using ethanol wiped forceps) - Open taps & switch ON pump - Loosen air valve to initiate flow and to release any bubbles from filter holder - Swirl/shake carboys occasionally - keep filtering until filter clogs and/or water used up - replace filters if clog early or to obtain duplicates (noting volume at this point) and continue until all water used up (note which cryovials from same 25L carboy) - Switch OFF pump - Record end volume in carboys Remove & Store Filter Papers - remove excess water in filter-holder using pump/vacuum flask... (but don’t let them be totally sucked dry) - Roll up filter paper using forceps, and place in a cryovial (wiping forceps between different filters) - add ~4mL low-nitrate sea water to cryovial using squirt bottle - then add 70μL of formalin fixative (37% solution) using pipette in fume hood wearing nitrile gloves - seal and shake/roll to re-suspend particles - Place each one in a labelled ziplock bag - Put in fridge (~4˚C) for 1-4 hours; then transfer to dewer - empty any remaining water from the 25L carboys - flush filtering system through with Milli-Q 4.8.4 Station Data Underway Sample Collection -- START -- -- END -Time Time Station ID Date (GMT) LAT LON Date (GMT) LAT LON LOWNCOL01 2013/02/17 11:52:33 -35.6340 13.4331 2013/02/17 14:52:43 -36.0861 13.1046 SOSXUND15 2013/02/17 20:12:47 -36.8889 12.4897 2013/02/17 20:51:05 -36.9892 12.4170 SOSXUND21 2013/02/18 07:56:13 -38.7145 11.0755 2013/02/18 08:43:15 -38.8462 10.9794 SOSXUND22 2013/02/18 12:00:43 -39.2408 10.6691 2013/02/18 12:50:19 -39.3092 10.6038 SOSXUND26 2013/02/18 19:58:06 -40.2996 9.8260 2013/02/18 20:40:26 -40.3736 9.7665 SOSXUND32 2013/02/19 07:57:18 -41.1756 9.1331 2013/02/19 08:47:20 -41.2306 9.0938 SOSXUND34 2013/02/19 11:59:35 -41.4417 8.8955 2013/02/19 12:49:19 -41.5021 8.8401 SOSXUND38 2013/02/19 19:59:03 -42.2801 8.2293 2013/02/19 21:18:48 -42.4413 8.0912 SOSXUND44 2013/02/20 07:54:54 -43.8076 6.9380 2013/02/20 09:24:35 -43.9861 6.7831 SOSXUND48 2013/02/20 15:58:12 -44.5462 6.3253 2013/02/20 17:24:58 -44.7525 6.1293 SOSXUND50 2013/02/20 19:56:22 -45.1167 5.8331 2013/02/20 21:30:33 -45.3156 5.6509 SOSXUND54 2013/02/21 04:12:15 -46.2004 4.8801 2013/02/21 05:48:29 -46.4229 4.6863 SOSXUND56 2013/02/21 07:57:55 -46.7095 4.4390 2013/02/21 09:38:05 -46.9148 4.2560 SOSXUND60 2013/02/21 15:56:18 -47.6894 3.5337 2013/02/21 18:04:22 -47.9800 3.2719 SOSXUND66 2013/02/22 04:08:15 -49.2664 2.0755 2013/02/22 06:28:05 -49.5693 1.8133 SOSXUND70 2013/02/22 12:01:50 -50.1493 1.2600 2013/02/22 14:10:03 -50.2483 1.0865 SOSXUND74 2013/02/23 15:56:47 -48.4861 2.8351 2013/02/23 18:04:10 -48.1414 3.1076 SOSXUND82 2013/02/24 15:56:23 -45.8215 5.1937 2013/02/24 17:58:08 -45.5025 5.4773 SOSXUND88 2013/02/25 04:03:28 -43.8629 6.8879 2013/02/25 05:47:49 -43.5825 7.1238 SOSXCTD03 2013/02/25 20:08:09 -42.7012 8.6670 2013/02/25 22:00:05 -42.7194 8.7201 SOSXCTD08 2013/03/01 01:11:22 -42.7409 8.8108 2013/03/01 02:34:59 -42.7453 8.8029 SOSXCTD09 2013/03/02 02:48:13 -43.4232 7.1769 2013/03/02 04:22:03 -43.4253 7.2041 SOSXCTD14 2013/03/05 01:31:42 -42.6461 9.4344 2013/03/05 02:50:57 -42.6311 9.4288 SOSXUND180 2013/03/08 08:00:09 -41.5753 8.7744 2013/03/08 09:10:59 -41.3968 8.9255 SOSXUND184 2013/03/08 16:00:34 -40.3532 9.7654 2013/03/08 17:09:23 -40.1729 9.9044 SOSXUND190 2013/03/09 04:06:03 -38.4779 11.2516 2013/03/09 05:15:03 -38.2769 11.3600 SOSXUND198 2013/03/10 04:01:10 -35.3232 13.6637 2013/03/10 05:21:53 -35.1164 13.8187 CTDs: Nitrate & PN Sample Collection Start Time Depth (m) of PN Station ID Type Date (GMT) LAT (°S) LON (°E) nitrate sample sample SOSXCTD01 shallow 2013/02/23 02:41 49°15.96 02°03.37 surface Y 20 Y fmax Y 60 therm 200 500 SOSXCTD02 shallow 2013/02/24 04:54 46°57.761 04°30.365 1000 Y surface Y 20 Y fmax Y 60 therm 150 200 500 1000 Y deep (PN SOSXCTD03 profile) 2013/02/25 20:05 42°42.059 08°39.971 10 50 100 150 200 250 Y 500 Y 750 1000 Y 1250 1500 1750 SOSXCTD04 shallow 2013/02/26 02:30 42°38.700 08°41.201 2000 Y 10 Y 20 Y 30 Y 40 60 100 200 400 600 800 1000 SOSXCTD06 SOSXCTD07 deep shallow 2013/02/27 2013/02/28 16:10 01:16 43°29.848 43°30.383 07°10.796 07°11.147 surface Y 1000 Y 2000 Y surface (10) Y 20 Y fmax (30) Y 40 60 100 300 500 800 1000 SOSXCTD11 deep 2013/03/03 01:01 42°40.549 09°11.355 surface (10) Y 20 Y fmax (40) Y therm (60) 100 300 500 1000 SOSXCTD13 deep 2013/03/04 01:24 43°31.072 07°78.88 2000 Y surface Y 20 Y 40 fmax (60) Y 100 300 500 1000 SOSXCTD15 shallow 2013/03/07 02:00 42°36.916 9°35.802 2000 Y surface (10) Y 20 Y fmax (30) Y 40 60 (therm) 200 500 SOSXCTD16 deep 2013/03/09 09:55 37°44.952 11°40.726 1000 Y surface Y fmax (30) Y 70 (therm) Y 90 150 300 500 800 1000 1500 2000 Y 4.8.5 Preliminary Results Summer samples will be shipped to Princeton University, USA, for isotope analysis (as was done with samples from the previous winter cruise). 4.8.6 Problems/Issues - Iron contaminated underway water supply (larger rust particles in inline filter-holders also leading to polycarbonate filter tears) - Not enough space in dewer for particle samples (cryovials and GF/Fs) - Communal MilliQ system not being installed led to delays in acid washing and thus the start of sampling 4.8.7 Recommendations - Clean / replace underway water supply system - A -80°C freezer or additional dewer for storing particle samples - Install communal MilliQ system 4.9 Bio-optics Written by Sandy Thomalla and Eric Rehm 4.9.1 Introduction Climate models and decadal data sets predict changes in the earths climate that will influence the effectiveness of the Southern Ocean CO2 sink; however the regional character of the sensitivity of biological production to predicted changes in the earths climate are unknown. Part of the lack of understanding of the Southern Ocean’s biological seasonal cycle, and its sensitivity to various physical forcing mechanisms, lies in operational limitations to resolving these questions at the required in situ spatial and temporal scales. This has necessitated the use of remotely sensed techniques that are able to address the temporal and spatial scale gaps in our knowledge of a hitherto under sampled ocean. Ocean colour remote sensing can provide routine, synoptic and highly cost-effective observations of biological and biogeochemical response to physical drivers across oceanic ecosystems, over decadal time scales and at high frequency. In many cases, remotely sensed data are the only systematic observations available for chronically under-sampled marine systems (e.g. the polar oceans), and there is thus a need to maximise the value of these observations by developing ecosystem-appropriate, well characterised products. Phytoplankton cell size and elemental stoichiometry are physiological traits that have the potential to impose fundamental constraints on growth rates, food web structure and biogeochemical cycling of carbon (Finkel et al., 2010). An improved understanding of how phytoplankton community size structure will respond to climate change is required in order to improve our understanding of the biological pump and the ability of the ocean to act as a long-term sink for atmospheric carbon-dioxide (Kohfeld et al., 2005). The significance of unveiling relationships between optical properties and physiology is that it provides a new tool for investigating routine, broad-scale changes in algal physiology that will allow insights into the causative environmental forcings of the observed variability. A primary focus of this study is on gathering the necessary bio-optical and physiological data to develop and validate appropriate regional ocean colour algorithms. Derivation of new algorithms relies upon the acquisition of a large variety of in situ data. This includes biooptical data in the form of IOP (scattering, beam attenuation, absorption) from CTD sensors, and underway sensors as well as Apparent Optical Properties (AOP) (radiance, irradiance, reflectance, diffuse attenuation coefficient) from a profiling radiometer (e.g. the new Biosphericals Compact-Optical Profiling System - C-OPS). Large quantities of in situ biogeochemical data that accompany the bio-optical data are necessary to characterise the relationship between IOP, carbon content, size structure and dominant functional types of the phytoplankton community. In addition, physiological data are required from 15 N primary production measurements, and photo-physiological (e.g. FV/Fm) responses to light and / or Fe-limitation. The above listed bio-optical, biogeochemical and photo-physiological data will be used to parametrise the particle field (dominated by the phytoplankton community) through empirical relationships between IOP and size, pigment and carbon content. This information in conjunction with radiative transfer models and reflectance inversion algorithms will allow us to use satellite derived ocean colour data to investigate biological responses (through changes in biomass, community structure and physiology) to event, seasonal and inter-annual variability in ecosystem physical drivers at the required spatial and temporal scales. Given the important relationship between community size and carbon export (Finkel et al., 2010) these approaches will allow us to assess the potential for carbon cycling and carbon sequestration at the regional scale 4.9.2 Aims 4.9.3 Bio-optics sampling AC-S The AC-S measures absorption and beam attenuation at hyperspectral resolution with approximately 85 wavelength bands between 400-750 nm (~ 4 nm bandwidth). As with the BB9, the instrument was set up in underway mode, with the ships sea water supply continually feeding into the beam attenuation and absorption flow chambers. The outlet of the flow chambers filled a Perspex tube which contained the instrument itself and kept the instrument at a constant temperature similar to that of the sample water. When in underway mode the instrument was set up to record data for two minutes at 10 minute intervals. The two major problems identified with the ac-s in underway mode is air locks that prevented sample flow in one or both of the flow chambers for lengthy periods of time. Bubbles were the other major issue that corrupts the data when they flow through the chambers and worse yet appear to get lodged in the flow chambers for lengthy periods of time. As there is no visual display for data collection when in underway mode, bubbles were difficult to detect. This needs to somehow be rectified or improved. Sample water from three depths of each CTD were run through the ac-s using a pressurised carboy forcing the sample water up through a straw out of the carboy and into the ac-s system. This system of getting the sample into the ac-s was thwart with bubble issues. Either the carboy was pressurised too much (which introduced bubbles) or not enough (which prevented flow). This system needs to be improved on future cruises. It was not until CTD 18 that it was understood that filtered sea water was supposed to be run through the ac-s to determine the dissolved signal. From CTD 18 onwards, one filtered sea water sample combining filtrate from all three CTD depths was run through the ac-s. Subsequently, on leg 2 and 3, a dissolved sample (from GFF filtrate) was run through the ac-s at each biological underway station every 3 and 4 hours respectively. Field water dirty (before cleaning) and clean (after cleaning) calibrations flowing milli-q through the ac-s were carried out four times during the cruise. Air tracking, when the ac-s was left overnight to dry after cleaning, was carried out three times during the cruise (at the ice, at Marion and one day outside of PE). Filtered / unfitered BB9 The WetLabs BB9 instrument provides a backscatter measurement at 9 different wavelengths. The instrument was set up in underway mode, in a large volume black bin as the flow chamber with continual ships underway water supply. The residual time for sample water in the flow chamber is unknown but ought to be determined to assist with post cruise data processing and binning. The instrument was set up to record data for two minutes at 10 minute intervals. The large volume needed to fill the BB9 flow chamber >50L made it impossible to sample backscattering measurements from the three CTD depths. Acidified / non acidified Fiptered milli-q?? need to dokl 4.10 Coulter Counter Written by Emma Bone Key Participants: Emma Bine, Sandy Thomalla, Natasha Horsten The instrument was set up as per standard protocol Electrolyte was generated by first filtering seawater through a 0.8um polycarbonate filter/ or Whatman GF/F, followed by filtering through a 0.2um isopore polycarbonate filter. The 100um aperture tube was inserted and calibrated using 14 drops of 20um beads During the initial test runs the machine failed to analyse the correct volume of sample (40ml for 20 runs). It was soon after discovered that the Accuvette tube was not sealing properly and filtered seawater was being mistakenly acquired from the electrolyte jar. The problem was appeased upon fixing the seal. A specific SOP was created for the SOSCEx cruise, which standardly made use of the 100um aperture, sampling 20 runs at 2ml per run. At one stage the number of runs was increased from 20 to 30 to try and resolve the larger particles. After a few trial underway and CTD stations it was determined that the additional 10 runs made no significant difference to the number of large particles detected. GF/F filtered seawater taken from the respective samples served as the sample blanks, run during every underway and CTD station. In between stations the sample beaker was filled with MilliQ and the system was drained and filled 3X before being flushed. During the station, in between the blank and the sample, the machine was drained, filled and flushed once with filtered seawater. All samples were sufficiently inverted before being analysed. The Iron Lab made use of the Coulter Counter for their Bio Assay Experiment. There were typically twelve samples- four variations collected in triplicate: low light low iron, low light high iron, high light high iron and high light low iron. The single blank and all the samples underwent 15 runs. There was no draining, filling and flushing of the system in between the triplicate runs. Sandy, Natasha and myself carried out the runs from Monday the 4th to Friday the 8th March. 4.11 Particulate, de-pigmented particulate absorbance and Gelbstoff Written by Emma Bone Key participants: Emma Bone, Sandy Thomalla Particulate absorbance (PA), de-pigmented particulate absorbance (DP) and Gelbstoff (GB) analysis was performed on a Shimadzu UV-2501 spectrophotometer. Samples were collected from all underway and CTD stations, with as close to 2L of seawater as possible being filtered through GF/Fs. A MilliQ-filtered blank was run daily. Particulate Absorbance (PA) The filters were processed as soon as the filtering was finished (stored in petri dishes); A few drops of MilliQ were added to the filter pads (PA) to ensure the moisture levels remained constant for all samples (a dry filter has a higher absorption) The spec was turned on and allowed 10min to warm up The UVPC software was started and the spec was connected to the computer through COM1 The spec ran through its utilities check list and the following settings were adjusted: o Lamp change: 340nm o Measuring mode: ABS o Wavelength range (nm): Start: 800, End: 350 o Scan speed: slow o Slit width (nm): 5 o Sampling interval (nm): 1 A baseline scan was run to ensure the background noise was between -0.005 and 0.005. Sometimes there was a lot of noise, adjusting the connection between the integrating chamber and the spec could sometimes improve this value. A blank of MilliQ filtered GF/F was read once a day The scale was set between 0-1 when reading CTD samples and 0-2 when reading underway samples. Once complete, the file and data channel saved and ASCII file exported, the filter was placed back in the petri dish and soaked in methanol until later DP analysis. Unfortunately for the majority of underway and CTD stations Emma did not place the filter correctly within the membrane clamp, resulting in the erroneous measurement of the blank section of the filter. The mistake was regrettably only identified at a late stage of the cruise and only fully corrected by UND130/ CTD13. (There is a distinct difference in profile between underway and CTD samples; CTD16 vs. UND192PA shows the discrepancy at the lower wavelengths- is this normal, or possibly due to the iron contamination?) De-pigmented Particulate Absorbance (DP) The filters were stored in methanol, in the dark, (following PA analysis) for 24h or more, and checked regularly to ensure the methanol did not evaporate. Filters were placed on a designated filter set-up (funnel, clamp and receiver flask) and methanol was poured over the membrane (3x medicine dropper squirts), followed by a similar amount of MilliQ (to remove the methanol). It was at this point that Sandy noticed no matter how much methanol she added the membranes never cleared completely, leading to the discovery of rust contamination in the underway system. The petri dishes were rinsed thoroughly with MilliQ before their respective filters were placed back inside. The filter was read on the spec with the same settings used for PA. Gelbstoff (GB) The filtrate from the PA/ DP sample was collected for GB measurements Samples were stored in amber bottles, in the dark, until there was a sufficient quantity to be run in bulk (typically 10 samples). The spec was turned on and allowed 10min to warm up Cuvettes were cleaned thoroughly with ethanol before being carefully rinsed with MilliQ The spec ran through its utilities check list and the following settings were adjusted: o Lamp change: 380nm o Measuring mode: ABS o Wavelength range (nm): Start: 800, End: 250 o Scan speed: very slow o Slit width (nm): 5 o Sampling interval (nm): 1 A baseline scan was run to ensure the background noise was between -0.005 and 0.005 The scale was set between 0 and 0.2 when analyzing samples Four blanks were used for each session, using room temperature MilliQ in the cuvettes: o Baseline blank (no cuvettes) o Blank (reference cuvette only) o Sample blank (sample cuvette only) o Blank + sample blank (both reference and sample cuvettes) Cuvettes were rinsed between samples, twice with MilliQ and once with the imminent sample Files and data channels were saved and ASCII files exported before the cuvettes were cleaned thoroughly and stored safely. (I noticed that there is a difference in absorbance between samples read immediately and those read after 24h; SXU174GB was read immediately and showed a lower absorbance than SXU174TG, which was the same sample read 24h later. Not sure if the difference is significant. The profile shape remained the same.) 4.12 Trace metal Iron (Fe) in seawaters: south of Atlantic Ocean (Transect and Langangian process study) Written by Thato Mtshali, Key participants: Thato Mtshali, Natasha van Horsten, Bjorn von den Hyden, Raimund Rentell 4.12.1 Introduction Iron is a critical nutrient for the primary productivity in the ocean. Due to its low solubility, low supply and complicated redox chemistry, iron can be a limiting factor for the growth of phytoplankton in the open HNLC regions of the Southern Ocean (de Baar et al., 1990; Hutchins and Bruland, 1998; Martin and Fitzwater, 1988). There is an increasing interest in resolving the distribution and transport pathways of iron into the oceans. Over the past few years it became evident that the atmosphere (Duce and Tindale, 1991), rivers (De Baar and de Jong, 2001), hydrothermal activity (Tagliabue et al., 2010; Klunder et al.,2010) and advection of shelf derived sediment to the open ocean (Bucciarelli et al., 2001; Lam and Bishop, 2008) are significant transport pathways for this element to the ocean. Soluble and particulate Iron (SFe and PFe) also plays an important role in Fe bioavailability for phytoplankton uptake mechanisms (reference). Moreover, in the deep ocean, organic complexation and the distribution over different size fractions determines precipitation and adsorption on particles (Thuroczy et al., 2010). High resolution transects and increasing comparison with other chemical and physical parameters, determination of Fe in different size classes and insight in organic complexation enable scientists to better constrain the distribution and the sources, sinks and biological availability of micronutrients in the Ocean. The availability of irradiance in the Southern Ocean is another environmental limiting factor for phytoplankton growth. PAR may be sub-optimal in other regions of the Southern Ocean due to low sun angle, strong wind mixing, cloud formation and sea-ice cover. Despite this confirmation of the role of Fe and light in phytoplankton growth processes, a large number of ship-board Fe/light limitation experiments in the Southern ocean has been conducted (especially in the subAntarctic zone; SAZ) in order to understand how the resident phytoplankton adapt to deprivation of these limiting factors. These studies have showed that seasonal progression of factors controlling growth of eukaryotic phytoplankton in the SAZ waters may be irradiance in winter, Fe/light in early spring and autumn when water column light levels are elevated because of shallow mixed layer dynamics (MLDs), and higher incident irradiances. Silicic acid levels may also be one of the limiting macronutrient in the Southern Ocean, with high levels south of the Antarctic polar front (APF) and lower levels north of the APF. 4.12.2 Voyage Objectives and Cruise track A prominent region of high productivity occurs at 40.0 to 45.0S in the south Atlantic region in an ocean basin with low concentrations of micronutrients such as Fe but high concentration of macronutrients (N, P). The question we aimed to answer is: how micronutrient Fe is supplied to support the productivity in this region, and how does phytoplankton community growth (PP) adapt to Fe and light deprivation? The SOSCEx SC1 voyage undertook a zonal transect along the GoodHope line, along the 0 meridian to 50.0S in the southern Atlantic ocean. Two study sides were proposed (see Figure 1): a ‘transect’ and a ‘Lagrangian process’ studies by following floats and gliders at 42.5 and 43.5S. Three types of sampling stations were proposed to achieve our aims: (i) to measure/investigate Iron particulate (PFe) profile at 4 different water masses along the Good 0 meridian transect, (ii) to perform a ‘transect and Lagrangian process studies’ for dissolved, soluble and total dissolved Fe concentration (DFe, SFE and TDFe), and (iii) to setup a bioassay Fe, light incubation experiments at the beginning of the Lagrangian process study. Specific aims of the project: 1. To undertake integrated zonal oceanographic ‘transect’ and ‘process’ studies south of South Africa in the Atlantic region, studying the marine biogeochemical cycles of Fe as part of Southern Ocean Seasonal Cycle Experiment (SOSCEx) contribution to the multi-constitutional Southern Ocean Carbon – Climate Observatory (SOCCO) program. 2. To test new trace metal Fe chemistry facilities (Trace metal CTD rorette, sampling protocol, clean containers and analysis of Fe concentration in seawater using Flow Injection Analyser). 3. To better characterise the ferricline, the depth at which dissolved Iron (DFe) concentration begin to increase. This feature is around 70 – 100 m in summer and we will sample at higher resolution to better characterise its location and degree of variability. 4. To investigate the role/effects of micronutrient Fe and light as co-limiting factors for phytoplankton growth in the Southern Ocean. 5. For the first time, to establish the full water column, basin-scale distribution of Fe pools (DFe, TDFe, SFe and PFe) and to determine the processes and distributions of this Fe pool with an idea of writing the first review paper from the South African group on Fe chemistry (SOCCO). Figure 1.Scematic of intended sampling strategy for SOSCEx process study. Goodhope line marked in black. Ship will only follow this line to 55oS. Red stars represent station initiation locations. Red circles indicate the GEOTRACES CTD Station positions carried out at biooptics float positions. Dotted black line represents ship trajectory between stations. Voyage activities: The following activities were conducted on-board the RV SA Agulhas to meet our scientific objectives: 1. 4- CTD rosette to 1000m at 4 stations of different water masses along the 0 meridian transect and GoodHope line for particulate Iron (PFe) sampling. 2. 9- CTD rosette to 1000m during the ‘transect’ plus the ‘Lagrangian process’ studies for DFe, TDFe and SFe. 3. 9- stations to 1000m for macro-nutrients analysis from the Fe profile (Nitrate, Phosphate and Silicate; using FIA autoanalyser, General chemistry). Since Fe profile behave like nutrient profile. 4. 2- stations for bioassay Fe and light incubation experiments seawater was collected at 40m of the sub-surface chlorophyll maximum (SCM). The seawater manipulated for Fe concentration was performed under laminar flow hood inside a trace metal clean container laboratory. Subsamples were transported into specially designed incubators with adjustable temperature and LED lights for Photosynthetic Active irradiation (PAR). 4.12.3 Methods Sampling Processes recommended by the new international program GEOTRACES were followed as closely as possible (GEOTRACES cook book, 2010; Gregory Cutter et al., 2012; Maeve Lohan et al., 2010). Seawater for trace metal measurement/work were collected from surface 15m down to 1000m depth using a trace metal GEOTRACES CTD rosette equipped with 24 x 12L GoFlo bottles specially modified for trace metal water sampling. A carousel Auto Fire Mode (AFM) pressure sensor was attached on the rosette to trigger GoFlo bottles during the upward cast. The rosette was deployed using a Dynema hydroline (General oceanics inc.) and a controlled depth winch. Care was taken in order to avoid any contamination from the ship and the operating personnel (see APPENDIX A; deployment and retrieval procedures). Upon recovery, zip-lock bags were placed onto the Go-Flo sampling Teflon valves and covered the rosette bottles with blue plastic sprouts/cover. GoFlo bottles were then immediately transferred into a trace metal clean laboratory container through a plastic covered hetch on the Heli deck for sampling. A full depth deployment of the trace metal rosette, with all bottle handling conducted in a clean container, allowed collection of chemical samples for Fe prone to contamination (Table 1 in APPENDIX B show stations where samples were collected and minimum and maximum depth). 4.12.4 Bio-assay Fe, Light incubation experiment Key participants: Dr. Thato Mtshali (PI: CSIR), Natasha van Horsten (MSc student at Stellenbosch University) 2 Fe/light bioassay ‘evolution experiments’ were performed during the beginning of the ‘Lagrangian process’ study. Seawater for incubation was collected at two stations in the Subtropical Front (See Table 2, Appendix B) where gliders and floats were deployed and/or retrieved. Seawater was collected at at high chlorophyll maximum of the water column (40m for experiment 1 and at 30m for experiment 2). In order to have enough seawater for bioassay experiments, about 12 – 15 x 12L GoFlo bottles mounted on a TM CTD/rosette were triggered at the same depth. Up-on recovery, the GoFlo bottles were transported inside a clean container. The GoFlo bottles were shaken before sampling (to form a homogenous mixture) and seawater with resident phytoplankton was filtered through a 200µm pore size mesh (to remove zooplankton) using PFA Teflon Tubing (Chemfluor PFA Teflon Tubing, 9.5mm OD / 7.9mm ID; 96001-22; Laboratory consumables and chemical supplies) attached onto a GoFlo sampling valve into an acid cleaned 2 x 50L LDPE carboys (Thermo scientific). 2.4L polycarbonate bottles (*Nalgene* Square PC Bottles with PP screw closure; 03-309; Thermo Scientific) for bioassay experiments were then filled equally (to ensure uniform initial conditions) with filtered seawater from the cowboys under the laminar flow hood. For each experiment, acid washed 9 x 2.4L polycarbonate bottle were prepared per matrix in triplicates and 3 bottles as control at time zero. This gave a total of 39 x 2.4L PC bottles per experiment. Seawater samples were then adapted a matrix of 4, HL-HFe, HL-no Fe, LL-HFe and LL-no Fe for a period of 6 days onboard the ship. Samples were allowed to adapt to a night and day cycle of 10:14. First experiment was started at 9:30 am while experiment 2 at 12:30 pm. Subsamples were collected at the beginning of the experiment (t0) and every 2 days (t1, t2 and t3) by terminating three bottles per matrix (see Fig 2 below). The following parameters were measured routinely, nutrients (N, P and Si) and PSII characteristics using FRRF to check the effect of Fe and light on the phytoplankton growth. Samples were collected at the same time during the experiment (sunrise). Before every sample analysis, bottles were shaken 20 times to homogenise. Fig. 2: Experimental scheme for Fe/light limitations Iron, light and temperature manipulations Samples were manipulated/spiked with Fe under laminar flow hood inside a clean class-100 container. The following experimental conditions were prepared, 1) HFe samples– were prepared as acidic 1.0 nM Fe from the stock solution (Iron Atomic Spectroscopy Standard Conc. 02679-1EA; Sigma Aldrich), 2) LFe samples – were left un-amended, 3) LL – was set/adjusted based on the in situ PAR value obtained at the sampling depth, 4) HL – was set 10% PAR of the LL value, 5) Temperature – was set/adjusted to mimic the in situ conditions to those of the sampling depth. Incubator set-up Two incubators (Minus40 Specialised Refrigeration) that can hold 40 x 2.4L PC bottles were placed in the heli deck and covered with a black plastic sheet on the door to prevent interference from external light. The incubators are equipped with adjustable LED strip light at the top of each shelve to provide PAR, and a cooling fan for temperature adjustment. Temperature was measured/set using a hand-held Penta Digital thermometer probe (Minus 40), while PAR was measured/set using a hand-held 4π PAR sensor (Biosphere QSL 2100; Biospherical Instruments Inc). The following parameters in Table 3 with volumes were collected during the experiment for analysis and filtration. Nutrients Nitrate (NO3 +NO2) and silicate (SiO4) were determined using the Lachat QuikChem 8500 series 2 Flow Injection Analyser. Method 31-107-04-1-E was used for the determination of the nitrate while Method 31-114-27-1-D was used for the silicate. Phosphate (PO4) and Nitrite (NO2) were determined manually according to the method described in Grasshoff et al., (1983) and Parsons et al., (1984). The results obtained were to an acceptable standard. About 30ml subsamples were collected from each sample matrix per experiments in triplicates for nutrient analysis (Nitrates, Phosphates and Silicates) on board the ship using Flow Injection Analyser. Chlorophyll and Pigment Dr. Sandy Thomalla and Ema (CSIR, UCT for sample analysis),Natasha van Horsten (CSIR MSc student at SUN) About 400ml and 600ml seawater per sample matrix was vacuum filtered through a 25mm Whatmann GF/F glass fibre for Chlorophyll and pigments, respectively. The pouring bottle was rinsed out once with filtered and sterilized (using microwave) seawater as well as the filtration glassware, to ensure complete transference of all particulate. Each sample was filtered in triplicate. The filter papers were folded and placed in a cryovials which were then stored in liquid nitrogen until time of analysis. Particulate organic carbon and nitrogen (POC and PON) Natasha van Horsten (CSIR MSc student at SUN), Dr. Eva Buciarelli (Brest University in France for sample analysis) Particulate organic carbon and nitrogen (POC and PON): 700ml seawater samples per matrix were vacuum filtered through a pre-combusted (at 400C for 12 hours) 47mm Whatmann GF/F glass fibre filters. The pouring bottle was rinsed out once with filtered and sterilized (microwave) seawater as well as the filtration glassware, to ensure complete transference of all particulate. Each sample was filtered in triplicate. Filter paper was folded once and rolled up and placed in a glass vial with an aluminium foil lined cap. The vial was placed in an oven at 60°C for 24 hours to dry. The glass vials containing the filters were then placed in a ziplock bag containing silica gel to be kept dry while stored. Biogenic Silica (BSi) Natasha van Horsten (CSIR MSc student at SUN), Dr. Eva Buciarelli (Brest University in France for sample analysis) Biogenic Silica (BSi) samples: 300ml seawater per matrix was vacuum filtered through a 47mm 0.2μm polycarbonate filters. The pouring bottle was rinsed out once with sterilized and filtered seawater as well as the filtration glassware, to ensure complete transference of all particulate. Each sample was filtered in triplicate. Filter paper was placed in a petri dish which was placed in an oven at 60°C for 24 hours to dry. Petri dishes were covered in aluminium foil, labelled and placed in a ziplock bag containing silica gel to be kept dry while stored after drying. Total Iron (TFe) Dr. Thato Mtshali (PI; CSIR), Raimund Rentell (MSc at SUN) About 50ml subsamples were collected from each matrix per experiment in triplicates for TDFe and acidified with ultra-pure 30% HCl to pH <2 (100µl/50ml). Subsamples were stored at room temperature to be analysed using Flow Injection Analyser (FIA) back in the laboratory at SUN/CSIR. Analysis could not be done at sea due contaminate water from the ship. Taxanomy - Coulter Counter Dr. Sandy Thomalla (CSIR), Natasha van Horsten (CSIR MSc student at SUN) (see section 4.10 for more information on coulter counter analysis) Fast Repetition Rate Fluorometer (FRRF) Dr. Thato Mtshali (PI; CSIR), Dr. Susanne Fiets (SUN), Natasha van Horsten (CSIR MSc student at SUN) About 10ml seawater samples for phytoplankton photosynthesis measurements using FRRF (FastOcean with FastAct FRRF, 2220-173-PL; Chelsea, SMD Telecommunications (Pty) LTD) were collected by using a 50ml vials inside a clean container. All sample analysis for this measurement was conducted on-deck inside a clean General chemistry laboratory. After 30 minutes of dark incubation, phytoplankton in samples were assumed to be dark adapted. Before sample analysis, vials were inverted to homogenise sample and sample water was then used to wash a pyrex test tube once before filling with roughly 2ml of sample. The filled test tube was then wiped with tissue paper before being inserted into the Fast Repletion Rate Fluorometer to remove any finger prints. The FRRF instrument used was a FastAct with FastOcean sample chamber (Chelsea Technologies Group Ltd; FastAct base unit, and FastOcean sensor). The sensor water jacket was filled with Milli-Q pumped from a temperature controlled circulating water bath. FRRF measurements were then taken as follows: i) Single Turnover (ST) acquisitions were taken for all samples to obtain measurements of, among others, Fv/Fm (the maximum photochemical efficiency of Photosystem II (PSII), dimensionless) and σPSII (the functional absorption cross section of PSII photochemistry, nm2); ii) Fluorescence Light Curves (FLC) were taken for all samples to obtain a P vs E curve (rPE) with the following parameters, α (slope; the fit value of the Fv/Fm), EK (the PAR value at the inflection between α and the asymptote of the alpha phase fit), Pm (the light-saturated value of rP from the complete fit) and (photo-inhibition). The water jacket pump was run between samples for ST measurements and continuously at a same rate during FLC analysis to maintain sample temperature at that of the in sampled seawater. Note: Blanks were run for nearly all samples using the following procedure: an aliquot of roughly 3ml of sample was filtered using a 0.2μm pore size filter and an ST measurement was then made using the same FRRF settings as the unfiltered sample (NB. The test tube used for the blank was washed 3 times with filtered water prior to the filling with 3 ml of filtered sample). For this cruise MQ water was used for calibration at the beginning of the analysis. 4.12.5 CTD Rosette and underway frrf sampling Dr. Thato Mtshali (PI; CSIR), Natasha van Horsten (CSIR MSc student at SUN) 4.12.5.1 Objectives The objective was to characterise phytoplankton physiology along the transect with discrete samples using FRRF. The sampling strategy was to collect data from the underway sampling pump for Biology and from the CTD rosette multiple depths for each sampling station. Results from this analysis are intended to be interpreted on the basis of nutrient availability, light climate and taxonomic composition. Preliminary results to follow!!!!! 4.12.5.2 Sampling protocol Underway samples were collected in acid washed 50ml LDPE bottle following 3 rinses with sample water, while CTD rosette samples were collected in 50ml vials at 12 different depths along the water column. Samples were then incubated (in a dark box) immediately after sampling in order for phytoplankton to become dark adapted and then analysed on FRRF. 4.12.5.3 Samples collected At 25 underway stations that corresponded with biology sampling, 1 sample was taken from the seawater supplied from the underway pump, while 24 CTD rosette sample stations were collected at depths of interest (Table 4, Appendix B). Depths of interest were chosen after consultation of the fluorescence/chlorophyll trace data measured on normal CTD cast. Depths chosen were always less than 200m. 4.12.5.4 Sample analysis The same procedure applied for bioassay Fe, light incubation experiment FRRF sample analysis was followed for ST and FLC analysis. For underway sampling, acid washed 50ml LDPE bottle was used to collect seawater, while for CTD rosette 50ml vials were filled with 10ml seawater from the GoFlo bottles. 4.12.6 Trace Metal Fe in Seawater Raimund Rentell (MSc student at SUN), Bjorn von den Hyden (PhD student at SUN), Dr. Thato Mtshali (PI; CSIR) 4.12.6.1 Sampling protocol GEOTRACES sampling protocol for DFe, TDFe and SFe were followed (GEOTRACES note book, 2010). About 50 ml seawater samples were collected using acid washed 60ml LDPE bottles (PlastPro) from the trace metal GEOTRACES rosette equipped with clean 24 x 12L GoFlo bottles. Sampling was done inside a clean class-100 container under laminar flow hood equipped with HEPA filters. Unfiltered samples for TDFe were collected first followed by Dissolved and soluble Iron (DFe and SFe) samples. Gravity filtration was used instead of nitrogen gas or compressed air. These samples were collected in duplicates. 4.12.6.2 Sample collection About 98 samples were collected at 9 stations from 15 – 800m water depth. The plan was to collect samples down to 1000m, but due to the trigger failure of the AFM pressure sensor at 1000m and the rope angle, we decided to collect bottom samples at 800m. 4.12.6.3 Total dissolved Iron (TDFe) Total dissolvable Iron (TDFe) samples were collected at the following depths: 15m, 30m, 40m, 60m, 75m, 100m, 200m, 300m, 500m, 600m and 800m. Sample collection was conducted in a Clean Class 100 container lab from GoFlo bottles. Sample bottles where rinsed three times with unfiltered seawater (including the cap and lid) and then filled up to the 50ml mark. The bottles were placed in a laminar flow cabinet to be acidified with 0.024M HCl concentration to pH < 1.8. Samples where labelled and double bagged for 6 month storage. (total = 196). 4.12.6.4 Dissolved Iron (DFe) Dissolved Iron (DFe) samples were collected at the following depths: 15m, 30m, 40m, 60m, 75m, 100m, 200m, 300m, 500m, 600m and 800m. Sample collection was conducted in a Clean Class 100 container lab from Go-Flow bottles. Seawater was allowed to run through a 0.45µm filter (Sartobran P300 Capsule; Microsep) for approximately 2 min before sampling. This allowed for the filter to be flushed with the new seawater. Sampling was done from the shallowest depth to the deepest. Sample bottles where rinsed three times with filtered seawater (including the cap and lid) and then filled up to the 50ml mark. The bottles were placed in a laminar flow cabinet to be acidified with 0.024M HCl concentration to pH < 1.8. Samples were labelled and double bagged for transport and storage until analysis on land. (total = 196). 4.12.6.5 Flow Injection Analyses (FIA) The trace metal Iron (Fe) is one of the 6 key elements for phytoplankton growth in the ocean. It is an important factor in biogeochemical cycle of the world ocean (Martin and Gordon, 1988; De Baar et al. 1995; Bruland et al. 1995; Boyd et al. 2000) and therefore of major importance in marine ecosystem. In recent decades a major step forward was made in understanding the role of Fe in global marine biogeochemical cycle (De Baar and De Jong, 2001). However, there is still little data available on the trace metal Fe concentrations especially in the Atlantic sector of the Southern Ocean (Middag et al. 2009; Chever et al., 2010 ; Klunder et al., 2011; de Baar et al., 2001). Flow Injection Analysis with chemiluminescence detection (FIA-CL) for the determination of Iron (Fe) concentration in seawater has found a wide-spread application on board ships and in laboratories on land. Current oceanographic studies however, require the determination of Iron at sea in real time and this necessitate the use of portable, sensitive and robust technique for the unstable platform inherent to ship-board laboratories, for which Flow Injection (FI) techniques are ideally suited. The advantage of having FIA system on-board is that you can analyse samples immediately and determine whether the samples or sampling system is contaminated or not. 4.12.6.6 Analysis Procedure This flow injection analysis (FIA) system is based on a system described in Obata et al. (1993) but instead of making use of the 8-hydroxyquinoline (8-HQ) resin chelating column originally used a Toyopearl 650 M chelating resin was used. This system allows for the detection of Fe(III) in seawater in the picomolar concentration range. The system was calibrated by using a 500nM Fe(III) working standards in acidic seawater (pH 1.7). Five standard solutions 0.0, 0.2, 0.4, 0.6, 0.8 and 1.0 nM were prepared by dilution method. Standards and samples were treated with a 50µl of 0.1% hydrogen peroxide solution 1 hour prior to analysis. 245µl of 2M ammonium acetate buffer was added just prior to analysis to bring the final pH up to 4.5. This was done offline. The pH of the solution plays an important key role in this system. For example, the sample pH of 1.8 helps to remove Fe from Fe-binding ligands and to adhere onto the walls of the sampling bottle. The buffered sample to pH of 4.5 represent what runs through the pre-concentration column and allows Fe to bind on the Toyopearl resin. The overall pH of 9.3 – 9.5 represents what runs through the detector. This is the optimum chemiluminescence reaction pH between Fe(III) and luminol. The addition of NH4OH in line ensures we reach such pH in the reaction loop. Figure 3: Diagram of the setup for the FIA -CL Filtered seawater (0.2 μm; Sartobran) and acidified (pH 1.8, Analytical grade Seastar HCl) was first buffed with ammonium acetate buffer solution (2.0 M with pH between 4.0 – 5.0) manually. The buffering is used to make sure the pre-concentration pH of the sample onto the resin between 4.0 and 5.0. The sample is then concentrated on a column containing Toyopearl ion exchange resin. This resin binds only trace metals (especially Fe) and not the other interfering salts. After washing the column with MilliQ water to remove seawater matrix, the column is eluted in a reverse direction with diluted hydrochloric acid (0.23M HCl). After mixing with 0.0045M luminol (0.13g luminol, 70µl TETA and 0.53g K 2CO3), hydrogen peroxide (0.3M) and ammonia (0.5M), the oxidation of luminol with peroxide is catalysed by iron and a blue light is produced and detected with a photon counter (PMT). In the reaction mixture of luminol, Na2CO3 helps to dissolve the luminol into solution as well as precipitate to the chemiluminescence. TETA’s addition also improves the chemiluminescence due to H2O2 decomposition. The reaction with 0.3M H2O2 oxidizes Fe(II) to Fe(III) in the solution and is involved in chemiluminescence reaction between luminol and Fe. Addition of 0.5M NH4OH raises the chemiluminescence reaction pH to 9.3 – 9.5. This is the pH range where the chelated Fe onto Toyopearl resin shows a signal on the PMT (see Figure 3). The PMT tube counts the number of photons released as a voltage the peaks of the voltages can then be converted to a concentration through means of a calibration curve, where a known amount of iron is added to seawater containing hydrogen peroxide and hydrochloric acid (standard solutions). Using this calibration line a number of counts per nM Iron is obtained. Samples are analysed in quadruplets and average DFe concentration and standard deviation are given. During this cruise, no analysis of samples took place on-board due to contamination of the ship’s water supply (see contaminated filter from the MQ-system). Figure 3 shows the setup of the Flow injection analyser. The Water bath was set at 30°C and was not turned off for the entire cruise. The Photon tube multiplier (PMT) takes approx. 24h to stabilise, therefore it was not turned off once on the trip. One good calibration curve was obtained before the MQ system got contaminated (Figure 4). Although it was a good calibration curve it did not agree with the international reference material (SAFe). The surface reference was out by 0.498nM and the D2 reference was out by 0.932nM. Blank corrected peak height Calibration Curve 6000000 5000000 4000000 3000000 2000000 1000000 0 y = 4E+06x + 941119 R² = 0.9856 0 0.5 1 1.5 Fe conc (nM) 1400000 1200000 1000000 800000 600000 400000 200000 0 ave PH counts Blank y = 9472.9x + 36386 R² = 0.9905 0 50 100 Conc time 150 Figure 4: Shows the calibration curve and the blank curve which were obtained on the cruise 4.12.7 Particulate and Soluble Fe Sampling Bjorn von den Hyden (PhD at SUN) 4.12.7.1 Objective Particulate trace metals may occur in several forms, including stable refractory phases or as coatings on surfaces that can be rapidly recycled. Particulate behaviour is metal specific with, for instance, the majority of particulate Fe occurring in refractory phases while Zn is primarily associated with more labile phases (Hurst & Bruland, 2005). Few studies have concurrently measured trace elements in both the dissolved and particulate phases. Furthermore, labile particulate trace metals which are biologically available could be considerably higher than dissolved phase (Berger et al., 2008). Assessment of total biologically available trace elements may thus require the determination of both dissolved and labile particulate metal phases (Lam & Bishop, 2008). A first step towards a quantitative description of the cycling of trace elements between the dissolved and particulate phases required for their realistic incorporation into biogeochemical ocean models is to measure the standing stock of the particulate fraction. To address this, particulate material will be filtered on all water samples collected using the trace metal rosette at 4 stations along the transect. Prior work by our group has shown that significant differences exist in the particle speciation for colloids sampled on the Good Hope Line between Cape Town and the Antarctic coast near to SANAE (von der Heyden et al, 2012). The current hypothesis is that mineralogy and chemical speciation of Fe particulates from the different frontal zones vary as a function of source region and biogeochemical processing. Four long-term 'process' stations were sampled, one in each fontal zone between Cape Town and the most southerly point on the cruise track (~55°S) and their positions are shown on the cruise track. The first station was taken in the Antarctic Zone (south of the Polar Front, 47°23.1’S; 02°02.1’E), the second in the Polar Frontal Zone (between Subantarctic and Polar Fronts, 46°57.5’S; 04°31.2’E), the third station in the Subtropical Zone (between Subtropical and Subantarctic Fronts, 43°26.5’S; 07°10.2’E) and a final station north of the Subtropical Front in what can nominally be described as Subtropical Gyre waters (37°46.3’S; 11°39.0’E). At these four process stations, the complete size-fractionated Fe spectrum was collected (SFe, DFe, TDFe, PFe) from the GEOTRACES GoFlo rosette from depths ranging between the surface and 800m. 4.12.7.2 Sampling protocol Unfiltered seawater samples were collected in acid washed 10ml LDPE bottle following 3 rinses with sample water from the GoFlo bottles. GoFlo bottles were homogenized first before collecting samples to unsettle the particulate matter. 4.12.8 Samples collected 4.12.8.1 Soluble Iron (SFe) Bjorn von den Hyden (SUN) Soluble Fe samples were collected from five stations so that data could be available for all the sites where PFe was collected as well as for both sites where water was collected for the Bioassay experiments (Table 5, Appendix B). Sampling focussed on the upper water column, where biological influences are most pronounced, and at depths that corresponded to PFe sampling (30m, 100m, 500m and 800m). Filtered dissolved Fe samples through a 0.4µm filter were collected in acid cleaned 60ml LDPE bottles, which were completely filled. These samples were further filtered through a 0.02µm filter (Whatmann Anatop filter, Z74777750EA; Microsep) for SFe to another acid washed 50ml LDPE bottle and left un-acidified. This was done under laminar flow hood inside a clean FIA container. The set up is shown in Figure 5. Teflon tubing (1/16inch inside diameter) was inserted into the labelled 0.2µm filtered samples and connected to the 12-head peristaltic pump. The pump was set to 3.5 revolutions per minute as faster speeds would enhance the chance of leakage and tubing connection breaks. The 1/16inch tubing was connected into grey grey tygon tubing over the pump head and the out pipe was again 1/16inch. The inline filter set up is shown in Figure 2 inset. In order to connect to the inline filters, the 1/16inch tubing was attached to a short length of grey grey tubing which was attached to green green tubing. This was then connected to a 0.2µm inline filter (name, make) and the connection was sealed by using chloroform (CH3Cl) to bind the tubing to the filter. Figure 5: Filtration system for SFe samples through a 0.02 µm. This filter connected directly to a 0.02µm Whatman Anatop inline filter and the use of the 0.2µm filter was necessary because chloroform did not work for binding the tubing directly to the 0.02µm filter. The filtration set up was limited to six inline filters running simultaneously as we only had six 0.2µm filters onboard. Future set ups should have the correct tubing and filters such that the additional 0.2µm filter is not needed (these six filters were recycled between successive runs, and thus present a possible source for sample contamination). Prior to each run, the system was flushed with 9 minutes of MilliQ Advantage water (it took seven minutes for water to flow completely through the tubing, plus an additional two minutes of extra flushing). Thereafter, the 0.02µm filter was connected and the inflow pipes were placed in 1M Suprapur HCl acid and this was allowed to run through the system for 12 minutes (5min additional flushing). The system was then again flushed for 7 minutes with MilliQ and then each inflow tube was placed into a 60ml sample bottle. The sample was allowed to pass through the tubing as an additional flush and after 7 minutes, 1~2ml of 0.02µm sample was collected in an acid cleaned 60ml PTFE bottle. This was used as a rinsing step and the procedure was completed twice. Once rinsed, the filtration procedure continued for three and a half hours until ~50ml of sample had been collected. This was acidified to pH 1.7 with Ultrapur HCl (0.024M final concentration). Between consecutive filtration runs for different samples, the 0.02µm filters were replaced, but the 0.2µm filters were reused after being subjected to the washing procedure. Each line was designated a depth value so that each successive filtration run was done on the same line and, for example, high Fe concentration 800m depth samples from one site did not contaminate the low Fe concentration surface values. 4.12.8.2 Particulate Iron (PFe) Bjorn von den Hyden (PhD at SUN), Raimund Rentell (MSc at SUN) Samples were taken from four stations (CTDG 1, 2, 4, 9) at four different depths (Table 6: APPENDIX B). It was planned that fourty liters of sample would be collected from each of these depths to provide four filter papers per depth for subsequent analysis (POC, PON, Fe extraction, Fe synchrotron analysis). The depths chosen were surface (30m to avoid contamination from ship), 100m, 500m and 1000m to give a full water column profile. Unfortunately bottles did not trigger at 1000m and the depth sample collected was changed to 800m. Fourty six 10L LDPE bottles were prepared before the cruise for sample collection (1 week soak in phosphate free detergent, 3 times rinse with tap water, 2 times rinse with MilliQ water, 1 week soak in 6.0M reagent grade HCl, 5 times rinse with MilliQ water). The initial plan was to sample directly from GoFlo bottles into these 10L containers and then directly afterwards to start the filtration procedure in the clean sampling van. However, an issue arose with respect to the state of the metal parts of the filtration rig and pump and it was decided that the set up should not be used in the clean van whilst DFe and TDFe sampling was still ongoing. Thus, a number of options were considered: i) Freezing and Storage The samples collected from the first two stations (CTDG 1, 2) were not dealt with directly after they were collected, as the issue with the filtration rig was being sorted out. To minimize the amount of time that these samples stood without being processed, they were frozen directly at -20C and will be processed back on land. ii) Inline Filtration Inline filtration was done by pressurizing seawater using Nitrogen gas (5.5 individually analysed; Air products). Nitrogen inflow pipes were connected to GoFlo bottles using acid washed Teflon tubing with a 0.1µm inline gas filter (Anatech). Teflon tubing was also used to connect a 47mm filter holder to the sampling valve on the GoFlo bottle. Acid-rinsed (two hours in 0.2M Suprapur HCl, followed by rinse in MilliQ) 0.2µm pore size filters were placed in the filter holders and the nitrogen line turned on for the commencement of filtration. Filtered seawater sample volumes are reported in Table 7 and all excess sea water from the pertinent depths was kept frozen. iii) Vacuum Filtration Rig The vacuum filtration rig was employed for the last station as there was to be no subsequent sampling for dFe and TFe. Rusted metal parts had been removed from the vacuum pump and all additional metal parts on the pump and filtration rig were painted with black metal-free metal paint. The pump was connected to the filtration rig with a 0.1µm inline filter to prevent any moisture entering into the vacuum pump. An additional 0.1µm inline filter was placed on the outflow air vent on the vacuum pump to ensure that air leaving the pump set-up and entering the clean van atmosphere was as clean as possible. The filtration rig was placed inside of the laminar flow hood so that it could be isolated from the only remaining point of possible contamination, the open back of the vacuum pump. Before filtration, the sample GoFlo bottle was shaken three times to ensure that any settled particulates were re-suspended. These were then sampled into the clean 10L sampling bottles to make handling of the sample into the 250ml filtration units more easy. An acid cleaned and rinsed 0.2µm filter paper was placed into each filtration holder. Once the filters had become blocked (up to 16L for depth samples), filters were removed and placed in acid cleaned and rinsed filter holders. Some of these filters were rinsed with 2ml of MilliQ water to remove salt to make synchrotron analysis more easy. The labelled filter containers were frozen for subsequent analysis. 4.12.9 Problems and Recommendations CTD rosette materials - CTD Rosette could not trigger the bottom sampling bottle at 1000m – need to have a look at the AFM. - A Shackle must be replaced with a swivel to prevent the rope from tangling. - Need to buy a thick rubber mat for CTD rosette storage. - Open Air bleed valves - need to buy closed screw for GoFlo Air bleed valves to prevent contamination. - Buy spare parts for GoFlo bottles (i.e sampling and Air bleed valves, lanyards and Orings) Hetch for GoFlo bottles transportation - Build a more strong and removable cover for the hetch to minimize contamination. GoFlo bottle handling - More nitrile gloves – powder and soapy free. - Re-usable sleeve covers. - Wedding dress suit covers to cover GoFlo bottles during transportation to and from the container to minimize contamination. - Shower caps to cover GoFlo bottles ballcaps and - Small ziplock plastic bags to cover the GoFlo sampling valves (this must be changed every-time after sampling) - Disposable aprons to minimize contamination during connection of the GoFlo bottles lanyards to the rosette hooks. Containers and sampling - FIA not working to analyse samples – this system play a very important role in this project and need to buy a working system. - MQ- system got contaminated from the ship’s supply water – need to take 25Ls of MQ-H2O before the cruise. - Nitrogen gas connection was leaking – this needs to be tested before the cruise. - Container doors (outside and inside) need to be fixed. - Door to FIA container would not close - Leaky window in sampling van. - Possible points for Fe contamination include; soapy nitrile gloves, badly designed 60ml sampling LDPE bottles (inner lid maximises contact and increases risk of contamination). - Need a plastic spanner to loosen and change between nitrogen line connector and closed lid. - Need inline filters for PFe samples. - Plastic grid/holders inside laminar flow hood to hold the SFe sample bottles stable. - More disposable lab coats, at least 1 per week of the cruise per person - Spare pipettes are required.and pipette rag. - Each experimental section should have its own pipette. - All types of MQ filters/cartridges should be on board as spares. Modify the containers - Bench in change room which splits the dirty shoe side from the clean one and prevents dirt to pass over. - A small grid step on the outside which allows to scrape off the shoes before entering the lab. This can be a fold away step. - An addition divider next to the basin to prevent water from running all over the bench. - Diagonal hooks should be added as well. - A coat hanger in the change room. - If possible and extraction cabinet for reagents preparation. (The whole lab is full of ammonium chlorite salt, and all metals started to oxidise). - Fe concentration in ship water supply too high for MQ system APPENDIX A: Deployment and Retrieval of CTD rosette During the transportation of GoFlo bottles to and from the clean containers, 10 people were used. - From the container, 2 people inside the clean lab to remove GoFlo bottles from its rags, 1 person in the change room, 1 person to open and close the outside door, 2 people to pass the bottles through the hetch, 2 people to collect from the bottom of the hetch, 2 people to transport the bottles to the rosette, 2 people connecting bottles on the rosette. Same sequence was applied after retrieval of the rosette. Rosette preparation: - Immediately before deployment, the rosette frame is washed with fresh tap water to remove any particulate matter from the ship’s stack or deck that may have adhered to it before station. - The GoFlo bottles ballcaps are cocked and kept close before they are removed from the van/container where they are stored between deployment. The bottles are store with a plastic cap over the top ball-cap and small zip-lock plastic bags covering the sampling spigot/valve. - The bottles are placed on the rosette frame (frame covered under a plastic sprout), and the trigger lanyard is secured and kept under tension while keeping the top and lower ballcaps closed. - When it is time to deploy the rosette, the plastic cover on the rosette is removed and the lower and top ballcaps are half opened by switching the rubber tubing to the opposite sides of the ball. The small zip-lock bags are removed from the sampling spigot. - Immediately before the rosette is to be deployed, the Automated Fire Mode (AFM) pressure sensor is programmed on a computer to trigger bottles at different depths following the protocols outlined in the user-manual. Rosette deployment: - Once in the water, the rosette is lowered to -10m to wait for the GoFlo bottles pressure sensor to trigger open the bottles. - Once the GoFlo bottles are open, the package is then lowered at 20 – 25m min-1 through the upper 100m and then 40 – 50m min-1 to 110m below the depth of the deepest sample planned for that station. - The package is then raised at slow speed of 5 – 10m min-1 and the first bottle is fired as the package passes the desired depth horizon. After that the winch speed is increased to 40 – 50m min-1 until the next sampling depths that are far apart. Again, at 5 – 10m below the more closely sampling depths, the winch is slowed to 5 – 10m min-1 and the bottle fired as the package is going through the correct depth horizon. - Continue to with this procedure until the last surface sampling depth. NB: By keeping the package moving upwards through the water column during sampling, the tops of the bottles are always moving into clean water that has had no contact with the rosette frame. This completely avoids the possibility that the materials from any of the uncoated parts of the rosette frame can contaminate the sampled water. NB: In rough seas, it is difficult to recover the rosette. Control the rosette frame by using 4m poles with Nylon hook to prevent abrasion of the powder coated frame. Rosette retrieval: - After recovery of the rosette, it is landed onto a wooden palette covered with a rubber matt (also to prevent abrasion of the powder coated frame). - As soon as the package is on deck and secured, the plastic strouts is immediately placed onto the rosette and the small ziplock bags are placed over the sampling spigot/valve. - Bottles ballcaps are then covered with plastic shower caps and removed individually from the rosette frame and carried into the clean van, through the hetch, where they are secured to a purpose-built rack. - When all the bottles have been brought into the clean van, the entrance door is closed and the air is allowed to re-circulate through the HEPA filters for 10 – 15 min before sampling. Before sampling from the GoFlo bottles: - After racking the bottles and removing the plastic covers from the sampling spigot, the GoFlo bottles are rinsed thoroughly with 18.2 MOhm water. - Before sampling, the bottles are tested for contamination called ‘leak test’. During sampling from the GoFlo bottles: - If any N2 gas of compressed air is to be used, the bottles must be drained slightly to lower the sample level below the top air-vent. Bottles are then connected to clean Teflon Tubing and pressurized with gas or compressed air (≤10 psi). NB: Three people for this job: one opens the sampling bottles from the zip-lock bags and noting down the bottle number on the sheet, the other two are collecting samples. - Start with unfiltered samples (e.g., nutrient and DFe) as these do not require any tubing connection to the bottles sampling spigot. - Collecting filtered samples, connect the Teflon Tubing to the sampling spigot/valve and set-up the filter as required (make sure that there is no air bubbles trapped inside the Sartobran filter by adjusting it accordingly). Rinse the filter housing three times with seawater and then rinse the sampling bottles (LDPE) and its cap three times and collect the sample. - After collecting all the samples, filtered samples are acidified using supra pure HCl (2ml/L) to pH <2, and stored at room temperature (double bagged). APPENDIX B: Table 1: Seawater collection depth and station numbers. Station Name Latitude longitude Water depth (m) CTDG 1 4923.1'°S 0202.1'°E 15 – 800 CTDG 2 4657.5'°S 0431.2'°E 15 – 800 CTDG 3 4240.2'°S 0842.7'°E 15 – 800 CTDG 4 4326.5'°S 0710.2'°E 15 – 800 CTDG 5 4241.9'S 0913.6'E 15 – 800 CTDG 6 4332.2'°S 0710.2'°E 15 – 800 CTDG 7 4238.09'°S 0925.7'°E 15 – 800 CTDG 8 4235.8'°S 0934.1'°E 15 – 800 CTDG 9 3746.3'°S 1139.0'°E 15 – 800 CTDG 3 – BioEx 1 42°44.474’ °S 8°48.664’ °E 30 - 20 CTDG 4 – BioEx 2 43°25.309’ °S 7°12.280’ °E 45 – 35 Table 2: Bioassay sampling information Parameters Exp. 1 Exp. 2 Date 01/03/2013 02/03/2013 Latitude (°) 42°44.474°S 43°25.309°S Longitude (°) 8°48.664°E 7°12.280°E Depth (m) 30 - 20 45 - 35 GoFlo bottles used 5 - 16 5 - 16 Start point (GMT) 02:00 05:00 End point (GMT) 02:37 05:30 Seawater Temperature (°C) 11.33 10.182 Salinity (PSU) 34.253 34.046 Deep PAR (µmol photon m-2 s-1) 35.0 41.84 Surface PAR (µmol photon m-2 s-1) 388.53 488.11 Table 3: Parameters and volumes collected, the techniques to measure and personnel. Parameters (V/ ml) Technique Where to be analysed Person Nutrients (30) FIA Done on board Craig Chl-a (400) Fluorometer Southampton Emma POC and PON (700) CHN analyser UniBrest in France Eva Pigments (600) HPLC Southampton Emma BSi (300) ??? UniBrest in France Eva TDFe (50) FIA-CL CSIR/SUN Thato and Raimund PSII parameters (10) FRRF CSIR/SUN Thato and Natasha Cell size (200) Scintillation counter UCT Sandy Table 4. GEOTRACES CTD sampling station and depth. Station number Bottle number Depth FLC and ST CTD Geo 01 24 15 x CTD Geo 01 30 x CTD Geo 01 40 x CTD Geo 01 60 x CTD Geo 01 75 x CTD Geo 01 100 x CTD Geo 02 15 x CTD Geo 02 30 x CTD Geo 02 40 x CTD Geo 02 60 x CTD Geo 02 75 x CTD Geo 02 100 x Table 5: CTD station number and depth where SFe samples were collected Depth CTDG 01 CTDG 02 CTDG 04 CTDG 05 CTDG 09 15 X X X X X 30 X X X X X 40 X X X X X 60 X X X X X X X X X X 75 100 X X 200 X X 500 X X X X X X X X X 800 Table 6: PFe samples collected during the cruise Depth 30 CTDG 01 CTDG 02 CTDG 04 CTDG 09 Frozen Frozen Filtered Frozen Filtered 40L 40L 30mA, 20L Filters 30mB 100 40L 40L 100mA, Frozen 9, 20L 10, 11 20L Filters 4, 8 10L 100mB 500 40L 40L 500mA 20L Filters 2, 3 10L 800 - 40L 800mA 20L Filter 1 20L Table 7: Station CTDG 4 Processed (inline filtration) Filter number Depth From Bottles Volume filtered 30mA 30 19 4.4L 30mB 30 23 3.4L 100mA 100 12, 13 10.6L 100mB 100 15 10.6L 500mA 500 7, 8 14.4L 800mA 800 3, 4 14.3L Table 8: Station CTDG 9 Processed (vacuum pump) Filter number Depth From Bottles Volume filtered DI rinse? 1 800 1, 2 15.25L No 2 500 6, 7, 8 13.2L No 3 500 6, 7, 8 13.25L Yes 4 100 12, 13 8.83L No 5 15 24 3.95L No 6 15 24 4.25L Yes 7 15 24 2.25 Yes 8 100 12, 13 9.08L No 9 30 23, 21 2.75L No 10 30 23, 21 3.0L No 11 30 23, 21 3.0L Yes 4.13 Scientific engineering support Written by Derek Needham Key participants: Derek Needham, Sinekhaya Bilana, Ashley Botha, Jean-Pierre Smit Scientific engineering support was undertaken by Derek Needham and three new student technicians, Sinekhaya Bilana, Ashley Botha and Jean-Pierre Smit, from the CSIR Southern Oceans Engineering R&D Centre (SOERDC). The students were trained while performing “in-service” tasks, that count towards their formal Cape Peninsula University Of Technology engineering qualifications, as well as their experience as sea-going Marine Electronic Technicians. 4.13.1 Sea-Bird SBE 911p 24 x 12Litre CTD System The Sea-Bird SBE 911plus V2 CTD system was serviced in Cape Town and installed and tested before sailing. A Biospherical SPAR sensor was installed on the Monkey Island mast and a new cable run down to the Hydro Lab. A GPS feed was picked up from the pCO2 system’s GPS. A new cable was run from the GPS, down to the Semi-Wet Lab and connected to the Hydro Lab and CTD Deck Unit via the old thermosalinograph cabling. 17 successful CTD casts were completed during the cruise to a maximum depth of 2000m, with no problems being noted or reported. All sample bottles worked well with no leaking bottles. The system configuration was: Sea-Bird SBE 11plus V2 Deck Unit and computer Sea-Bird SBE 9plus V2 Underwater Unit in horizontal cage Sea-Bird SBE 3p Temperature Sensor S/N: 5372 Sea-Bird SBE 4c Conductivity Sensor S/N: 3836 Digiquartz Pressure Sensor with TC 119633 (1026) Sea-Bird SBE 43 Dissolved Oxygen Sensor S/N: 1996 Sea-Bird SBE 5T Pump S/N: 5829 Wetlabs Scattering BBRTD-803B WetLabs Scattering FLNTURTD-2116 WetLabs Transmissometer Red CST-1365DR WetLabs Transmissometer Blue CST-1397DB WetLabs Fluorometer FLNTURTD-2116 Biospherical Instruments PAR Sensor S/N: 70291 Teledyne Benthos Altimeter Biospherical Instruments masthead SPAR Sensor S/N: 20385 Sea-Bird SBE 32 24 x 12L Sample Bottle Carousel Frame Ocean Test Equipment 12L Sample Bottles (x23) Problems (and Action Needed) a) The new Deck Unit was used for the first time and it was only discovered during final data processing that the Deck Unit was factory defaulted to average 24 data scans. The final data set should not be Bin Averaged. b) The CTD system, its auxiliary sensors and surface PAR sensor, need to be sent in for calibration. There is an eight week turnaround time for this service. (SOERDC) c) Additional spare underwater cables need to be ordered (4 x 2-pin MCIL-2-FS). (SOERDC) 4.13.3 Hydro winch, boom and winch monitoring instrumentation After initial hydraulic problems with the boom were rectified in Cape Town, the system worked well. A new sea-cable deadend termination and underwater connection were fitted before sailing and the winch “pull-tested” up to a load of 1.9 tonnes. The Wet-Hydro Lab remote boom controller unit was found to be water damaged and was removed. Boom control during CTD casts was done via the main control panel in the Hydro Winch Room. The winch, sheaves, sea-cable and sliprings seem to be in good condition and no communication problems, between the CTD Underwater Unit and Deck Unit, were encountered. The sea-cable was rinsed with fresh water during retrievals. The winch’s automatic dynamic speed and load control system seems to be working well, and the spooling and laying of the sea-cable on the winch drum is even. The Hydro Winch-Monitoring Instrumentation was found to be intermittent, so was opened and serviced. It now seems to be working reliably. The wire out, wire speed and wire load readings seem to be accurate, but it is suggested that CSIR purchases a 5 tonne pull-scale to load test all winch sea-cables and deadends, and calibrate the wire load sensors, prior to deployments, especially if CSIR is going to be fitting deadends to the cables. Problems (and Action Needed) a) The Wet Hydro Lab boom control switch unit needs to be replaced with new. (Ship) b) The window wiper on the Hyrdo Winch Room window, overlooking the CTD operation is intermittent. A new motor has been fitted, but it looks like the link to the wiper is slipping. (Ship) c) A 5 tonne pull-scale needs to be purchased, for load testing deadends and calibrating sea-cable load cells, prior to deployments. (SOERDC) 4.13.4 Sea-Bird geotraces CTD system and auto fire module The Sea-Bird SBE 911plus V2 CTD system was removed from the GEOTRACES frame and replaced with a Sea-Bird Auto Fire Module (AFM) and a Sea-Bird SBE 50 Depth Sensor. These two instruments were integrated together into a custom built, all plastic, 1000m depth rated pressure casing, as the original AFM was only rated to 600m. The AFM was needed to control the Sea-Bird SBE 32 carousel trigger unit, to fire the 24 x 12 litre GOFLO sample bottles at predetermined depths, as the S.A. Agulhas Stern Towing Winch could only be fitted with a non-metallic Dyneema rope, without conductor cores, and real-time communications with a CTD system were not possible. The AFM worked well, after some initial operational learning issues and one occasion when the deck set-up communication cable broke. The stern CTD deployments worked well, although the GEOTRACES frame needs more weight to enable it to sink faster and avoid being jerked while on the surface. Four of the sample bottles had to be left open on deployment to give the frame less buoyancy. The jerking of the frame, while floating on the surface, bent the frame hanger bar, which in turn bent one of the trigger levers. The trigger lever was straightened, but this problem needs to be addressed as the trigger levers are delicate and expensive. Problems (and Action Needed) a) More weights need to be added to the frame. It is suggested that a less expensive option of enclosing lead in oil filled PVC pipes be explored. (SOERDC) b) Four of the latch mechanisms on the Sea-Bird SBE 32 carousel trigger unit broke when the frame was accidently pulled into the sheave. New latches need to be ordered. (SOERDC) c) The titanium frame hanger bar was bent due to the frame being jerked sideways while floating on the surface. The hanger needs to be removed and straightened on a press. (SOERDC) d) One of the plastic feet on the frame has been damaged and a new one needs to be manufactured. (SOERDC) e) The frame needs to be stripped and scratches touched up with the Sea-Bird supplied powdered (applied with heat) epoxy kit. (SOERDC) 4.13.5 Stern towing winch, winch-monitor instrumentation and A-frame After initial problems with the Dyneema rope not being spooled onto the winch drum under tension, the starboard side Stern Towing Winch system worked well. The new Winch Monitoring Instrumentation’s wire-out reading seems to correlate with the bottle firing depth as recorded by the Auto Fire Module on the GEOTRACES CTD. The shackle to attach the Dyneema rope to the GEOTRACES CTD was painted with epoxy paint to cover the galvanising. The Moog speed control for the winch was replaced with the one from the port side winch. Problems (and Action Needed) a) More weights need to be added to the GEOTRACES frame to allow faster sinking of the system on the surface. It is suggested that a less expensive option of enclosing lead in oil filled PVC pipes be explored. (SOERDC) b) A non-metallic alternative to a painted shackle needs to be explored to attach GEOTRACES to the Dyneema cable. (SOERDC) c) Spare Moog winch controllers need to be purchased. (Ship) 4.13.6 Inter-lab communication systems The ship’s inter laboratory and lab-to-winch communication system was not used as walkietalkies were found to be more efficient. 4.13.7 Seaglider 542 On the 24 February 2013, Andre Hoek at SOERDC, piloted Seaglider 542 to change from 1000m dives to 50m dives and then switch to “recovery” mode (remain on surface, sending GPS fix every 5 minutes) when the ship was close enough for visual contact. On sighting of 542, a rubber inflatable boat (RIB) was launched from the port side and 542 was lifted aboard the RIB and winched aboard S.A. Agulhas, using the starboard crane. All seemed fine with 542 and there was no damage or knocks during recovery. There was a fair amount of young barnacle growth, which was photographed in position, before being cleaned off the glider. 542 was switched from recovery mode to hibernation mode, inspected, and the sensors cleaned. On 27 February 2013, 542 was redeployed over the stern of S.A. Agulhas, using the Stern Towing Winch, Dyneema rope, A-Frame and slip knot system. The deployment went smoothly on the second attempt and no damage or knocks were noted during the deployment. S.A. Agulhas maintained a visual contact with 542 until an initial shallow test dive. After the test dive, 542 was piloted to revert to doing 1000m dives, as all systems seemed fine. On 6 March 542 was retrieved. The weather was not in favour of launching a boat, so retrieval was attempted using the Method net on the aft telescopic crane. S.A. Agulhas was brought alongside 542, but when 542 reached the starboard aft quarter, the stern thruster washed 542 away and downwards, and visual contact was lost and the scheduled 5 minute phone-ins ceased. 542 was later spotted on the surface with one wing and the antenna (with ARGOS tag) broken off. The rescue RIB was launched and 542 recovered. 542 was switched off and cleaned and the wings and rudder were removed for transporting. All communications with the shore pilot were done using the S.A. Agulhas email and Iridium telephone system. Problems (and Action Needed) a) The lost wing and antenna of 542 can be replaced with the spare units when 542 is refurbished and serviced. (SOERDC) b) More wings and antennas should be purchased as spares. (SOERDC) c) The ARGOS tag on the missing antenna needs to be replaced. (SOERDC) a) As a bad weather recovery tool, the Method net, if rigged from the top of the frame, and weighted at the bottom of the frame, flies well from a crane next to the ship. The forward travelling crane works better than the aft crane as it has more reach, is away from the prop and stern thruster wash, and can be seen better by the bridge. An improved version of the Method concept should be designed and manufactured that is wider, floats on the surface and has a greater opening above the water, to allow a glider’s or float’s antenna to enter. (SOERDC) 4.13.8 Seaglider 543 On 7 March 2013, Andre Hoek at SOERDC, piloted Seaglider 543 to change from 1000m dives to 50m dives and then switch to “recovery” mode (remain on surface, sending GPS fix every 5 minutes) when the ship was close enough for a visual contact. The weather was favourable to use a rubber inflatable boat, launched from the starboard crane and 543 was retrieved safely aboard S.A. Agulhas. All seemed fine with 543 and there was no damage or knocks during recovery. There was a substantial amount of barnacle growth, especially around the PAR sensor, which was photographed in position before being cleaned off the glider. There is also what appears to be predator-teeth bite marks on 543’s fibreglass hull, which were also photographed. 543 was switched off and wings, rudder and antenna removed for transporting. All communications with the shore pilot were done using the S.A. Agulhas email and Iridium telephone system. Problems (and Action Needed) a) 543 will be refurbished and serviced. (SOERDC) b) As a bad weather recovery tool, the Method net, if rigged from the top of the frame, and weighted at the bottom of the frame, flies well from a crane next to the ship. The forward travelling crane works better than the aft crane as it has more reach, is away from the prop and stern thruster wash, and can be seen better by the bridge. An improved version of the Method concept should be designed and manufactured that is wider, floats on the surface and has a greater opening above the water, to allow a glider’s or float’s antenna to enter. (SOERDC) 4.13.9 PCO2 System Problems (and Action Needed) a) The GPS antenna system was water damaged and replaced with the spare unit. A replacement spare should be purchased. 4.13.10 UCTD System The UCTD system was installed after the ship’s mooring lines were cleared from the transom area. The same rewinder that was used during the January trip was re-installed, but the spare winch was used instead of the winch used in January, so that both winches have now been tested, after they were serviced by Oceanscience during December. The rewinder developed a leak under the membrane keypad and stopped working. It was replaced with the spare unit. The faulty unit was opened to check the extent of the leak, but it was found that only the keypad had leaked. It was dried out, and is now working. The end splice on the Spectra line was remade on four occasions due to it showing signs of fraying. The UCTD casts were done by a group of three, so cross checking was done on every deployment. Even though this system was in place and extreme caution was used, a probe was lost due to the locking mechanism failing between the probe and the tail. All in all 73 successful casts were done. Problems (and Action Needed) a) A new membrane keypad needs to be ordered and fitted to one of the rewinders. (SOERDC) b) One of the probes won’t charge. It can be opened and checked at SOERDC. (SOERDC) c) The probe battery charger is blown. Locally sourced spares to be explored. (SOERDC) 4.13.11 General technical support General assistance was provided to assist setting up computer systems, connecting power, UPS problems, GOFLO bottle issues and fault-finding and repairing minor electromecganical problems.