1
WORK-ZONE SAFETY ITS
Technical Analysis
and System Proposal
Michael Hagan
Christopher Winkler
June 2004
The University of Michigan
Transportation Research Institute
UMTRl
-~
WORK ZONE SAFETY ITS
TECHNICAL ANALYSIS
AND SYTEM PROPOSAL
Michael Hagan
Christopher Winkler
The University of Michigan
Transportation Research Institute
Ann Arbor, Michigan 48109-2150
U.S.A.
Report No. UMTRI-2004-xx
for
Federal Highway Administration
Contract DTH6 1-01-C-00049
June 2004
1. Report No.
1
Technical Report Documentation Page
2. Government Accession No.
1
3. Recipient's Catalog No.
1 8. Performing Organization Report No.
I
7. Author(s)
Hagan, M and Winkler, C.
10. Work Unit no. (TRAiS)
9. Performing Organization Name and Address
The University of Michigan
Transportation Research Institute
2901 Baxter Road
Ann Arbor, MI 48109-2150 U.S.A
11. Contracts or Grant NO.
12. Sponsoring Agency Name and Address
13. Type of Report and Period Covered
Federal Highway Administration
U.S. Department of Transportation
400 7th Street S.W.
Washington, D.C. 20590
Interim report
14. Sponsoring Agency Code
FHWA
I
15. Supplementary Notes
16. Abstract
This interim report presents the broad concept for an adaptive traffic signaling system for
work zones based on a distributed system of traffic speed sensors and traffic signaling devices.
Both the sensors and the signals are seen primarily as rather simple, inexpensive, short-range
devices deployed in substantial numbers at the work zone in the form of "smart barrels." Such
barrels would nominally have the appearance of today's common, work-zone traffic-control
barrels. Each barrel would communicate with "supervisory" computers that would process the
distributed speed measurements and dispense commands for appropriately adjusted and
distributed signaling based on existing speed differentials. The system is intended to be readily
deployable, requiring little more effort than currently needed to set up today's systems of traffic
control devices at work zones.
The document discusses what is seen as probably the most challenging technical problem of
such a system, a sufficiently inexpensive, but technically capable traffic speed sensor. In
successive sections, the document reviews detector requirements, existing detection
technologies, technologies selected for evaluation, and a plan for prototype testing and
evaluation. A bibliography of technical and commercial references on sensor technologies is
included. Concepts for the signaling devices are discussed in the companion interim report by
John Sullivan, Work Zone Safety ITS: Human Factors Analysis And Pilot Research Proposal,
UMTRI, May 2004.
17. Key Words
18. Distribution Statement
work zone, collision avoidance, ITS, rear-end
collision, speed sensor, sensor technology
Unlimited
19. Security Classification (of this report)
20. Security Classification (of this page)
None
None
21. No. of Pages
22
22. Price
TABLE OF CONTENTS
1. Introduction ...........................................................................................................1
.
..............................2
2. Concept of the Work-zone Safety ITS System ....................
2.1 System configuration .......................................................................................2
Smart Barrel ......................................................................................................2
Barrel Supervisor ............................................................................................
4
Site Supervisor .................................................................................................4
2.2 Setup and Calibration ..................................................................................5
................................................................................6
2.3 Operation.............
.
.
Determining signal intensity based on distributed speed measurements.............- 6
Data-collection and processing ..........................................................................6
3. Review of Detection Technologies/ Products ...................................................... 11
3.1 Active Infrared .............................................................................................11
3.2 Passive Infrared ............................................................................................11
.
.
...
.
.
..................................................... 12
3.3 Passive Acoustic .....................
3.4 Ultrasonic .................................................................................................... 12
...............................................................................12
3.5 Magnetic.............
.
.
3.6 Microwave...........
.
.
............................................................................... 13
13
3.7 Video ............................................................................................................
4 . Selected Technologies for Evaluation .................................................................14
4.1 Dual Passive Infrared ....................................................................................14
4.2 Dual 3-axis Magnetometer ............................................................................ 14
4.3 Dual Active Infrared .....................................................................................
15
....................................... 15
4.4 Pulsed Doppler Ultrasound ...................... .
.
.
.
..............................................................................
4.5 Dual Ultrasonic Presence
16
5. Sensor Evaluation and testing ............................................................................. 17
. .
6. Bibliography........................................................................................................18
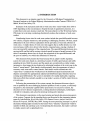
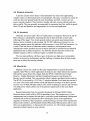
1. INTRODUCTION
This document is an interim report by the University of Michigan Transportation
Research Institute to the Federal Highway Administration under Contract DTH61-Ol-C00049, Work Zone Safety ITS.
Estimates of the increased crash risk in work zones have varied widely from 26% to
168% depending on the circumstances. Despite the lack of quantitative precision, it is
evident that work zones increase crash risk. The main objective of the Work Zone Safety
ITS project is to develop a technology that directly reduces the incidence of work zone
crashes.
Contributing factors cited in work zone crashes include the speed differential between
two vehicles, irregular maneuvers, and speeding in challenging locations. Of these, speed
differential is the most obvious explanation for the prevalence of rear-end collisions in
work zones. A simple theory of work zone risk suggests that as traffic density in a work
zone increases, traffic slows down in the heavily congested areas, causing a backup of
slow-moving traffic upstream of the congested area. The speed differential between slowmoving traffic and the traffic moving at posted speeds becomes a hazard because of the
driver's uncertainty about where it occurs, the magnitude of the speed differential, and
the span of roadway over which the differential is observed.
This document first presents the broad concept for an adaptive traffic signaling
system for work zones based on a distributed system of traffic speed sensors and traffic
signaling devices. Both the sensors and the signals are seen primarily as rather simple,
inexpensive, short-range devices deployed in substantial numbers at the work zone in the
form of "smart barrels." Such barrels would nominally have the appearance of today's
common, work-zone traffic-control barrels. Each barrel would communicate with
"supervisory" computers that would process the distributed speed measurements and
dispense commands for appropriately adjusted and distributed signal intensity based on
existing speed differentials. The system is intended to be readily deployable, requiring
little more effort than currently needed to set up today's systems of traffic control devices
at work zones.
Following the presentation of the system concept, the document discusses what is
seen as probably the most challenging technical problem of such a system, a sufficiently
inexpensive, but technically capable traffic speed sensor. In successive sections, the
document reviews detector requirements, existing detection technologies, technologies
selected for evaluation, and a plan for prototype testing and evaluation.
This document concentrates on the speed-sensing and speed-data-processing aspects
of the system. Concepts for the signaling device are discussed in the companion interim
report by John Sullivan, Work Zone Safety ITS: Human Factors Analysis And Pilot
Research Proposal, UMTRI, May 2004. Among the more promising concepts is a pair of
alternately blinking lights mounted on the barrel where "intensity" adjustment would be
manifest in blink rate and duty cycle. In interpreting this document, the reader is advised
to simply assume such a signaling device.
2. CONCEPT OF THE WORK-ZONE SAFETY ITS SYSTEM
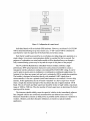
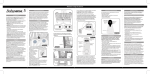
The work-zone safety ITS system presented here is intended to provide distributed
speed-advisory signaling which automatically adapts to the current traffic flow situation
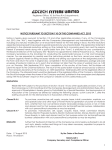
in the work zone. As shown in figure 1, the system is primarily based on the notion of a
"smart barrel," a device similar in appearance to today's work-zone traffic-control barrel
but containing a short-range traffic-speed sensor, a simple but adjustable signaling device
and short-range communication equipment for interfacing with supervisory computers.
Such smart barrels would be distributed in large numbers and at relatively short intervals
throughout the work zone-as ordinary traffic-control barrels are distributed. The
distributed traffic-speed data would be received and processed by the supervisory
computers to provide rapid, real-time adaptation of the distributed signals as appropriate
for the existing speed differential through out the work zone.
Site Supc.rvisor
I>,<
5 I>$I,,,<
.?I
t3< \,:.
St1in1.itlnii,cli
i,'.i*ir~
\p;
55, <ii I
Warnitlp Zone
Iniorri~dr~\,cr.: of irnl~cnditl: t1.iz7~1sd.
(ii\c. rhcni riiui~gli
trine tu ilv'.~cl('\~i)
Figure 1. System concept
The system consists of smart barrels, barrel supervisors, and a site supervisor.
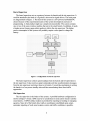
Smart Barrel
Figure 2 shows the major elements that comprise a smart barrel. A low-power
microcontroller contains a local clock that is synchronized to GPS time via inputs from
the barrel supervisor. It has program logic and hardware interface elements to derive
speed from the detector(s) and control the onloff state of the signals (LEDs). It should
also be able to go into a low power sleep mode when low traffic density permits. A
message containing the barrel identification, time, and vehicle speed is sent when a
vehicle (or portion of a vehicle) is first detected. Closely spaced vehicles may not require
a new communication.
Figure 2. Configuration of a smart-barrel
Individual barrels will not include GPS hardware. However, each barrel's LATILON
will be determined during set up (see section 2.2). A "tilt" sensor will be contained in
each barrel to warn the supervisor if the barrel has moved since setup.
Each barrel would be powered by its own battery providing long-term operation on a
single charge. Low-power communications ability is essential for this to succeed. For
purposes of explanation, an actual radio module will be described here even though a
fully communicating system may be beyond the scope of this phase of the project.
The Wi.232DTS (Radiotronix) embedded wireless module combines a highperformance DTS spread-spectrum transceiver and a protocol controller to create a
transparent wireless solution to replace conventional RS-23214221485 wiring. It can be
used in point-to-point, point-to-multipoint, or multipoint-to-multipoint applications. Its
footprint is less than one square inch and cost is estimated at $20 in production quantities.
The module is designed to interface directly with standard UART signals from a
microcontroller. It can use a printed-circuit board antenna or an external 114-wave whip
antenna. In this application, the set of barrels "attached to a barrel supervisor would
share a single data channel and part of the maximum data rate of approximately 150 K
Baud. The set of barrels and their supervisor should be in line of sight within a maximum
range of 1000 to 1500 feet. Thus the number of barrel supervisors is determined by barrel
spacing and the terrain.
The detectors should reliably sense the speed of vehicles in the immediately adjacent
lane. Stopped vehicles are not directly transduced but are deduced (see section 2.3).
Detectors should also consume as little power as possible and be immune to variations in
weather, vibration, and other disruptive influences as found in a typical roadside
application.
Barrel Supervisor
The barrel supervisor acts as a gateway between its barrels and the site supervisor. It
could be attached to the back of a sign that is also used to signal drivers. The main parts
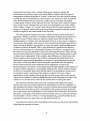
are diagrammed in Figure 3. The heart of this system is a low-powered embedded PC
chosen because of the experimental nature of the system development and ease of
programming. A final product might use a simple microcontroller. The system contains
one or two of the same wireless modules that are in the smart barrels. In addition, it needs
a higher-power (longer range radio) modem to talk to the site supervisor. The higher
power consumption of this system will probably require a solar panel to charge the
battery.
Figure 3. Configuration of a barrel supervisor
The barrel supervisor collects speed readings from the barrels and forwards them to
the site supervisor. It also receives signal commands and time synchronization messages
from the site supervisor and relays those to its barrels. It would also participate in setting
the barrels to a low-power standby state and then reawakening them when traffic
approaches.
Site Supervisor
The site supervisor is the brains of the system. A possible hardware configuration is
shown in Figure 4. It has a GPS receiver to synchronize its clock and to locate it and the
smart barrels. A GPRS cellular modem is provided for reporting to funding or managing
agencies. Since all of the barrels have Lat/Lon coordinates (established upon setup),
automatic reporting of work zone location, extent, and traffic conditions is possible.
Figure 4. Configuration of the site supervisor
The site supervisor receives time-stamped, ID'ed speed readings from the barrels via
the barrel supervisors. The algorithms described in the next section create signaling
commands that are sent out to the barrel supervisors and then to the barrels or other
connected driver warning or communication devices.
2.2 SETUPAND CALIBRATION
Barrels are turned on and placed along the lane(s) of travel with attention paid to
proper alignment relative to the traffic lane of interest. When a set of barrels has been
placed, a configuration box is used to send an initialization message to the barrels to tell
them to switch their radios to the proper channel and then to enter a low-power active
standby mode. After the barrel supervisors and site supervisors are powered and
initialized, the barrels are switched to active mode and begin speed sampling.
Next the barrels need to be located. A laptop computer with a 10 or 20 Hz differential
GPS is placed in a suitable vehicle. The vehicle is driven three times (in each lane of
interest) over the length of the deployment. GPS time, altitude, latitude, and longitude are
collected and written to file or files on the laptop hard disk. The files are then transferred
to the site supervisor computer via an ethernet connection. The site computer imports
these files and uses the times in the file to connect the vehicle path to the time-stamped
speed data collected from the barrels. Thus "the barrels" are located on the map. (Note
that, more precisely, it is the position of the vehicle at the moment the barrel senses its
speed that is actually determined. This, in fact, is the more desirable location
information.) Distances and grades between barrels is then calculated and stored for use
in system operation (see section 2.3). The site supervisor can now start its normal
operating algorithms.
Determining signal intensity based on distributed speed measurements
Actual development of full system software is beyond the scope of this phase of the
Work Zone Safety ITS project. Nevertheless, it is necessary to "develop" system
algorithms at least at the conceptual level in order to have a basis for design of the
hardware elements discussed above. The following discussion presents the structure of
the core algorithms at this basic level. For the moment, these concepts are limited to
single-lane traffic, although we believe they will be readily adaptable to multilane
situations.
Signal intensities (presumably to be manifest as blink rates) to be displayed at each
individual signaling device are expected to be set primarily on the basis of the
deceleration required of faster-moving traffic to avoid collision with slower-moving
traffic ahead, but with additional adjustment based on over-speeding relative to the
posted speed limit.
Addressing the deceleration basis first, signals would not be activated unless the
required deceleration exceeded a minimum threshold. When required deceleration did
exceed the minimum, signal intensity would be adjusted, either proportionately or in
steps, to progressively higher levels up to a maximum associated with upper deceleration
threshold. Although the specific thresholds of deceleration remain a matter of study (in
the simulator) and would, at any rate, be adjustable in a final system, our expectation
would be for a minimum threshold of about 0.05 g (0.5 m/sec2) and an upper threshold of
about 0.15 g (1.5 m/s2). This expectation derives from recognizing that (1) the
deceleration capability of heavy trucks, not passenger cars, is the more important
reference and (2) our understanding of the distribution of braking deceleration of trucks
in real use. It also should be noted that, in practice, deceleration thresholds would be
adjusted for the grade. That is, on descending road segments, the thresholds would be
reduced in accordance with the downward grade and, similarly, increased on ascending
road segments.
A similar adjustment of intensity would be based on over speeding relative to the
posted speed limit. In a fashion analogous to the deceleration procedure, this calculation
would define a minimum threshold of over speed and an upper threshold and vary
intensity in proportionately (or step wise) across the range they define.
Finally, of course, the actual intensity setting used would be the higher of the
respective results of the deceleration and the over-speed criterion.
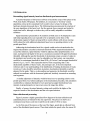
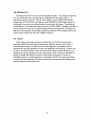
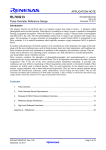
Data-collection and processing
Figure 5 presents a highly generalized flow diagram of the data-collection and
calculation process envisioned for the site supervisor. The process is shown as a
continuous loop whose cycle time would be on the order of 10 Hz or more.
As the first step of the process at the top of the figure, speed data is collected from
each of the distributed speed sensors. These data include the speed value, the sensor ID
(providing location) and a time stamp. Note that if traffic speed and density are relatively
high, a given sensor may well have made more than one measurement in the preceding
cycle period. On the other hand, other sensors may have had no vehicles pass by during
the cycle period, in which case they would transfer no new data.
Following data input, each new data point is checked for validity. This is primarily a
"reality check" to remove spurious data. Each new data point would be compared with
current and recent data from neighboring sensors and "impossible" readings would be
discarded. Valid data would be added to the data record.
Input time-stamped speed data
acquired during this time step. (Some
sensor may provide no new data.)
Test for validity.
(Are new data rational relative to
neighboring current and recent data?)
fail
Test speed data for currency.
(Is vehicle likely still in zone?)
old
Discard
Discard
current, recent
Queue evaluations where appropriate
Calculate and output signal intensities.
Figure 5. Generalized flow diagram of speed-datacollection and signal-intensity calculations
The data is then checked for "currency." That is, given the measured speed, the
distance between sensors, and the time elapsed since the measurement, is the vehicle
which generated the measurement likely still in the measurement zone. Where traffic is
moving slowly or stopped, a measurement taken by a given sensor would stay current for
a substantial time and many many process cycles. Where traffic is moving rapidly, a
measurement may derive from a vehicle which passed completely through the
measurement zone within a single cycle period. Data for vehicles still in the zone of
measurement would be designated as "current" in that zone. New data would be current
in either the zone of measurement or a down-stream zone where the vehicle is predicted
to be. Where multiple data are current for a single zone, the maximum (or perhaps
average) speed would be used to represent the zone. The data record would also retain at
least several "recent" readings from each sensor zone (primarily for use in the validity
check). Finally, if there is no "current" speed value for the first barrel (upstream) of the
system, an "expected" speed, based on the recent history of speeds of entering vehicles
would be assigned as the current speed for the first zone.
The data can then be further processed to evaluate the queue growth where this is
appropriate. Whether or not this is worthwhile undertaking is largely determined by the
spacing of sensors. Where sensors are relatively closely spaced (on the order of the
stopping distance of vehicles at the nominal speed of travel, or less), queue evaluation is
not necessary. For example, with sensors in every smart barrel and barrels spaced by the
often-used rule of spacing in feet equal to two times the speed in miles per hour, queue
evaluation would not be needed. That is, large differences in speed between adjacent
sensors would constitute an un-salvageable situation; to be effective, warnings would
have had to be sent and responded to at previous sensorlsignal locations. Where spacing
between sensors approaches an order of magnitude greater than stopping distance, queue
evaluation may be appropriate. In this situation, large differences in velocity may exist
between adjacent sensor positions that could be manageable and might benefit from
adjustment of signal intensity depending on estimates of end-end position between the
two sensors. On the other hand, it can be reasonably argued that, since the signaling
device located at the lead sensor represents the last opportunity to warn of the
forthcoming queue, the intensity of this signal should be high regardless of the distance to
the queue. Queue evaluation is a conceptually simple process wherein vehicles entering
the zone (i.e., passing the lead sensor) and leaving the zone (passing the second sensor)
are counted in order to keep track of the number of vehicles in the zone. Using a
representative vehicle spacing in the queue, the tail of the queue relative to the second
sensor can be estimated. A modest complication arises from estimating how many of the
vehicles in the zone are still in relatively free motion prior to reaching the queue.
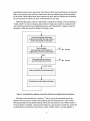
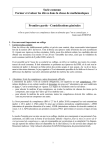
The final step in the processing cycle is the calculation and output of the signal
intensities for each zone. Figure 6 presents the nomenclature used in the explanation of
that calculation that follows which deals with areas of closely spaced sensors and signals.
The figure shows that there are (n+l) smart barrels in the system, each here assumed to
have a speed sensor and a signaling device and numbered from 0 through n, Bo being the
first barrel. A full matrix of the distances between barrels is known, a priori, the distance
from the barrel i to barrel j (where j > i) being designated d[i]~l.Each barrel also has an
associated elevation (ei), speed value (si), and signal intensity (ri).
Assuming close spacing of the smart barrels, per the previous discussion, determining
signal intensity proceeds as follows:
0
Barrels:
Elevation:
Speed reading:
Signal intensity:
B0
e~
so
rg
0
B1
el
S~
'1
0
B2
e2
S2
r2
traffic flow
0
0
Bn-I
Bn
en
sn
n'
%-I
%-I
>
'n-1
Figure 6. Nomenclature
For positions i = 0 through (n-2) for which the speed readings (si) are current, a
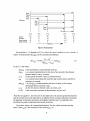
matrix of decelerations (dec[i]u]) can be calculated according to:
for all j > i and where:
dec[i]ul is the deceleration, in gravitational units (g),
d[i]ul is a constant (predetermined at the time of set up) and is the distance
between barrels i and j, in meters,
si, sj
are the speeds at barrels i and j, in meterslsecond,
tlag
is a constant representing the total time lag (system latency and driver
reaction), in seconds,
grd[i]~l = (ei-ej)/d[ilul ,predetermined at the time of setup, is the average
downgrade between barrels i and j,
ei, ej
are the elevations at barrels i and j, in meters, and
0.102 is the conversion constant for deceleration, in g per m/s2,
Note that in equation 1, the first term on the right side is the actual required deceleration
and the second term on the right side is an adjustment for average road grade, increasing
the apparent acceleration demand on downgrades and decrease it on upgrades, thus
providing the grade compensation discussed previously.
From these values, the "required deceleration" for the vehicle currently passing
barrel i (decreq[i])is the maximum of the set dec[i]ul, i.e.:
[
decKqLi1
= max dec
n
il[jl Ij=i+l
This required deceleration, along with the speed of the vehicle relative to the posted
speed, would be used to establish the signal intensity assigned to the next barrel, r[i+ll.
As outlined previously, when decreqexceeds a minimum threshold, the associated
intensity would be adjusted, either proportionately or in steps, to higher levels up to a
maximum intensity associated with an upper deceleration threshold. Also, the differential
speed of the vehicle above the posted speed (i.e., si-sposted)would be compared to a
another set of thresholds to determine an intensity setting based on over-speed. The
maximum of two intensities so determined would actually be used.
For barrels where the intensity is not calculated by the preceding procedure (i.e., the
positions i+l where si is not current), the signal intensity would be set equal to that of the
preceding barrel. The process would be progressive such that a currently calculated
intensity would propagate down the line until reaching a position where a different
intensity had been calculated (i.e., a position where a different vehicle established the
rate).
Finally, where it may be advantageous for paired sets of speed sensor and signaling
device to be widely spaced, the "smart barrel" concept would require slight modification.
Namely, where spacing is so wide that the next barrel is not readily visible, the signal
device must be spaced down stream from its associated speed sensor in order that the
adaptive signal, calculated on the measured speed, could actually be displayed to an
isolated vehicle passing the station. Thus a widely-spaced "barrel" would actually have to
be a pair of barrels, or perhaps a single barrel followed by an associated barrel supervisor
with an incorporated signaling device. The calculation of signal intensity would,
however, proceed on the same basis as indicated above, perhaps with the addition of
queue evaluation in the intervening zone to the next "barrel."
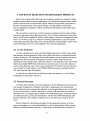
3. REVIEW OF DETECTION TECHNOLOGIES1 PRODUCTS
Most of the existing traffic detection and surveillance products are targeted to either
signalized intersections or freeway applications. The intersection products detect vehicle
presence and are used to activate traffic signals. Inductive loops buried in each lane are
the most common detector. Direct speed sensing is not the primary measurement.
Freeway applications emphasize vehicle counting and classification, and usually report
average speeds.
The non-intrusive sensors are usually mounted on existing structures (signs, bridges,
mast arms, and poles) and get their power from 110 or 230 volt connections to the power
grid or use DC power supplied by traffic control cabinets. The power consumptions range
from 1 to 160 watts. Large size, restrictive mounting requirements, or excessive power
consumption preclude using many of the existing products examined below. Some of the
sensor technology, however, can be adapted to be used in this application.
An active infrared sensor sends out infrared light generated by a LED or laser diode
and measures the time required to reflect off an object and return to an infrared detector
or array of detectors. The Autosense (Scwartz Electroptics) series of sensors scan across
multiple lanes and can provide 3D imagery to classify vehicles. Speed can also be
calculated by measuring the time it takes the vehicle to cross detection zones. The Traffic
observation module (MBB Sens Tech) does not scan but uses two to six laser beams to
create several detection zones. These sensors mount 20 to 25 ft above the road. They are
very accurate but much higher in cost ($5000-$10000) and energy consumption (40 to
160 watts) than the other technologies.
A scaled-down solution that uses infrared emitters and detectors in a side-looking
configuration is discussed in section 4.
All matter above absolute zero emits radiation in the far infrared part of the spectrum.
The amount of radiation is a function of the object's temperature, size, and structure.
Passive infrared sensors measure this radiation. A non-imaging detector has a wide field
of view and can detect a vehicle's presence or velocity (with more than one sensor or
detection zone). An imaging sensor contains a two-dimensional array of detectors and so
can indicate presence, speed, and classification. The IR 254 (ASIM Technologies Ltd)
has four detection zones, mounts overhead to 33 ft, costs $955 and consumes just 0.3
watts.
Passive infrared is a promising technology for this application because of its low
power consumption, cost, and an adaptability to a side viewing detector. Many security
products use infrared motion detectors. A speed sensor is described later in section 4.1.
A passive acoustic sensor detects sound (primarily tire noise) from approaching
vehicles with a two-dimensional array of microphones. The array is mounted on a pole 20
to 40 feet above the ground beside the road. Smartsonic and SAS-1 sensors are two
passive acoustic products. They both have trouble with slow-moving vehicles and stopand-go traffic. They are primarily recommended for measuring free-flow traffic at speeds
above 30 mph and therefore are inappropriate for a work-zone application.
Ultrasonic air sensors emit a burst of sound pulses at a frequency between 25 and 50
KHz. Distance is calculated by measuring the time it takes the beam to return after
reflecting off the target. Two closely spaced emitters can permit speed measurement.
Sensors can be overhead or side mounted. The TC-30C (Microwave Sensors) is a an
ultrasonic ranging sensor that indicates vehicle presence. It costs $559 and consumes 3 to
4 watts. There are dozens of ultrasonic emitter, transducer, and integrated sensor
manufacturers whose products are used in object detection in commercial and industrial
applications and are fairly inexpensive. An ultrasonic detector that also measures the
Doppler frequency shift of a reflected signal is available for purchase.
The two main problems with these types of detectors are high power consumption
(relative to the passive technologies) and the challenge of running them at high enough
burst rates to detect fast-moving vehicles.
Magnetic sensors use a dual-axis flux-gate magnetometer to measure the Earth's
magnetic field. When a vehicle approaches the detector, the vehicle distorts the magnetic
field and the sensor detects this change. Both the SPVD-2 (Self-Powered Vehicle
Detector - Midian Electronics) and the Groundhog Permanent Count Station (NuMetrics) use this method. They are packed in plastic canisters and buried in the roadway.
The SPVD-2 is powered by a 13.5 Volt, 17 amp hour alkaline D-cell pack that can last 4
to 5 years. The sensor sends vehicle arrival and departure messages to an above-ground
receiver via a 47 MHz FM radio modem. This sensor technology is passive and consumes
very little power which satisfies one of the primary requirements in the smart barrel
application.
Banner Engineering Corp. has recently introduced the M-Gage S18M Vehicle
Detection Sensor which sells for $209 in quantities of one. This product uses a 3-axis
magnetometer and is targeted for both above- and below-grade installations. Background
condition and sensitivity adjustments allow tailoring the sensor to the applications
magnetic environment, object properties, and desired range. Several sensor manufactures
(Honeywell, Crossbow, and Fraunhofer-Institut Photonsche Mikrosysteme) sell two and
three axis magnetometers. As discussed in the section 5, we will evaluate magnetometers
mounted on plastic barrels to sense velocity.
Continuous microwave devices use the Doppler principle -the change of frequency
of a wave reflected from a moving object is proportional to the objects speed- to
directly measure the speed of a vehicle. The available systems (TDN-30 by Whelen
Engineering, TC-20 by Microwave Sensors, and DRS 1000 by GMH Engineering), are
configured to be used in an overhead mount or an elevated side mount. Typical power
consumption is 2 to 6 watts and single unit cost is $1000 to $2000. It might be possible to
mount a radar device on top of a barrel facing towards oncoming traffic. The high cost,
high power consumption, and possible interference problems with multiple radars in the
same location would make this only a fallback solution.
Video image processing promises the richest data set of traffic measurements
including vehicle detection, speed, classification, headway, density, and volume. A
camera sends an image to a video processor which digitizes it and applies various
detection and tracking algorithms to extract the applicable measurements. Cameras can
be side or overhead mounted. The Autoscope Solo (Econolite Control Products) even
integrates the camera and processor into one package. Video systems are probably the
hardest to install and calibrate correctly of all detector technologies. The lack of
portability, high cost, and the high power consumption (20-50 watt range) make them
unsuitable for this application. The dirty construction environment and changing road
features might also prevent their use.
4. SELECTED TECHNOLOGIES FOR EVALUATION
After accurately measuring vehicle speed, low power consumption is the next most
desirable feature of a speed sensor technology that will run off of batteries. UMTRI will
evaluate the sensors from lowest to highest power usage, i.e., passive infrared, magnetic,
active infrared, and ultrasonic.
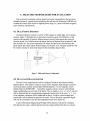
An infrared detector consists of a lens, a filter opaque to visible light, and a sensing
element. Figure 7 illustrates how a dual sensor measures speed. The difference of the
sensors is the quantity of interest. Infrared sources seen by both sensors are removed
from the signal. As a vehicle passes the barrel, the heat is detected first in sensor #1 and
then in Sensor #2. The sensor separation (18 inches) divided by the time between the
peaks equals the vehicle speed. Sensor height, lens field of view, and gain sensitivity will
be varied to attempt to sense only targets in the immediate adjacent lane.
18 inches apart
(Barrel width)
h
i
'
1
L
'J
Figure 7. Differential Sensor Configuration
The dual 3-axis magnetometer will be configured similar to the infrared solution
depicted above. This makes it easier to cancel out the magnetic field changes caused by
local metal objects and the normal daily field fluctuations. A 3-axis magnetic sensor
hybrid (Honeywell HMC2003 - 3 permalloy magneto-resistive sensors with onboard
signal conditioning) on each side of the barrel. The six signals (xl, y 1, zl, x2, y2, and 22)
will be digitized and the corresponding magnitudes (square root of the sum x2 + y2 + z2)
of the magnetic variations will be subtracted as above. As above, sensor heights and
sensitivities will be adjusted to optimize the result. The six direction component signal
will also be examined in case the speed algorithm needs to be improved.
A pair of the Banner Engineering M-Gage S 18m detectors will also be evaluated.
This detector has only a vehicle detected (yeslno) output and therefore the two sensors
will not be connected differentially as above. Instead, the time between detection
activations will be used directly in the speed calculation
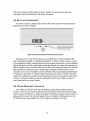
As shown in figure 8, dual presence sensors determine speed by observing the time
period between the two signals.
locity =
Distance betbeen ensora
Time betaeen signals
Figure 8. Speed measurement with dual presence sensors
Packaged active red or infrared sensors are available from several companies that
target automated assembly or conditioning machines. A diffuse reflective sensor consists
of an irradiating (usually infrared) element and an element photosensitive to the irradiated
light in the same unit. The emitted light reaches the detector after being reflected from an
object. Variation in the color and texture of the object will change the amount of reflected
light and hence the detection range. Output light is modulated to differentiate it from
external sources such as sunlight. Units are available with an output signal proportional to
the distance to the object or a logical output that indicates an object is within a specified
range. This technology consumes more power than the above two and also is much more
sensitive to ambient conditions. Speed is calculated from the time it takes an object to
travel between the two sensor beams.
This solution is different from the side looking configurations already examined
because it uses only one sensor mounted on the barrel that is focused towards oncoming
traffic as shown in Figure 9. A single piezoelectric transducer is used to transmit series of
pulses and then receive the reflected signal. Units are available with frequencies in the
30-50 KHz range, beam widths from 8 to 30 degrees, and ranges to 50 feet.
Figure 9. Speed measurement with pulsed Doppler ultrasound
A microcontroller can calculate range by measuring the time lapse between the
outgoing pulses and the reflected pulses. Speed can be calculated by measuring the
frequency of the returning pulses and subtracting it from the outgoing frequency to yield
the Doppler frequency. Because the speed of sound in air is a function of temperature, the
ambient temperature must be measured and used to correct ranges.
The HE661 (Hexamite) signal conditioner interfaces with the company's line of
ultrasonic sensors and outputs the range to the closest object and the speed of the object
traveling at the maximum speed within the operating boundaries.
Finally, two pulsed ultrasonic sensors (at lower power outputs than the above) can be
mounted in the same configuration as the active infrared solution. Here each would detect
only vehicle presence and the speed would be calculated from measuring the time it takes
to travel between detectors. Possible interference between sensors might require some
electronically controlled phasing or a mechanical separation (although the barrel could be
enough).
5. SENSOR EVALUATION AND TESTING
UMTRI intends to evaluate and test the selected sensor technologies in a two-stage
process made up of (1) evaluations of the selected technologies in controlled testing
situations until two or three are deemed acceptable and (2) a limited field test of the more
promising sensors identified by the evaluation.
UMTRI will purchase or assemble one speed sensor of each of the five selected
technologies. Each sensor will be evaluated in a set of controlled experiments until two or
three are found worthy of further testing. Data will be collected using UMTRI's existing
Data Acquisition System (DAS). Target vehicles will be UMTRI-owned vehicles driven
past the sensors in accordance to a matrix of prescribed speeds and ranges. Target vehicle
speed will be measured independently with conventional radar gun. Within practical
limits, tests will be conducted under varying environmental conditions as appropriate for
challenging the particular sensor. Test sites will be limited to UMTRI or University
property and local roadways.
The data records of these evaluation tests will be examined and analyzed to choose
the set of the two or three most promising sensors. These sensors will then be deployed in
a limited field test wherein the sensors will operate unaccompanied for periods of several
days at each of at least two road sites. At least one site will be characterized by repeated
queue and by the expectation of variable speeds at least through the mid- to slow-speed
range. Such a site might be an actual work zone but could also be near a stop light on a
nominally fast-moving urban arterial.' At least one other site which will insure highvolume high-speed traffic will be employed, e.g., a nearby limited-access roadway.
The sensors will be installed in one, or perhaps two conventional traffic-control
barrels. Data again will be gathered using existing UMTRI DAS. In addition to the sensor
data, we will collect reference vehicle speeds using a conventional radar speed detector
and a continuous video record using video camera and the frame-grabberlvideo storage
feature of the UMTRI DAS. As an additional source of "truth" data, we will also drive
UMTRI vehicles, with their own DAS system, though the test site on multiple occasions
during the field test. Data collected on the vehicle will include GPS position and time as
well as the obvious vehicle speed. GPS data will allow reliable matching of speed
measured on the vehicle with speed measurements at the field-test sites. Of course, video
taken at the site and synchronized with site data provides and additional cross check.
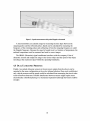
In our original proposal, we proposed that sites for field testing would, in fact, be work zones. But on
further reflection, and as implied by this example, it is not clear that this is necessary nor perhaps even
advantageous.
6. BIBLIOGRAPHY
Banner Engineering Corp, "M-Gage S 18m-Vehicle Detection Sensor", Data and
Application Sheets, 2004. tvtvw ,bannere~~git~eeri~g~cc~n~
Caruso, Michael J. and Lucky S. Withanawasam "Vehicle Detection and Compass
Applications using AMR Magnetic Sensors." Honeywell SSEC, 1999.
www,ssee,horreywell~eorn.
CTC & Associates LLC, WisDOT RD&T Program "Evaluating New Sensor
Technologies for Actuated Signals." Report prepared for Bureau of Highway Operations
Division of Transportation Infrastructure Development, December 2003.
httr~~~z~z~z.,d.~t,wisa7.onsi~,g.~~1IFhrx~ir~s~~ctaLds.sLtsrsitsarsig.~~~~en~.
Culler, David E. and Wei Hong. "Wireless Sensor Networks." Communications of the
ACM 47, no. 6 (2004): 30-33. http://portal.acm.org/portal.cfm.
Goode, Barbara G., ed Wirelessfor Industry: Supplement to Sensors Magazine Summer
2004. w w w , s c r a s ~ r s ~ ~ a g ~ ~ o m / ~ ~ i ~ e I e ~ ~ .
Hill, Jason, Mike Horton, Ralph Kling, and Laksman Krishnamurthy "The Platforms
Enabling Wireless Sensor Networks." Communications of the ACM 47, no. 6 (2004): 4146. http://portal.acm.org/portal.cfm.
Klein, Lawrence A. Sensor Technologies and Data Requirements for ITS. Boston: Artech
House ,200 1. fnt8.rs~iL~~~:~~.~~chh.~us.~.~o%n~.
.
Martin, Dr. Peter, Yuqi Feng, Xiaodong Wang, "Detector Technology Evaluation."
Department of Civil and Environmental Engineering, University of Utah Traffic Lab,
2003. http:/iwww.h.raffi~:~a.b~~taka~edax/.
Middleton, Dan, Deepak Gopalakrishna, and Mala Raman "Advances in Traffic Data
Collection and Management." One of three white papers that support a series of
workshops on Data Quality, which were held in March 2003. The EDL numbers for the
full set of white papers are: 13766, 13767, 13768. Prepared for Office of Policy, Federal
Highway Administration, Washington, DC, 2003.
http:~i~v~v~v,itsdocs,P"n1~va~df~t~~~viJ%4QD~CSi%ZE~TS
TEi13766.html.
Middleton, Dan, Ph.D., P.E. and Rick Parker "Vehicle Detection Workshop, Participant
Notebook." Texas Transportation Institute, The Texas A&M University System, 2000.
http://rcc,tarnu,cdt~idocs/WCEPDF VOB H~Tam~IMiddBet~fp~TMh)8~pdf.
Mimbela, Luz Elena Y., Lawrence A. Klein, Ph. D., P.E., Perry Kent, John L. Hamrick,
Karen M. Luces, and Sylvia Herrera "A Summary of Vehicle Detection and Surveillance
Technologies used in Intelligent Transportation Systems." The Vehicle Detector
Clearinghouse, 2000. http:/iwww.nrnsu,edu/-traffic!,
Minnesota Department of Transportation, Office of Traffic, Security and Operations, and
SRF Consulting Group, Inc.. "Portable Non-Intrusive Traffic Detection System
(PNITDS): Research of Existing Portable Systems." 2003. SRF No. 4869.
http:~!www,dot,state.mn.ladguide~taripdf/p~~itd~iE~i~tingSy~tems~pdf.
Montgeomery, Steve J. "Wi.232DTS User's Manual, Rev 1.0." Radiotronix Inc., 2002.
h t t p : / / t ~ tyradiotro~~ixr;~~midatash~et~~Wii2
~t~
User's Manual rev 1 2.pdf.
Szewczyk, Robert, Eric Osterweil, Joseph Polastre, Michael Hamilton, Alan Mainwaring,
and Deborah Estrin "Habitat Monitoring with Sensor Networks." Communications of the
ACM 47, no. 6 (2004): 34-40. http://portal.acm.org/portal.cfm.