1
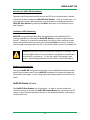
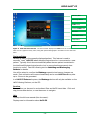
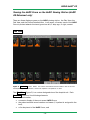
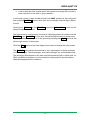
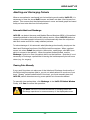
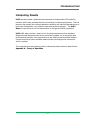
HeRO ES ® Version 3.1 System Manual Caution: Federal law restricts this device to sale by or on the order of a physician. COPYRIGHT © 2015 BY MEDICAL PREDICTIVE SCIENCE CORP. ALL RIGHTS RESERVED. UNAUTHORIZED REPRODUCTION IS STRICTLY PROHIBITED. Do not alter, translate, transfer, disclose, or use these materials or any part thereof in any form by any means except by prior written authorization from Medical Predictive Science Corporation. For information on licensing for authorized use of these materials, contact: Technical Publications Medical Predictive Science Corporation 2246 Ivy Rd, Suite 17 Charlottesville VA 22903 Telephone: 800.394.1625 Fax: 240.220.6098 E-mail: [email protected] Medical Predictive Science Corporation, Inc. makes no warranties, express or implied, regarding these materials, including but not limited to any warranties of merchantability or fitness for a particular purpose. Medical Predictive Science Corporation, Inc. makes these materials available solely on an "as -is" basis. Medical Predictive Science Corporation, Inc. accepts no responsibility for altered or edited versions of these materials. Medical Predictive Science Corporation, Inc. reserves the right to revise and improve its products as it sees fit. This publication describes the state of the product at the time of this publication only, and may not represent or describe the product at all times in the future. HeRO, The Power to Predict, and the MPSC logo are trademarks or registered trademarks of Medical Predictive Science Corporation, Inc. Microsoft and Windows are registered trademarks of Microsoft Corporation. Philips and Intellivue are registered trademarks of Koninklijke Philips Electronics N.V. Document Number: MPSC-INS-1627(R1.10) TABLE OF CONTENTS Introduction ........................................................................................................................ 4 Indications for Use...................................................................................................... 5 Contraindications ........................................................................................................ 5 Precautions................................................................................................................... 5 Using this Manual ....................................................................................................... 6 Overview ............................................................................................................................. 7 Server............................................................................................................................. 8 Network Data Acquisition Interface (NDAI)........................................................... 8 Viewing Stations .......................................................................................................... 9 Using HeRO ES ............................................................................................................... 10 Setting Up ................................................................................................................... 10 Viewing the HeRO Score.......................................................................................... 11 The HeRO ES Solo Window................................................................................... 11 Activating the HeRO ES Solo Window .............................................................. 12 Continuous HeRO Monitoring ............................................................................ 12 Window Position and Size .................................................................................. 12 HeRO ES Patient Window ...................................................................................... 12 Discharge Button................................................................................................. 13 Scrollbar ............................................................................................................... 13 Help....................................................................................................................... 13 Viewing the HeRO Score on the HeRO viewing station (HeRO ES Enhanced only).............................................................................................................................. 14 Plan View ................................................................................................................. 14 Pod View.................................................................................................................. 16 Patient View ............................................................................................................ 17 Status and Error Messages .................................................................................... 18 Admitting and Discharging Patients ..................................................................... 20 Automatic Admit and Discharge ............................................................................ 20 Clearing Data Manually .......................................................................................... 20 Interpreting Results ......................................................................................................... 21 Troubleshooting............................................................................................................... 22 Customer Service ............................................................................................................ 26 Appendix A: Theory of Operation ................................................................................. 27 Algorithms for Calculating RRI Parameters ........................................................ 27 Data Packaging........................................................................................................ 27 Data Conditioning Prior to Calculation of HRV.................................................... 27 Mathematical Analysis ............................................................................................ 27 -2- TABLE OF CONTENTS Histogram Based Parameters ............................................................................ 27 Sample Asymmetry Analysis .............................................................................. 28 Sample Entropy ................................................................................................... 28 Mathematical Modeling ........................................................................................... 29 Logistic Regression................................................................................................. 29 Fold Increase Score................................................................................................ 29 HeRO Score............................................................................................................. 30 References:................................................................................................................. 30 Appendix B: Glossary..................................................................................................... 31 -3- INTRODUCTION Introduction HeRO provides an automated, noninvasive method to detect transient decelerations and reduced baseline heart rate variability. HeRO continuously acquires, records, measures and analyzes variations in RR Intervals, and provides ongoing display of this information. HeRO is used to: Continuously acquire heart rate data from an existing physiological monitor Identify and determine the length of time between individual heart beats (the R-R Interval) Calculate a set of measures from these R-R Intervals to characterize the heart rate pattern Compute an “index” based on the degree of decelerations and reduced baseline variability in these patterns, Calculate the HeRO Score, which expresses the index as a fold-increase relative to the overall NICU population, and Provide this information to clinicians in a timely and intuitive fashion. HeRO ES is a stand-alone implementation of HeRO that processes heart rate data on the Philips Integrated PC (iPC) and shows the HeRO Scores at the bedside, on the main display of the physiological monitor. HeRO ES Enhanced, is an optional upgrade that merges the functionality of HeRO Symphony and HeRO ES enabling a server based implementation and central monitoring while still displaying HeRO information on the physiological monitor. -4- INTRODUCTION Indications for Use HeRO is intended to acquire, store, analyze, and report on ECG data collected from infants. HeRO is intended to be used by trained operators under the direct supervision of a licensed health care practitioner in a hospital neonatal or pediatric ICU environment. HeRO is intended to be used for the analysis of the variability in RR Intervals (heart rate) and to report measurements of the variability of heart rate data (HRV). The HRV measurements reported by HeRO are specialized in nature, and intended to identify periods of transient decelerations and/or reduced baseline variability in the heart rate. HeRO is intended to provide only specialized HRV measurements and is not intended to produce any interpretation of those measurements or any kind of diagnosis. The specialized HRV measurements produced by HeRO have not been approved by the FDA for any specific clinical diagnosis. HeRO ES acquires data from a user-supplied ECG monitor, and requires a monitor with an integrated PC. Installation, training, maintenance and support are to be performed by Medical Predictive Science Corporation employees or contractors who have been certified by Medical Predictive Science Corporation as qualified to perform such duties. Contraindications Patients with erratic, accelerated, or mechanically controlled irregular heart rhythms are not suitable for HRV evaluation. When shown, the ECG waveform displayed on the computer screen is not to be used for analysis of cardiac function. Precautions As is customary with good medical practice, the interpretation of any medical data should be made in conjunction with all other available medical history and diagnostic information about a patient. -5- INTRODUCTION Using this Manual This manual is written for physicians, clinicians, nurses, care extenders and hospital IT personnel who are familiar with basic Windows software operation. Clickable menu items or button names are designated by a box around the name, i.e. Help . Labels of non-interactive graphs, or screen displays are indicated by bold type, i.e. Main Menu. The symbol indicates a warning that could potentially affect patient care if not followed. -6- OVERVIEW Overview HeRO ES is a software application that runs on the Philips Integrated PC (iPC) option of the Philips Intellivue MX series physiological monitor. The iPC is a Windows PC that shares the screen and enclosure with the main patient monitoring hardware. HeRO ES acquires Heart Rate data from the patient monitor (over a dedicated internal network connection), computes hourly HeRO scores for the patient being monitored, and displays the results on the shared screen. HeRO has no applied parts. HeRO ES Solo Window HeRO Smart Key Figure 1: HeRO ES on the Philips Intellivue MX800 Physiological Monitor. In this example, the HeRO ES window is displayed along with the other vital signs using a dedicated screen layout that reserves space for the iPC display. Other screen layouts can be configured with or without the HeRO ES window. The patient monitor is typically configured to show the HeRO score on the default screen; users can change screens as needed in the course of patient care, then return to the HeRO screen as needed. HeRO ES Enhanced, is an optional configuration that enables additional functionality by the incorporation of a HeRO Server. HeRO ES Enhanced consists of the iPC module installed in the physiological monitors, a Server, and one or more Viewing Stations. In this installation, the Server is configured to acquire data from the physiological monitor through the iPC. -7- OVERVIEW HeRO Viewing Stations Physiological Monitors RM 123456 HeRO Server 16 MAR 98 17 28 HR T (210-100) 3 16 8 1 END 3 HeRO RESPIRA TION RSP R ATE: 68 20S A PN EA ( 100 - 0) LA ST APN EA 12-03 16 MAR 63 SECS DUR ATION P ULSE-UF M CUFF 00: 22 H OLDIN G ( 100- 50) ( 70-20) 72 31 55 ( 90-30) S a02 92 SIG 93 PR 164 100- 88 SE T UP THE A DJUST STOR E D ATA ZERO BP REA D SPE CIA L MONITOR VITAL SIGNS IN CHAR T HOLD OFF CUFF B P FU NC TION S RM 123456 16 MAR 98 17 28 HR T (210-100) 3 16 8 1 END 3 HeRO RESPIRA TION RSP R ATE: 68 20S A PN EA ( 100 - 0) LA ST APN EA 12-03 16 MAR 63 SECS DUR ATION P ULSE-UF M CUFF 00: 22 H OLDIN G ( 100- 50) ( 70-20) 72 31 55 ( 90-30) S a02 92 SIG 93 PR 164 100- 88 SE T UP THE A DJUST STOR E D ATA ZERO BP REA D SPE CIA L MONITOR VITAL SIGNS IN CHAR T HOLD OFF CUFF B P FU NC TION S RM 123456 16 MAR 98 17 28 HR T (210-100) 3 16 8 1 END 3 HeRO RESPIRA TION RSP R ATE: 68 20S A PN EA ( 100 - 0) Hospital Clinical Network LA ST APN EA 12-03 16 MAR 63 SECS DUR ATION P ULSE-UF M CUFF 00: 22 H OLDIN G ( 100- 50) ( 70-20) 72 31 55 ( 90-30) S a02 92 SIG 93 PR 164 100- 88 SE T UP THE A DJUST STOR E D ATA ZERO BP REA D SPE CIA L MONITOR VITAL SIGNS IN CHAR T HOLD OFF CUFF B P FU NC TION S RM 123456 16 MAR 98 17 28 HR T (210-100) 3 16 8 1 END 3 HeRO RESPIRA TION RSP R ATE: 68 20S A PN EA ( 100 - 0) LA ST APN EA 12-03 16 MAR 63 SECS DUR ATION P ULSE-UF M CUFF 00: 22 H OLDIN G ( 100- 50) ( 70-20) 72 31 55 ( 90-30) S a02 SIG 93 92 PR 164 100- 88 SE T UP THE A DJUST STOR E D ATA ZERO BP REA D SPE CIA L MONITOR VITAL SIGNS IN CHAR T HOLD OFF CUFF B P FU NC TION S Options 1 and 2 Option 2 Figure 2: HeRO ES Enhanced Overview. The HeRO Server acquires the heart rate and patient demographics from the physiological monitor through the iPC. Server The HeRO Server is a commercial server-class PC that is typically installed in a data closet or other similar location. It serves as the hub-of-the-wheel: it computes HeRO scores, stores the main HeRO database, coordinates patient transfers, and stores settings for the other components of the HeRO system. Network Data Acquisition Interface (NDAI) The Network Data Acquisition Interface (NDAI) is a software extension to HeRO ES that enables the Server to acquire heart rate data from the physiological monitor. This interface can also perform Patient Admit, Discharge, and Transfer (ADT) operations based on information retrieved from the physiological monitors. -8- OVERVIEW Viewing Stations The Viewing Stations present the HeRO user interface to clinicians. In a typical installation, several dedicated viewing stations (small form factor computers with monitors) are deployed in various points throughout the NICU. The system can also be configured to allow existing hospital PCs to access HeRO via web browser. -9- USING HeRO® ES Using HeRO ES Setting Up The HeRO ES software shall be installed and configured by MPSC authorized technical personnel. MPSC recommends that all Philips Integrated PCs (iPCs) that run HeRO ES be connected to a hospital intranet to facilitate license and software updates. In the case that the HeRO ES Enhanced option is installed, the iPC must be connected to the hospital intranet at all times. If required, additional network connections shall be the responsibility of hospital IT personnel. If network problems arise, contact the hospital network administrator, or MPSC Technical Support (toll free 1-800-394-1625). - 10 - USING HeRO® ES Viewing the HeRO Score The HeRO ES Solo Window The HeRO Score is shown on the HeRO ES Solo Window, which appears on the display of the Philips MX series monitor along with the other vital signs (see Figure 1). The HeRO ES Solo Window displays the most recently computed HeRO Score as a numeric value, and also shows a graph that trends the values over the last five days. HeRO ES computes a new HeRO score for the patient at the beginning of each hour (1:00, 2:00, etc). When a new patient is admitted to the monitor, it may take up to 3 hours for the first score to be shown. HeRO ES will stop generating scores if the overall amount of data is insufficient or if there is not enough recent data to generate an accurate score. These gaps in the HeRO score trend can occur if the patient leaves the bed, or if the ECG signal is otherwise interrupted, for 30 minutes or more. When the ECG signal is restored, HeRO ES will resume generating scores as soon as enough new data is available. This may take up to an additional 3 hours. Heart Rate Capture Indicator Patient / Bed Info HeRO Score trend Current HeRO Score Figure 3. HeRO ES Solo Window. The main window displays the HeRO score as a numeric value and as a graphical 5 day trend, along with patient demographic information - 11 - USING HeRO® ES Activating the HeRO ES Solo Window Typically, the Philips Intellivue MX monitor and iPC are configured with a default screen layout that includes the HeRO ES Solo Window. If this is not the case, or if you have been using a different layout, you may need to manually activate the HeRO ES Solo Window by pressing the HeRO smart key on the Philips monitor (see Figure 1). Continuous HeRO Monitoring HeRO ES processes Heart Rate data and generates scores while the iPC is running, regardless of whether the HeRO ES Window is visible on the Intellivue screen. Therefore, it is perfectly acceptable to switch to other Intellivue screen layouts as needed without concern over disrupting HeRO monitoring. However, monitoring is interrupted while the iPC or the entire patient monitor is powered off. HeRO monitoring is active only when the Philips iPC is running. The Intellivue MX patient monitor should be configured to automatically start the PC on power up. (To do this, enter Config mode, then select Main Setup/Hardware/Internal PC/Auto Start PC/Enabled.) Window Position and Size The typical HeRO ES configuration uses one or more dedicated Intellivue screen layouts that provide space for the HeRO ES Window to be shown alongside the other patient vital signs. In this configuration the window cannot be moved or re sized. HeRO ES Patient Window The HeRO ES Solo Window is not interactive. In order to access interactive functions, you must activate the HeRO ES Patient Window, by switching to an iPC screen on the Intellivue that allows access to the Windows Taskbar, and clicking on the HeRO icon. - 12 - USING HeRO® ES Patient / Bed Discharge Button HeRO Trend Current HeRO Score Scrollbar Heart Rate Trend Help Button HeRO Icon Figure 4. HeRO ES Patient Window. The main window displays the HeRO score as a numeric value and as a graphical 5 day trend, along with patient demographic information and a heart rate trend Discharge Button Deletes all data for the currently displayed patient. This feature is used to manually “reset” HeRO ES when the physiological monitor is connected to a new patient. Typically this is done automatically when the new patient is admitted to the Intellivue MX physiological monitor, but in some situations a manual clear function is useful. See the following section Admitting and Discharging Patients for details. You will be asked to confirm the Discharge operation before any changes are made. Data collection will resume immediately and a new HeRO Score may take up to 3 hours to be generated. In a HeRO ES Enhanced system, the Discharge button will only be available on the HeRO Viewing Stations, not the iPC. Scrollbar The scrollbar can be used to review Heart Rate and HeRO trend data. Click and drag the scrollbar button, or use the arrows to navigate. Help Displays the full user manual (this document). Displays version information about HeRO ES. - 13 - USING HeRO® ES Viewing the HeRO Score on the HeRO Viewing Station (HeRO ES Enhanced only) There are three display screens on the HeRO viewing station: the Plan View, the Pod View, and the Patient Detailed View. In all cases, a five day trend of the HeRO Score is plotted wherein the trend goes from left, 5 days ago, to right, current. Plan View Figure 5. Plan View Screen. NOTE: The names and medical record numbers used in this and subsequent figures are fictitious, and do not represent real patients or users. The Plan View (Figure 5) is a custom-designed view of the hospital unit. Each Bed Icon consists of the following elements: the bed number, a numeric display of the most recent HeRO Score, the patient medical record number and name (if a patient is assigned to the bed), a five-day trend of the HeRO Score, and - 14 - USING HeRO® ES a status indicator that is green when the system is receiving RR intervals or heart rate data for the bed, or gray otherwise. In units that contain a large number of beds, the HeRO system can be configured with multiple Plan View screens, with each one covering a physical region within the unit. Clicking on a Bed Icon on the Plan View opens the Patient View screen for the patient assigned to that bed. The system can be configured to obscure all identifying patient information on the Plan View and Pod View . In this case, the identifying information will become fully visible when a user logs in to the system by pressing the Log in button at the bottom right corner of the screen. Click the Help button at the lower edge of the screen to display the help screen. The Bed Icon may display informational or error messages to indicate problems or status changes. These messages, and their meanings, are summarized below. The messages differ based on the data acquisition method (DAD or NDAI) and, for NDAI installations, whether or not the interface is being used to provide patient admit/discharge/transfer information. - 15 - USING HeRO® ES Pod View Figure 6. Pod View Screen While the Plan View typically shows all beds in the unit, the Pod View provides a more detailed view of a small group of beds located in a particular section of the unit, with the icons arranged in a grid. A typical installation will be configured with multiple Pod View screens that collectively cover all of the beds in the unit. The elements composing each Bed Icon are similar to the Plan View : the bed number, the patient medical record number and name (if a patient is assigned to the bed), a five-day trend of the HeRO Score, a bar graph that shows the most recent HeRO Score, a numeric display of the most recent HeRO Score, and a status indicator that is green when the system is receiving RR intervals or heart rate data for the bed, or gray otherwise. As on the Plan View , clicking on a Bed Icon will show the Patient View . - 16 - USING HeRO® ES The Bed Icon on the Pod View displays the same status and error messages as on the Plan View . Refer to the previous section for more information. Patient View The Patient View covers a single bed in the unit, providing a much more detailed look at the HeRO Score than either the Plan View or Pod View . The Patient View on the HeRO Viewing Station is the same as the HeRO ES Patient Window. Please refer to the instructions in the manual for HeRO ES Patient Window, with the following exception. In a HeRO ES Enhanced system, the Discharge button will only be available on the HeRO Viewing Stations, not the iPC. - 17 - USING HeRO® ES Status and Error Messages The bottom section of the Main Window may display informational or error messages to indicate problems or status changes. These messages, and their meanings, are summarized below. Message Description Comm Error There are two cases where this error will apply. With HeRO ES, the system is unable to communicate with the Intellivue MX patient monitor. With HeRO ES Enhanced, the message will also appear when the HeRO Server is unable to communicate with the iPC. In both cases, No Heart Rate information is being collected, and no HeRO Scores will be generated. This message may appear for up to 60 seconds when the patient monitor is first powered up. If the message does not disappear, there may be a hardware problem or a configuration error. No Heart Rate The system is communicating with the Intellivue patient monitor but is not receiving heart rate data. This typically indicates that the patient monitor is not able to calculate heart rate values due to an absent, weak, or noisy ECG waveform. Check the leads or change the lead pair selection to improve the quality of the ECG waveform. If this warning appears while the Intellivue is steadily displaying a numeric heart rate value, there may be a hardware problem or a configuration error. No MR Number The system is receiving data from the physiological monitor serving the bed, but no Medical Record Number is specified for the patient admitted to the monitor. No Name The system is receiving data from the physiological monitor serving the bed, but no Name is specified for the patient admitted to the monitor MR # Conflict The physiological mointors for the affected beds are reporting the same Medical Record Number for the admitted patient. System Comm Error The HeRO ES window application is not able to communicate with the services that acquire data and generate HeRO Scores. This message may appear for - 18 - USING HeRO® ES up to 60 seconds when the patient monitor is first powered up. If the message does not disappear, there may be a hardware problem or a configuration error. Error processing data An error occurred while assigning heart rate data and HeRO Scores to a patient. Updating patient data... Heart Rate and/or HeRO Score data is being updated for the current patient. Updating scores... HeRO ES is recalculating scores for the current patient. Invalid License The HeRO ES software license installed on the iPC has an invalid signature or is otherwise corrupt. License Expired The HeRO ES software license for this patient monitor has expired. HeRO ES will continue to generate scores for the current patient but will not generate scores for any patients admitted in the future. License Expires in n days This warning message indicates that the software license will expire in the indicated amount of time. For more detailed information about these messages, and suggestions for diagnosing and resolving problems, refer to the Troubleshooting section of this manual. If the situation is not resolved by following the suggested steps, contact MPSC Technical Support (toll free 1-800-394-1625). - 19 - USING HeRO® ES Admitting and Discharging Patients When a new patient is transferred into the bed being monitored by HeRO ES, it is necessary to clear the stored HeRO scores and heart rate data from the previous patient. This ensures that the displayed numeric score and trend graph are based solely on heart rate data from the new patient. Automatic Admit and Discharge HeRO ES can detect the name and Medical Record Number (MRN) of the patient currently admitted to the Intellivue MX patient monitor. When HeRO ES detects a change in the demographic information,it will automatically clear the old patient data and create records for newly admitted patients. To take advantage of this automatic admit/discharge functionality, simply use the Admit and Discharge functions of the Philips Intellivue system. When a patient moves into a bed, Admit the patient to the monitor, specifying a valid MRN (one which is unique to that patient). When the patient leaves the bed, use the Discharge function to clear the patient data from the Intellivue. Note that it is not necessary to Discharge a patient that is leaving the bed temporarily but will soon return (e.g. for surgery). Clearing Data Manually If your work flow does not make use of the Admit and Discharge functionality of the Philips Intellivue system (that is, you do not admit patients to monitors or you leave “dummy” patients admitted all of the time), you must manually clear the HeRO ES patient data when moving a new patient into the monitored bed. To manually clear patient data, click Discharge in the HeRO ES Patient Window Finally, click Yes to confirm the operation. You must use one of the above methods of handling Admit and Discharge operations to ensure accuracy of the displayed scores. - 20 - TROUBLESHOOTING Interpreting Results HeRO results provide a quantitative assessment of characteristic RR variability patterns, which may precede the clinical indications of developing illness. Clinical research has shown that reduced baseline variability and transient decelerations of heart rate (bradycardia) are related to fetal and neonatal distress 1. The HeRO Score is reported as a fold increase relative to the general NICU population. HeRO HRV data provides a new tool for clinical assessment so that standard diagnostic and therapeutic decisions are better founded. As is customary with good medical practice, the interpretation of any medical test should be made in conjunction with all other available medical history and diagnostic information about a patient. The computational methodology used to determine patient status is described in Appendix A: Theory of Operation. - 21 - TROUBLESHOOTING Troubleshooting For Technical Support, please contact MPSC at 1-800-394-1625. Problem: HeRO ES Solo Window is not visible Description: Solo Window is not shown on the Intellivue MX screen. Cause Resolution iPC window is not visible Change the screen layout on the Intellivue MX patient monitor to one that includes an iPC desktop window. HeRO ES client application is not running Manually start the HeRO ES client application via Philips smart key, XDS LaunchPad, Windows desktop shortcut, or Windows start menu. iPC is not running Manually start the iPC via the Philips menu (Main Setup/Internal PC/Switch PC On). Ensure that the Intellivue MX monitor is configured to automatically start the iPC when the monitor is powered up. (Enter config mode, then select Main Setup/Hardware/Internal PC/Auto Start PC/Enabled.) iPC/XDS configuration error Reconfigure the XDS display settings to restore proper operation of the shared screen. Contact Philips Technical Support if necessary. iPC hardware problem Contact Philips Technical Support - 22 - TROUBLESHOOTING Problem: Comm Error message appears during normal use (not monitor start up) Description: HeRO ES is unable to communicate with the Intellivue MX patient monitor. Problem: Cause Resolution Intellivue and/or iPC are starting up Wait for HeRO ES to initialize communication with the Intellivue (up to 60 seconds) Internal iPC network error Reboot the iPC Configuration error Contact MPSC Technical Support. Hardware problem Contact MPSC Technical Support. No Heart Rate message is displayed. Description: The system is not receiving heart rate data from the Intellivue MX patient monitor. Cause Resolution Patient monitor is not attached to a patient or is not monitoring ECG. None necessary. This is normal behavior. Patient monitor is not able to calculate heart rate. Check ECG lead placement and lead pair selection. HeRO services are not operating Contact MPSC Technical correctly. Support. - 23 - TROUBLESHOOTING Problem: System Comm Error message is displayed during normal use (not monitor start up) Description: The HeRO ES window application is not able to communicate with the services that acquire data and generate HeRO Scores. Problem: Cause Resolution iPC is starting up Wait for HeRO ES to initialize (up to 60 seconds) Internal iPC network error Reboot the iPC Configuration error Contact MPSC Technical Support. Error Processing Data message is displayed Description: An error occurred while assigning heart rate data and HeRO Scores to a patient. Problem: Cause Resolution Internal database error Reboot the iPC. Verify that proper operation is restored. Database corruption Contact MPSC Technical Support. HeRO Failed to Start message is displayed Description: The HeRO data processing services did not start. Cause Resolution Internal iPC network error Reboot the iPC. Configuration error Contact MPSC Technical Support. - 24 - TROUBLESHOOTING Problem: Invalid License message is displayed Description: The software license installed on the iPC has an invalid signature or is otherwise corrupt. Problem: Cause Resolution License file has been tampered with or was otherwise damaged. Contact MPSC Technical Support License Expired message is displayed Description: The software license has expired. Cause Resolution Expired license Contact MPSC Sales or Technical Support - 25 - CUSTOMER SERVICE Customer Service If network problems arise, contact the hospital network administrator or MPSC Technical Support, toll free 1-800-394-1625). Complaints may be reported via telephone or submitted in writing to the following address: MPSC, 2246 Ivy Road, Suite 17, Charlottesville, VA 22903 - 26 - APPENDIX A: THEORY OF OPERATION Appendix A: Theory of Operation HeRO uses sophisticated mathematical modeling techniques to analyze Heart Rate data for characteristic patterns of variability. In order to accomplish this, raw data must be screened and converted into a statistically useful form. Then, significant relationships must be calculated to determine the relative degree of transient decelerations and reduced baseline variability present in the heart rate data. Algorithms for Calculating RRI Parameters Data Packaging Sets of 4096 consecutive RR intervals are recorded, and the start and stop times noted. Each set represents 20 minutes (at a heart rate of 200 beats/min) to 41 minutes (at a heart rate of 100 beats/min). Sets with artifactual intervals are defined as: Lasting more than 45 minutes (heart rate less than 100 beats per minute) 5 consecutive minutes without detecting a heartbeat with valid RR interval values (at which point the RR interval is reset). The data from these sets are not included in the analysis. Data Conditioning Prior to Calculation of HRV The mean RR interval is calculated on the raw data. The RR intervals are filtered by subtracting a (2M+1) point moving average window M 1 RR(n) RR 2 M 1 j = -M (n j ) where n is the index of the RR interval (1 to 4096) and M=100. The standard deviation of the filtered RR intervals is calculated. Then each RR interval is divided by the standard deviation. The result is a set of high-pass filtered, normalized RR intervals with mean ≈ 0 and standard deviation ≈ 1. Mathematical Analysis Histogram Based Parameters From each set of 4096 High-Pass filtered, normalized RR intervals, the 10 th, 25th, 50th, 75th, and 90th percentiles and the first, second, third, and fourth moments are calculated. - 27 - APPENDIX A: THEORY OF OPERATION Sample Asymmetry Analysis One characteristic of transient decelerations is a marked asymmetry of the distribution of RR intervals accompanied by an occurrence of large deviation s, especially to the right of the distribution median. This phenomenon is quantified through Sample Asymmetry analysis. The first step is to construct a quadratic function that will be used for weighting the deviation of each RR interval from a median, computed on a data block containing 4096 beats (approximately 25 minutes of data). The Figure presents a function r(xi)=(xi-m)2, where xi is the magnitude of an RR interval # i and m is the median of the data. The two branches of this parabola quantify deviations towards increase (right half) and decrease (left half) of an RR interval with respect to the median. Given a series of (4,096) RR intervals x1, x2, ... x4096, we compute r1(xi)=r(xi) if xi<m, 0 otherwise; and r2(xi)=r(xi) if xi>m, 0 otherwise for each RR reading xi. Finally the R1 (left asymmetry) and R2 (right asymmetry) are computed as: R1 = 1 4096 4096 r ( x 1 i=1 4096 i ) and R 2 = 1 r2 ( xi ) respectively. 4096 i= 1 In other words, R1 and R2 are nonnegative quantities that increase when the number and/or the magnitude of large deviations from the median increases. Intuitively, a distribution of RR intervals that is skewed to the right will result in R2 > R1. Figure 7. Sample Asymmetry Sample Entropy Sample Entropy is a measure of regularity in time series that is suitable to HRV analysis 2. Sample Entropy (m,r,N) is the negative natural log of the conditional probability that two sequences similar within a tolerance r for m points remain similar at the next point, where N is the total number of points and self-matches are not included. A low value of SampEn is interpreted as showing increased regularity or order in the data. SampEn is very similar to approximate entropy (ApEn) but has reduced bias, especially for short data sets. Sample entropy (SampEn) is calculated with m=3, r=0.2 using filtered, normalized data3. - 28 - APPENDIX A: THEORY OF OPERATION Figure 8. Sample Entropy Mathematical Modeling Logistic Regression Since no single measure will reliably detect all of the abnormal records, multivariable predictive mathematical models are employed. One such model is a logistic regression. The mathematical model uses variables for HRV measures including standard deviation, sample entropy, and asymmetry function analysis. These variables are inserted into a logistic equation of the form: p = e A / (1 + e A) where A = 0 + 1V1+ 2V2 +… nVn and where V1…n represent various measures of heart rate variability. Fold Increase Score The model output score is scaled by a constant to determine the Fold Increase Score. Computing this score is analogous to dividing a particular Logistic Regression score by the average Logistic Regression score seen in t he overall NICU population. Thus, any score less than 1.0 is below average, while any score - 29 - APPENDIX A: THEORY OF OPERATION above 1.0 is above average. The Fold Increase Score is graphed on a scale from 0.0 to 5.0. HeRO Score The HeRO Score is generated by taking the maximum of two Fold Increase scores, each of which is ultimately derived from a Logistic Regression equation with unique coefficients. Each of the sets of coefficients has been developed to address a specific Heart Rate pattern. Combining the outputs of different sets of coefficients yields a more sensitive result then a single set of coefficients can. Please see the section Interpreting Results for a discussion of the relevance of the HRV score. References: 1 Griffin MP, Scollan DF, Moorman JR. The dynamic range of neonatal heart rate variability. J. Cardiovascular Electrophysiology . 1994; 5:112-124. 2,3 Richman JS, Moorman JR. Physiological time-series analysis using approximate entropy and sample entropy. American Journal of Physiology. 2000;278:H2039-2049. - 30 - Appendix B: Glossary Appendix B: Glossary ANOVA: Analysis Of Variance Area under Receiver Operating Characteristics: a plot of sensitivity vs. specificity at a variety of thresholds. A totally random test produces an ROC area of 0.5, while a perfect test produces an ROC area of 1.0 Artifact or artefact: Spurious signal not consistent with the expected results. May be produced by a defective machine, electrical interference, patient movement or loose electrodes. Bradycardia: slow heart beat Cubic spline: a commonly used interpolation technique Cumulative Distribution Function (CDF): the cumulative sum of the histogram of a set of data Demographics: Statistical characteristics of the population (in this case , significant demographics include birth weight, gestational age and post conceptional age) ECG (or EKG)= electrocardiogram: Record of the electrical activity of the heart, showing waves called P, Q, R, S, and T waves. The Q, R, S and T waves are related to contraction of the ventricles Fiduciary point: the single point representing the R-wave in a QRS complex Gestational age: Prenatal age of fetus from conception to birth High-pass filtering: a signal processing technique that removes low-frequency and DC components of a signal Histogram: graph of frequency distribution by means of rectangles whose widths represent class (R-R) intervals and whose areas are proportional to the corresponding frequencies HR: Heart Rate HRV: Heart Rate Variability - 31 - Appendix B: Glossary Kurtosis: The peakedness or flatness of the graph of a frequency distribution (especially with respect to the concentration of values near the mean as compared with the normal distribution) Logistic regression: a regression model that fits binary outputs to the curve represented by e a/(1+ea) Model Output: Results of mathematical equation computed hourly; based on demographic data and/or RRI parameters collected in the preceding 12 hours (ex. Demographic Risk Model, HRV Score) Moment: the expected value of a positive integral power of a random variable Moving average window: A filter that averages a signal over a “window” of time Normalization: Process by which a statistical moment is altered by subtracting the mean and dividing by the standard deviation, so that the Mean = 0 and the SD = 1. P50: 50th percentile data point Post-conceptional age: Current age of neonate, from conception to present Reduced Baseline Variability: epochs of heart rate data in which the trend has "gone flat" or has less variability in the baseline heart rate. This is invariably linked to a decrease in the second moment (standard deviation). ROC: Receiver Operating Characteristic R-R Interval or RRI: Interval between heartbeats RRI Parameter: A statistic computed on an RRI set of 4096 interval (ex. “M1” = mean of RRI RRI Set: 4096 consecutive heartbeats (R-R intervals) SD: Standard Deviation SEM: Standard Error of the Mean Signal processing: The process of breaking down an electrical signal into components that can be analyzed through a variety of algorithms - 32 - Appendix B: Glossary Skewness: Lack of symmetry in a frequency distribution. A symmetrical histogram has a skewness of 0, while a histogram with a tail of values larger than the median has a positive skewness. Transient Deceleration: epochs of heart rate data in which the trend indicates a deceleration of the heart rate, for a period of roughly 30-100 heart beats (transient period), followed by an acceleration. These patterns are reflected by a decrease in Sample Entropy. - 33 -