1
AN1979
APPLICATION NOTE
How to read a Super10 Trace
1 - INTRODUCTION
The emulation using a bond-out chip is one of the possibilities to debug efficiently an application. Generally, a Super10 emulator uses two boards. The first one contains the bondout controller, adapter connections and support logic. The second board contains an optional trace memory with triggers. In order to
optimize the execution speed of the code, the user will work with the trace of the emulator.
The purpose of this application note is to give to the user all the keys to read and interpret the information
shown in a Super10 Bondout trace and especially the timestamps. Thanks to trace examples, the reader
will get advice and guidelines to check the execution timing of his code.
Rev. 1
AN1979/0604
1/22
AN1979 - APPLICATION NOTE
TABLE OF CONTENTS
PAGE
1
INTRODUCTION ........................................................................................................
1
2
SUPER10 BONDOUT TRACE WINDOW ..................................................................
3
2.1
GENERAL FEATURES ...............................................................................................
3
2.2
TRACE WINDOW OPTIONS ......................................................................................
3
2.3
ANALYSIS OF A TRACE WINDOW CONTENT .........................................................
4
3
TRACE CONTENT EXAMPLES ................................................................................
5
3.1
TRACE INTERPRETATIONS FOR BRANCH INSTRUCTIONS .................................
5
3.1.1
3.1.2
Trace of a Mispredicted Jump and a "Zero-cycle" Jump ............................................
Trace of a "Zero_cycle" Mispredicted Jump ...............................................................
5
6
3.2
TRACE INTERPRETATIONS FOR READ/WRITE ACCESSES IN SP10 MEMORIES
7
3.2.1
3.2.2
3.2.3
3.2.4
3.2.5
3.2.6
Write and Read Accesses in Internal Data Memory ...................................................
Read accesses in internal Program Memory ..............................................................
Operand Read Access in Standard External Memory ................................................
Operand write access in standard external memory ..................................................
Operand Accesses in External IO Space ...................................................................
Dual Port RAM dependencies with the MAC instructions ...........................................
7
8
9
10
11
12
3.3
TRACE INTERPRETATIONS OF AN INTERRUPT SERVICE ROUTINE ..................
13
3.3.1
3.3.2
Trace of a Switch Context Instruction .........................................................................
Trace of a Return from Interrupt (RETI) Instruction ....................................................
13
14
3.4
TRACE INTERPRETATIONS IN CASE OF REGISTER DEPENDENCIES ...............
15
3.4.1
3.4.2
3.4.3
3.4.4
3.4.5
General Purpose Register Dependencies ..................................................................
Multiply and Divide Unit ..............................................................................................
Accesses to CPU-SFRs .............................................................................................
Arithmetic Instructions and the "reg, mem" Addressing Mode ....................................
Impact of the Peripheral Frequency ...........................................................................
15
16
16
18
18
3.5
TRACE INTERPRETATION OF A CODE EXECUTED FROM EXTERNAL MEMORY
19
4
CONCLUSION ...........................................................................................................
21
5
REFERENCES ...........................................................................................................
21
6
APPENDIX .................................................................................................................
21
2/22
AN1979 - APPLICATION NOTE
2 - SUPER10 BONDOUT TRACE WINDOW
2.1 - General Features
The trace board contains hardware and firmware for the trace memory, triggers, hardware break points,
performance analysis, code coverage, external triggers (in and out) and general-purpose user output
connectors. It contains also its own housekeeping microcontroller, so the trace functions can be operated
without stealing cycles from the emulation controller.
For further information on how to setup the trace, please refer to [1] Nohau Super10 In-Circuit Emulator
Getting Starting manual.
Each time a Super10 instruction reaches the Write Back stage of the execution pipeline, information is
output on the trace buses. This information is called a Frame. Generally, a Super10 instruction is composed of one valid frame. However, some specific instructions generate several valid frames.
The trace board provides up to 128K frames of data. The trace qualifier signals are used to record the
frames and the current value of the timestamp counter. Those information are stored in a trace memory.
Once the recording is finished, they are analyzed and each frame with its corresponding timestamp is displayed on the trace window.
The user can configure the trace window by enabling or disabling trace options.
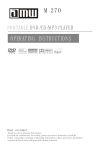
2.2 - Trace Window Options
The trace window can display many types of information about bus cycles. The user can add additional
columns by right clicking in the trace window and selecting them. The figure 1, below, represents a
Super10 trace window.
Figure 1 : Super10 Trace window
At the top of the trace window, the header contains the names of the trace buffer fields. Those fields vary
depending on your emulator system. The most common fields are:
– Frame: displays the trace frame number that normally records memory references,
– Address: address of the executed instruction (also called memory reference),
– Data: the data transferred from the memory reference (i.e. the instruction opcode). For further details on
the instruction’s opcode, refer to [2] Super10 Instruction Set Reference Guide Release1.1,
– Instruction: disassembled instruction,
– Symbol: symbolic information. For instance, function names associated with the memory reference.
Additional trace information can be displayed:
– Time Stamp: this option displays a time stamp showing the absolute or relative time of each frame since
or before the Zero Time frame in the Trace window. The relative time stamp displays the relative delay
between individual bus cycles and can be useful to check the execution time of each instruction. The
absolute time stamp is more dedicated to the calculation of the total execution time of a routine or function. The user can choose to display the absolute and relative time either in CPU cycles or in time.
– Miscellaneous Data: when this field is selected, it displays a 40 bits value (shown as a hex byte and
two hex words) for each record. The far left byte corresponds to the eight external input bits from the
DB15 connector. (Refer to the manual for micro-clip to bit correspondence). The right word is for Nohau
Technical Support only.
3/22
AN1979 - APPLICATION NOTE
– Destination: this option displays the address of the destination operand (for instance, the address of
R1 register in the SUB R1, R12 instruction).
– Source: displays the address of the source operand (for instance, the address of R12 register in the
SUB R1, R12 instruction).
– Value: this option displays the result of an instruction (for instance, the value of R1 register after carrying
out SUB R1,R12 instruction). In case of a Super10 MAC instruction, the Value field is encoded on 48
bits and represents the MAC accumulator, the extension part and the MAC status bits.
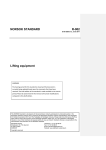
The figure, below, represents how those information are displayed in the trace window.
Figure 2 : Super10 Trace window with additional information
Thanks to those trace options, labels, registers and addressing modes are all displayed. The Super10
trace window has also the ability to display the C source code with the resulting assembly code (this is
named the "Mixed mode").
2.3 - Analysis of a Trace Window Content
The figures 1 and 2 represent the trace of a code executed from the internal Program Memory (size up to
4 Mbytes started from the address C0’0000h, fastest memory to execute code). Indeed, we can see that
the three frames are executed from addresses C0’0206h, C0’0208h and C0’020Ah.
The three instructions are single word instructions (the addresses are increased by two and the "Data"
field shows the instruction opcodes encoded on 16 bits). The time stamps are displayed in relative mode.
We can see that each instruction is executed in 1 CPU cycle.
Lets’ have a look to the frame number -21: "SUB R1, R12". For such an instruction (SUB Rwn, Rwm), the
associated opcode is: 20nm. Refer to [2] Super10 Instruction Set Reference Guide Release1.1. In our
case, the opcode will be "201C". This value is displayed in the "Data" column.
The value "FD4A" in the "Value" column represents the content of R1 register after the subtraction operation. The "Source" column contains the address of the source operand (address of R12 register) and the
"Destination" column contains the address of the destination operand (address of R1 register).
The last information displayed in the "Symbol" column means that the "SUB R1, R12" instruction is the
first instruction of the routine named "Init_Timer".
4/22
AN1979 - APPLICATION NOTE
3 - TRACE CONTENT EXAMPLES
The purpose of this section is to show some trace examples and explain how to read the trace time stamp
in those cases. We will focus only on particular code with particular pipeline/memory effects (that can be
present in customer’s application) and see how the time stamps are displayed on the trace window.
3.1 - Trace Interpretations for Branch Instructions
The Super10 provides a Branch Detection unit and a Prediction Logic unit that pre-process instructions
and classifies the detected branches. Through pre-processing of branch instructions, the instruction flow
can be predicted. A correctly predicted instruction flow is executed like linear code. In case of misprediction, it usually takes 4 to 5 CPU cycles of penalty. For further details on the branch prediction mechanism
and penalty, refer to [4] AN 1549 "Optimizing code for Super10".
3.1.1 - Trace of a Mispredicted Jump and a "Zero-cycle" Jump
A jump instruction on bit condition is predicted "taken" if the branch is a backward branch. Forward
branches are always predicted "not taken". In case of wrong prediction, the pipeline is cancelled and the
CPU needs to fetch the correct instructions. The maximum penalty is equal to 5 CPU cycles.
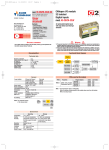
The upper part of the trace, below, shows the execution of a code in which a mispredicted JNB instruction
(jump if bit clear) is executed.
Figure 3 : "Zero-cycle" jump and mispredicted jump trace
The code is executed from the internal Program Memory (refer to the "Address" column). The instruction
"JNB R2.0, loop1" means that if the bit "0" of R2 register is cleared (contains the value "0"), the program
will branch to the label named "loop1", otherwise the program execution will continue in the linear order.
By analyzing the trace content, we can determine if the branch instruction has been executed and correctly predicted.
First, the "Address" column gives us the information if the code execution is linear or not. Indeed, the JNB
instruction is fetched from the address "C0’039Eh" and the following executed instruction has been
fetched from the address "C0’03ACh" (this is not a consecutive address). Moreover, the "Symbol" column
shows that the frame -10 is the first instruction of the label "loop1". This means that the branch to the label
"loop1" has been performed.
To check the prediction, we need to refer to the jump instruction and to the time stamp. According to the
prediction rule of the JNB instruction, the "JNB R2.0, loop1" branch is predicted "not taken" (it is a forward
jump). As the branch to "loop1" has been performed, the prediction was wrong. This is confirmed by the
time stamp: the JNB is executed in 1 CPU cycle and the "MOV R2, #F90Ah" is executed in 6 CPU cycles.
Normally, the MOV instruction should be executed in 1 CPU cycle (instruction fetched from internal Program Memory and operands located in internal memory). The additional 5 CPU cycles represent the penalty of the misprediction (which means that the pipeline is stall for 5 CPU cycles).
5/22
AN1979 - APPLICATION NOTE
In case of misprediction, the penalty is seen on the instruction following the branch.
The lower part of the figure 3 shows how a "zero-cycle" correctly predicted jump is traced. Only the relative jump (JMPR), absolute jump (JMPA) and inter-segment jump (JMPS) can be executed in zero-cycle.
In such a case, the jump instruction is executed in parallel with the previous instruction (except if this previous instruction is also a branch instruction). This is why there is no frame number associated to the
zero-cycle jump and only few information are provided by the trace.
The trace window displays only the address from which is fetched the zero-cycle jump (in our example,
"C0’03B8h") and the information: "0-Cycle JMPR". The user has to refer to the source code to get the
complete instruction. Nevertheless, we know that the jump was a backward jump (the address of the
instruction following the "zero-cycle" jump on the trace is "C0’0380h") and the branch has been performed to the label "loop2" (refer to the "symbol" column). A relative jump instruction is predicted "taken"
if it is an unconditional jump or if it is a backward jump. In the example, the JMPR is predicted "taken" and
the prediction is correct (this can be also checked on the timestamp of the next instruction where we can
see no penalty due to a wrong prediction).
In a Super10 bondout trace, a branch instruction executed in zero CPU cycle is always displayed
as "0-Cycle Branch".
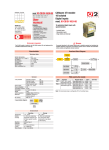
3.1.2 - Trace of a "Zero_cycle" Mispredicted Jump
In case of a misprediction on a "zero-cycle" jump, a maximum penalty of 5 CPU cycles is seen on the
trace. Let’s have a look to the figure 4 below:
Figure 4 : "zero-cycle" mispredicted jump
The branch to the label "loop5" will be performed if the code condition is true. In the source code, the
branch instruction is: "JMPR cc_EQ, loop5". This jump instruction is predicted "not taken" (it is a conditional forward jump: refer to the "Address" column, addresses "C0’03A6h" and "C0’03B8h"). On the trace
above, the "symbol" column informs the user that the branch has been performed. Indeed, the SUB
instruction is associated to the label "loop5". This branch has been predicted "not taken" but has been
taken, so the prediction is wrong.
Even if the "zero-cycle" jump is mispredicted, it is executed in 0 CPU cycle. The consequence of the
misprediction is that the CPU has to cancel the already fetched instructions and restart a new fetch
sequence (in order to fetch the right target code). As a consequence, the trace will display the "0-Cycle
JMPR" information and the penalty of the misprediction will be seen on the next instruction. In the figure
4, the SUB instruction is executed in 6 CPU cycles: 5 CPU cycles of penalty and 1 CPU cycle for the execution of the SUB itself.
When a "zero-cycle" jump is mispredicted, the trace shows the "0-Cycle Branch" information and
the penalty of the misprediction is seen on the instruction following the branch.
6/22
AN1979 - APPLICATION NOTE
3.2 - Trace Interpretations for Read/write Accesses in SP10 Memories
3.2.1 - Write and Read Accesses in Internal Data Memory
Sometimes, the Super10 instructions are executed in more CPU cycles than in theory. One reason can
be a contention in the access of the memory. In the example below, we assume that the variable "var4" is
located in internal Data Memory (at the address 00’C004h; refer to the "Source" and "Destination" fields
in the trace). A write access immediately followed by a read access at the same address will create a
dependency in the pipeline.
The figure 5 shows the trace content when this kind of dependency occurs.
Figure 5 : Write access in data memory followed by a read access at the same address
The code is executed from the internal Program Memory (refer to the "Address" column). The instruction
"MOV var4, R2" performs a write access in the internal Data Memory. The next instruction "ADD R5,
var4" will need the last updated value of "var4". Let’s have a look to the pipeline content in such a case:
Cycle
(T1)
(T2)
(T3)
(T4)
(T5)
DECODE
In+2
In+2
In+2
In+2
In+2
ADDRESS In+1= ADD R5,var4
In+1= ADD R5,var4 In+1= ADD R5,var4 In+1= ADD R5,var4 In+1= ADD R5,var4
MEMORY
In = MOV var4, R2
EXECUTE
In-1
In = MOV var4, R2
WRITE
BACK
In-2
In-1
W. B.
BUFFER
(T6)
In+1= ADD R5,var4
In = MOV var4, R2
In = MOV var4, R2
When the MOV instruction reaches the Memory stage and the ADD instruction enters the Address stage,
the CPU detects that the same operand "var4" is used in both instructions. As a result, the ADD instruction is automatically put on hold at the Address stage until the previous write operation is completely executed (which means leaves the Write Back Buffer stage where the "var4" value is updated in the internal
Data Memory). At the time T5, the internal Data Memory is again available. This new value of "var4" can
be used, now, by the ADD instruction.
We can see that the ADD instruction will reach the Write Back stages 4 CPU cycles after the previous
instruction. One more CPU cycle is needed to execute the ADD instruction.
On the trace, we will see the "ADD R5, var4" instruction executed in 5 CPU cycles (4 cycles for the memory dependency and 1 cycle for the instruction itself).
7/22
AN1979 - APPLICATION NOTE
Other dependencies can occur if the program performs several write and read accesses in the internal
Data Memory. Let’s have a look to the trace below:
Figure 6 : Write and read accesses in internal Data Memory
The code is executed from the internal Program Memory. The operands "var4" and "var5" are both
located in internal Data Memory. The "Destination" field gives us the exact address in the Data Memory:
C004h for "var4" and C006h for "var5".
The "MOV R10, var4" instruction is executed in more than 1 CPU cycle. As for the previous example, this
is due to a contention on the internal Data Memory. Here, the penalty is smaller because of the ADD and
ADDC instructions in between the write and the read accesses on "var4" variable. The pipeline is stalled
for 2 CPU cycles (the 2 other cycles are hidden by the ADD and ADDC instructions). As a result, the
"MOV R10, var4" instruction is executed in 3 CPU cycles (2 CPU cycles of penalty plus 1 CPU cycle for
the instruction itself).
The first MOV and ADD instructions are executed in 1 CPU cycle each. Generally, there is no cycle loss
if three consecutive instructions perform write accesses in the internal Data Memory. Indeed, those
instructions will enter the Write Back Buffer (with its three entries) and the corresponding memory
addresses will be updated when the Data Memory will be available again.
When reading a Super10 Bondout trace, always take care to the location of the data accessed and
the possible memory contentions.
3.2.2 - Read accesses in internal Program Memory
Even if the internal Program Memory represents the fastest way to execute code, there will be no benefit
to store data in this memory. Indeed, each read access will take 3 CPU cycles.
The figure 7, below, shows the trace window when operands are accessed in internal Program Memory.
Figure 7 : Read access in the internal Program Memory
Here, the program is executed from the internal Program Memory (refer to the "Address" column). In this
trace, the highlight frame is: "MOV R3, 6006h". The value "6006h" represents the 16-bit address of the
source operand. As the instruction is a disassembly instruction, the user can refer to the source code to
see the name of the corresponding variable. The complete address is given in the "Source" column:
C0’6006h. This data is located in the internal Program Memory area. This instruction is executed in 4
CPU cycles: 3 CPU cycles are needed to access the data (the instruction is stalled in the pipeline until the
Program Memory send back the value) and 1 CPU cycle is for the MOV instruction itself. During this
instruction, the value "100h" has been moved from the address C0’6006h in Program Memory to the register R5.
In case of write access in the Program Memory, there is usually no cycle loss on the first write access
(they are hidden by the program fetch flow) but consecutive write accesses must be avoided (otherwise
the penalty will be seen on the following write accesses).
8/22
AN1979 - APPLICATION NOTE
3.2.3 - Operand Read Access in Standard External Memory
The Super10 standard external memory space is accessed via the EBC. Each time an operand is fetched
from the standard external area, the access time will depend on the configuration of the External Bus. The
trace, below, shows the execution of three consecutive read accesses in standard external memory.
Figure 8 : Consecutive read accesses in standard external memory space
The code is fetched from the internal Program Memory (refer to the "Address" column). The instructions
seen on the trace window are the disassembled instructions. The corresponding code written in assembly
language is:
MOV R2, ext1
MOV R3, ext2
MOV R4, ext3
The data "ext1", "ext2" and "ext3" are stored in standard external memory at the respective addresses:
"1F’0000h", "1F’0002h" and "1F’0004h". A DPP register (for instance, DPP1) has been assigned to the
corresponding data page number: 124 (or 007Ch in hexadecimal format). In the disassembled instructions, the name of the data has been replaced by the compiler with its 16-bit address (named "mem" operand). Refer to [2] Super10 Instruction Set Reference Guide Release1.1. In the first MOV instruction, the
operand "ext1" has been replaced by its 16-bit address: "4000h". The two upper bits represent the DPP
register in use (here, "01" selects the DPP1 register). The physical address of the operand is the result of
the concatenation between the DPP1 register’s content on ten bits (here, "00 0111 1100h") and the fourteen lowest bits of the 16-bit address. The result is "1F’0000h" for the operand "ext1". This value is given
by the "Source" column.
In this application, a configuration for the external bus has been selected. The register TCONCSx contains the value: "0100h" which means:
- phase A: 0 cycle
- phase B: 1 cycle
- phase C: 0 cycle
- phase D: 0 cycle
- phase E: 5 cycles
- phase F read: 0 cycle
When an instruction has to access an operand in standard external memory, the following actions are
taken. First, the request of the external operand is sent to the Data Management Unit (DMU) once the
instruction enters the Address stage of the pipeline (1 CPU clock cycle). Then, the request is sent to the
External Bus Controller block (1 CPU clock cycle) and the external memory is accessed. The minimum
duration of an external access is 2 CPU clock cycles (1 cycle for the phase B and 1 cycle for the phase E).
In total, 4 CPU cycles are needed (at least) to access the data, which is available when the instruction
enters the Memory stage of the pipeline. In general, a read access to an operand located in standard
external memory will take 4 CPU cycles plus the number of programmed wait states.
In the example, the number of programmed wait states is equal to 4. As a consequence, the duration of a
read access will take 8 CPU cycles.
In the trace window, the first MOV instruction (frame -27) is executed in 8 CPU cycles. The next instructions (frame -26 and -25) perform also a read access in the standard external area. Those instructions are
seen executed in 6 CPU cycles (so faster than the first instruction). The reason is that a part of the penalty
is hidden by the previous read access in the standard external area: the EBC has already received from
the DMU the second read request before the first read access is "finished" (from a CPU point of view only,
the EBC being free).
9/22
AN1979 - APPLICATION NOTE
Each time an application performs several consecutive read accesses in the standard external
memory space, a part of the latency is hidden by the previous external read access.
If the application performs several write accesses in the standard external area, the latency is not seen on
the first access. One latency cycle will be seen on the second write (if consecutive) and the full latency will
be seen on the following consecutive writes. A trace window’s content in such an application is described
in the following section.
3.2.4 - Operand write access in standard external memory
The figure 9, below, represents the trace window’s content when consecutive instructions perform write
accesses in the external memory.
Figure 9 : Consecutive write accesses in a standard external memory
The code is executed from the internal Program memory (refer to the "Address" column). The corresponding source code is the following:
MOV ext2, R3
MOV ext3, R4
MOV ext4, R5
The data "ext2", "ext3" and "ext4" are located in standard external memory at the addresses: "1F’0002h",
"1F’0004h" and "1F’0006h". A DPP register (DPP1 in this example) points to the data page number 124
(or 007Ch in hexadecimal format). The external memory, mapped in this area, has the same settings as
in the previous example:
- phase A: 0 cycle
- phase B: 1 cycle
- phase C: 0 cycle
- phase D: 0 cycle
- phase E: 5 cycles
- phase F write: 0 cycle
As it is described in the previous section, the first write external access is executed in 1 CPU cycle (refer
to the "relative cycle" column). The second write external access (consecutive) is executed in 2 CPU
cycles (1 latency cycle) and the third consecutive write external access is executed in 6 CPU cycles. This
last write operation is stalled for the remaining number of cycles needed to complete the first one.
If several consecutive write accesses in external memory are performed, the full external latency
is seen on the third and the following write accesses.
10/22
AN1979 - APPLICATION NOTE
3.2.5 - Operand Accesses in External IO Space
The external IO space of the Super10 is seen as external memory, accessed by the EBC, in which the
write access has the priority over a read access.
The trace, below, shows a data write access followed by a data read access in the external IO space.
Figure 10 : Write data access followed by a read data access in the external IO space
The code is fetched from the internal Program Memory (refer to the "Address" column). The disassembled instructions, shown on the trace, correspond to the following code:
MOV io1, R4
MOV R2, io2
The data "io1" and "io2" are stored in external IO memory at the respective addresses: "20’0000h" and
"20’0002h". A DPP register (in the example, DPP2) has been assigned to the corresponding data page
number: 128 (or 0080h in hexadecimal format). In the disassembled instructions, the name of the data
has been replaced by the compiler with its 16-bit address. In the first MOV instruction, the operand "io1"
has been replaced by the value "8000h". The two upper bits represent the DPP register in use (here, "10"
selects the DPP2 register). The physical address of the operand is the result of the concatenation
between the DPP2 register’s content on ten bits (here, "00 1000 0000h") and the fourteen lowest bits of
the 16-bit address. The result is "20’0000h" for the operand "io1". This value is given by the "Destination"
column.
The external IO area is accessed by the external bus with the following settings:
- phase A: 0 cycle
- phase B: 1 cycle
- phase C: 0 cycle
- phase D: 0 cycle
- phase E: 5 cycles
- phase F write and phase F read: 0 cycle
With such a configuration the number of programmed wait states is equal to 4.
Generally, in case of an operand write access in the external I/O space, the latency is not seen on the first
write (hidden by the execution flow). In case of an operand read access, the latency is equal to 6 plus the
number of programmed wait states. In our case, an operand read access will take 10 CPU cycles.
The external IO space has the following special properties:
– The accesses are not buffered and cached. The write back buffers and caches of the Super10 are not
used to store I/O read and write accesses.
– Special handling of destructive reads: the pipeline of the Super10 allows speculative reads. Memory locations of the I/O area are not read until all the speculations are solved. The destructive read accesses
are delayed.
– Write before read execution. Because of the pipeline length of the Super10, a read instruction is able to
read a memory location before the preceding write instruction has executed its write access. Data forwarding ensures the correct instruction flow execution. In case of an I/O read access, the read access
will be delayed until all I/O writes pending in the pipeline are executed. Write accesses must be really
executed before the next read access can be initiated.
11/22
AN1979 - APPLICATION NOTE
In the figure 10, above, the frame -13 performs an operand write access in external I/O area (address
200000h). The frame -12 performs an operand read access in external I/O area (address 200002h).
The read access will be delayed until the preceding write instruction has performed its write access. In the
trace, the first write access is seen executed in 1 CPU cycle (refer the "Relative Cycle" column). The consecutive read access is executed in 17 CPU cycles. In those 17 CPU cycles, 10 cycles are associated to
the operand read access operation, the other 7 cycles correspond to the latency generated by the preceding write access.
Even if the written operand and the read operand are not located at the same address is the external IO area, it is strongly recommended to avoid a write access immediately followed by a read
access in the external IO space. Otherwise, the read operand access will be automatically delayed
until the preceding write instruction has performed its write access.
3.2.6 - Dual Port RAM dependencies with the MAC instructions
The MAC instructions are the only ones able to read two memory operands per cycle. Depending on the
location of the MAC operands, the MAC instructions can be executed in more than 1 CPU cycle. Let’s
have a look to the figure 11 below:
Figure 11 : DPRAM dependencies with MAC instruction
The code is executed from the internal Program Memory. In this trace, the "dat1" operand is located in the
Dual Port RAM memory at the address "FD00h" (refer to the "Destination" column). The two operands of
the CoMAC instruction also point to an address in the DPRAM: IDX1 points at the address "F801h" and
the register R9 points at the address "F802h".
When this sequence is executed, there will be a conflict in the pipeline: indeed, in the same CPU cycle,
there will be three attempted access to the DPRAM. As a consequence, the CoMAC instruction will be
held in the Memory stage of the pipeline for two CPU cycles instead of one (during this second CPU
cycle, the ADD instruction is completely executed and the DPRAM is available for the two read accesses
of the CoMAC instruction).
On the trace, we can see that the "ADD dat1, R4" instruction is executed in 1 CPU cycle and the CoMAC
instruction is executed in 2 CPU cycles.
When a MAC instruction is executed in more than 1 CPU cycle, check that the location of the operands do not generate memory dependency. We recommend to have one operand located in internal DPRAM memory and the other one located in internal Data memory.
12/22
AN1979 - APPLICATION NOTE
3.3 - Trace interpretations of an interrupt service routine
3.3.1 - Trace of a Switch Context Instruction
Generally, at the beginning of an interrupt service routine, a switch context instruction is performed on the
register CP to modify the location of the global GPR bank. This is done via a SCXT assembly instruction.
The figure 12 below represents the trace content when a SCXT instruction on the CP register is executed
from the internal Program Memory:
Figure 12 : Trace content in case of switch context CP execution
The SCXT instruction is displayed in the trace window with two frames. On the trace above, the frames
-52 and -51 are both associated to the SCXT instruction. Indeed, the fetch address is the same:
"C0’0292h" and the "data" column displays the opcode "C60800F8" and "08C6": the last one is the high
byte of the SCXT opcode in which the upper part and lower part have been inverted. Each frame is displayed with a time stamp of 1 CPU cycle. This means that the SCXT instruction is executed in 2 CPU
cycles.
A switch context instruction (SCXT op1, op2) will automatically push the destination operand op1 in the
System Stack and update this operand with a new value op2 (the source operand). In the trace above, the
"SCXT FE10h, #F800h" means that the switch context is performed on the CP register (located at the
address "FE10h"). The address "F800h" represents the new base address of the global GPR bank.
The first frame (-52) represents the push operation on the System Stack. Indeed, the source address is
"FE10h" (CP register address) and the destination address is "9FF6h" which is the current address of the
System Stack pointer. The "Value" field represent the content of the CP before the switch context operation. The second frame (-51) represents the update of the CP register with the new value (the destination
address is the one of the CP register and the value moved is "F800h").
13/22
AN1979 - APPLICATION NOTE
After the update of the CP register, a state machine starts to store the old content of the global bank
("store phase") and load the new one ("load phase"). This will take 24 CPU cycles. In the trace window,
this penalty is seen with the instruction following the switch context. In the trace above, the frames -50 to
-43 represent the store phase and the frames -42 to -35 represent the load phase (refer to the "Source"
and "Destination" fields). The fetch address is "C0’0296h", which is the fetch address of the instruction
following the SCXT. The frames -34 to -32 belong also to the penalty part of the switch context. In total, 24
CPU cycles are needed to update the global GPR bank. The last frame displayed (-31) correspond to the
instruction "MOV R4, #0h" executed after the switch context. The total execution time of this instruction is
equal to 25 CPU cycles (24 cycles of switch context penalty and 1 cycle for the MOV).
The mechanism and the trace content will be the same for the execution of the "POP CP" instruction at
the end of the routine: the POP is seen executed in 1 CPU cycle and 24 cycles of penalty will be seen on
the next instruction.
A switch context on the CP register will be displayed, in the trace window, on two frames. The
penalty of the switch context operation is seen on the next instruction.
3.3.2 - Trace of a Return from Interrupt (RETI) Instruction
In an interrupt service routine, the last assembly instruction to be executed is the RETI. On a trace window, this instruction will be represented by several frames. Let’s have a look to the trace below:
Figure 13 : Trace window content for the execution of a RETI instruction
This trace shows the execution of an interrupt service routine. The C source code and the assembly code
generated are both displayed. The frames -5 to -1 represent the RETI instruction because of the identical
fetch address: "C0’02F4h". The "Data" field contains the opcode of the RETI instruction: "FB88h". This
value is inverted in the subsequent frames. The "Source" field contains the values "9FF8h and "9FFAh"
which are the addresses of the System Stack pointer. Indeed, on a RETI instruction, two words or three
words are automatically popped from the System Stack (depending if the code segmentation is enabled
or not). In the trace above, the first two frames represent the two POP operations in the System Stack.
During the three other frames, the CPU is prepared to go back to the interrupted program (frame 0 "MOV
DummyVar, R12"). In total, the RETI instruction is seen executed in 5 CPU cycles.
On a Super10 trace, the RETI instruction execution is displayed with 5 frames. The total execution
time is the sum of each relative cycle of the frames.
14/22
AN1979 - APPLICATION NOTE
3.4 - Trace Interpretations in Case of Register Dependencies
3.4.1 - General Purpose Register Dependencies
When a General Purpose Register (GPR) is updated in the Arithmetic and Logic Unit and then directly
used in one of the following instruction as an address pointer, the pipeline is stalled. This conflict is shown
in the trace below.
Figure 14 : Trace window in case of GPR dependency
Those instructions are executed from the internal Program memory. The frame -2 performs a write
access to the register R5. The address of the R5 register is available in the "Destination" column
("F60Ah"). The value moved in R5 is: "F600h" (refer to the "Value" column).
The following instruction (frame -1) uses the register R5 as an address pointer. During this operation, the
value located at the address "F600h" (R5 content) will be moved to the register R4. The address of the
source operand (R5 register) is "F600h" (refer to the "Source" column). The value stored at this address
is "C02Ah" (refer to the "Value" field). The address of the destination operand (R4 register) is "F608h"
(refer to the "Destination" column). Once this instruction is executed, the R4 register will point at the
address "C02Ah". The trace window shows that this instruction is executed in 3 CPU cycles (instead of 1
cycle normally). Let’s have a look to the pipeline’s content when those instructions are executed.
DECODE
ADDRESS
(T1)
(T2)
(T3)
(T4)
(T5)
(T6)
In+1= MOV R4,[R5]
In+2
In+2
In+2
In+3
In+4
In+2
In+3
In+1=
MOV R4,[R5]
In+2
In =
In+1=
In+1=
In+1=
MOV R5, #F600h
MOV R4,[R5]
MOV R4,[R5]
MOV R4,[R5]
MEMORY
In-1
In =
MOV R5, #F600h
EXECUTE
In-2
In-1
WRITE
BACK
In-3
In-2
In =
In+1=
MOV R5, #F600h
MOV R4,[R5]
In-1
In =
MOV R5, #F600h
At the Decode stage (T1), the register file is accessed to read the R5 register used in indirect addressing
mode. As the instruction In (that modifies the R5 register) is already in the Address stage, a conflict is
detected. The value of R5, returned while the instruction In+1 is in the Decode stage, is a wrong one. The
instruction In will be processed normally while the instruction In+1 is stalled at the Address stage (waiting
for the updated value of R5). The value of R5 will be updated at the Execute stage (time T3). During the
T4 time, the new value of R5 is available at the Address stage of the pipeline and the two operand
addresses of the instruction In+1 are calculated. In total, the pipeline is stalled for 2 CPU cycles. One
more cycle is needed to execute the In+1 instruction. As a result, the In+1 instruction will leave the Write
Back stage 3 CPU cycles after the previous instruction.
The reason why an instruction, using a GPR in indirect addressing mode, is executed in more
cycles than in theory is generally a dependency on this register (check if the previous instructions perform a write access to this GPR).
15/22
AN1979 - APPLICATION NOTE
3.4.2 - Multiply and Divide Unit
The division operation of the Super10 requires 4 CPU cycles to be executed. Actually, 4 cycles are executed in the pipeline and 17 cycles are executed in the background. At the end of the first four cycles, the
PSW flags are available (so any action depending on those flags can be taken right away). However, if an
instruction tries to use the unit while a division is still running, the execution of this instruction is stalled
until the division is finished.
The figure 15, below, represents the trace window’s content when this stall occurs.
Figure 15 : Trace window in case of conflict on the Multiply and Divide unit
The code is executed from the internal Program memory. The four frames from -62 to -59 belong to the
same instruction: "DIV R4". Indeed, the "Address" column contains the same fetch address and the
"Data" column contains the same opcode for each of the four frames. The first frame is the only one to
provide the address of the destination operand ("F608h", address of R4 register in this trace). The total
execution time of the DIV instruction is the sum of the CPU cycles associated to each of the four frames,
which is 4 CPU cycles. After those 4 CPU cycles, the DIV instruction has left the pipeline and the operation continues in the background.
The following instruction "MOV R4, MDL" performs a read access to the register MDL (stored at the
address FE0Eh). To be executed, this instruction has to wait the end of the division execution. This will
take 17 CPU cycles. This latency will be seen on the "MOV R4, MDL" instruction. One more cycle corresponds to the execution of the MOV instruction. In total, the "MOV R4, MDL" is seen, on the trace, executed in 18 CPU cycles.
The DIV instruction is displayed on the trace with four frames. The execution time is the sum of
the CPU cycles needed to execute each frame. If an instruction using the MDL as an operand is
following the DIV one, the penalty of the stall process (17 CPU cycles) will be seen on this instruction.
3.4.3 - Accesses to CPU-SFRs
The Super10 provides several CPU-SFR registers that control the CPU functionality and behavior. They
are classified in three classes. For further details on the CPU-SFR classes and their impact on the code
execution, refer to [3] Super10 M340 User’s Manual V1.1.
Let’s have a look to the second class of the CPU-SFRs. They are called the result registers and they are
updated late in the execution stage of the pipeline. For instance, this is the case of the Multiply and Divide
Unit result registers (MDL and MDH). The trace, below, represents the execution of a code in which there
is a register dependency.
Figure 16 : Trace window of a CPU-SFR class 2 dependency
16/22
AN1979 - APPLICATION NOTE
This code is executed from the internal Program memory (refer to the "Address" field). The multiplication
(frame -4) is executed in 1 CPU cycle. The next instruction (frame -3) performs an access to the MDL register (address "FE0Eh"). This instruction should be executed in 1 CPU cycle in such a configuration.
When the MUL instruction enters the Execution stage of the pipeline, the "MOV R1, MDL" enters the
Memory stage. As the MDL register is updated late at the Execution stage of the pipeline, there will be a
latency of 1 CPU cycle before having the updated value of MDL available by the MOV instruction. This is
the reason why the MOV instruction is executed in 2 CPU cycles.
If an access to a CPU-SFR result register is executed in more cycles than in theory, check if the
previous instruction modifies the register’s content.
The CPU-SFRs of the third class can affect either the whole pipeline (also called "class 3-1" with, for
instance, the PSW register) or the Decode, Address and Memory stages of the pipeline (also called "class
3-2" with, for example, an index register of the MAC unit: IDX1). The figure 17, below, represents the
trace’s content when the PSW register is explicitly modified.
Figure 17 : Trace window where the PSW is explicitly modified
The code is executed from the internal Program memory. The instruction "MOV PSW, #0h" performs an
explicit write access to the PSW register ("FF10h" is the 16-bit address of the register). Each time this
register is explicitly modified, the whole pipeline is cancelled and the instruction flow is restarted. This
implies a minimum latency of 5 CPU cycles. It means that the next instruction will be presented in the
Write Back stage of the pipeline after a minimum delay of 5 CPU cycles. In the trace window, the frame -3
("MOV R2, #FFh") is seen executed in 6 CPU cycles: 5 CPU cycles of latency (because of the explicit
modification of PSW just before) and 1 CPU cycle to execute the move instruction.
The figure 18, below, shows the trace’s content when the IDX1 register is explicitly modified. If the IDX
registers are not modified by a POP instruction or by an instruction using the "reg, #data16" addressing
mode, the pipeline is cancelled and the instruction flow must be restarted (so the pipeline behavior is
identical to the class 3-1). Otherwise, a special mechanism is implemented to improve the performances.
For further details on this mechanism, refer to [3] Super10 M340 User’s Manual V1.1.
Figure 18 : Trace window where the IDX1 register is explicitly modified
In this figure, IDX1 register is explicitly modified using the "reg, #data16" addressing mode (frame -2).
The address "FF0Ah" is the 16-bit address of the IDX1 register. The write access to the IDX1 register is
executed in 1 CPU cycle (refer to the "Relative cycle" field of the frame -2).
The next instruction (frame -1) uses the long addressing mode (one operand specifies a word or byte
direct access to memory location; also named "mem" in the Instruction Set manual). Indeed, the format of
the instruction "MOV R2, var4" is "MOV reg, mem" (this can be recognized with the instruction’s opcode
available in the "Data" field of the trace window). In this example, the "mem" value is equal to "C004h"
(16-bit address of the operand "var4"). This instruction is automatically held in the Decode stage of the
pipeline until the instruction modifying the IDX register is executed, which means after a delay of 3 CPU
cycles. One more cycle corresponds to the execution of the instruction itself. In total, the "MOV R2, var4"
is seen executed in 4 CPU cycles.
If a CPU-SFR of the third class is explicitly modified, the latency is seen on the next executed
instruction.
17/22
AN1979 - APPLICATION NOTE
3.4.4 - Arithmetic Instructions and the "reg, mem" Addressing Mode
All the instructions supporting the "reg, mem" addressing mode (or "mem, reg"), except the move and the
switch context instructions, will be displayed in the trace with two frames only if the "reg" operand is a
SFR or an ESFR register. Indeed, those instructions perform two read operations and a write operation.
If the "reg" operand is a GPR, the register file will be accessed (no contention on the Super10 memory).
If the "reg" operand is a SFR or an ESFR, the Super10 will need 2 CPU cycles to read each operand.
Let’s have a look to the trace window below.
Figure 19 : Trace window of an arithmetic instruction using a SFR register as a "reg" operand
This code is executed from the internal Program memory (refer to the "Address" field of the trace). The
frame -4 corresponds to the instruction: "ADD R2, var4". The addressing mode used is "reg, mem". This
can be checked with the "Data" column that represents the opcode of the instruction. As the "reg" operand is a General Purpose Register R2, this ADD instruction is executed in 1 CPU cycle.
The next instruction is composed of two frames, -3 and -2, because of the same "Address" field content.
The disassembled instruction is "ADD MDL, var5". The MDL register is a SFR register. As a consequence, the ADD instruction is displayed with two frames. With the first frame (-3), only the instruction and
the address of the source operand are displayed ("C006h" is the 16-bit address of the data "var5"). With
the second frame (-2), the "Destination" and "Source" fields display the same address: "FE0Eh". Indeed,
the ADD instruction will first read the two operands and then write the destination operand with the result
of the addition.
All the instructions supporting the "reg, mem" addressing mode (or "mem, reg"), except the move
and the switch context instructions, will be displayed in the trace with two frames only if the "reg"
operand is a SFR or an ESFR register.
3.4.5 - Impact of the Peripheral Frequency
The Super10 provides a CPU frequency and a Peripheral frequency that is generally smaller. This Peripheral frequency will be distributed to all the on-chip peripherals and to the Interrupt Controller block. This
means that each time an interrupt control register (xxIC) will be accessed, the reference clock will be the
Peripheral clock. The access time will depend on the Peripheral frequency.
In the trace window, below, the CPU frequency is equal to 100 MHz and the Peripheral frequency is equal
to 50 MHz.
Figure 20 : Trace window with an access via the Peripheral bus
The code is executed from the internal Program memory. The frame -3 performs a bit-set operation on the
bit-addressable SFR register S0TIC (ASC transmit interrupt control register). In the source code, the
instruction is: "BSET S0TIE". The 16-bit address of S0TIC is "FF6Ch" and the bit S0TIE occupies the
position number 6 in the register.
Bit modifications in SFR/ESFR registers are done by a read-modify-write cycle. First, all the 16 bits of the
SFR register are read, then the specified bits are modified and finally written back to the register.
18/22
AN1979 - APPLICATION NOTE
In the trace, above, the BSET instruction is seen executed in 4 CPU cycles (here, the Peripheral clock is
twice slower than the CPU clock).
The ratio between the CPU and the Peripheral frequencies will impact on the access timing of all
the registers accessed via the Peripheral clock.
3.5 - Trace Interpretation of a Code Executed from External Memory
When a code is executed from an external memory, the execution speed will depend on the configuration
of the external bus. Refer to [3] Super10 M340 User’s Manual V1.1 for further details on the external bus
configuration.
To feed the pipeline with a maximum of performance, the Super10 has an Instruction Fetch Unit (IFU).
This unit can fetch simultaneously two instructions at least via a 64-bit wide bus from the Program Management Unit. Those instructions can be located either in the internal Program Memory (as it was the
case in all the previous examples) or in external memory. The time during which the IFU fetches the
instructions from the external memory will depend on the response time of this memory (so will depend on
the configuration of the external bus).
The figure 21, below, represents the execution of a code fetched from an external memory.
Figure 21 : Trace window of a code executed from an external memory
The "Address" column contains the fetch addresses: "280h", "284h", etc. Indeed, the external memory
has been mapped, in this example, in the first 16 Kbytes of the Super10 memory space (in the segment
zero). The external memory is accessed with the following settings:
- 16-bit Demultiplexed mode
- phase A: 0 cycle
- phase B: 1 cycle
- phase C: 0 cycle
- phase D: 0 cycle
- phase E: 2 cycles
- phase F write and read: 0 cycle
With such a configuration, a 16-bit access to the external memory will take 3 CPU cycles (1 cycle for the
B phase and 2 cycles for the E phase). A complete fetch sequence via the 64-bit wide bus will take 12
CPU cycles (3 CPU cycles per 16-bit access multiplied by four accesses).
After those 12 CPU cycles, up to four instructions have been fetched and enter the Prefetch stage of the
pipeline. Then, the Fetch stage will be automatically bypassed in order to feed the Execution pipeline as
soon as possible. The instructions will be executed in the order of the fetch sequence. In between two
fetch sequences, there will be a delay of 12 CPU cycles.
19/22
AN1979 - APPLICATION NOTE
In the trace window, we can see those "fetch sequences". The first two frames (-45 and -44) represent a
fetch sequence. Indeed, the fetch address of the first instruction is: "280h" and the "Data" column contains opcodes on 32 bits (so the two instructions are two double-word instructions). In the "Relative cycle"
column, we can see that the first instruction is executed in 11 CPU cycles and the second one is executed
in 1 CPU cycle. The latency is seen on the first instruction of the fetch sequence (the other instruction is
seen executed in 1 CPU cycle).
The frames -43 to -41 represent the second "fetch sequence". The fetch address of the frame -43 is
"288h". It is a 32-bit instruction (refer to the "Data" column with the instruction’s opcode). The two following frames (-42 and -41) correspond to two 16-bit instructions. In total, 64-bit are fetched with those three
instructions. Reading the time-stamp field, the first frame (-43) is executed in 11 CPU cycles and the two
following ones are executed in 1 CPU cycle. The sum of those timings represents the external memory
access time for the complete sequence.
The third fetch sequence is composed of the frames -40 to -37. They are all 16-bit instructions (refer to
the "Data" field of the trace’s window). The first instruction of the sequence is executed in 9 CPU cycles
and the three following ones are seen executed in 1 CPU cycle.
Those timings can be increased in case of contentions on the external memory (for instance, when data
are also located in external memory area).
When a code is executed from an external memory, the trace displays indirectly the fetch
sequences: the first instruction of the sequence will be seen executed with the external memory
latency and the following ones will be seen executed in 1 CPU cycle (if there is no contention on
the external memory space).
20/22
AN1979 - APPLICATION NOTE
4 - CONCLUSION
This document has described how to read and interpret the trace window’s content thanks to specific
examples. Those pipeline/memory contentions can be combined and, as a result, the execution times will
be longer than the ones presented. As a guideline, each time the user needs to interpret a trace’s content,
he can check the following points:
- memory space where the code is fetched (internal or external);
- location of the operands (internal or external);
- operands dependencies;
- memory contentions;
- jump prediction.
With a better understanding of the trace’s information, the user will be able to optimize efficiently the execution of his code.
5 - REFERENCES
[1] Nohau Super10 In Circuit Emulator Getting starting manual Version 2.0
[2] Super10 Instruction Set Reference Guide Release1.2
[3] Super10 M340 User’s Manual V1.3
[4] AN 1984 "Optimizing code for Super10"
6 - APPENDIX
THE SOFTWARE INCLUDED IN THIS NOTE IS FOR GUIDANCE ONLY. STMicroelectronics SHALL
NOT BE HELD LIABLE FOR ANY DIRECT, INDIRECT OR CONSEQUENTIAL DAMAGES WITH
RESPECT TO ANY CLAIMS ARISING FROM USE OF THE SOFTWARE.
Table 1. Revision History
Date
Revision
June 2004
1
Description of Changes
First Issue
21/22
AN1979 - APPLICATION NOTE
The present note which is for guidance only, aims at providing customers with information regarding their productsin order for them to save
time. As a result, STMicroelectronics shall not be held liable for any direct, indirector consequential damages with respect to any claims arising from the content of such a note and/or the use made by customers of the information contained herein in connection with their products.
Information furnished is believed to be accurate and reliable. However, STMicroelectronics assumes no responsibility for the consequences
of use of such information nor for any infringement of patents or other rights of third parties which may result from its use. No license is granted
by implication or otherwise under any patent or patent rights of STMicroelectronics. Specifications mentioned in this publication are subject
to change without notice. This publication supersedes and replaces all information previously supplied. STMicroelectronics products are not
authorized for use as critical components in life support devices or systems without express written approval of STMicroelectronics.
The ST logo is a registered trademark of STMicroelectronics.
All other names are the property of their respective owners
STMicroelectronics GROUP OF COMPANIES
Australia - Belgium - Brazil - Canada - China - Czech Republic - Finland - France - Germany - Hong Kong - India - Israel - Italy - Japan Malaysia - Malta - Morocco - Singapore - Spain - Sweden - Switzerland - United Kingdom - United States
www.st.com
22/22
AN1979.FM
© 2004 STMicroelectronics - All rights reserved