1
PSZ 19:16 (Pind. 1/07)
UNIVERSITI TEKNOLOGI MALAYSIA
DECLARATION OF THESIS / UNDERGRADUATE PROJECT PAPER AND COPYRIGHT
Author’s full name :
SIN TONG KOK
Date of birth
:
28th JANUARY 1989
Title
:
Academic Session :
SUSTAINABLE WIRELESS SENSOR DEVICE FOR HEARTBEAT
MONITORING WITH ENERGY HARVESTER
2012/2013
I declare that this thesis is classified as :
CONFIDENTIAL
(Contains confidential information under the Official Secret
Act 1972)*
RESTRICTED
(Contains restricted information as specified by the
organization where research was done)*
OPEN ACCESS
I agree that my thesis to be published as online open access
(full text)
I acknowledged that Universiti Teknologi Malaysia reserves the right as follows:
1. The thesis is the property of Universiti Teknologi Malaysia.
2. The Library of Universiti Teknologi Malaysia has the right to make copies for the purpose
of research only.
3. The Library has the right to make copies of the thesis for academic exchange.
Certified by :
SIGNATURE
890128-08-5267
(NEW IC NO. /PASSPORT NO.)
Date :
NOTES :
24/6/2013
*
SIGNATURE OF SUPERVISOR
ASSOC. PROF. DR. ROSBI BIN MAMAT
NAME OF SUPERVISOR
Date : 24/6/2013
If the thesis is CONFIDENTAL or RESTRICTED, please attach with the letter from
the organization with period and reasons for confidentiality or restriction.
"I hereby declare that I have read this report and in my opinion this report is sufficient
in terms of scope and quality for the award of the degree of Bachelor in Mechatronic
Engineering”
Signature
:
Name
: ASSOC. PROF. DR. ROSBI BIN MAMAT
Date
:
24/6/2013
i
SUSTAINABLE WIRELESS SENSOR DEVICE FOR HEARTBEAT MONITORING
WITH ENERGY HARVESTER
SIN TONG KOK
A report submitted in partial fulfillment of the
requirements for the award of the degree of
Bachelor in Mechatronic Engineering
Faculty of Electrical Engineering
Universiti Teknologi Malaysia
JUNE 2013
ii
I declare that this report entitled "SUSTAINABLE WIRELESS SENSOR DEVICE FOR
HEARTBEAT MONITORING WITH ENERGY HARVESTER" is the result of my
own research except as cited in the references. The report has not been accepted for any
degree and is not concurrently submitted in candidature of any other degree.
Signature
:
Name
:
SIN TONG KOK
Date
:
24/6/2013
iii
Special dedicated to my beloved family and friends
iv
ACKNOWLEDGEMENT
In order to complete my final year project, supports from many parties are fully
appreciated. Firstly, I would like to thanks to Assoc. Prof. Dr. Rosbi bin Mamat who is
my supervisor in this project. His advised and guidance had helped me a lot in this
project.
Besides that, I also wish to express my appreciation to all my friends whose had
help me a lot to speed up my progress for completing this project.
Lastly, thanks to my family who had given their greatest encouragement and
support for all these years. Without their helps, there will be a problem for me to
complete this project.
v
ABSTRACT
With the recent advance in technology, wireless sensors device are now used in
medical healthcare application especially in detecting human heartbeat. This project is to
design a sustainable wireless sensor device for sensing heartbeat. The device can sense
heartbeat rate from fingertips. An Android application was developed to receive the
heartbeat rate for health monitoring. The heartbeat rate can be viewed in tables or graphs
and can be stored in Google Fusion Table as online database. The user can generate
energy using piezoelectric element to operate the device without external source. The
energy will be harvested and stored into super capacitor to power the device.
vi
ABSTRAK
Dengan kemajuan teknologi terkini, peranti sensor tanpa wayar digunakan
dalam aplikasi penjagaan kesihatan perubatan terutama dalam mengesan degupan
jantung manusia. Projek ini adalah untuk mereka bentuk alat sensor tanpa wayar yang
mampu untuk mengesan denyutan jantung. Peranti boleh mengesan kadar denyutan
jantung dari hujung jari. Aplikasi Android telah direkakan untuk menerima kadar
degupan jantung untuk pemantauan kesihatan. Kadar degupan jantung yang boleh dilihat
dalam jadual atau graf dan boleh disimpan di dalam Jadual Fusion Google sebagai
pangkalan data dalam talian. Pengguna boleh menjana tenaga menggunakan unsur
piezoelektrik untuk mengendalikan peranti tanpa sumber luar. Tenaga akan dituai dan
disimpan ke dalam super kapasitor untuk menghidupkan peranti.
vii
TABLE OF CONTENTS
CHAPTER
1
2
TITLE
PAGE
DECLARATION
ii
DEDICATION
iii
ACKNOWLEDGEMENTS
iv
ABSTRACT
v
ABSTRAK
vi
TABLE OF CONTENTS
vii
LIST OF TABLES
x
LIST OF FIGURES
xi
LIST OF ABBREVIATIONS
xiv
LIST OF APPENDICES
xv
INTRODUCTION
1.1
Background
1
1.2
Objective
3
1.3
Problem Statement
4
1.4
Scope
4
1.5
Summary of Work
6
LITERATURE REVIEW
2.1
Chapter Overview
8
2.2
Related Projects
9
2.2.1
9
EZ430-Chronos Watch as a Wireless
viii
Health Monitoring Device by Ili Najaa
Binti Mohd Nordin (UTM 2011)
2.2.2
Development of Electrocardiogram (ECG)
10
Wireless Sensors Board for Medical
Healthcare Application by Nor Syahidatul
Nadiah binti Ismail (UTM 2009)
2.2.3
A Smartphone-Centric Platform for
11
Personal Health Monitoring using Wireless
Wearable Biosensors
3
METHODOLOGY
3.1
Introduction
12
3.2
Hardware
13
3.2.1
Processing Unit
13
3.2.2
Piezoelectric Harvesting Power Supply
14
(LTC3588 Breakout)
3.2.3
Volture Piezoelectric Energy Harvester
16
3.2.4
Electric Double Layer Super Capacitor
16
3.2.5
Cytron Bluebee Module
17
3.2.6
12W,3.3/5V Input Wide Output Adjustable
19
Boost Converter
3.3
3.4
3.2.7
Logic Converter 4 Channels (LC04A)
20
3.2.8
Quad Operational Amplifier (LM324)
21
3.2.9
IR Sensor with Socket
22
3.2.10
BCD to 7 Segment Decoder (74LS48)
23
3.2.11
Voltage Regulator LM7805 & LM1117T
23
3.2.12
3.7 1100mAh Li-Ion Battery
24
Circuitry Design
25
3.3.1
26
IR Sensor and Conditioning Circuit
Software Implementation
27
ix
3.4.1
MPLAB
3.4.1.1
3.4.2
3.4.3
4
MPLAB Program
28
MIT App Inventor
33
3.4.2.1
Android Application
34
3.4.2.2
Android Block Editor Program
35
Solid Works
40
Result and Discussion
4.1
4.2
5
27
Hardware Result
42
4.1.1
42
Electronic Circuitry
Software Result
46
4.2.1
Android Application Result
46
4.2.2
Fusion Table Result
48
CONCLUSION
5.1
Conclusion
50
5.2
Future Work
51
5.2.1
51
Recommendation
REFERENCES
52
APPENDICES A – D
53
x
LIST OF TABLES
TABLE NO.
TITLE
PAGE
1.1
Gantt Chart for Final Year Project 1
6
1.2
Gantt Chart for Final Year Project 2
7
3.2
Pin Function for Bluebee
18
3.3
Component and Its Function in Android User Interface
35
xi
LIST OF FIGURES
FIGURE NO.
TITLE
PAGE
1.1
Example of Wireless Sensor Devices in Healthcare
2
1.2
Scope of Project
4
2.1
EZ430-Chronos Watch as a Wireless Health Monitoring
Device
9
2.2
Development of ECG Wireless Sensors Board for
Medical Healthcare Application
10
3.1
Design Process
13
3.2
PIC16F628 Pin Diagram
14
3.3
Piezoelectric Harvesting Power Supply LTC3588
Breakout
14
3.4
Volture Piezoelectric Energy Harvester (film)
16
3.5
10F/2.5V Super Capacitor
16
3.6
BlueBee Module
17
3.7
12W, 3.3/5V Input Wide Output Adjustable Boost
Converter (PTN04050C)
19
3.8
Logic Converter 4 Channels (LC04A)
20
3.9
Quad Operational Amplifier (LM324) Pin Diagram
21
3.10
IR Sensor with Socket
22
3.11
BCD to 7 Segment Decoder (74LS48) Pin Diagram
23
xii
3.12
Voltage Regulator LM7805 and LM1117T
23
3.13
3.7V 1100mAh Li-Ion Battery
24
3.14
Wireless Sensor Device General Diagram
25
3.15
IR Sensor and Conditioning Circuit
26
3.16
Flowchart of Main Program
28
3.17
Flowchart of Countpulse() Function
29
3.18
Flowchart of Display() Function
30
3.19
Flowchart of Mask() Function
32
3.20
Flowchart of Charc() Function
32
3.21
Process Flow of Android App Development
33
3.22
Android Application
34
3.23
Connect/Disconnect Button Blocks
36
3.24
Clock1.Timer Blocks
37
3.25
Clock2.Timer Blocks
37
3.26
Store Button Blocks
38
3.27
Incomplete Storing Dialog Box
39
3.28
Step 1-Constructing the Insert Query
39
3.29
Step 2-Sending the query to Google's Fusion Table
40
3.30
Solid Works Drawing of IR Sensor Socket
41
3.31
Solid Works Drawing of Mechanism for Volture
Piezoelectric Energy Harvester
41
4.1
Wireless Sensor Device
42
4.2
Voltage Regulator (VR) Circuit
43
4.3
Energy Harvester Power Supply
44
4.4
Mechanism for Volture Piezoelectric Energy Harvester
45
xiii
4.5
BPM Display on Wireless Sensor Device Result
45
4.6
BPM Display on Android Application Result
46
4.7
BPM Graph Display in Android Application Result
47
4.8
BPM Yearly Graph Display in Android Application
Result
47
4.9
BPM Table in Google Fusion Table Result
48
4.10
BPM Graph in Google Fusion Table Result
48
4.11
BPM Yearly Graph in Google Fusion Table Result
49
xiv
LIST OF ABBREVIATIONS
LabVIEW
-
Laboratory Virtual Instrument Engineering Workbench
ECG
-
Electrocardiogram
IR
-
Infrared
BCD
-
Binary Coded Decimal
BPM
-
Beats per Minute
MIT
-
Massachusetts Institute of Technology
LED
-
Light-emitting Diode
VR
-
Voltage Regulator
xv
LIST OF APPENDICES
APPENDIX
TITLE
PAGE
A
Wireless Sensor Device Schematic
53
B
Energy Harvester and Voltage Regulator Schematic
54
C
Microcontroller Source Code
55
D
MIT App Inventor Graphical Programming
63
E
Cost of the Project
68
1
CHAPTER 1
INTRODUCTION
1.1
Background
The number of people suffering from chronic diseases has been increased
dramatically because busy and unhealthy modern life style. High blood pressure patients
in China had increase from 130 million in 2007 to 200 million in 2011. In a scale of
almost one to ten adults in China suffer from diabetes outbreak currently[1]. The
limitation of the traditional medical care is the main reason of this problem. The patient
could not get the proper and continuous advice from the doctor. The patients does not
realized about their diseases until they go to do body checkup and maybe it is too late.
After the patients knew about their diseases, the doctor could not help them because they
had no time to go to the doctor for blood pressure or any health monitoring. In these
cases, doctors could not give patients advice when necessary.
Besides that, another major problem is the increasing of the elderly in the
population which needs more valuable bed needed space to provide a long term health
care services in hospital. In China, the demand for healthcare is increasing rapidly due to
the ageing population resulting from the one-child policy since 1970s, in which only one
child is allow in a family[1].
2
These problems become the obstacle to prevent the patient to receive the doctor
consultant for symptom monitoring. To solve this problem, the popularity of mobile
phones could make a contribution. Recent innovation technologies such as mobile
computing devices can be increasingly integrated into the healthcare environment and
work together to create a reliable and secure communication backbone to allow access to
vital information anytime and anywhere[2].Wireless technology and mobile network
offer a great potential such as high mobility, wider coverage range and better data
collection. Networked mobile devices in healthcare industry help clinicians to connect to
the patients and provide them more efficient, accurate and better quality care with fewer
medical errors[2].
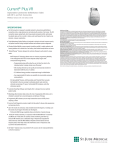
Some examples of available wireless mobile in healthcare are shown in Figure
1.1 (a) iHealth Smart GlucoMeter which is a blood glucose system that apply the smart
device like smartphone or smartphone with an attached device to measure blood glucose
levels and monitoring their health[3]. (b) Zeo Sleep Manager is a small and light
wireless head band, bedside display and set of online tools that measure sleep patterns
through the electrical signals naturally produced by the brain[4].
(a) iHealth Smart GlucoMeter
(b) Zeo Sleep Manager
Figure 1.1: Example of Wireless Devices in Healthcare
The energy harvesting technologies is suitable to power up wireless sensor
device due to the limitation of power sources. The ambient power sources (such as
3
vibrational, thermal, wind solar and so on) can convert into usable electrical energy
which is stored and used for performing sensing or actuation. The advantages of energy
harvesting are to reduce the dependency on battery power, reduce the maintenance cost
and provide the long-term solutions[5].
In this project, the general concept of this wireless sensor device is used to detect
the heartbeat rate and send the data rate obtained to the user’s smartphone for data
collection. For hardware design, it concentrates on development of self-sustained
wireless sensor device with energy harvesting. It consists of microcontroller, heartbeat
sensor, energy harvester, transceiver, and piezoelectric film. The ambient energy
selected is using piezoelectric which is the energy generated by vibration and human
motion. For software design, it concentrates on the data transmitting and processing. The
microcontroller will be programmed to sense/send data to the user’s smartphone for data
collection. The android graphical user interface (GUI) is developed to store and display
the data obtained.
1.2
Objectives
Based on the problem statement above, there are several objectives need to be
achieved at the end of the project:
To design self-sustained wireless sensor device
To develop a wireless sensor device which able to measure heartbeat
To collect the data and display it in statistical order on the end user GUI
Android application in smartphone
4
1.3
Problem Statement
People nowadays have no health awareness. Besides that, the patients cannot
update their health condition continuously to the doctor. This caused the increase of
health problems. The wireless sensor devices available in the market usually need an
external power supply to power it. The small volumetric devices are limited in amount
of energy that can be stored. Hence the batteries in finite energy supply must be
optimally used to perform the sensing and communication tasks. The batteries must be
replaced regularly which is a costly. Besides, the hardware designed must have low
power consumption. The energy harvested is can be stored in the power storage which is
super capacitor and sufficient to supply the power to complete a cycle of data recording.
A portable and wireless device was needed to replace the non-portable and large medical
instrument to record and present the data.
1.4
Scope
Sensor Device
Power
Selfpowered
External
Power
Portability
Portable
Nonportable
Functionality
Heart
rate
Others
Figure 1.2: Scope of Project
Platform
Android
Others
5
There are four main elements need to be considered in this project as shown in
Figure 1.2 which are in term of power, portability, functionality and platform using.
Firstly, the power of the sensor device will focused on self-powered which are power by
energy harvesting power supply without external power supply. Next, the device is
portable and can be operate without any external wiring. The functionality of the device
is to measure human’s heart rate. Lastly, the application will be developed using
Android platform which providing a graphical user interface to user for data collection
and analysis.
6
1.5
Summary of Work
Work Schedule
1. 1st Semester, 2012/2013
Weeks
01 02 03 04 05 06 07 08 09 10 11 12 13 14 15 16
Project
Proposal
Finalized
Proposal
Background
study
Components
purchasing
Research on
Android GUI
Programming
Start design
& build the
device
Report/Thesis
Writing
Presentation
Table 1.1: Gantt Chart for Final Year Project 1
7
2. 2nd Semester, 2012/2013
Weeks
01 02 03 04 05 06 07 08 09 10 11 12 13 14 15 16
Continue device
building
Coding on
ATMega328
Continue Android
GUI
Programming
Debugging
software and
improve
Preparation for
demo/presentation
Report/Thesis
Writing
Design Poster
Presentation
Thesis
compilation
Table 1.2: Gantt Chart for Final Year Project 2
8
CHAPTER 2
LITREATURE REVIEW
2.1
Chapter Overview
This chapter will discuss about the related project done by previous UTM
students and online sources. These related works have been reviewed carefully in order
to improve the quality and reliability of this project. Besides that, there are some useful
ideas that can be implemented in this project from other similar projects.
9
2.2
Related Projects
2.2.1
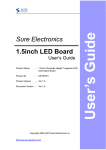
EZ430-Chronos Watch as a Wireless Health Monitoring Device by Ili Najaa
Binti Mohd Nordin (UTM 2011)[6]
This project built a wireless health monitoring system develop in Laboratory
Virtual Instrumentation Engineering Workbench (LabVIEW) which is able to transmit
and receive electrical signals from a patient’s to an EZ430-Chronos sport watch.
The recommendation of the project is use PIC microcontroller instead of using
computer as a transmitter station. It is very convenient from using a computer which is
consumes a lot of power if compared with the PIC microcontroller. The hardware can
packed into a small device to control the inputs and outputs. Hence, the device has high
portability to carry around.
Figure 2.1: EZ430-Chronos Watch as a Wireless Health Monitoring Device
10
2.2.2
Development of Electrocardiogram (ECG) Wireless Sensors Board for
Medical Healthcare Application by Nor Syahidatul Nadiah binti Ismail (UTM
2009)[7]
This project built an ECG Wireless Sensors Board for healthcare application
which is able to transmit ECG signals using XBEE wireless transmission between the
board and computer.
XBEE module used is limited to 100m range. If over this range, the signals
might not be received. The board developed is large and hard to carry by the patient.
Figure 2.2: Development of ECG Wireless Sensors Board for Medical Healthcare
Application
11
2.2.3
A Smartphone-Centric Platform for Personal Health Monitoring using
Wireless Wearable Biosensors[8]
This project aimed to develop a platform in solving the issues associated with
wearable sensors and mobile phone based monitoring. This platform is made by three
main elements which are wearable biosensor, controller for the biosensor and the mobile
monitoring unit. This platform can be operated in different phone operating system such
as Linux and Symbian and can support different sensors. The wearable devices had a
closed loop control features to reduce the power consumption based on real-time health
condition.
The platform is applied to the older version of mobile phones. There is a more
powerful platform can be replaced to perform the same task such as Android platform.
12
CHAPTER 3
METHODOLOGY AND APPROACHES
3.1
Introduction
The development of this project combines knowledge from various discipline of
study, thus a systematic approach for the development process is crucial. This chapter
describes the development methodology and guidelines in designing the device.
The design process start with hardware design, software design, hardware and
software integration and lastly is testing and calibration. Once the objectives and
application were identified, research had been carried out to determine the suitable
component for the hardware design. The hardware and software were developed
separately and will later be integrated together to form a complete system. Testing and
calibration will be carried out to test and improve the complete system.
13
Hardware Design
Software Design
Hardware and
Software Integration
Testing and
Calibration
Figure 3.1: Design Process
3.2
Hardware
3.2.1
Processing Unit
PIC16F628 manufactured by Microchip has been chosen as the processing unit
for wireless sensor device. This chip had been chosen based on several reasons. The
main reason is this chip has a low voltage and current consumption which enable the
device to be portable with small battery storage. Besides, it has a small size and has
enough output ports for my application. It also supports serial interfacing.
14
Figure 3.2: PIC16F628 Pin Diagram
3.2.2
Piezoelectric Harvesting Power Supply (LTC3588 Breakout)
Figure 3.3: Piezoelectric Harvesting Power Supply LTC3588 Breakout
The LTC3588 Breakout integrates a low-loss full-wave bridge rectifier with a
high efficiency buck converter to form a complete energy harvesting solution optimized
for high output impedance energy sources such as piezoelectric transducers.
15
Four output voltages, 1.8V, 2.5V, 3.3V and 3.6V, are pin selectable with up to
100mA of continuous output current; however, the output capacitor may be sized to
service a higher output current burst. An input protective shunt set at 20V enables
greater energy storage for a given amount of input capacitance.
This breakout board had been chosen because it works perfectly with low power
devices. The energy harvested from the ambient environment such as vibration or human
motion to power up the devices. This can eliminated the replacement of external power
supply.
Features of LTC3588 Breakout
950nA Input Quiescent Current (Output in Regulation – No Load)
450nA Input Quiescent Current in UVLO
2.7V to 20V Input Operating Range
Integrated Low-Loss Full-Wave Bridge Rectifier
Up to 100mA of Output Current
Selectable Output Voltage (1.8V, 2.5V, 3.3V, 3.6V)
High Efficiency Integrated Hysteretic Buck DC/DC
Input Protective Shunt – Up to 25mA Pull-Down ≥ 20V
Wide Input Undervoltage Lockout (UVLO)
Available in 10-Lead MSE and 3mmx3mm DFN Packages
16
3.2.3
Volture Piezoelectric Energy Harvester[9]
Figure 3.4: Volture Piezoelectric Energy Harvester (film)
Volture Piezoelectric Energy Harvester convert wasted energy from mechanical
vibrations into usable electrical energy. This film can interface directly to LTC3588
Breakout. LTC3588 Breakout will rectify a voltage waveform and stored the harvested
energy on an external capacitor. This combination forms a full energy harvesting
solution.
3.2.4
Electric Double Layer Super Capacitor
Figure 3.5: 10F/2.5V Super Capacitor
17
Super capacitors have the highest available capacitance values per unit volume
and the greatest energy density of all capacitors. In this project, super capacitor is used
as temporary storage to store the harvested energy.
3.2.5
Cytron Bluebee Module
Figure 3.6: BlueBee Module
BlueBee module is used as a transceiver due to some reasons which are low in
cost and suitable for low power wireless sensor application. Besides, this module is
small which is suitable to use in portable device.
18
Pin Name
Description
1
3V3
3.3V power supply for Bluebee
2
TXD
UART Data Output
3
RXD
UART Data Input
4
NA
NA
5
RESET
Reset for Bluebee
6
P9
Connection Indicator : High = Connected, Low = No Connection
7
NA
NA
8
P8
LED, Mode indicator, connected to BlueBee status LED
9
NA
NA
10
GND
Ground Port
11
NA
NA
12
CTS
UART clear to send, active low
13
NA
NA
14
NA
NA
15
NA
NA
16
RTS
UART request to send, active low
17
NA
NA
18
NA
NA
19
NA
NA
20
NA
NA
Table 3.2: Pin Function for BlueBee Module[10]
19
3.2.6
12W, 3.3/5V Input Wide Output Adjustable Boost Converter
Figure 3.7: 12W, 3.3/5V Input Wide Output Adjustable Boost Converter (PTN04050C)
The PTN04050C is a 4-pin boost-voltage regulator product. The PTN04050C
provides high-efficiency, step-up voltage conversion for loads of up to 12W in 2.95V to
5.5V input range. The output voltage is set using a single external resistor to set any
value within the range, 5V to 15V. In this project, 5kOhm is selected to set the output
voltage about 9.0V.
Features of PTN04050C
Up to 12 W Output
Wide Input Voltage Range and General-Purpose Applications (2.95 V to 5.5 V)
Wide Output Voltage Adjust (5 V to 15 V)
High Efficiency (Up to 90%)
Operating Temperature: –40°C to 85°C
Surface Mount Package Available
20
3.2.7
Logic Converter 4 Channels (LC04A)
Figure 3.8: Logic Converter 4 Channels (LC04A)
LC04A is a logic converter which help user to steps down and step up 5V signals
to 3.3V and 3.3V to 5V rapidly. It have four pin on high side to convert to four pin at the
low side[11]. In this project, LC04A used to step down 5V from microcontroller to 3.3V
of Bluebee module.
Features of LC04A
Ways (bidirectional), logic zero will wins (dominant)
LV must be lower voltage than HV
LV can be as low as 1.8V, HV can go up to 5V.
Channels, you can have TX, RX, CTS and RTS.
UART, SPI, I2C, or simple sensor input that have different voltage level.
Not analog converter nor amplifier.
Dimension: 15mm x 16mm
21
3.2.8
Quad Operational Amplifier (LM324)
Figure 3.9: Quad Operational Amplifier (LM324) Pin Diagram
The LM324 consist of four independent, high gain, internally frequency
compensated operational amplifiers which were designed specifically to operate from a
single power supply[12]. In this project, two operational amplifiers are needed to filter
the noise and provide a gain to amplifier the weak signal pulse from the finger tip.
Features of LM324
• Internally Frequency Compensated for Unity Gain
• Large DC Voltage Gain: 100dB
• Input Common Mode Voltage Range Includes Ground
• Large Output Voltage Swing: 0V to VCC -1.5V
• Power Drain Suitable for Battery Operation
22
3.2.9
IR Sensor with Socket
Figure 3.10: IR Sensor with Socket
The IR sensor set with socket consists of an IR transmitter and an IR receiver
mounted side by side and is covered by a rectangular socket which also minimizes the
influence from the environment. The IR transmitter transmits an infrared light into the
fingertip placed on the sensor unit and the IR receiver senses the portion of the light that
is reflected back. The blood volume inside the fingertip determines the intensity of
reflected light. Therefore, heartbeat rate converted the reflected infrared light that can be
detected by the photodiode. The amplitude of the reflected infrared light then converted
to pulse with signal conditional circuit. The pulse then can be readable by the
microcontroller and the heartbeat rate can be determined.
23
3.2.10 BCD to 7 Segment Decoder (74LS48)
Figure 3.11: BCD to 7 Segment Decoder (74LS48) Pin Diagram
In order to reduce the number of pin used by 7 segment display, 74LS48 is used.
Different BCD inputs from 0000-1001 apply to input terminal, the IC produces
equivalent outputs from 0-9.
3.2.11 Voltage Regulator LM7805 and LM1117T
Figure 3.12: Voltage Regulator LM7805 and LM1117T
A voltage regulator is designed to automatically maintain a constant voltage level.
In this project, two different voltage regulator 5.0V and 3.3V are used because all
components are used 5.0V except Bluebee is used 3.3V.
24
3.2.12 3.7V 1100mAh Li-Ion Battery
Figure 3.13 3.7V 1100mAh Li-Ion Battery
This is a typical Lithium Ion rechargeable battery in cylindrical shaped that offer
1100mAh actual capacity. The size is small and suitable for portable project.
25
3.3
Circuitry Design
Energy Harvesting System
Wireless Sensor Device
BlueBee
LTC3588
Heartbeat Sensor
Circuit
PIC16F628
BPM Display
Piezoelectric
Film
Figure 3.14: Wireless Sensor Device General Diagram
Figure 3.7 showed the wireless sensor device consist of these main components.
PIC16F628 serves as a brain for the device. The sensor using is heartbeat sensor circuit
to sense the heartbeat. The communication component using here is Bluebee and will
connect to the smartphone. The power source is generate from the piezoelectric patch
and LTC-3588 will collect and regulate the harvested energy and then the energy will
use to power up the sensor device.
26
3.3.1
IR Sensor and Conditioning Circuit
IR Diode
and
Photodiode
RA3
RA4
Figure 3.15: IR Sensor and Conditioning Circuit
The signal conditioning circuit consists of two identical active low pass filters.
The circuit is designed to have 2.34 Hz cut-off frequency which is the maximum heart
rate can be measured is 150 bpm. The operational amplifier IC used in this circuit is
LM324N, a low power quad Op-Amp chip. The filtering is used to block any higher
frequency noises present in the signal. The total amplification is 10201 which each gain
of the filter stage is 101.
= 101
27
=2.34Hz
The dc component of the signal is block using a 1 uF capacitor at the input of
each stage. From the equations above, the calculated results are 101 for gain for each
stage and 2.34Hz for cut-off frequency. The weak signal generated from the photo
sensor unit is boosted before converting into a pulse through a two stage amplifier/filter.
Whenever a heartbeat is detected, the LED (RA3) blinks. The T0CK1 (RA4) input of
PIC16F628A receives the output from the signal conditioner.
3.4
Software Implementation
Software implementation will be discussed in this section. In this project, there
are two main software will be using include the MPLAB in C programming and MIT
App Inventor. The MPLAB used to program the Microcontroller PIC16F628 to perform
collect the data from the heart beat sensor circuit and send to user’s smartphone through
Bluetooth communication. The Android application used to develop a Graphical User
Interface (GUI) for user to see and interact with. The GUI provides a control menu for
user to select the option to perform a certain task.
3.4.1
MPLAB
MPLAB is free software which can be obtained from the internet. Both
Assembly and C programming languages can be used with MPLAB. In this project, C
programming language is used. There are three main parts for Microcontroller
PIC16F628 which is BPM calculation, BPM display and the Bluetooth communication
between sensor device and Android based smartphone.
28
3.4.1.1 MPLAB Program
Figure 3.16: Flowchart of Main Program
This section will discussed some of the important subroutine of the program for
Microcontroller PIC16F628. Figure 3.16 shows the flowchart of the main program.
When start button is pressed, the program will start to operate.
29
Figure 3.17: Flowchart of Countpulse() Function
Figure 3.17 shows the flowchart of Countpulse() function. This function is used
to measure the BPM. When start button is pressed, the microcontroller activates the IR
transmission in the sensor unit for 15 seconds. During this interval, the number of pulses
collecting at the T0CKI input is counted. The actual heart rate would be 4 times the
count value, and the resolution of measurement would be 4. IR transmission is
controlled through RA3 pin of PIC16F628.
30
Figure 3.18: Flowchart of Display() Function
31
Figure 3.18 shows the flowchart of Display() function. This function is used to
display the BPM in the 7 segment display. The pulserate is display using mask function
to get the first digit and the second digit and store in DD0 and DD1. Next, DD0 and
DD1 digits will display in two 7 segment display by on off the transistors in the for loop.
After that, the BPM will sent byte by byte to Android based smartphone via Bluetooth
32
Figure 3.19: Flowchart of Mask() Function
Figure 3.20: Flowchart of Charc() Function
33
Figure 3.19 and 3.20 shows the function of Mask() and Charc() functions. Both
functions are used to switch cases from 0-9 and 0B00001111-0B10011111 for 7 display
segment and Bluebee.
3.4.2
MIT App Inventor
MIT App Inventor is an application provided by Google and now maintained by
the Massachusetts Institute of Technology (MIT). It allows user to drag-and-drop the
visual objects to create an application that can run on the Android based smartphone.
Figure 3.21: Process Flow of Android App Development
34
MIT App Inventor allow user to develop applications for Android based
smartphone using web browser. The application built can be tested using Android
Emulator and Android based smartphone. From the figure above, Google App Inventor
Server provide a platform which is App Inventor Designer where user can select the
components for the application. Next, App Inventor Blocks Editor is where user can
assemble the program blocks by drag-and drop. The application can be modified and
tested in the Android Emulator and Android based smartphone at the same time.
There are three main parts for the Android application which is Bluetooth
communication, BPM display and store in Google Fusion Table and lastly is display
BPM in graph.
3.4.2.1 Android Application
Bluetooth Connection
Button
Connect/Disconnect
Button
Search Bluetooth
Device Button
Display Bluetooth
Mac Address Textbox
BPM Display Area
Store BPM
Button
View Week/Year
Graph Button
View Card
Button
Figure 3.22: Android Application
35
No
1
Component
Bluetooth Connection Button
Function
Click to visible or hide Search Bluetooth and
Connect/Disconnect button
2
Search Bluetooth Button
Click to search Bluetooth devices
3
Connect/Disconnect Button
Click to connect or disconnect Bluetooth
connection
4
Bluetooth Mac Address Textbox
Display Bluetooth Mac Address
5
BPM Display Label
Display BPM data
6
Store Button
Click to store BPM data
7
View Card Button
Click to view BPM card
8
View Graph Button
Click to view week/year BPM Graph
Table 3.3: Component and Its Function in Android User Interface
3.4.2.2 Android Block Editor Program
This section will discussed some of the important parts of the visual blocks
programming for the Android application.
36
Figure 3.23: Connect/Disconnect Button Blocks
Figure 3.23 shows the function of Connect/Disconnect button. Change is a global
Boolean variable. If Change is true, then the BluetoothClient1.Connect will connect to
the selected Bluetooth device and at the same time the “Connect” text of the button will
change to “Disconnect”. And then the Change will change from true to false. If Change
is false, the BluetoothClient.Disconnect will disconnect from the connected Bluetooth
device and at the same time the “Disconnect” will change to “Connect”. And then the
Change will change from false to true. Next if else statement is used to enable Clock1
timer and Clock2 timer.
37
Figure 3.24: Clock1.Timer Blocks
Figure 3.24 shows the function of Clock1.Timer. Clock1.Timer is used to switch
the heart shape image and a black image. This will caused blinking effect on the screen.
Figure 3.25: Clock2.Timer Blocks
Figure 3.25 shows the function of Clock2.Timer. Clock2.Timer is used to receive
the BPM data from sensor device. The BPM data from the sensor device is sent byte by
byte. For example, “6” and “0” sent by sensor device. If the byte received greater than 1
then the BPM data will display at BPMDataLabel.Text.
38
Figure 3.26: Store Button Blocks
Figure 3.26 shows the function of Store button. The if else statement here is used
to store the BPM data to Fusion Table if BPMDataLabel.Text is not empty. If
BPMDataLabel.Text is empty, Notifier1.ShowMessageDialog will pop out an
Incomplete Storing dialog box as shown in Figure 3.27. After the BPM data stored, the
application will reset to a default form.
39
Figure 3.27: Incomplete Storing Dialog Box
In order to send the data to Fusion Table, FusiontablesControl component is used.
This action will create a new row in the Fusion Table, setting the values of the various
columns involved. The data inserted must follow the format of the insert query.
This procedure involves two steps:
Figure 3.28: Step 1-Constructing the Insert Query
40
Figure 3.29: Step 2-Sending the query to Google's Fusion Table
An example of what this might look like is shown below. Notice that the values
must be enclosed in single quotes:
INSERT INTO 191GHtZ_B2 (Date, Time, BPM) VALUES ('10/10/2012','7:30AM','60')
3.4.3
Solid works
Solid works is a 3D mechanism design tools that used to design the mechanical
design in this project. The IR sensor socket and the mechanism for Volture Piezoelectric
Energy Harvester are designed using this software.
41
Figure 3.30: Solid works Drawing of IR Sensor Socket
Figure 3.31: Solid works Drawing of Mechanism for Volture Piezoelectric Energy
Harvester
42
CHAPTER 4
RESULT AND DISCUSSION
4.1
Hardware Result
4.1.1
Electronic Circuitry
In this project, there are three parts implemented for circuitry part, which are
wireless sensor device, voltage regulator circuit and energy harvester power supply.
PIC16F628
Logic Converter
BPM Display
Bluebee
Heartbeat Sensor Circuit
Figure 4.1: Wireless Sensor Device
43
Figure 4.1 shows the wireless sensor device which is the main board where
Microcontroller PIC16F628, heartbeat sensor circuit, BPM display and Bluebee module
are deployed.
Step Up
VR
5.0V VR
Full Wave
Rectifier
3.3V VR
Figure 4.2: Voltage Regulator (VR) Circuit
Figure 4.2 shows the voltage regulator circuit which used to step up the voltage
from 3.7V to 9.0V before supply to 5.0V and 3.3V voltage regulator. 3.3V is needed
because Bluebee module is operating in this voltage. Logic converter is needed to step
up and step down from 3.3V to 5.0V and 5.0V to 3.3V between Microcontroller
PIC16F628 and Bluebee module.
44
Figure 4.3: Energy Harvester Power Supply
Figure 4.3 shows the energy harvester power supply which used to collect the
harvested energy from the piezoelectric film and store the harvested energy in super
capacitor. But circuit is failed to harvest the energy and get the desired maximum output
3.6V which is more than enough to step up to 9.0V in the voltage regulator circuit. This
problem is most probably because the 10F/2.5V super capacitor is hard to charge due to
piezoelectric film had insufficient current to pump into the super capacitor.
The full wave rectifier in Figure 4.2 is the second trial to replace the energy
harvester power supply to harvest the energy but the result is the same. However, using a
single 3.7 rechargeable battery is sufficient to power up the whole sensor circuit.
Button
Figure 4.4: Mechanism for Volture Piezoelectric Energy Harvester
45
Figure 4.4 shows the mechanism for Volture piezoelectric energy harvester
which used to generate electric energy. The electric energy generated by pressing the
button. The electric energy harvested is an AC power supply between -15V to +15V.
BPM
Figure 4.5: BPM Display on Wireless Sensor Device Result
The wireless sensor device has been tested. Firstly, the thumb is placed on the IR
sensor socket and start button was pressed. The yellow LED is started to blink and
indicated the BPM was started to measure. After 15 seconds, “72” is displayed on the 7
segment display about 2 seconds. Finally, the BPM data is sent to Android based
smartphone.
46
4.2
Software Result
4.2.1
Android Application Result
72 (BPM)
BPM Table
Figure 4.6: BPM Display on Android Application Result
The Android application is enabled to receive the BPM data from the wireless
sensor device as shown in Figure 4.6. When store button is pressed, the BPM data is
stored in the Google Fusion Table as shown in Figure 4.9. At the same time, the BPM
table and graph can be viewed in Android application.
47
BPM Graph
Figure 4.7: BPM Graph Display in Android Application Result
BPM Yearly
Graph
Figure 4.8: BPM Yearly Graph Display in Android Application Result
48
4.2.2
Fusion Table Result
72 (BPM)
Figure 4.9: BPM Table in Google Fusion Table Result
Figure 4.10: BPM Graph in Google Fusion Table Result
49
Figure 4.11: BPM Yearly Graph in Google Fusion Table Result
The BPM data can be visualized with line plot graph as shown in Figure 4.10 and
Figure 4.11 provided by Google Web service.
50
CHAPTER 5
CONCLUSION
5.1
Conclusion
Overall this project is partially successful, due to the failure to design a selfsustained wireless sensor device. But two of the objectives were fulfilled which the
wireless sensor and the Android application is successfully developed.
Firstly, the wireless sensor device is able to measure heartbeat and display on the
device. Secondly, the Android application is able to display and store the BPM data. The
BPM data is well organized and visualized by using Google Fusion Table.
The energy harvester power supply is not working because the large super
capacitor (10F/2.5V) used is too hard for the piezoelectric film to charge it up to the
desired voltage.
51
5.2
5.2.1
Future Work
Recommendation
In this project, there is still lot more rooms for future improvement to produce a
better project. Therefore, there is some recommendation is given below for further
research:
i.
A super capacitor with low Equivalent Series Resistance (ESR) is highly
recommended to replace the super capacitor used in this project. Low ESR is
also called low impedance. The current dissipated is higher than the normal super
capacitor with lower voltage operation.
ii.
The wireless sensor device size can be reduced to minimum the power
consumption. The 7 segment display can be replaced with few LEDs because 7
segment display drawn a lot of current.
iii.
The sensor used in this project is not so accurate because it easily influence by
the noise. Wearable sensor is recommended.
52
REFERENCES
1.
2.
3.
4.
5.
6.
7.
8.
9.
10.
11.
12.
Mandy, Y., et al. An innovative system of health monitoring using mobile phones. in eHealth Networking, Applications and Services (Healthcom), 2012 IEEE 14th
International Conference on. 2012.
Chiew-Lian, Y. and C. Wan-Young. IEEE 802.15.4 Wireless Mobile Application for
Healthcare System. in Convergence Information Technology, 2007. International
Conference on. 2007.
Jung, S., iHealth Labs Announces iGlucometer to Better Monitor Your iHealth. 2012.
Webster, S. Zeo Sleep Manager: Review. 2011.
Tan, Y.K. and S.K. Panda, Review of Energy Harvesting Technologies for Sustainable
WSN, Sustainable Wireless Sensor Networks. 2010.
AIMI, I.N.B.M.N., EZ430-CHRONOS WATCH AS A WIRELESS HEALTH MONITORING
DEVICE, 2010/2011, UNIVERSITI TEKNOLOGI MALAYSIA.
NADIAH, I.N.S., DEVELOPMENT OF ECG WIRELESS SENSORS BOARD FOR MEDICAL
HEALTHCARE APPLICATION, 2008/2009, UNIVERSITI TEKNOLOGI MALAYSIA.
Lam, S.C.K., et al. A smartphone-centric platform for personal health monitoring using
wireless wearable biosensors. in Information, Communications and Signal Processing,
2009. ICICS 2009. 7th International Conference on. 2009.
Piezoelectric Energy Harvester Datasheet. [cited 2013 February 20]; Available from:
http://www.mide.com/products/volture/v25w.php.
Cytron Product User's Manual-Bluebee. July 2012 [cited 2013 March 20];
V1.0:[Available from:
https://docs.google.com/document/d/1Ede2xY3fVUelWWyV4ZRyVhFJDKvhCV0xHWSP
P1n7Rjg/edit.
Cytron Product User's Manual-LC04A Logic Converter 4 Channels. June 20, 2012 [cited
2013 March 25]; Available from:
https://docs.google.com/document/d/1zgs6MYnB_CsZbfq2j_qVIkmR3D1t84ZaVw7RBo
UjYoI/edit.
LM324N Quad Operational Amplifier. [cited 2013 February 22]; Available from:
http://www.cytron.com.my/datasheet/IC/linear/LM324N.pdf.
53
Appendix A
Wireless Sensor Device Schematic
s ddf
54
Appendix B
Energy Harvester and Voltage Regulator Schematic
55
Appendix C
Microcontroller Source Code
#include<htc.h>
__CONFIG(0x3f0A);
//Crytal Declaration
#define _XTAL_FREQ 10e6
//Port Declaration
#define start RA2
#define reset RA5
#define IR_Tx RA3
#define X RA5
#define DD0_Set RA1
#define DD1_Set RA0
#define A RB4
#define B RB5
#define C RB6
#define D RB7
//Variable Declaration
unsigned short DD0, DD1;
unsigned short pulserate, pulsecount;
unsigned int i, j, k, y;
//Prototype Declaration
void uart_send (char data);
56
char uart_receive (void);
//Delay_debounce Function
void delay_debounce(){
__delay_ms(300);
}
//Delay Function
void delay_refresh(){
__delay_ms(5);
}
//Delay2 Function
void delay2 (int d)
{
for (int i=0;i<d;i++)
{;}
}
//BPM Measurement Function
void countpulse()
{
IR_Tx = 1;
delay_debounce();
delay_debounce();
TMR0=0;
__delay_ms(15000); // Delay 15 Sec
IR_Tx = 0;
pulsecount = TMR0;
pulserate = pulsecount*4;
}
57
//Binary number 0-9 for 7 Segment Display Function
char mask(unsigned char num)
{
switch (num)
{
case 0 :
{
return 0B00001111;
}
case 1 :
{
return 0B00011111;
}
case 2 :
{
return 0B00101111;
}
case 3 :
{
return 0B00111111;
}
case 4 :
{
return 0B01001111;
}
case 5 :
{
return 0B01011111;
}
case 6 :
58
{
return 0B01101111;
}
case 7 :
{
return 0B01111111;
}
case 8 :
{
return 0B10001111;
}
case 9 :
{
return 0B10011111;
}
} //case end
}
//Character number 0-9 for Bluetooth Send Function
char charc(unsigned char num)
{
switch (num)
{
case 0B00001111 :
{
return '0';
}
case 0B00011111 :
{
return '1';
}
59
case 0B00101111 :
{
return '2';
}
case 0B00111111 :
{
return '3';
}
case 0B01001111 :
{
return '4';
}
case 0B01011111 :
{
return '5';
}
case 0B01101111 :
{
return '6';
}
case 0B01111111 :
{
return '7';
}
case 0B10001111 :
{
return '8';
}
case 0B10011111 :
{
return '9';
60
}
} //case end
}
//BPM display in 7 Segment Display Function
void display()
{
DD0 = pulserate%10;
DD0 = mask(DD0);
DD1 = (pulserate/10)%10;
DD1 = mask(DD1);
//7 Segment Display Switching Loop
for (i = 0; i<=180*j; i++)
{
DD0_Set = 1;
DD1_Set = 0;
PORTB = DD0;
delay_refresh();
DD0_Set = 0;
DD1_Set = 1;
PORTB = DD1;
delay_refresh();
}
uart_send (charc(DD0));
uart_send (charc(DD1));
DD0_Set = 0;
DD1_Set = 0;
}
//UART sending subroutine
61
void uart_send (char data)
{
while(!TXIF) continue;
TXREG = data;
}
//UART receiving subroutine
char uart_receive (void)
{
if(OERR == 1)
{
CREN = 0;
CREN = 1;
}
while(!RCIF) continue;
return RCREG;
}
void main()
{
CMCON = 0x07;
// Disable Comparators
TRISA = 0b00010100;
// RA4/T0CKI input, RA5 is
TRISB = 0b00000000;
// RB output
OPTION = 0b00101000;
// Prescaler (1:1), TOCS =1
pulserate = 0;
//Initialize pulserate
I/P only
for counter mode
TX9 = 0;
RX9 = 0;
// Bluetooth Setting
62
SYNC = 0;
BRGH = 1;
ADEN = 0;
SPBRG = 64;
TXEN = 1;
CREN = 1;
SPEN = 1;
while(1) {
if(!start)
{
delay_debounce();
countpulse();
j= 3;
display();
}
} // Infinite loop
}
63
Appendix D
MIT App Inventor Graphical Programming
64
65
66
67
68
Appendix E
Cost of the Project
1
2
3
4
5
6
7
8
Parts/Components
LTC-3588-1
Piezoelectric Energy Harvesting Power
Supply
PIC16F628
Cytron Bluetooth Module
LM324N Op-amp
3.7 Rechargeable Battery
Piezoelectric Energy Harvester
10F/2.5V Supercapacitor
Miscellaneous
(resistors, capacitors, connectors, wires, etc)
Total
QTY
Unit Price(RM) Price(RM)
1
100.00
100.00
1
1
1
1
1
2
20.00
34.00
1.65
13.00
250.00
48.00
20.00
34.00
1.65
13.00
250.00
48.00
1
150.00
150.00
623.65