1
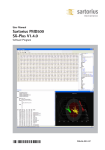
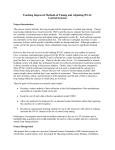
User Manual
Sartorius PMD500
SX-Suite
Software Program
98646-003-05
Contents
5
5
5
5
5
5
5
5
6
6
6
6
6
6
6
6
6
7
7
1 REVISION HISTORY
Version 1.6.8 – 2007-12-14
SX-Center V2.0
Version 1.6.7 – 2007-11-12
SX-Backup V2.0
SX-Config V2.0
SX-Server V2.0
SX-Center V2.0
Version 1.6.6 – 2007-06-08
Version 1.6.5 – 2007-05-25
SX-Server V1.9.23
SX-Center V1.9.30
Version 1.6.4 – 2007-04-20
SX-Server V1.9.19
SX-Center V1.9.28
Version 1.6.3 – 2007-01-16
Auditing System
SX-Server V1.9.18
Version 1.6.3 – 2007-02-05
(continued)
7 SX-Center V1.9.27
8 SX-Backup 1.8.11
8 Version 1.6.3 – 2007-02-05
(continued)
8 SX-Config V1.8.12
8 SX-Test V1.4.5
8 Version 1.6.2 – 2007-01-16
8 Version 1.6.1 – 2007-01-08
8 Version 1.6.0 – 2006-12-21
8 SX-Center Version 1.9.23 or later
9 SX-Server Version 1.9.15 or later
9 Version 1.5.9 – 2006-12-06
9 Version 1.5.8 – 2006-11-20
9 Version 1.5.7
9 Version 1.5.6
10 Version 1.5.4-2006-06-22
2
11 2
INTRODUCTION
12 3 INSTALLATION
13
13
14
14
14
14
14
14
14
14
14
14
14
14
14
14
15
15
15
15
15
15
15
15
16
16
16
16
16
16
16
4 SX-SERVER
4.1 User interface
4.2.1 Unit
4.2.1.1 Port
4.2.1.2 Target
4.2.1.3 Gain
4.2.1.4 Reverse lamp
4.2.1.5 Ref.Interval
4.2.1.6 Ref. EDY
4.2.1.7 Feeder
4.2.2 Spectrometer
4.2.2.1 High sensitivity, integration time
4.2.2.2 Scans
4.2.2.3 VIS Gain
4.2.2.4 VIS Offset
4.2.2.5 Detector Temp
4.3 Application settings
4.3.1 Data evaluation
4.3.1.1 Low / High Range Mask
4.3.1.2 Lead in, Lead out /
4.3.1.3 Data Rate
4.3.2 Camera
4.3.2.1 Channel
4.3.2.2 Image processing
4.3.2.2.1 Zoom <1-5>
4.3.2.2.2 Calibrate <x> <y> <dy> <dx>
<level>
4.3.2.2.3 Brightness <0-200>
4.3.2.2.4 Contrast <0-200>
4.3.2.2.5 Gamma <0-20>
4.3.2.2.6 Crop <x> <y> <size
4.3.2.2.7 Push
16
16
16
16
16
16
16
16
16
17
17
17
17
17
17
17
17
17
17
17
17
17
17
17
18
19
19
20
21
21
21
21
21
21
22
4.3.2.2.8 Pop
4.3.2.2.9 Save
4.3.2.2.10 Load
4.3.2.2.11 Display <zoom>
4.3.2.2.12 Grey
4.3.2.2.13 Median <radius>
4.3.2.2.14 Derivative <distance>
4.3.2.2.15 Transcode <red> <green>
<blue>
4.3.2.2.16 Color <red> <green> <blue>
4.3.2.2.17 Negative
4.3.2.2.18 Stretch <sigma>
4.3.2.2.19 Flat <raster>
4.3.2.2.20 Compute
4.3.2.2.21 Sigma
4.3.2.2.22 Threshold <level>
4.3.2.2.23 Count <size>– replaces
aperture
4.3.2.2.24 Max <area> <size>
4.3.2.2.25 Min <area> <size>
4.3.2.2.26 Result <1-4>
4.3.2.2.27 Break
4.3.2.3 Image processing examples
4.3.2.3.1 Basic setup
4.3.2.3.2 Counting black spots
4.3.2.3.3 Counting black and brown
4.3.2.3.4 Counting large yellow grains
5.2.4 Create a order report
5.2.5 Create a new recipe
5.2.6 Recall journal data
5.3
Today
5.3.1 Selecting an instrument
5.3.2 Actions
5.3.2.1 1-24 hour graph
5.3.2.2 Export results
5.3.2.3 Export data
5.4 Order
22
22
22
22
22
22
22
23
23
23
23
23
23
23
23
23
23
23
24
24
24
24
24
25
25
25
25
25
25
25
25
25
26
26
26
26
26
26
5.4.1 Actions
5.4.1.1 New Order
5.4.1.2 Remove Order
5.4.1.3 Create Report
5.5 Recipes
5.5.1 Actions
5.5.1.1 New Recipe
5.5.1.2 New parameter
5.5.1.3 Remove entry
5.5.1.4 Copy entry
5.5.2 Fields
5.5.2.1 Name
5.5.2.2 Parameter
5.5.2.3 Calibration File
5.5.2.4 Bias & Slope
5.5.2.5 Target, Tolerance, Min & Max
5.5.2.6 Average
5.5.3 Process control fields
5.5.3.1 Output
5.5.3.2 Control
5.6 Batches
5.6.1 Actions
5.6.1.1 1-24 hour graph
5.6.1.2 Export results
5.6.1.3 Export data
5.6.1.4 Reload data
5.6.1.5 Merge batch-file
5.7 Classes
5.7.1 Actions
5.7.1.1 Derivative
5.7.1.2 Method
5.7.1.3 Autoidentify
5.8 Journal
5.8.1 Actions
5.8.1.1 Export data from today
5.8.1.2 Export all data
5.8.1.3 Create QC-Report
5.8.1.4 Reload data
3
27
28
29
29
29
29
29
29
29
29
29
29
30
30
30
30
31
6 SX-REMOTE
Configuration
7 TECHNICAL INFO
7.1 Files and Folders
7.1.1 Application files
7.1.2 Data tables
7.1.3 Calibration files
7.1.4 Exported data
7.1.5 Remote data
7.1.6 Reports
7.1.7 Spectral and Image data
7.2 Single or Multi-User
configuration
7.3 Registry
7.3.1 Single user mode
7.3.2 Multi-User
7.3.3 Multi-Configuration use
7.4 Data redirection
32 8 PROCESS CONTROL
32 8.1 General
32 8.2 ADLINKTECH PCI-6308A board
4-20mA Interface
33 8.3 DataLab IOu/USB
33 8.3.1 Process output signal
34 8.3.2 Process Control
34 8.3.3 Process Alarm
34 8.3.4 Journal auto-sampler
34 8.4 Communication format
35 8.5 Semantic
35 8.6 Commands and their function
35 8.6.1 Alarm query
35 8.6.2 Status query
35 8.6.3 Values query
35 8.6.4 Tolerance query
36 8.6.5 Batch assign
36 8.6.6 Product assign
36 8.6.7 Order assign
36 8.6.8 Journal assign
36 8.6.9 Batch query
4
37 8.6.10 Product query
37 8.6.11 Order query
37 8.6.12 Journal query
The following symbols are used in these
instructions:
§ indicates required steps
$ indicates steps required only under certain
conditions
> describes what happens after you have
performed a particular step
– indicates an item in a list
ì indicates hazard
1 Revision History
Version 1.6.8 – 2007-12-14
alias, allow filter to assign recipe to
specific instrument
SX-Center V2.0
- CHANGE: Process interface command “Q”
and “q” changed, see paragraph 8.6
- EASE OF USE: Allow direct entry of order
in Today
- CORRECTION: Corrected text to DAIO
process control
- EASE OF USE: Always auto-width columns
based on displayed data in header
Version 1.6.7 – 2007-11-12
SX-Backup V2.0
- CORRECTION: Software failed to delete
hidden files
SX-Config V2.0
- NEW: Allow to enter license keys
- NEW: JCAMP option for SX-Server
SX-Server V2.0
- EASE OF USE: Add button to block/accept
spectra
- CORRECTION: VIS Gain & Offset is re-sent
upon Lamp ON
- NEW: SX-Server now creates JCAMP-DX
files when flag “JCAMP” DWORD in key
“SX-Server” is set to 0xfffffffff. File is
placed in .\Data named as .sxd file but
with extension .dx
- EASE OF USE: User interface for settings
has changed to hardware and application
block
SX-Center V2.0
- FIX: Back-up tables every hour; Save
compressed copy at midnight
- EASE OF USE: Always display recipe dropdown, remember last 3 selections, allow
- EASE OF USE: Add reminder if operator
enters target values but forget to set
check-mark.
- EASE OF USE: Allow recipe alias, move
parameter, global rename (propagate to
journal), instrument mask
- COMPLETION: Display current
Homogeneity as current value. LIMIT –
only works for one instrument when
selected batch is currently running batch
- NEW: Repeated actuation of Autosampler; this function allows a single
journal creation event to activate the
auto-sampler x times defined by
“DAIO_JournalPulses”
- CORRECTION: Block recipe names
containing “_”
- CORRECTION: Adding or removing a
sample is added to SX-Center Audit
- CHANGE: Auto calibration when leaving
journal or after 5 minutes
- CHANGE: Timeout for auto-calibration
increased to 5 minutes
- CORRECTION: When no recipe is selected
an error could occur
5
Version 1.6.6 – 2007-06-08
- FIX: Merge item was available outside
Today and caused a crash.
- Paragraph 5.3.1 revised
- FIX: Misalignment of XML report statistics
Version 1.6.5 – 2007-05-25
Version 1.6.4 – 2007-04-20
SX-Server V1.9.23
- FIX: Persistent detection of UVVIS model:
This ensures that any error condition will
cause red state rather than measurement
without UVVIS data. (Critical update for
and device using UVVIS spectrometer)
- FIX: Changes to number of Scans did not
affect measurement.
SX-Center V1.9.30
- NEW: Added “Action” to create journal
entries of measurements from “Today” and
“Batches” (For laboratory use)
- NEW: Automatic Journal data export now
denotes “.” as separator. Thereby data is
exported sub classed. A recipe name of
“Flour.550” would add data into
<snr>.Journal, <snr>.Flour.Journal and
<snr>.Flour.550.Journal; this allows global
calibrations with local class adjustments by
using <snr>.Flour.Journal followed by
<snr>.Flour.550.Journal in the calibration
project. It of cause also allows splitting
Rye flour from Wheat flour using
appropriate recipe names. (Needed for
recent customer installation using Autocalibration feature)
- NEW: Journal has new action to clean
unused entries – this function simply
removes any non checked items where no
reference value has been entered. Function
start at selected entry and spawn back in
time.
6
- MSI Packet Version 2.0.1.0
- USB-COM Driver Update
- Chapter 5.5.2 added
- Chapter 5.5.3 revised
SX-Server V1.9.19
- SX-Server supports DEBUG mode by
creating key HKLM\Software\NIROnline\SX-Server\DEBUG DWORD 101
SX-Center V1.9.28
- Error during Copy Recipe fixed
- Additional field in Recipe to pre-scale
output prior to transport over TCP/IP or
PROFIBUS. This allows to transport
numbers with 4 significant digits when
values are larger than 99.99 – Field is
added automatically – empty field equals
pre-scaler 1
- Memory foot-print reduced
- Erratic calibration files caused crash – now
causes outlier result
Version 1.6.3 – 2007-01-16
- MSI package version 2.0.0.0
Auditing System
- Auditing System has changed to create
shadow volume copies of entries, thus
deleting files will not remove actual files
from hard-drive. Recovery automation will
arrive in next update. As well as separate
software to read and print the Audit Trail.
SX-Server V1.9.18
- SX-Server no longer qualifies white values
of the Camera during internal NIRreference measurement. Thus the user
must ensure that SX-Server „Calibrate” is
active and that it’s not in saturation.
- SX-Server no longer creates a subfolder for
images if the image option isn’t active.
- SX-Server erratic display of left pane has
been resolved
- SX-Server now displays logger level 50 and
lower for configuration checking purposes.
Version 1.6.3 – 2007-02-05 (continued)
SX-Center V1.9.27
- When operating more than one instrument
over the process interface connection,
ordering one instrument to create a new
batch, second instrument to start a new
batch, other instrument to create a new
batch without receiving Data from SXServer caused 2 errors. 1 – Crash creating
report; Missing result for one of the batch
entries.
- Creating a new batch when no
measurement runs causes Trace display to
display “No Data”.
- Auditing on System interactions for the
process interface
- Auditing on user configuration added.
- Hitting cancel on “Select Folder Dialogue”
now terminates the software
- Optimization and corrections processing
VIS-NIR data.
- Software now remembers last selected
folder in the “Select Folder Dialogue”
- Software now monitor free available disk
space and will start to give warnings every
4 hours if available disk space is lower
than 128MB. Escalation will take place if
amount of free space drops below 16MB,
where message will arrive every minute.
- Software now defers to software
installation path for Templates if missing!
•
If Software fails to write measurement
data error is logged into the audit trail and
a error message will appear in the taskbar.
The machine state will reset – and SXCenter will show RED status. This will also
cause the error to propagate through the
process connection.
- German Templates sub-folder has changed
to “DE”
- Write permissions are tested on folders and
files prior to start, this ensures that you
have necessary access rights.
- Selecting a order in the order view now
updates field result.
- Order graphs are stored as hidden files to
prevent long lists of data.
- Order graphs may be turned OFF, stored as
bitmaps or jpeg files.
7
SX-Backup 1.8.11
- Now supports backup of files larger than
2/4GB depending on file-system.
- Now supports delete of old files on
completed backup; this function is not yet
fully validated.
- Now supports hidden type “Kill”, not yet
to be used by others than NIR-Online.
- Full Audit on user operations / Changes /
Accepting errors
Version 1.6.3 – 2007-02-05 (continued)
SX-Config V1.8.12
- Added option for SX-Backup to
automatically remove completed backup
files from source based on age of
modification; Pay attention to that this
function may invalidate your journal
functionality!
- Added option to define file extension for
delete after completing a backup.
- Added option for SX-Server to Activate
saving images of order reports and
selection of format BMP or JPEG.
- Adding further users with password as well
as changing default user and master
password revised.
SX-Test V1.4.5
- Expanded to support wavelength checking
using Hg and Ar light-sources.
Version 1.6.2 – 2007-01-16
- MSI package version 1.10.0.0
- SX-Server: problem with settings int-time
and scans using VIS spectrometer fixed
- SX-Server: Additional settings for UVVIS
Spectrometer offset and gain.
- SX-Server: Average of image data
corrected, data-rate can now be set to
other value than 0 using a camera device.
- SX-Config: activate/deactivate of SX-Profi
auto-run corrected
SX-Center: New licenses for activating
Auto calibration feature
- SX-Center: Auto-calibration option added
- SX-Center: You can now open a Autocalibration project directly from the recipe
- SX-Center & SX-Server now have a larger
foot-print but are about 2 times faster.
- SX-Center: Full Audit is created for
calibration changes and adjustments.
Version 1.6.1 – 2007-01-08
Version 1.6.0 – 2006-12-21
SX-Center Version 1.9.23 or later
- Journal can now automatically print a
label.
- Report templates have moved to folder
.\Templates
8
- Templates for .psx files have moved to
.\Templates
SX-Server Version 1.9.15 or later
- Remove/Add unit removed. Realized with
SX-Config.
- .psx file header text are multilingual
- Journal now exports each recipe into a
different file.
- Default value for reference measurement is
changed from 60 to 0.
Version 1.5.9 – 2006-12-06
- Minimized traces (Target=0) is now spread
over more than one line.
- Misalignment of trace spectra fixed.
Version 1.5.8 – 2006-11-20
- Instructions for installing drivers for the
DataLabIO device.
- Additional time lines of graphs.
- Graphs of class calibrations now lists all
class targets.
- Order reports of one batch now lists
parameter results with parameter name.
- Client version is realize through special
license key.
- Crash marking first journal entry fixed.
- Change to output for signaling parameter
out of tolerance.
- Change for output global status on
channel , see SX-Config parameter “DAIO
Alarm” – Default output is 8.
- Pressing instrument button causes output
to go high, after time [ms] low, see SXConfig parameter “DAIO Journal” and
“DAIO JournalTime”, Defualt is 0 =
Deactivated.
- Journal delay was not properly used, fixed.
- Today module can not be deactivated.
- Background of spectral view turned white
upon recipe change, fixed.
- The changes are valid for SX-Center V1.9
Build 20 or later, SX-Config V1.8 Build 4.
Version 1.5.7
- Format corrections
- Block edit of field SNR in journal.
Version 1.5.6
- Disable popup cut in recipes.
- Exporting journal data now creates ID’s
with entered values, for missing entries
date and time is used.
- Changes in Process output signal process
and Process control
- Tables now support Copy and Paste.
9
Version 1.5.4-2006-06-22
- Process output through DataLab IO
interface described section 4.5 and 7.3
- “Recepie” replaced by “Recipe”; Software
SX-Center version 1.9 Build 12 or later
10
2. Introduction
The SX-Suite software allows operation
and control of up to 4 instruments. SXServer is background software
continuously communicating with the
instruments and storing raw measured
spectra, images and instrument status
information. SX-Center provides the
interpretation of the instrument data and
structures it to monitor and control any
type of process. SX-Remote allows other
users to view current and history data
through the company LAN network.
SX-Server is installed to automatically
start as the computer is started; this is
done to ensure that any measurement
data is stored. If the computer is
configured into a LAN network you
should make sure that log-in is completed
automatically and doesn’t require
entering a username or password. The SXServer software starts without user
interface and is visible as and icon in the
system tray which reflects the softwares
actual state:
Red
= No connection to the
instrument
Yellow = Measurement stopped
Green = Measuring
All software uses current XP-style explorer
interface – displaying commands and
status on the left hand side of the
software frame and the selected date on
the right hand side. The operation of the
software requires a pointing device such
as a trackball/mouse or touch screen.
11
3 INSTALLATION
To install the software insert the CD into
the drive. If the installation software
doesn’t start automatically locate the file
“install.htm” on the CD and open it.
§ Click SX-Suite or SX-Remote to start
installation
§ In the “Download” dialog select “Open”.
§ If you are updating from an earlier version
this dialogue will appear, start by
removing previous version. Start the .msi
package again and follow the instructions.
§ To start installation follow the command.
12
4 SX-SERVER
4.1 User interface
After program installation an icon appears
in the system tray (lower right hand
corner) of your desktop; Status of the
software is shown as a speechbubble. By
right-clicking the icon a menu appears.
Selecting “Open SXServer” displays the
user interface.
4.2 Hardware configuration
Click the left pane “Hardware”, a
password dialog may appear – enter
correct password and press enter.
13
4.2.1 Unit
4.2.1.1 Port
Check option to open port. Enter
appropriate parameters before
corresponding to installed hardware as
follows <port number>, <baud rate>,
<parity>, <data bits>, <stop-bits>. Port
setting may range from 1 to 9; baud rate
may be 19200 or 38400 (See instrument
manual for specification); parity, data bits
and stop-bits always read “n,8,1” unless
otherwise explicitly defined.
4.2.1.6 Ref. EDY
Defines maximum noise during Dark and
White measurement
4.2.1.7 Feeder
Check-mark is used to activate /
deactivate feeder / X-Rot operation. The
setting on the left is the time defined for
emptying the remaining sample from the
feeder – can be set to 0 for X-Rot.
Second setting defines duty-cycle of the
feeder; 1= Continious; 2 = Every second
measurement and so on...
4.2.2 Spectrometer
Select the appropriate device type. The
system will normally detect this setting
and change it automatically.
4.2.1.2 Target
Target for the instrument temperature
control-circuit, this circuit will heat or
cool as needed. If checked the
measurement will wait until temperature
target has been reached.
4.2.1.3 Gain
Sets the gain associated with controlling
the temperature, if checked this parameter
will be automatically optimized by the
software.
4.2.2.1 High sensitivity, integration time
If checked the gain of the spectrometer is
increased by a factor of 10; this allows
you to capture the spectrum very fast –
typically 3ms. This option is normally not
checked. The integration time states the
number of milliseconds the CCD gate is
open to capture the spectrum energy –
typical value is 30.
4.2.2.2 Scans
Sets the number of scans co-added for
one measurement; typically it is set to 15
giving a measurement once per second.
4.2.2.3 VIS Gain
4.2.1.4 Reverse lamp
Checking this option activates the spare
lamp rather than the normal lamp.
4.2.1.5 Ref.Interval
Defines time between internal dark and
white calibration. The default setting 0
will trigger reference measurement upon
temperature change.
14
4.2.2.4 VIS Offset
4.2.2.5 Detector Temp
Displays the current temperature of the
instrument.
4.3 Application settings
4.3.1 Data evaluation
4.3.1.1 Low / High Range Mask
Defines a mask for the spectra. By double
click the current spectra is used to set
values.
Clicking the „+” button releases current
spectra; Clicking the „-„ button blocks
current spectra
4.3.1.2 Lead in, Lead out /
Defines number of spectras that needs to
be inside the mask before measurement
begins and number of spectras that needs
to be outside the mask for a measurement
to end.
4.3.1.3 Data Rate
Determine how often spectral data is
stored. 0 = Every spectra is stored; 5 =
Average over the last five seconds is
stored every five seconds.
4.3.2 Camera
4.3.2.1 Channel
Only available when an X-Two instrument
is connected. Enables image processing if
checked. Enter the channel of the
framegrabber card in the textbox.
There are several algorithms available for
image processing, the parameters of
which may be adjusted via the control
bars below. These adjustments are done
by service technicians.
4.3.2.2 Image processing
A list of image processing steps made on
15
each captured image, at least one of the
processing steps giving a result shall be
used. The image processing steps may be
modified by a context menu clicking the
right mouse key. Items may also be
modified using the keyboard as follows:
Insert key adds one line after the selected
one, Delete key removes the selected row,
pressing key up or down moves the
processing step up or down in the list. A
processing step may be selected and its
parameters may be changed using the slide
bars.
4.3.2.2.1 Zoom <1-5>
Sets the overall display zoom factor for
the images.
4.3.2.2.2 Calibrate <x> <y> <dy> <dx>
<level>
Calibrates the camera response by a
reference object. Adjust parameters to
position of image squares, finally adjust
level by a reference color sample
4.3.2.2.3 Brightness <0-200>
Adjusts brightness of image.
4.3.2.2.4 Contrast <0-200>
Adjusts contrast of image.
4.3.2.2.7 Push
Saves the current image for further
processing.
4.3.2.2.8 Pop
Restores the previous Pushed image
4.3.2.2.9 Save
Stores the current picture for display in
SX-Center.
4.3.2.2.10 Load
Restores the saved picture.
4.3.2.2.11 Display <zoom>
Displays the current processed image in
SX-Server.
4.3.2.2.12 Grey
Combines the red, green and blue channel
to a grey image.
4.3.2.2.13 Median <radius>
Applies a filter to the image replacing
each pixel with its median value over a
circular aperture
4.3.2.2.14 Derivative <distance>
Replaces image with its derivative
representation.
4.3.2.2.5 Gamma <0-20>
Adjusts image intensity linearity
according to gamma.
4.3.2.2.15 Transcode <red> <green>
<blue>
Replaces the image with and absolute
difference from a specific color and
intensity. Used to detect a certain color.
4.3.2.2.6 Crop <x> <y> <size
Defines the used square of the image.
Square is displayed as a red box within
the image.
4.3.2.2.16 Color <red> <green> <blue>
Masks the respective color planes.
16
4.3.2.2.17 Negative
Replaces the image with it’s negative
representation. Used to assess white areas
rather than black.
4.3.2.2.18 Stretch <sigma>
Recomputes image content such that
intensity distribution is centered and that
whole distribution represent x of original
image sigma. Used to normalize for grey
level and particle size.
4.3.2.2.19 Flat <raster>
Adjust image contrast by computing
actual image contrast over raster by raster
squares and normalizing each pixel to
highest intensity. Used to cancel out
illumination differences.
4.3.2.2.20 Compute
Computes absorbency of red, green and
blue as well as their distribution and
displayed Histogram in the original image.
4.3.2.2.21 Sigma
- not yet defined 4.3.2.2.22 Threshold <level>
Replaces image with a black & white
image using the set level of intensity.
4.3.2.2.23 Count <size>– replaces
aperture
Counts number and area of spots larger
than size. Will display detected spots as
follows: to small spots using a red circle,
exactly equal to size in yellow and larger
spots in green. Count represents number
of spots equal or larger than size. Area is
expressed as fraction of total area.
4.3.2.2.24 Max <area> <size>
Evaluate the result of Count to access if
value is to be regarded. This is used to
filter out outliers caused by
nonrepresentative images.
4.3.2.2.25 Min <area> <size>
See max, used to filter out too small
values.
4.3.2.2.26 Result <1-4>
Stores the current result if not filtered in
position one through four.
4.3.2.2.27 Break
Exits further processing.
4.3.2.3 Image processing examples
4.3.2.3.1 Basic setup
-Calibrate 32 29 143 3 1
-Crop 64 32 248
-Compute
-Save
4.3.2.3.2 Counting black spots
…Basic setup…
- Flat 5
- Stretch 3
- Display 1
- Threshold 0
- Count 1
- Result 1
4.3.2.3.3 Counting black and brown
…Basic setup…
- Flat 5
- Stretch 3
- Push
- Display 1
- Threshold 0
17
- Count 1
Result 1
- Pop
- Threshold 112
- Count 2
- Result 2
4.3.2.3.4 Counting large yellow grains
…Basic setup…
- Flat 5
- Transcode 255 255 0
- Negative
- Threshold 90
- Median 5
- Count 200
- Max 500000 40
- Result 1
18
5 SX-CENTER
5.1 User interface
5.2 How to….
•
•
•
5.2.1 View instrument data
In “View” menu select “Today”
Select the instrument by clicking the
instrument caption bar. The latest data set
captured with this instrument will
automatically be displayed in a chart.
5.2.2 Select a recipe
In “View” menu select “Today”
•
In the menu of an instrument click the
current recipe.
•
In the combo-box select the desired recipe
•
5.2.3 Recall batch data
In “View” menu select batches
•
•
In the list of batches select the batch of
interest
5.2.4 Create a order report
In “View” menu select “Orders”
•
Select the order you want to create the
report for
•
In “Actions” menu click “Create Report”
•
In “Status” menu a link to the report will
be shown – click it to view and/or print
the report
•
5.2.5 Create a new recipe
In “View” menu click “Recipes”
•
In Actions click “New recipe”
19
•
Enter a recipe name – Note. This recipe
name must be different to the existing
recipes.
•
Enter the parameter name and select the
appropriate calibration
•
Use command “New parameter” to add
further parameters
Each parameter incorporates the
following values:
-
Bias - constant adjustment of the result
-
Slope
-
Target - used for the graphical
representation “Traces”
-
Tolerance – Maximum allowed deviation
from target before curve turns yellow; if
tolerance is exceeded by 1.5 times the
tolerance the curve will become red. While
positive values give the tolerance in
positive and negative direction, negative
values are read only as maximum.
•
20
5.2.6 Recall journal data
In “View” menu click “Journal”
•
Search the item of interest in the journal
and select it.
•
The trace graph will show X seconds of
data around point of time when
instrument button was pressed
5.3
Today
The today view gives access to current
data.
5.3.1 Selecting an instrument
The instruments are listed on the right
hand side of the screen, the selected
instrument will appear in a different
color. To select the instrument simply
click on the bar with the instrument
name. The bar also displays state of
equipment where a red mark = instrument
off or error, yellow = tempering or not yet
ready. Dark green = ready, waiting for
sample, Bright green = measuring.
5.3.2 Actions
5.3.2.1 1-24 hour graph
To display all data select a batch during
the day you would like to display. Click
“24hour diagram”. The data will be
display in the trace view.
5.3.2.2 Export results
See “Batches” 5.6.1.2.
5.3.2.3 Export data
To export data mark the check boxes of
the lines you would like to export. Click
“Export data”. To find exported data click
“Exported data” in Locations. In the
Explorer window locate the file created
name will be “<YYYY-MMDD>.
batches.xls”
21
5.4 Order
This view serves to manage orders. For
each order, there is a line in the table.
Additional fields can be selected by rightclicking in the tob-line of the table. All
active fields will appear on the report.
5.4.1 Actions
5.4.1.1 New Order
Click “New Order”. The field number will
be enabled for editing. Enter the order
number – this number must be unique.
Enter a scheduled date – this date is used
to control which order to display in the
order drop-down-menu in the today view.
5.4.1.2 Remove Order
Select the item you would like to remove,
the item may not be checked. Click
“Remove order”
5.4.1.3 Create Report
Select the item. Note that there should be
a batch reference in the “Batch” field.
Click “Create Report”. A word document
with order information and batch traces
will be created. To open the report click
the report name located in the block
Status just below Actions.
5.5 Recipes
5.5.1 Actions
5.5.1.1 New Recipe
Click “New Recipe…” Enter the name of
the Recipe. Select a Calibration and enter
a parameter name. Enter other values as
appropriate.
22
5.5.1.2 New parameter
Select the Recipe that you want to add a
parameter to. Click “Add parameter” a
new line will appear. Select a calibration
and enter a parameter name. Enter other
values as appropriate.
5.5.1.3 Remove entry
Select the last parameter. Click “Remove
Entry”. To protect against accidental
removal, entries needs to be removed
bottom up.
5.5.1.4 Copy entry
First Select any one parameter in the
recipe you want to copy. Select copy
action, enter the new name of the recipe.
5.5.2 Fields
5.5.2.1 Name
A unique name for the recipe, if you
don’t check the checkmark the recipe will
be hidden and not available in the Today
view for selection.
5.5.2.2 Parameter
Text that appears in the Today view to
name the value; this name also appears
on reports and in the journal.
5.5.2.3 Calibration File
A reference to the calibration model used
to convert the measured spectra into a
property. If you change a calibration you
may be asked if you want to change all
references to this calibration. This is very
useful if you have many recipes using the
same calibration. You will also be
prompted to reset any Bias adjustments
to Zero – it is the normal procedure to
reset any Bias adjustments when you
change your calibration.
5.5.2.4 Bias & Slope
Used to adjust the output by taking value
produced by the calibration, multiplying
it with the slope and then adding the
bias. Slope adjustments are uncommon.
5.5.2.5 Target, Tolerance, Min & Max
Target sets the mid point of the graphical
trace and represents the target for any
process control. Tolerance is a symmetric
allowed tolerance; any value outside the
Target+/-Tolerance will cause an Alarm
condition. If Tolerance is zero you can set
asymmetric tolerances, e.g. max 0.1
means that any value higher than
Target+0.1 will cause an error. Likewise
Min value can be used to create a lower
limit for alarm. If you set Target to 0,
Max to 0 and Min to 0 no graphical trace
will be displayed for this parameter.
5.5.2.6 Average
Average denotes the time (in seconds)
window of data to create a current value
output to the display and for process
control purpose. The Average setting of
the first parameter also denotes the time
between each data-point in the graphical
traces.
5.5.3 Process control fields
Limitations and Implications: The process
control interface requires one DataLabIO
device per equipment; You can’t output
results from one instrument over more
than one DataLabIO device. The
DataLabIO device will only support 4
channels of 4-20mA and 4 channels of 19V eventhough hardware can be
reconfigured.
23
5.5.3.1 Output
A number between 1 and 4, determinates
output port for current value in the range
of 4-20mA on the DataLab IO device.
Range of calibration is used to scale the
output. A number between 5 and 8,
determinates output port for current
value in the range of 1 to 9V on the
DataLabIOu device. A negative value in
the range of -1 to -4 will cause an alarm
using 20mA for alarm and 4mA for no
alarm. A negative value of -5 to -8 will
cause an alarm using 9V for alarm and 1V
for no alarm. You may combine more
than one parameter for Alarm. E.g. setting
2 parameters to -2 will cause an alarm of
20mA on output 2 if any one of the 2
parameter are outside your specified
target and tolerances. Note. Alarms are
delayed by 120 seconds.
5.5.3.2 Control
A direct process control can be activated
by using this field. Value equals port and
sign denotes process influence. Output is
either 4-20mA for port 1 to 4 and 1 to
9V for port 5 to 8. Setting the value to 1
will cause the output to increase
periodically if value is lower than target.
Setting it to -1 will cause output to
periodically increase if value is higher
than target. Each time the sample “goes
away” or an Alarm is triggered the control
will reset and begin from 4mA/1V. Output
channel is defined by value.
5.6 Batches
5.6.1 Actions
5.6.1.1 1-24 hour graph
See 5.3 Today
24
5.6.1.2 Export results
To export result mark the check boxes of
the lines you would like to export. Click
“Export results”. To further view data
click “Exported data” in Locations. In the
explorer window locate the file created.
Name is: “<SN.YYYY-MMDD>.data xls”
5.6.1.3 Export data
See 5.3 Today
5.6.1.4 Reload data
This functions will reread all spectral data
from SX-Server and create the batch
entries. This is only required if the SXCenter software was not running as data
was being measured.
5.6.1.5 Merge batch-file
This function merges a “Batches.psx” file
with the current. This is only required if
data is moved from one PC to another.
5.7 Classes
5.7.1 Actions
5.7.1.1 Derivative
Activate this option to asses on spectral
shape rather than spectral absorbance
5.7.1.2 Method
This setting defines how a spectrum is
classified to belong to a class or not.
Available is Correlation, Distance and
SIMCA
5.7.1.3 Autoidentify
This setting defines if a continuous
assessment of class belonging is made
and the time of data to use in seconds.
25
5.8 Journal
5.8.1 Actions
5.8.1.1 Export data from today
Exports all entries selected of the
currently selected day
5.8.1.2 Export all data
Exports all entries selected from currently
selected.
5.8.1.3 Create QC-Report
This action is a custom function –
implementation is described separately.
The QC-Report is now created as an Excel
XML report with one recipe per page.
5.8.1.4 Reload data
This action reloads all SX-Server data to
find button entries; any missing entries
will be inserted. This is only required if
the SX-Center software was not running
as data was being measured.
26
6 SX-REMOTE
SX-Remote delivers a simple Illustration
of measuring data on a PC being
connected in a network.
After starting the program this picture
appears
(1) On the left hand of the picture the
choice modules appear
(2) Current measuring data of the device
(3) Possibility to add or remove further
devices. You can choose a day in the
calendar by clicking at the respective day.
(4) The respective course of the
parameter is shown here. The graph will
be scaled and centered automatically if
you double-click with the left mouse
button on the graph. In order to show
data of the production process, please
press the left mouse button and move the
mouse to the right or left. In the window
being shown you will see the current
measuring value (5). In the header (6) the
median and the standard deviation of the
measured values are shown. On the left
edge of the graph (7) the highest and
lowest value is marked.
27
Configuration
While starting the program the first time
you have to add the respective measuring
device.You can do this by using the
function “add device”. After calling this
function the data dialog is shown. Here
you can choose only one data file. Search
in the network for the approved file of
the measuring PC and choose the remote
file for the chosen measuring device. For
example “Crop1.jjmmdd.rmt” and then
“flour1.jjmmdd.rmt” (jjmmdd means year,
month and day of the measured data).
Repeat this procedure until all devices are
added.
28
7 Technical Info
7.1 Files and Folders
7.1.1 Application files
Location: %Applications%1\SX-Suite
Filespec. Content
*.ocx
Application runtime
object
*.dll
Application runtime libraries
SX-Server.* Application files
SX-Center.* Application files
7.1.2 Data
Location:
Filespec.
Content
Size
Archive
tables
%Applications%\SX-Suite
*.psx
Data tables for Batches,
Recipes, Orders and
Journal
<1MB / year
YES
7.1.3 Calibration files
Location: %Applications%\SXSuite\Calibrations
Filespec. *.cal
Content
Calibration files
Size
<100kb / calibration
Archive
YES
7.1.4 Exported data
Location: %Applications%\SXSuite\Export*
Filespec. <YYYY-MM-DD>2.xls
Content
Exported NIR-results in
tab separated text-file
Size
Not defined
Filespec. <YYYY-MM-DD>.Data.xls
Content
Exported NIR spectral
data in tab separated
text-file
Size
Not defined
7.1.5 Remote data
Location: %Applications%\SXSuite\Remote*
Filespec. <YYYY-MMDD>.<INAME3>.rmt
Content
SX-Center prediction
data
Size
<2MB / day /
instrument
Archive
YES
7.1.6 Reports
Location: %Applications%\SXSuite\Reports*
Filespec. *.dot
Content
Word report templates
Size
Typ. 50kB/file
Archive
Filespec. <YYYY-MM-DD>
.<ORDERNUMBER4>.doc
Content
SX-Center trace data
Size
Not defined
Archive
YES
Filespec. <YYYY-MMDD>.<SNR>.doc
Content
SX-Center trace data
Size
Not defined
Archive
YES
7.1.7 Spectral and Image data
Location:
%Documents%\%User%\%Application
data%\SX-Suite\Data or
%Applications%\SX-Suite\Data and
%Documents%\%User%\%Application
data%\SX-Suite\Data\<SNR> or
%Applications%\SX-Suite\Data\<SNR>
Filespec. <YYYY-MMDD>.<
SNR>.sxd
Content
SX-Server raw spectra
29
Size
Archive
Filespec.
Content
Size
Archive
88MB/day
YES
<YYYY-MMDD>.<SNR>.bmp
SX-Server images
9+MB/day
YES
1 %...% - Windows configuration
parameter e.g. “C:\Program Files”
2 <YYYY-MM-DD> - Year month and
date reference relevant to data content
Environment\APPPATH and all settings
will be stored under
HKEY_CURRENT_USER\SOFTWARE\NIROnline.
7.3 Registry
7.3.1 Single user mode
As administrator read/write access rights
are needed for:
HKEY_LOCAL_MACHINE\Software\NIROnline
and its sub keys
As user read access rights are needed for:
3 Defined by SX-Server configuration
HKEY_LOCAL_MACHINE\Sofware\NIROnline\
SX-Server\#<1-4>\Name
4 <ORDERNUMBER> is defined in Table:
%Application%\SX-Suite\Orders.psx
7.2 Single or Multi-User configuration
At installation the software defaults to a
single user configuration. This mean that
an administrator account is used to
configure the measurement and
application, other user may only view the
results and may not interact with the
continuous measurement. In the single
user environment all application
configurations will be stored under
KEY_LOCAL_MACHINE\SOFTWARE\NIROnline.
A multi-user environment can be
activated by setting
HKEY_LOCAL_MACHINE\SOFTWARE\NIROnline\MultiUser
(DWORD) 0x00000001.
This will allow each user to take full
control of the measurement. In a
multiuser environment data will be stored
in accordance with
HKEY_CURRENT_USER\Volatile
30
HKEY_LOCAL_MACHINE\Software\NIROnline
and its sub keys
7.3.2 Multi-User
As user read/write access rights are
needed for:
HKEY_CURRENT_USER\Software\NIROnline
and its sub keys
7.3.3 Multi-Configuration use
By creating a subdirectory named “Users”
in the NIR-Online folder and setting the
HKEY_LOCAL_MACHINE\Software\NIROnline\XPATH to reference this folder the
SX-Center software will prompt to select a
subfolder of this folder. This allows you
to copy data (psx, sxd and .cal) files and
use these as one configuration. This is
useful to maintain and configure several
configurations and usage in application
development. By creating links to other
computers base SX-Suite folder running
SX-Center and exporting this computers
registry into a file named “Client.reg”
placing it into the SX-Suite folder, the
software will allow total remote control
and configuration.
7.4 Data redirection
For storage of data there is a re-direction
function. This redirection can be used to
store data at other locations i.e. on the
file-server of the network. Set these keys
to valid paths:
HKEY_LOCAL_MACHINE\Software\NIROnline\XPATH
General path, if setting is missing or
blank the application installation path is
used for single user mode and the
HKEY_CURRENT_USER\Volatile
Environment\APPPATH is used for a
multi-user environment.
The following settings override XPATH
setting:
HKEY_LOCAL_MACHINE\Software\NIROnline\TABPATH – 7.1.2 Data tables
HKEY_LOCAL_MACHINE\Software\NIROnline\CALPATH – 7.1.2 Calibration files
HKEY_LOCAL_MACHINE\Software\NIROnline\EXPPATH – 7.1.4 Exported data
HKEY_LOCAL_MACHINE\Software\NIROnline\RMTPATH – 7.1.5 Remote data
HKEY_LOCAL_MACHINE\Software\NIROnline\RPTPATH – 7.1.6 Reports
HKEY_LOCAL_MACHINE\Software\NIROnline\DATPATH – 7.1.7 Spectral and
Image data
31
8 Process Control
8.1 General
The software offers a number of
commands to automate selection of
recipe, feedback of current values and
automation of process documentation.
The communication is made through
RS485 (simplex traffic). Two registry keys
are used to configure the communication.
Settings the SPS_Port value to a larger
value than 9 will allow communication by
TCP-IP by computer IP and port defined.
Setting SPS_Host to a value different
than blank will enable UDP. The local
port for SX-Center will be SPS_Port
setting plus 1. Each instrument is
accessed through a unique address; this
allows a single channel communication
for all instruments operated by the SXCenter software. The link is created by
further registry keys starting with the
protocol start character > (greater than)
followed by a 2 character address. The
value of the key shall correspond to the
instrument serial-number. A further
parameter can be set to replace the order
of parameters, e.g. >A1_P0 set to 1
would shift each parameter result in a
circular fashion, thus responding to
command “b” and “j” with second recipe
parameter in c1, t1 and u11.
The software also implements a process
interface through 4-20mA signals using a
ADLINKTECH PCI-6308A board. This
interface is only implemented for a single
instrument as described in section 7.2.
Configuration of card is found in registry.
This value shall correspond to board
address defined by on board jumpers. See
Manual for PCI-6308A board.
32
The software also offers a connection
through a USB to 4-20mA interface from
DataLab; this interface can be provided
with up to 32 outputs. See section 8.3
8.2 ADLINKTECH PCI-6308A board 420mA Interface
Configuration:
HKEY_LOCALC_MACHINE\Software\NIROnline\SX-Center\AO6308A [DWORD]
Channel A2 to A4:
Outputs current value scaled to range of
parameter. E.g. Moisture is measured
from 2 to 10% a value of 2% will output
4mA and a value of 10% will output
20mA.
Channel A5:
Status of current values where 4mA
signifies that all values are valid and
20mA signifies that one or more values
are out of calibration range or identified
as outliers5.
Channel A6:
Status of measurement where 4mA
signifies that sample is being measured
and 20mA signifies that sample is not
being measured, e.g. no product in-front
of the instrument.
Channel A7:
Status of instrument where 4mA signifies
that instrument is operating and 20mA
signifies a disturbance invalidating
measurement.
Note. All outputs are pertained and only
valid if A7 is 4mA. A0-A5 are valid if A6
is 4mA. A0-A4 is valid if A5 is low.
5
Outliers are identified by the applied
calibrations model and signify a
measured spectrum that poorly fits the
calibration spectrum data-base. If these
spectrums are proven correct they shall
be added to the calibration model to
provide valid estimates.
8.3 DataLab IOu/USB
Channel 1 & 2 are fixed for indication if
measurement is running or not. Output
one will change from 1 to 9V when
measurement starts, Channel 2 from 4 to
20mA.
8.3.1 Process output signal
You can output current results through
the DataLab IOμ. The field “Output” in
recipes define the output channel. The
output signal is proportional to the
current analysis value. The output current
range from 4mA to 20mA and is
automatically scaled to the calibration
range of the parameter. Example: A
protein calibration with a range of 10 to
20% would for a current value of 15%
output 12mA. For output of proportional value it is necessary to set field
“Control” to zero or empty.
The Field “Output” may be set to a
negative value; e.g. “-2” this results in the
output going “Low” if result is within
limits and “High” if outside limits.
33
8.3.2 Process Control
A signal from DataLab IOμ interface can
be used to control an admixing device for
a target value. You only need to
determine direction of control by setting
parameter „Control“ in the recipe. A 1
defines a system where the activation of
the admixer leads to an increased value. A
-1 defines a system where the activation
of the admixer leads to a decreased value.
The capacity of the admixer should be set
to a complete stop for 4mA and
maximum admixture behaviour for 20mA.
The output port is defined by field
„Output“. Channel is defined by absolute
value.
8.3.3 Process Alarm
Channel 8 (Default) will output a global
alarm! If any instrument is in an invalid
state or sample is missing or any
parameter is invalid or outside limits.
Channel may be changed using SX-Config
parameter “DAIO Alarm”. Setting this
parameter to “0” disables function.
8.3.4 Journal auto-sampler
A signal may used to control an autosampler when pressing the instrument
button or using the process-connection
to create a journal entry. Port is defined
by parameter “DAIO Journal” and Time
for taking the sample in parameter “DAIO
JournalTime”. These settings can be set
using SX-Config.
8.4 Communication format
Configuration and example settings:
HKEY_LOCAL_MACHINE\Software\NIROnline\SX-Center\
Key
RS485
TCP
UDP
SPS_Host [STRING]
“”
“”
“192.1.1.10”
Key
RS485
TCP
UDP
SPS_Port [DWORD]
3
10
10
Key
RS485
TCP
UDP
SPS_Settings [STRING]
4800,n,8,1
<not used>
<not used>
Key
RS485
TCP
UDP
>A1 [STRING]
50002011
50002011
50002011
Key
RS485
TCP
UDP
>A2 [STRING]
50002012
50002012
50002012
Each command and reply is formatted as
follows:
“>AACP…SS ”
> = Start character
AA = Address
C = Command
P… = Parameter value
SS = 2 character hex, 8-bit checksum of
string not including starting character
= ASCII code 13 end of line
Example: “>A1sE5 ” reply “A0060 ” or
“A0161 ”
34
8.5 Semantic
The following semantic should be used:
1. Alarm query– if not “A00” raise alarm
and repeat
2. Status query – If not “A01” repeat from
1
3. Values query
4. Settings query – if order changed
needed go to step 5, if product change
needed got to step 8 otherwise go to
step 1
5. Batch assign – If not “A00” raise alarm,
go to 1
6. Order assign – If not “A00” raise alarm,
go to 1
7. If not product change needed go to 1
8. Product assign – If not “A00” raise
alarm, go to 1
9. go to 1
Each command should have a timeout of
1 second except for the command Order
query “o” that should have a timeout of
15 seconds.
8.6.2 Status query
Status should always be requested prior
to values
Command: >??sSS
Reply:
A??
?? = 00 – No product
?? = 01 – Product and values
available
8.6.3 Values query
Read the current values, returns result for
up to seven parameters in a fixed
fractional format. E.g the value 1 is
represented by 0100, the value 12.5 is
represented by 1250
Command: >??bSS
Reply:
Aaaabbbbbbc1c1c2c2…
c7c70000000000000000SS ”
aaa = Product
bbbbbb = Order
c1c1 = first parameter value * 100
c2c2 = second parameter value * 100
0000000000000000 = fixed zero
values
8.6 Commands and their function
8.6.1 Alarm query
Alarms should always be requested prior
to status query
Command: >??aSS
Example: >A1aSS
Reply:
A??SS
?? = 00 – No alarms
?? <> 00 – Alarm
8.6.4 Tolerance query
Read the targets and tolerances currently
used
Command: >??jSS
Example: >A1jSS
Reply: At1t1t2t2…t7t7u11u22…u77SS
t1t1 = first parameter target-value *
100
t2t2 = second parameter target-value *
100
u11 = first parameter tolerance * 100
u22 = second parameter tolerance * 100
35
8.6.5
Batch assign
Used to create a new batch begin, an
optional ID may be assigned to the batch
Command: >??Z<id>SS
Reply: A00 - Batch was assigned
N00 - Batch assignment failed
8.6.6 Product assign
Used to assign a product to the currently
running batch, id is required any further
parameters are optional. Double
semicolons don’t change value.
Command:
>??P<id>;<parameter>;<target>;<tolerance>;
<bias>;<slope>;<min>;<max>SS
Example: >A0PExport
600;Moisture;14.9;0.0;0.0;1.0;0;0SS
>A0PExport
600;Protein;12.5;0.2;0.07;1.0;0;0SS
Reply:
A00 - Product and settings
were assigned
N00 - Product and/or
setting assignment failed
8.6.7 Order assign
Assigns an order to the currently running
batch. Assigning a new order will change
the order of the currently running batch
and create the report and results of the
previous processed order.
Command:
Example:
Reply:
N00
>??O<id>SS
>A0Oox123tSS
A00 - Order was assigned
- Order assignment failed
8.6.8
Journal assign
Creates a new / Change an existing
journal entry and fill in target property
values.
Command:
>??Q<id>;<parameter>;<value>;
<parameter>;<value>...SS8
Reply:
A<yyyymmddhhnnss>SS Journal was assigned (nn=minute)
N00 - Journal assignment failed,
e.g. invalid format
Example: >A1Q2007-12-14
001;Protein;12.4;Feuchte;13.9SS
A20071214083059??
Note. Entries created without
parameters, but with an ID are
available as predefined ID’s for
selection during sample analysis. A
second transfer to an existing ID with
target values will fill in values and
activate the entry for automatic
calibration. Values are transferred with
a dot “.” As decimal separator without
any unit of measure e.g. “%”
8.6.9 Batch query
Reads the content of the batch table, the
mask shall be sent on first query, to
repeat query for further records resend
the command without mask. The mask is
compared with the field ID of the
batchtable.
Command: >??z<mask>SS
Example: >A1z*SS
Reply:
A<id><result>SS
- result is formatted as values
query1
A00 - End of data
N00 - Error
36
8.6.10 Product query
Reads the content of the Recipe table,
the mask shall be sent on first query,
to repeat query for further records
resend the command without mask.
The mask is compared with the field
NAME of the Recipe-table.
8.6.12 Journal query
Reads the content of the journal table,
the mask shall be sent on first query, to
repeat query for further records resend
the command without mask. The mask is
compared with the field ID of the journal
table.
Command: >??p<mask>SS
Reply:
A<id>;<parameter>;<target>;<tolerance>;
<bias>;<slope>SS
A00 - End of data
N00 - Error
Command: >??q<mask>SS
Reply: A<id>;<result>SS
A00 - End of data
N00 - Error
8.6.11 Order query
Reads the content of the order table,
the mask shall be sent on first query,
to repeat query for further records
resend the command without mask.
The mask is compared with the field
NUMBER of the order-table.
Note. <result> is formatted as example
under point 8.6.8; If Target values are
missing the result is the NIR analysis
result. If the ID is missing it is replaced
by the system internal journal ID
defined by date and time as
yyyymmddhhnnss.
Command: >??o<mask>SS
Reply: A<id><result>SS - result is
formatted as values query2
A00 - End of data
N00 - Error
37
Sartorius AG
Weender Landstrasse 94-108
37075 Goettingen, Germany
Phone +49.551.308.0
Fax
+49.551.308.3289
www.sartorius.com
Copyright by Sartorius AG,
Goettingen, Germany.
All rights reserved. No part
of this publication may
be reprinted or translated in
any form or by any means
without the prior written
permission of Sartorius AG.
The status of the information,
specifications and illustrations
in this manual is indicated
by the date given below.
Sartorius AG reserves the
right to make changes to
the technology, features,
specifications and design
of the equipment without notice.
Status:
August 2009, Sartorius AG,
Goettingen, Germany
Printed in Germany on paper
that has been bleached without any use
of chlorine. W1A0OO - KT
Publication No.: WPM6070-e09082