1
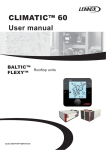
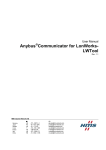
ME 402: How to Import Data from TracerDAQ/Strip Chart To MATLAB
Saving Data from TracerDAQ/Strip Chart
You will need to save the measurements made in the Strip Chart application to a file so that MATLAB can
read the values. To accomplish this follow these menus…
•
•
•
File->Save As
In the dialog box select an appropriate location and a name of the text file (e.g.,
“lab1_run1.csv”)
Also in the dialog box, under “Save as type” select “.csv” to save the file as a comma-separatedvalue (CSV) file.
Figure 1 shows an example of the file format for voltage data data (and time) as a text file from the Srip
Chart application. For more information, see page 28 of the TracerDAQ User’s Manual which describes
saving strip chart data to a file.
Header Size: 7
Version: 2
Sampling Interval: 0.01
Sampling Rate: 100
Sample Count: 1920
Device Serial Number: 0
Sample Number, Date/Time, CHANNEL0, Events
1,
01/10/2012 03:00:12.140 PM, 0.4190, DAQ Start
2,
01/10/2012 03:00:12.150 PM, 0.4182
3,
01/10/2012 03:00:12.160 PM, 0.4188
4,
01/10/2012 03:00:12.170 PM, 0.4179
5,
01/10/2012 03:00:12.180 PM, 0.4188
6,
01/10/2012 03:00:12.190 PM, 0.4190
Figure 1: Example of the first section of a text file exported from Logger Lite. Note the
header in formation and then two columns of measurements.
Option 1: Using MATLAB’s Import Tool Wizard
MATLAB has a fairly reliable import tool for dealing with text data. Follow these menus…
•
•
File->Import Data
In the dialog box select the text file with your data (e.g., “lab1_run1.txt”)
Now the Import Wizard will walk you through a bunch of options. For this simple data you should be
able to accept the defaults as shown in Figure 2
Figure 2: Screen capture from MATLAB’s Import Wizard. Note how the window on the right
shows the same data in Figure 1 above. The values will be stored in a Nx1 array.
Working with the Data
The voltage values are stored in a matrix assigned to the variable “data”, but you can change that in the
Import Wizard if you like. After completing the import you might rename the voltage data…
>
voltagevec = data(:,1);
% voltage data [V]
Only the voltage values will be important using this method. Because of the format of the time values,
MATLAB cannot import them directly. You can generate the relative measurement times using the
“Sampling Interval” listed in the header of the saved data text file. In this case the sampling interval is
0.01 seconds.
>
>
>
Ts = 0.01;
N = size(data,1);
timevec = Ts*(0:N-1);
% Sampling interval [sec]
% Number of samples in the data
% Time vector corresponding the data [sec]
Option 2: Using the importStripChartData Function
To automate this you can use a simple function. The importStripChartData.m file is available on the
course website and can be used to import data directly from the data file.
To use the importStripChartData function it must be in the same directory as the data file (or elsewhere
in your MATLAB path). The function has a short help documentation which can be accessed by typing
“help importStripChartData” at the MATLAB prompt.
In addition, a simple example is available on the course website to illustrate how to use the function to
import data.