1
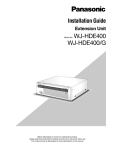
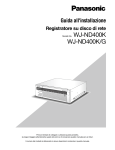
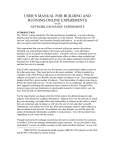
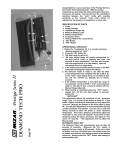
Life•line® Dongle
User Manual
RAID-M Chemical Agent Detector
Safe Environment Engineering
25061 Avenue Stanford, #30
Valencia, CA 91355
(661) 295-5500 • (661) 294-9246 Fax
www.safeenv.com • [email protected]
Table of Contents
1.0
Overview
2.0
Installation
2.1
Access Point Connection
2.2
Dongle Battery Installation
2.3
Mounting the Dongle to the RAID-M
2.4
Connecting the Communications Cable
3.0
Turning on the Dongle
4.0
Starting the RAID-M Monitoring Software
4.1
Monitoring Application Opening Screen
5.0
Getting Connected
6.0
RAID-M Meter Window
7.0
RAID-M Status
8.0
Library A and B
9.0
Substance 1 Through 5
10.0 Help
Appendix A Administration Setting and Logging
Appendix B Setting
Appendix C Logging
2
3
3
3
5
6
6
6
7
7
8
10
11
12
13
14
15
18
20
1.0 Overview:
Management of hazards such as the release of chemical, radiological or
biological agents requires timely information from sensors and detectors.
Viewing meter readings while wearing Level A protection suits and gloves can be
extremely cumbersome. The practice of transmitting readings by voice to incident
command centers can be subject to security risks. Automatic wireless
transmission of meter readings to incident command centers is a widely sought
solution to these problems.
The solutions offered by Safe Environment Engineering provide a one stop total
systems integration package for incident response agencies seeking the
capability to communicate sensor data gathered on-site to an individual in an
incident command center or anywhere in the world for that matter.
The Safe Environment Instrumentation Solution includes the following elements:
•
•
•
Wireless data transmitters that can be physically attached to a variety of
existing chemical, biological or radiological sensors.
Custom wired or infrared interconnections between the sensors and data
transmitters that allow the capture of readings that appear on meter
displays in a digital format.
A software suite that remotely receives wireless data and includes realtime meter displays, settings for visible and audible alarms and charting
components for visualizing trends.
The wireless software suite is built on a common operational platform (Microsoft
.NET) that can be readily customized to provide archival data storage, data
aggregation and data re-transmission. Sensor measurements can also be joined
with GPS positional information and posted on map displays.
2.0 Installation:
The RAID-M Monitoring application comes pre-installed with its own laptop
computer, access point, Dongle and long range antenna. This configuration was
designed to allow quick deployment and/or demonstration of the system’s
capabilities.
2.1 Access Point Connection:
The Lifeline Access Point uses the Strix brand modular access point for its
significant versatility in supporting future expansion and larger networks.
The access point is installed on a telescoping tripod to allow its multi-polarized
antenna to be raised to a manageable height to optimize the range of the system.
3
A ccess
Point
MultiPolarized
Antenna
U p t o 16 f eet
Tripod
The access point and multi-polarized antenna are mounted close together to
minimize antenna cable loss.
Power and Ethernet connectors must be firmly inserted into the access point as
shown below.
4
Ensure the Ethernet cable is connected to the computer and the computer is
turned on.
2.2 Dongle Battery Installation:
Remove the 4 screws that hold on the Dongle cover and insert 3 AA batteries.
Remove
cover
screws
Install 3 AA
batteries
5
2.3 Mounting the Dongle to the RAID-M:
The Dongle is strapped to the RAID-M by placing the Dongle beneath the RAIDM and wrapping the Velcro strap tightly around the body of the instrument.
Wrap Velcro tight
around body
Insert Velcro
tongue through
slot
Rotate
antenna
2.4 Connecting the Communications Cable:
Twist on the military cable connector.
Communication
cable connector
3.0 Turning on the Dongle:
Toggle the switch towards the antenna. If the access point is turned on and in
range the LED will turn on solid. A blinking LED indicates the Dongle is out of
communications range of the access point or the access point is not turned on.
6
•
•
•
4.0 Starting the RAID-M Monitoring Software:
On the desktop double click the RAID-M Monitor Icon.
4.1 Monitoring Application Opening Screen:
7
Solid LED indicates
communications LOCK
Flashing LED indicates
Dongle is LOOKing for
the Access Point
No lit LED indicates no
power or low batteries
Once the application is open, a series of tabs are displayed across the top of the
screen.
•
•
•
•
•
RAID-M Meter – Displays the real-time readings of all substances capable
of being displayed by the RAID-M. Any substance detected will activate
one or more Substance display boxes and the Agent Name, Concentration
and Units of measure will be displayed. Concurrently the Library box will
indicate what reference Library it is getting its values from.
RAID-M Status – Displays general information on the RAID-M’s
operational condition.
Library A – Reference Library for Nerve, Blister and Simulant agents
detected. This table cross references the number of bars displayed on the
RAID-M with the Agent detected and its concentration level.
Library B – Reference Library for Toxic Industrial Compounds and
associated Simulants. This table cross references the number of bars
displayed on the RAID-M with the Agent detected and its concentration
level.
Substance 1 Through 5 – Strip chart displaying the Agent’s
concentration over time.
5.0 Getting Connected:
Locate the Serial Number of the Dongle:
Select Open from the File menu:
8
Highlight the xml file with the same Serial Number as the Dongle:
Select Start from the Run menu:
To Stop Select Stop from the Run menu:
9
6.0 RAID-M Meter Window:
Mirror of
RAID-M
Display
No. Bars
Agent
Detected
Agent
Name
Concentration
µg/m3
Reference
Library for
ppm/ppb Value
Incident
Identification
Field
Audible Siren
Switch
Total Time
Sampling
Communications
Processing
Indicator
Status Bar
•
•
•
•
•
•
Connection
Indication
User
Identification
Field
Total Number
of Samples
Agent Detected – Abbreviation of the detected agent.
Agent Name – The complete agent name.
Audible Siren Switch –Turns audible siren on/off.
Status Bar – Text indicating different tasks the application is performing.
Common messages Include:
o Communications link has connected
o Connecting to 192.168.x.x on Port 8023
o Disconnected at HH:MM:SS AM/PM
o Failed to connect to the meter: Timeout
Communications Processing Indicator – This indicator has 3 states:
o
Grey – The application is idle
o
Green – The application is processing data from the meter
Red – The wireless link is disconnected and data is not
processing
Connection Indication – The communications globe has 2 states:
o
A wireless link has been established with the meter.
10
o
•
•
•
•
•
•
•
The wireless link with the meter is broken and the
application is attempting to re-establish.
User Identification Field – Field to type a user’s name and/or ID.
Total Number of Samples – The total samples taken from the meter
since the start of the current wireless link. If link is lost and re-established
this number will reset.
Total Time Sampling – How long active samples have been
accumulated.
Incident Identification Field – Field to type Incident name and/or ID.
Reference Library for ppm/ppb Value – Indicator to the viewer to
reference Tab Library A or B for equivalent Parts Per Million (ppm) or
Parts per Billion (ppb) concentration.
Concentration µg/m3 - Agent concentration value in micro-grams per
cubic meter.
Mirror of RAID-M Display No. Bars – Mirror image of the current bar
graph being displayed by the RAID-M
7.0 RAID-M Status:
The RAID-M Status window provides the viewer with key meter performance
data:
8.0 Library A and B:
11
The Library A and B tabs are reference areas for the viewer to translate the
number of display bars and µg/m3 concentration to Parts per Million (ppm) or
Parts per Billion (ppb) concentration levels.
9.0 Substance 1 Though 5:
12
Substance 1 though 5 tabs provide strip chart viewing of concentration levels for
the operational time that the application was acquiring samples:
Alarm
Threshold
Limit
Concentration
Scale
Concentration
Level
Time
Units
Time Interval
Window
Setting
•
•
•
•
Concentration Scale – The maximum resolution set between zero and
the High Limit alert limit (see Appendix A).
Concentration Level – The averaged concentration level measured in
µg/m3 for the given Interval Resolution.
Time Interval Window Setting – How many minutes of sample viewing is
displayed on the chart. This interval window can be set from 1 to 10
minutes.
Time Units – The time units shown for the sample window. Each hash
mark represents 5 seconds.
13
10.0 Help:
Application and contact information:
14
Appendix A
Administration Setting and Logging
Administration setting and logging functionality are hid behind 2 password
protected Tabs. The Settings Tab provides meter binding information and alarm
threshold configuration. Since these values typically do not need changing they
have been password protected to eliminate inadvertent change. Logging is also
provided to view statistical data and count information.
1.0 Password Generator:
The Password Generator is a date driven tool that will change daily to insure a
relatively high level of security and to eliminate the need for memorized lists.
The Password Generator application can be found in the c:\Program
Files\PwGenerator folder:
15
Double clicking on the PasswordGenerator icon will generate the password of the
day.
Please make note of the Password. In our example the password is ELSWWS
(the password is not case sensitive). The password will be necessary to unlock
the Administrative privileges of the application.
Enter the password into the Unlock Key and select OK:
16
The Admin window will activate 2 additional options - Setting Tab and Log Tab:
Selecting the Setting and/or Log Tabs will create 2 new Tabs under the main
window:
Settings Tab
Log Tab
17
Appendix B
Setting
The Setting window provides general network and alarm information for the
Dongle and connected meter:
Network
Communications
Port
Meter Display
Picture Button
Dongle Serial
Number or IP
Address
Alarm
Threshold
Values
Activate
Changes
Test Alarms
Not
Operational
Save
Setting
•
•
•
•
•
•
Dongle Serial Number or IP Address – The Serial Number on the
Dongle case. This is also the network address of the wireless radio in the
device.
Alarm Threshold Values – High and Low limits to trigger system alarms.
Most substances will only have a high limit. Low Limits are provided for
concentrations of substances below a desired level. Fore example Oxygen
has a Low Limit of 19.5 and a High Limit of 23.5.
Test Alarms Not Operational – This feature is not in operation.
Save Setting – All display data is saved to the current open xml file.
Configure – Activates all changed settings.
Network Communications Port – A network port that allows data to be
exchanged with the wireless device.
18
•
Meter Display Button – Picture representing the face of the meter
allowing the system administrator greater ease of setting up what
Substance alarm threshold goes in what location
19
Appendix C
Logging
Logging provides some statistical information to the viewer of the raw data
acquired by the application along with information on timing intervals of the data
messaging.
Raw
Data
Total
Number of
Samples
Minimum
Data
Exchange
Interval
Standard
Deviation
Error
Count
Average
Data
Exchange
Interval
Maximum
Data
Exchange
Interval
•
•
•
•
•
•
•
Total Number of Samples - The total samples taken from the meter since
the start of the current wireless link. If link is lost and re-established this
number will reset.
Min Interval – Minimum data exchange interval in milliseconds.
Avg Interval – Average data exchange interval in milliseconds.
Max Interval – Maximum data exchange interval in milliseconds.
Errors – Error count number.
Std. dev. – Standard deviation.
Raw Data – The raw data received by the application.
20